Abstract
Entity alignment is a critical technique for integrating diverse knowledge graphs. Although existing methods have achieved impressive success in traditional entity alignment, they may struggle to handle the complexities arising from interactions and dependencies in multi-modal knowledge. In this paper, a novel multi-modal entity alignment model called ERMF is proposed, which leverages distinct modal characteristics of entities to identify equivalent entities across different multi-modal knowledge graphs. The symmetry in cross-modal interactions and hierarchical feature fusion is a core design principle of our approach. Specifically, we first utilize different feature encoders to independently extract features from different modalities. Concurrently, visual features and nearest neighbor negative sampling methods are incorporated to design a vision-guided negative sample generation strategy based on contrastive learning, ensuring a symmetric balance between positive and negative samples and guiding the model to learn effective relationship embeddings. Subsequently, in the feature fusion stage, we propose a multi-layer feature fusion approach that incorporates cross-attention and cross-modal attention mechanisms with symmetric processing of intra- and inter-modal correlations, thereby obtaining multi-granularity features. Extensive experiments were conducted on two public datasets, namely FB15K-DB15K and FB15K-YAGO15K. With 20% aligned seeds, ERMF improves Hits@1 by 8.4% and 26%, and MRR by 6% and 19.2% compared to the best baseline. The symmetric architecture of our model ensures the robust and balanced utilization of multi-modal information, aligning with the principles of structural and functional symmetry in knowledge integration.
1. Introduction
Knowledge graphs represent factual knowledge using triples [1], where concepts are depicted as nodes and the relationships between them as edges. Prominent large-scale knowledge graphs, such as DBpedia [2], YAGO [3], and Freebase [4], have been extensively utilized in knowledge-driven applications, including intelligent question answering [5,6], information retrieval [7], and recommendation systems [8]. These applications have significantly advanced the practical deployment and development of artificial intelligence. In recent years, with the increasing multi-modal nature of data, multi-modal knowledge graphs (MMKGs) have emerged as a common method for organizing knowledge from both structured and unstructured sources. Nevertheless, it is common for large-scale MMKGs to be incomplete, which inevitably results in semantic gaps. Furthermore, the presence of redundant information across different knowledge graphs results in an inefficient use of storage resources.
To integrate complementary knowledge from two multi-modal knowledge graphs and enhance the utility and stability of multi-source heterogeneous knowledge graphs in downstream applications, researchers have introduced the concept of multi-modal entity alignment (MMEA) [9]. The objective of MMEA is to identify entities in disparate MMKGs that refer to the same tangible entities in the real world. This process relies on a large number of aligned seed entities to perform supervised learning, guiding the model to map different knowledge graphs into the same semantic embedding space [10]. The model then calculates the similarity of entity embeddings that incorporate features from multiple modalities to determine the alignment results. An example of MMKG entity alignment is shown in Figure 1.
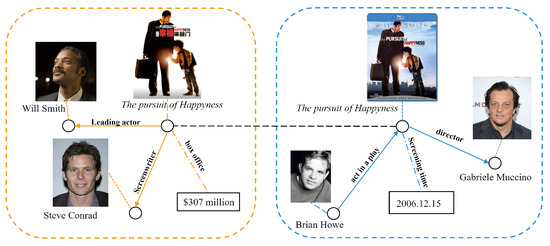
Figure 1.
Example of multi-modal entity alignment.
Previous studies have shown that incorporating visual knowledge can significantly enhance the performance of MMEA. For instance, EVA [10] addresses the issue of matching long-tail entities through unsupervised training that leverages the visual similarity of entities. MSNEA [11] effectively integrates cross-modal effects by using visual knowledge to guide the learning of relations and attributes and employs contrastive learning methods to achieve robust multi-modal alignment performance. However, due to the heterogeneity and limited coverage of MMKGs, it is challenging to learn rich entity representations. Previous models, such as PoE [12] and MMEA [9], obtain entity embeddings through knowledge representation learning and then calculate the similarity between these embeddings using simple concatenation. These models fail to capture the interactions between modalities during training, leading to the suboptimal utilization of modal resources. Recent methods, like MEAformer [13] and MCLEA [14], employ bag-of-words features to learn relation embeddings. However, these approaches have limitations: (1) The bag-of-words method typically represents relationships as simple aggregated feature vectors, which can result in information loss. (2) It struggles to capture complex associations and deep semantic information between relationships, leading to lower-quality relation embeddings.
To address the aforementioned issues, a novel MMEA method is proposed to integrate different multi-modal knowledge graphs. Our work leverages the symmetry in cross-modal interactions and hierarchical feature fusion by designing a symmetric architecture that balances modality importance and interactions; this approach combines visual, relational, attribute, and structural information through a multi-layer fusion network to generate enriched multi-modal fusion features. Specifically, a model called Enhanced Representation for Multi-modal Fusion (ERMF) is introduced. This model first learns representations of entities’ visual, structural, and textual features. A negative sample generation strategy guided by visual features is proposed. Based on TransE, this strategy employs visual features to filter negative sample entities, thereby enhancing relational embeddings.
Moreover, a multi-level feature fusion strategy is proposed to hierarchically extract modality features from a multi-granularity perspective to obtain holistic representations of entities. Specifically, at the lower level, adaptive fusion is employed to capture the significance of modality embeddings, assigning higher weights to modalities with critical semantic information, followed by weighted concatenation to derive coarse-grained multi-modal fusion features. Subsequently, at the intermediate layer, self-attention mechanisms are utilized to capture intra-modality correlations, while cross-attention mechanisms and bidirectional cross-modal attention mechanisms are employed to model the interactions across modalities, resulting in fine-grained feature representations of entities. Finally, the top layer integrates the outputs from the lower and intermediate layers through weighted fusion, achieving multi-granularity extraction of entity modality features. The contributions of this work are as follows:
- We propose a vision-guided negative sample generation module that combines nearest neighbor negative sampling and contrastive learning methods. This module generates entities that are somewhat related to the positive samples, enhancing the ability to learn relationship representations.
- We propose a multi-level feature fusion strategy, incorporating a soft attention mechanism to adaptively capture the importance weights of modalities. Additionally, cross-attention and bidirectional cross-modal fusion methods are introduced to aggregate multi-granularity representations of entity modalities across three hierarchical levels.
- We conducted extensive experiments on several existing public datasets. The overall results demonstrate that our model, ERMF, achieves state-of-the-art performance among baseline models, proving the effectiveness of our approach.
2. Related Work
2.1. Multi-Modal Knowledge Graphs
Multi-modal knowledge graphs enhance traditional knowledge graphs by incorporating additional modalities such as visual and audio data, providing richer semantic representations of entities. In recent years, many researchers have focused on the construction and application of MMKGs. In terms of MMKG construction, Wang et al. [15] linked a large number of images to text entities in Wikidata, creating a comprehensive multi-modal knowledge graph called Richpedia. Similarly, MMKG [12] used images and numerical features to build a multi-modal knowledge graph, which was then used to evaluate the performance of link prediction and multi-modal entity alignment tasks. Regarding MMKG applications, VTKB [16] integrated visual information into traditional knowledge bases and proposed a novel image tagging framework that effectively resolves concept ambiguities and associates them with images. Huang et al. [17] applied MMKGs to the medical field using multi-modal pre-training models and medical multi-modal information, enhancing the performance of medical diagnosis. MONDAL et al. [18] introduced MMKGs into movie recommendation systems to address the cold start problem associated with dependency on rating information. However, the increased richness of information also poses challenges for knowledge graph embedding. Unlike traditional knowledge embedding methods, MMKG embedding must extract features from text and structural modalities and model complex visual and audio modalities, significantly increasing the complexity of knowledge representation learning.
2.2. Multi-Modal Knowledge Graph Embedding
Multi-modal knowledge graph embedding aims to utilize representation learning methods to map different modality features into the same semantic space, reducing the distribution gap between modal information while maintaining semantic integrity. Studies [19,20] have demonstrated that rich semantic knowledge obtained from entity attributes such as texts and images can effectively guide triplet classification and knowledge completion tasks. The translation-based embedding model TransE [21] interprets relationships as translation operations between head and tail entities. This model reveals that entities with similar neighbors should have similar representations in the embedding space. However, this model cannot handle complex relationship embeddings, leading researchers to extend the TransE model to derive models like TransH [22] and TransR, further enhancing the quality of knowledge representation learning. Wang et al. [20] proposed the TransAE model, a flexible and scalable extension of TransE. This model employs a modal autoencoder to simultaneously learn structured and multi-modal representations of entities. Lu et al. [23] introduced a joint learning framework that employs TransE, VGG, and Word2Vec to learn representations of relationships, images, and texts separately. While the aforementioned models have demonstrated promising results in knowledge graph embedding, they are designed for single-knowledge-graph scenarios and do not consider the correlation and interaction between entity embeddings in different knowledge graphs.
2.3. Multi-Modal Entity Alignment
To identify the relationships and equivalent entities between different MMKGs, Cheng et al. [24] proposed using an attention-based multi-modal fusion network that dynamically assigns weights to different modalities and jointly embeds them. They then use a late fusion method to integrate entity similarity matrices from different MMKGs, determining the entity alignment results. Zhu et al. [25] proposed a bidirectional multi-modal knowledge fusion module that uses early fusion and late fusion techniques to capture correlation and complementary information between modalities, achieving good entity alignment performance. To enhance the representation of the visual modality, groundbreaking PoE [26] combines multi-modal features to match entity-level semantics for factual credibility measurements. MMEA [9] further integrates relational, visual, and numerical modalities to build joint entity representations. EVA [10] entity alignment in supervised and unsupervised scenarios via visual knowledge and auxiliary information has been conducted. Masked-MMEA [27] uses selective masking to filter visual noise and optimize alignment. Xu et al. [28] proposed XGEA, a cross-modal graph attention network that incorporates visual knowledge into traditional graph attention networks. It calculates attention weights across modalities through interactions and introduces a soft pseudo-labeling method for entity alignment, generating pseudo-aligned pairs using visual and semantic information to reduce noise during model training. TMEA [29] addresses the diversity of attribute descriptions via alignment-enhanced abstract representations. It deploys a variational autoencoder (VAE) to generate pseudo-visual features, compensating for missing visual data. Moreover, it designs orthogonally constrained cross-attention to strengthen weak visual text/relational correlations, effectively resolving three types of uncertain correspondences involving the visual modality in multi-modal entity alignment. MIMEA [30] constructs a multi-granular inter-modal interaction framework using probability guided fusion and optimal transport based alignment to enable cross-modal interactions between a single visual modality and joint modalities. Additionally, it introduces modality-adaptive contrastive learning to distinguish equivalent entities via their visual semantic embeddings, improving alignment accuracy while reducing computational costs. PCMEA [31] designs a semi-supervised framework; first, it filters visual-specific noise via mutual information maximization. Second, it refines visual semantic pseudo-labels through calibration and uses momentum contrastive learning to align embeddings of visually and semantically matched entities, enhancing semi-supervised robustness.
Despite enhancing representation with visual modalities, existing methods have limitations: (1) These methods predominantly employ semi-supervised training, where the generation of negative samples introduces noise, hindering the model’s ability to accurately capture relationships between entities and leading to erroneous alignment outcomes. (2) They rely on static attention without dynamic modality selection. In this study, a novel multi-modal entity alignment method is explored to address these limitations. This approach proposes a visual-guided negative sample generation module. It strengthens visual modality constraints on relation representation through contrastive learning and neighbor sampling and builds a multi-level feature fusion strategy. Using soft attention, it adaptively captures modality importance weights for multi-granularity cross-modal feature interaction.
3. Our Approach
3.1. Problem Definition
We formalize the multi-modal entity alignment task as follows. A multi-modal knowledge graph can be represented as , where and V denote the set of entities, relations, attributes, and images, respectively, X denotes the set of relation triples, Y denotes the set of entity–image pairs, and Z represents the attribute-value triples. MMKGs store the structured representation of entities in the form of triples, integrating relationships between entities and their neighboring nodes. The embeddings of relations, attributes, and images are denoted as and , respectively. The goal of MMEA is to identify potential equivalent entity pairs from two given multi-modal knowledge graphs, namely and . This can be formally expressed as , where P represents the alignment seeds and the symbol ≡ denotes equivalence. We conduct a supervised learning task aimed at finding more equivalent entities based on these alignment seeds.
3.2. Overview
We propose a multi-modal entity alignment framework, ERMF, with its overall architecture illustrated in Figure 2. In this architecture, represents the visual features mapped through a fully-connected layer, denotes the self-attention fused feature matrix, refers to the cross-modal attention mechanism, and corresponds to the bottom-layer embedding matrix. ERMF consists of three primary modules: (1) a multi-modal knowledge embedding module, designed to learn embeddings for relations, attributes, images, and structural information and further process these multi-modal features into a uniform dimension through fully connected (FC) layers; (2) a vision-guided negative sample generation module, which generates negative sample entities based on visual similarity to mitigate noise during training and enhance relational representations; and (3) a multi-layer feature fusion module, which hierarchically processes modality features using soft attention, cross-attention, and bidirectional cross-modal attention mechanisms. This module captures cross-modal interactions and relationships at multiple granularity levels, effectively addressing the challenge of modality heterogeneity. The key components of the framework, along with the employed techniques and associated algorithms, will be detailed in the following sections.
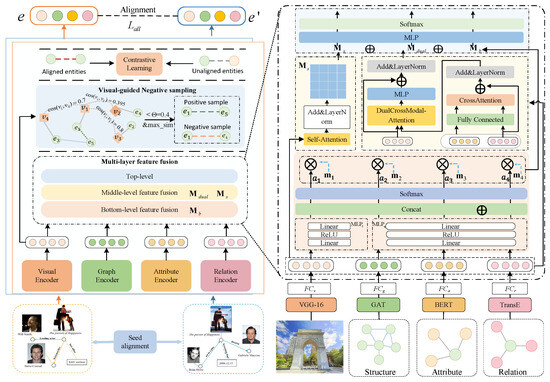
Figure 2.
ERMF framework.
3.3. Multi-Modal Knowledge Embedding
The employed modalities include visual, structural, relational, and attribute data, where attribute values are numerical. Relations and attributes are collectively termed the textual modality [9,32]. In this section, the representation learning methods for each modality are introduced to ultimately obtain feature representation vectors for all modalities.
3.3.1. Structure Embedding
We use a two-layer graph attention network (GAT) [33] for structural embedding. The GAT represents an advancement over traditional graph convolutional networks (GCNs), which are unable to consider the relative importance of neighboring nodes. It uses a multi-head attention mechanism to focus on different neighborhood structures, thus capturing the global features of the graph. The hidden state of a single entity is aggregated from its one-hop neighbors with self-loops, which can be formulated using Equation (1):
where represents the hidden state of the neighbor node , with , where d is the hidden dimension. The term denotes the importance of entity relative to . The calculation formula follows Equations (2) and (3):
where denotes the LeakyReLU activation function, is a learnable parameter, and is a shared weight matrix. To simplify calculations, the settings of [34] are followed, and is constrained to be a diagonal matrix. The symbol ⨁ represents the concatenation operation, and denotes the attention coefficient between entity node and its neighbor node . The results of these operations are concatenated to obtain the structural embedding feature for .
where K represents the number of attention heads, which is set to 2, and is the normalized attention coefficient for the k-th attention mechanism. For the graph structure embedding, a margin-based contrastive loss function is used, as shown in Equation (5).
where N denotes the number of training samples, represents the similarity score between samples, is the index of randomly selected negative samples, and is a customization constant.
3.3.2. Attribute Embedding
Attribute triplets consist of an entity’s name and its numerical value. Following the approach proposed by Chen et al. [13], numerical triplets are expanded through the replacement of entities involved in alignment triplets. Specifically, given an attribute triplet where a and v represent the attribute and its value, respectively, if , then is also added to Z to complete the extension to Z. We utilize numerical triplets extracted by Liu et al. [12] for model training. According to [13,25], directly modeling attribute embeddings using graph neural networks may lead to information contamination due to noise from neighboring entities. Therefore, for each attribute , where w denotes a word sequence and k denotes the number of words in the attribute name, the BERT model is employed to embed entity attribute names.
where denotes the fully connected layer and denotes the parameter matrix. The sigmoid function is used to normalize the numerical values, and the repeat operation is applied to expand these values to obtain the numerical embedding , matching the dimension of the attribute name embedding. Finally, the attribute name embedding and the numerical embedding are concatenated to obtain the attribute embedding. This process is formulated using Equation (7):
We use the FC layer to project attribute features to a low-dimensional space.
3.3.3. Image Embedding
Convolutional neural networks (CNNs) [35,36] have achieved great success in capturing image pixel-level features. Increasingly, pre-trained CNN-based image feature extraction models are being transferred to tasks such as image classification and knowledge representation learning, aiding downstream applications in achieving high performance. Therefore, as shown in "Visual Encoder" in Figure 2, the pre-trained deep convolutional neural network VGG-16 [37] is used as the visual feature extractor. Image embedding vectors are obtained by removing the last two layers of VGG-16. These vectors are then mapped to a lower-dimensional space using an FC layer to match the dimensions of other modality embeddings, as defined in Equation (8):
3.3.4. Relation Embedding
We use TransE for relationship embedding. Based on the assumption that the sum of the embeddings of the head entity and the relationship approximates the embedding of the tail entity, the entities and relationships in a given triple are embedded into the same continuous vector space, ensuring that . Entities with shared neighbors typically have similar relationship types, which means that they are closer in the embedding space and have more similar vector representations. We define the score function using Equation (9):
where , , and represent the vectors of h, r, and t embedded by TransE and denotes the L2 norm. The loss function for learning the relational embedding is defined in Equation (10):
where and are the sets of positive and negative examples, respectively, and is the margin hyperparameter. Since aligned entities share the same relationship facts, swapping two aligned entities does not change the semantic relationship of the triple. Therefore, for a given triple , a similar swapping strategy is adopted as with attribute triples. If , then is also added to X, ensuring that aligned entities have closer representations in the low-dimensional space. After that, a vision-guided negative sampling strategy is used to generate the set of negative examples.
3.3.5. Visual-Guided Negative Sampling
Current research mostly adopts a strategy of randomly replacing head and tail entities to generate negative samples. However, this method may lead to weak semantic associations between the generated negative samples and the original positive samples, potentially resulting in low-quality negative samples lacking semantic rationality. To enhance the association between entities and retain more semantic information, a vision-guided negative sample generation strategy is proposed.
Specifically, the visual similarity between each entity pair is first calculated to form a visual similarity matrix , where n represents the number of entities. Subsequently, based on the similarity values, each entity is matched with its most similar counterpart, forming visually similar entity pairs where . Finally, a threshold is established according to the distribution of similarity values. Entities pairs with similarity values greater than the threshold are considered similar, while those with values less than the threshold are considered dissimilar. The formula for calculating the similarity matrix is given by Equation (11):
where denotes the visual feature matrix containing all entities.
It is worth noting that when generating negative samples, we should preferentially select dissimilar entities. Selecting similar entities can hinder the model’s ability to effectively discriminate between positive and negative samples, potentially leading to erroneous judgments of negative samples as factual triples. Additionally, this approach serves two purposes: (1) maintaining the correlation between negative and positive samples to prevent the generation of excessive noise data and (2) enhancing the model’s ability to learn entity correlations. This is because if the entities in negative samples are entirely dissimilar to those in positive samples, the model may overly rely on this simplistic discriminative feature, neglecting other, more complex semantic information, thereby resulting in a decrease in model performance.
As shown in Figure 3, the left panel shows factual positive triples, and the right panel presents non-factual negative triples. Negative samples generated by random head/tail entity replacement are marked in red—both factually incorrect and semantically distinct from positive triples. By contrast, vision-guided negative sampling generates green-marked negatives, which, though non-factual, exhibit discernible semantic relevance to positive counterparts. The positive sample entities (Hawaii, Politician, and Michelle Obama) and the negative sample entities (Atlantis, Fruit, and Laptop) are almost completely dissimilar, and the triples containing the negative sample entities are semantically unreasonable in reality. This may cause the model to distinguish negative samples based on the entity type or name alone, incorrectly determining that any target entity with a Fruit as a relation should be a negative sample. However, if new negative samples that are similar to the positive sample entity appear, such as (Barack Obama, bornIn, and Chicago) or (Barack Obama, isA, and Lawyer), the model may struggle to discriminate effectively. In fact, while the triples (Barack Obama, bornIn, and Chicago), (Barack Obama, isA, and Lawyer), and (Barack Obama, marriedTo, and Oprah Winfrey) are factually incorrect, they share some semantic, identity, and relational relevance.
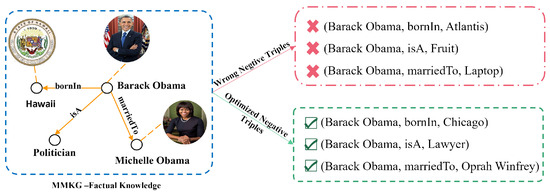
Figure 3.
Negative triple comparison.
Therefore, parts that are less than the threshold are focused on. The replacement strategy is to first select entities that are dissimilar to the current entity but have the similarity closest to the threshold as the entities to be replaced. Then, whether to replace the head entity or the tail entity is determined according to the binomial distribution. For entities without visual features, the principle of nearest neighbor negative sampling is adopted.
Specifically, for positive sample triples, weighted concatenation is first performed on the graph structure embedding and the attribute embedding ; then we use the cosine distance to calculate the similarity between the joint embeddings. The five entity nodes that are most similar to the current entity are selected. Next, a replacement node is randomly chosen from this range, and the binomial distribution is used to generate negative sample triples. The scoring function is shown in Equation (12).
In the formula, p represents the positive sample triples, is the distance margin used to constrain the distance difference between positive and negative samples, and and , respectively, represent the replaced head entity and tail entity. The specific process of negative sample generation is shown in Algorithm 1 as follows.
- The strategy of Algorithm 1 prioritizes selecting entities with visual similarity close to but below the threshold as negative samples. This ensures a certain relevance between the negative and positive samples, avoiding completely irrelevant noise. The logic is implemented in Steps 6–7:
- –
- If : Replace current_ent with entities that are visually dissimilar but semantically related (e.g., entities with similarity near ) to enhance relational embedding learning.
- –
- Otherwise (): Apply nearest neighbor negative sampling (Steps 9–10): ∘: Select the top-5 entities from entities_list with the highest cosine similarity to entities_list in the joint embedding space (structure + attributes), then randomly replace one of them. This ensures semantic rationality of negative samples.
- The generated negative triples are added to the set, and the loop terminates early if the target neg_triples_num is reached (Steps 12–15). Finally, the negative triples for the current triple are merged into the final neg_batch (Step 16).
| Algorithm 1 generate_neg_triples_visual_guided () |
| Input: pos_batch,all_triples_set,entities_list,entity_similar_dic,neg_triples_num Output: List of negative triples
|
3.4. Multi-Modal Features Fusion
Existing methods often assign equal attention to each modality, whereas in reality, different modalities contribute differently to the task of entity alignment. Therefore, to distinguish the importance of different modalities and their interactions, a multi-layer feature fusion approach is proposed; our multi-layer fusion strategy introduces symmetric mechanisms for intra- and inter-modal processing. The objective of this approach is to consider different modalities from various perspectives and to fuse them effectively such that richer and more representative feature representations are generated. This is depicted by the “Multi-Layer feature fusion” module in Figure 2. Specifically, the multi-layer fusion module is divided into three levels. Each level models the multi-modal features from three perspectives, namely the importance of modalities, their own relevance, and the interaction between modalities, in order to achieve the efficient fusion of multi-modal data. The specific explanations are as follows:
- 1.
- Bottom-layer Fusion: Modeling the Importance of Modalities.
In this layer, a soft attention mechanism named St-attention is designed, ensuring symmetric consideration of each modality’s contribution through adaptive weight assignment. This mechanism encodes the input features of each modality through a multi-Layer perceptron (MLP) to generate the query vector (Query) and key vector (Key) for each modality and adaptively updates the modality weights through backpropagation to dynamically adjust the importance of different modalities, thereby enhancing the model’s attention to each modality. The specific process is defined in Equation (13):
Among them, m represents the input feature; ={r, a, v, g}; and are the query and key representations of the modality, respectively. Subsequently, the attention scores are calculated through the dot product and normalized to obtain the attention weights, as shown in Equation (14):
Finally, the different modalities are weighted by using the attention weights to obtain the bottom-layer embedding matrix , as shown in Equation (15)
Among them, ⊕ denotes the concatenation operation, while indicates the quantity of modalities. By means of this approach, the bottom-layer fusion is capable of effectively and dynamically modulating the model’s focus on the significance of each modality.
- 2.
- Middle-layer Fusion: Modeling within Modalities and Interaction.
The middle-layer fusion is divided into two stages: modeling intra-modal correlation and modeling inter-modal interaction.
- (1)
- Modeling Intra-modal Interaction
Firstly, the self-attention mechanism is utilized to model the internal correlation of the input multi-modal features in order to capture the long-range dependencies within a single modality. The shared matrices , , and are used to parameterize each modality, and the formulas are defined in Equation (16):
Then, the intra-modal attention weights are calculated, and the value is weighted and summed, as shown in Equation (17):
where represents the correlation matrix.
- (2)
- Modeling Inter-modal Interaction
The dual cross-modal attention mechanism is defined as a process that leverages two layers of cross-modal interaction attention operations to progressively explore the deep interactive correlations between image and text modalities (as illustrated in Figure 1). Specifically, the first-layer cross-modal attention mechanism generates the interaction matrix by fusing relational and attribute modalities; the second-layer attention mechanism then feeds (derived from the first layer) and the image modality feature into the dual cross-modal attention mechanism, thereby obtaining the cross-modal fused feature . First, normalization operations are performed on and , as shown in Equation (18):
Then we calculate the bidirectional attention between the text modality and the image modality , as defined in Equations (19) and (20):
The cross-modal fusion feature is obtained through residual connection and concatenation operation, as shown in Equation (21):
where represents the cross-modal attention and is a learnable weight. We first concatenate the attributes and relations. On the one hand, although attributes and relations describe objects at different levels, they usually have complementary information when describing facts, and neither can be lacking. In addition, in the multi-modal scenario, attributes and relations usually appear collaboratively, and the concatenation operation can directly capture their implicit correlations. On the other hand, concatenating relations and attributes to form the text modality essentially integrates two different modal information types into a comprehensive text representation, which can improve the richness and diversity of information to a certain extent. Then we apply the interaction method of learning the attention weights of the image modality from the text modality to better capture the correlation and semantic information between modalities. Through this way, the middle-layer fusion can effectively capture the long-range dependencies within modalities and the interaction relationships between modalities.
- 3.
- Top-layer Fusion: Feature Integration and Optimization
Top-layer fusion is mainly used to integrate the fusion results of the bottom layer and the middle layer to generate the final entity embedding representation. Firstly, the normalization operation is performed on the output matrix of the bottom layer and the output matrices and of the middle layer to ensure the consistency and stability of the features. Then, a weighted residual fusion strategy is designed to retain the original information of the entity embedding features to the greatest extent, thereby obtaining the final embedding representation of the entity, as shown in Equation (22):
where represents the normalization operation, , both of which are learnable parameters. We use a weighted network to enable their automatic update.
This embedding integrates the importance, relevance, and interaction relationships of modalities. The weighted residual fusion (Equation (22)) maintains symmetry between coarse-grained and fine-grained features, preserving the integrity of multi-level representations. Through the fusion operations at the above levels, the feature information at different levels can be fully utilized to achieve efficient multi-modal data fusion. The proposed multi-layer fusion algorithm is shown in Algorithm 2:
| Algorithm 2 Multi_Layer_feature_fusion () |
| Input: : Embedding vectors for each modal Output: final entity embeddings
|
4. Optimization Objective
We employ a contrastive learning strategy to optimize the model output. The overall loss function of the model is designed using Equations (24) and (25):
where is the label of the entity pairs, with aligned pairs assigned a value of 1 and unaligned pairs assigned a value of 0. is the margin hyperparameter; d represents the cosine similarity between entities from two different knowledge graphs, and , and S denotes the smoothing L1 loss. We apply the same contrastive loss function to different modalities to retain specific alignment information between modalities [11]. We define the overall contrastive loss for single-modal embeddings using Equation (26):
where , and represent the sets of uni-modal representations for the graph structure, image, relationship, and attribute in , respectively, and , and represent the sets of uni-modal representations for the graph structure, image, relationship, and attribute in , respectively. Finally, the training objective function of the model is defined using Equation (27):
During training, the model parameters are updated through backpropagation, with the Adam optimizer being utilized to optimize all the aforementioned loss functions.
5. Experiments
This section details the experimental parameter settings, including the employed datasets, evaluation metrics, and comparison models. Subsequently, comparative and ablation experiments are conducted to demonstrate the effectiveness of the proposed ERMF model.
5.1. Experimental Setup
Datasets: We conduct experiments using two public datasets: FB15K-DB15K and FB15K-YAGO15K. FB15K, DB15K, and YAGO15K are representative subsets extracted from the Freebase, DBpedia, and YAGO knowledge bases, respectively, and are the most widely used datasets in MMEA tasks. The detailed information of the datasets is shown in Table 1.

Table 1.
Statistics of multi-modal knowledge graph datasets.
Evaluation Metrics: The performance of all models is evaluated using Hits@n (n = 1, 5, and 10) and MRR. Hits@n represents the percentage of the top-n ranked list, based on cosine similarity, that contains the correct aligned entities. MRR represents the mean reciprocal rank of the correct aligned entities. Higher values for Hits@n and MRR indicate superior model performance.
Baselines: We conduct comparative experiments between our proposed ERMF model and 12 state-of-the-art multi-modal entity alignment models. The baseline models are briefly described as shown in Table 2.
Table 2.
Comparison of multi-modal entity alignment methods.
Implementation Details: We use pre-trained bert-base-uncased to obtain text feature embeddings. The number of dimensions of hidden layers in the GAT is set to 200, with two attention heads. All modality embeddings are unified to 200 dimensions. The batch size is set to 10,000, with 1000 epochs, and a learning rate of 0.001. For a fair comparison, different models were evaluated with 20%, 50%, and 80% alignment seeds. Results for all baseline models were obtained from either the original paper or reproductions using publicly available code. The experiments were conducted using PyTorch 1.15 and Python 3.8.
5.2. Main Results
5.2.1. Comparison Experiments
To verify the effectiveness of the proposed ERMF model, comparative experiments with baseline models were conducted. Our experiments were conducted under supervised conditions. Table 3 presents the performance comparison of the models on FB15K-DB15K and FB15K-YAGO15K using different proportions of aligned seeds. The best values among the baseline models are underlined, and the best results are highlighted in bold.
Table 3.
Performance of the model on FB15K-DB15K and FB15K-YAGO15K with different scaled alignment seeds. The reported results of ERMF are the average values of multiple repeated experiments; when referring to the results of ERMF hereinafter, this average value shall be used.
Overall, our model ERMF outperforms baseline models on most evaluation metrics, demonstrating its robustness across different proportions of aligned seeds used as training sets. On two datasets, with 20% aligned seeds, ERMF improves Hits@1 by 8.4% and 26% and MRR by 6% and 19.2% compared to the best baseline. When using the FB15K-DB15K dataset, compared to the classic models EVA and MMEA, ERMF improved Hits@1 and MRR by at least 56% and 54.8%, respectively. This is because these models do not comprehensively consider visual, relational, attribute, and graph structure modalities. MMEA, in particular, overlooks the graph structure information that significantly impacts entity semantics, leading to insufficient semantic utilization. Although EVA considers graph structure modeling, it only uses GCNs, which cannot extract deep structural information. Compared to MultiJAF, MSNEA, and MCLEA, ERMF achieves at least a 53.2% improvement in Hits@1 and around a 39.7% improvement in MRR on both datasets. This is because MultiJAF, MSNEA, and MCLEA perform feature fusion through simple weighted concatenation, neglecting interactions and importance weights between different modalities. Our model introduces improvements in the feature fusion strategy, extracting multi-granular features hierarchically and considering inter-modal correlations and complementarities. Specifically, compared to MSNEA, ERMF achieves 37.4% and 34.4% improvements in MRR. This is because MSNEA uses a random replacement strategy for negative sample generation in the relationship embedding part, ignoring the correlation with positive samples, which prevents the model from effectively capturing dependencies between modalities. Our model effectively mitigates this issue.
Furthermore, as the proportion of aligned seeds increases, ERMF demonstrates consistent enhancements in MRR and Hits@n (n = 1 and 10) values on both datasets, outperforming other models. This indicates that aligned seeds can provide more multi-modal information, further demonstrating the effectiveness of our model.
5.2.2. Ablation Experiments
To validate the effectiveness of each component of the model, two variants were designed, and ablation experiments were conducted on two datasets using 20% aligned seeds. The first variant tests the contribution of each modality, and w/o s, w/o r, w/o i, and w/o n represent the removal of structural, relational, image, and numerical modalities, respectively. The second variant evaluates the fusion strategy and the accuracy of negative sample generation, and w/o st-att, w/o cr-att, w/o mlf, and w/o vgns represent the removal of st-attention, cross-modal fusion attention, multi-layer fusion module, and the vision-guided negative sampling mechanism, respectively. The experimental results are shown in Figure 4.
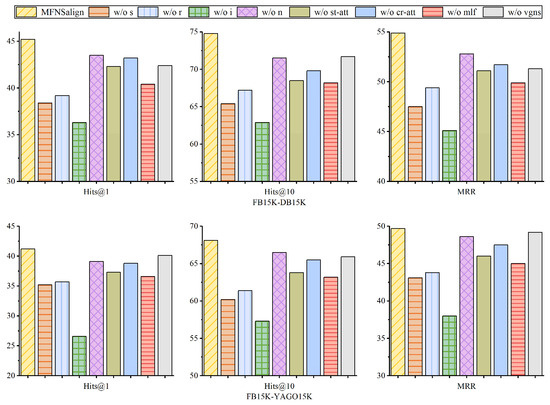
Figure 4.
Ablation study on two public datasets.
The results show that performance drops significantly when w/o s and w/o i are used because structure and image modalities typically provide rich semantic information about entities. As shown in Table 1, the image coverage rate of the DB15K dataset is significantly higher than that of YAGO15K (with a difference of approximately 27%). This discrepancy leads to FB15K-DB15K exhibiting stronger dependency on the visual modality compared to FB15K-YAGO15K. Ablation studies demonstrate that removing either the visual modality features or the vision-guided negative sampling mechanism notably degrades the model’s performance. The structure modality reflects hierarchical structures and relationships between entities, while the image modality usually contains detailed descriptions related to the entities, such as the color and the relative position. Removing these two modalities results in a significant loss of contextual information. When st-att is removed, the model assigns equal weight to each modality, failing to effectively capture the relative importance and differences among the modalities and leading to performance fluctuations. When cr-att is removed, the model may ignore the complementarity and correlation between the text and image modalities, reducing its expressive power. When mlf is removed, using simple concatenation to fuse modality features, the model’s MRR drops by about 5%, indicating that the model fails to learn the interactions and relative importance between modalities, thus not effectively utilizing the different modality information. Without vgns, the model uses TransE to learn relationship embeddings. Although the final performance is better than removing the relational modality altogether, the model still fails to effectively capture the sample differences introduced by entity heterogeneity. This results in greater independence between the positive and negative samples, introducing noise into the relationship embedding process and reducing the quality of negative samples and relationship embeddings.
5.2.3. Parametric Analysis
We conducted parameter analysis experiments to investigate the influence of the regularization coefficient , the contrastive loss threshold , and the visual similarity threshold on model performance. Figure 5 illustrates the performance variations of the model on FB15K-YAGO15K with different values. When is set to 0.0001, Hits@1, Hits@10, and MRR values all reach their peaks. Subsequently, as increases, the model may experience overfitting, resulting in a decrease in performance. This outcome suggests that our model tends to retain general features under conditions of low fitting to training data, thereby enhancing its robustness when confronted with new data.
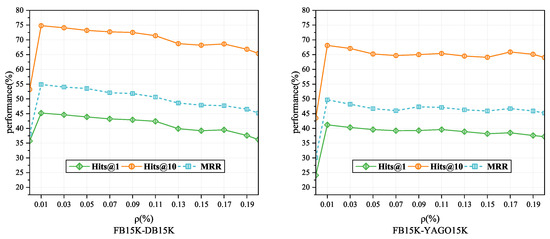
Figure 5.
Impact of the regularization factor on performance: Performance variations of the model on the FB15K-DB15K and FB15K-YAGO15K datasets with different regularization factor values.
Figure 6 illustrates the impact of custom threshold values for contrastive loss on performance. A smaller may be more suitable for handling cases where data is densely distributed in the feature space, while a larger may be more appropriate for sparser scenarios. For both datasets, the model achieves the highest performance when is set to 2 and 1.5 respectively, indicating the best fit to the data distribution characteristics.
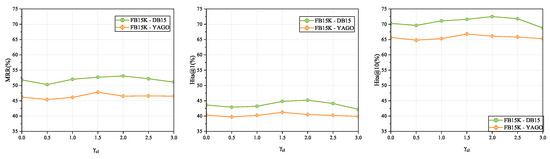
Figure 6.
Loss threshold impact on performance.
Table 4 illustrates the impact of the visual similarity threshold on model performance. When is less than 0.5, the overall model performance is better, with the optimal performance observed at = 0.4. As increases, model performance sharply declines, possibly due to higher similarity leading to the model erroneously treating negative samples as factual triples. Notably, when = 0, indicating the use of nearest neighbor entity replacement for negative sample generation, ERMF’s Hits@1 and MRR decrease by 8.6% and 8.9%, respectively, in the FB15K-DB15K dataset compared to when = 0.4. On the FB15K-YAGO15K dataset, Hits@1 and MRR decrease by 4.3% and 3.9%, respectively. This further highlights that incorporating visual similarity features can mitigate negative sample noise to some extent, enhancing the quality of negative sample generation.
Table 4.
Effect of visual similarity threshold on model performance.
5.2.4. Convergence Speed Comparison
To demonstrate the robustness of the ERMF model, we compared the convergence speeds of different models. Figure 7 illustrates the variations in MSNEA, MCLEA, and GEEA at different epochs. Our observations indicate that EMRF reached a stable state around the 600th iteration on both datasets. In contrast, MCLEA was only partially trained for the first 500 rounds, and although it converged earlier, its final performance was not satisfactory. This could be attributed to the fact that MCLEA employs automatic weighted multi-task loss, which over-amplifies the loss weights of sparse modalities in scenarios of modality information imbalances (e.g., the low image coverage rate in FB15K-YAGO15K as shown in Table 1), leading to model overfitting in the early training stage and performance degradation in the later stage. GEEA converged around the 100th round, but its performance started to decline afterward. The potential reason is that GEEA optimizes via distribution matching and reconstruction loss, requiring entity embeddings to map to a normal distribution. However, this approach tends to trap the model in local optima during training, causing it to excessively focus on the normality of embedding distributions rather than semantic matching for entity alignment. While MSNEA and ERMF exhibited similar convergence speeds, MSNEA’s overall performance was lower. These experimental results demonstrate the stability of our model.
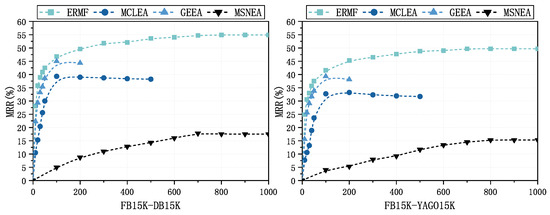
Figure 7.
Convergence speed comparison: The variations in MRR for MCLEA, GEEA, MSNEA, and ERMF across distinct stages of the training epochs.
6. Conclusions
In this paper, a novel multi-modal entity alignment model, ERMF, is proposed to capture multi-granularity modality representations, enhance the quality of relational embeddings, and improve alignment accuracy. In the multi-modal knowledge representation learning phase, embeddings for entity images, attributes, and graph structures are first learned. To strengthen relational feature representations, a vision-guided negative sample generation strategy, combined with nearest neighbor negative sampling and contrastive learning methods, is introduced to guide the model training process. Subsequently, a multi-level feature fusion approach is proposed to leverage networks at different levels to capture multi-granularity representations from coarse-grained to fine-grained perspectives. By employing various attention mechanisms, the importance of each modality, inter-modality correlations, and complementarities are captured, enabling enhanced modality fusion. For example, the bidirectional cross-modal attention mechanism symmetrically models interactions between text and image modalities, ensuring balanced information flow between modalities and aligning with the principle of functional symmetry in multi-modal integration. Finally, comparative experiments, ablation studies, and parameter analyses are conducted on public datasets, demonstrating the effectiveness of ERMF.
It is worth noting that the multi-modal data used in this study is limited to images, while real-world scenarios may involve additional modalities such as videos and audio. In future work, embedding methods for other types of multi-modal information (e.g., videos or audio) will be explored. The proven effective multi-layer feature fusion strategy in ERMF will be extended to capture complex interactions between newly incorporated audio/video modalities and existing modalities (texts, images, structures, and relations). Additionally, iterative alignment strategies will be introduced, and an efficient unsupervised entity alignment approach will be investigated.
Author Contributions
Conceptualization, H.L.; methodology, Y.H.; software, Y.H.; validation, Y.H.; formal analysis, P.Z.; investigation, J.L.; resources, J.L.; data curation, K.L.; writing—original draft preparation, Y.H.; writing—review and editing, H.L.; visualization, C.W.; supervision, C.W.; project administration, P.Z.; funding acquisition, K.L. All authors have read and agreed to the published version of the manuscript.
Funding
This work is supported by the National Natural Science Foundation of China under Grant 62471493 and is partially supported by the Natural Science Foundation of Shandong Province under the grants ZR2023LZH017, ZR2024MF066, and ZR2020MF140.
Data Availability Statement
The data that support the results of this study are openly available at https://github.com/liyichen-cly/MSNEA (accessed on 22 June 2022) and https://github.com/lzxlin/MCLEA (accessed on 22 June 2022).
Conflicts of Interest
The authors declare no competing interests.
References
- Wang, Y.; Sun, H.; Wang, J.; Wang, J.; Tang, W.; Qi, Q.; Sun, S.; Liao, J. Towards semantic consistency: Dirichlet energy driven robust multi-modal entity alignment. arXiv 2024, arXiv:2401.17859. [Google Scholar]
- Lehmann, J.; Isele, R.; Jakob, M.; Jentzsch, A.; Kontokostas, D.; Mendes, P.N.; Hellmann, S.; Morsey, M.; Van Kleef, P.; Auer, S.; et al. Dbpedia–a large-scale, multilingual knowledge base extracted from wikipedia. Semant. Web 2015, 6, 167–195. [Google Scholar] [CrossRef]
- Mahdisoltani, F.; Biega, J.; Suchanek, F.M. Yago3: A knowledge base from multilingual wikipedias. In Proceedings of the CIDR, Asilomar, CA, USA, 6–9 January 2013. [Google Scholar]
- Bollacker, K.; Evans, C.; Paritosh, P.; Sturge, T.; Taylor, J. Freebase: A collaboratively created graph database for structuring human knowledge. In Proceedings of the 2008 ACM SIGMOD International Conference on Management of Data, Vancouver, BC, Canada, 9–12 June 2008; pp. 1247–1250. [Google Scholar]
- Jiang, Z.; Chi, C.; Zhan, Y. Research on medical question answering system based on knowledge graph. IEEE Access 2021, 9, 21094–21101. [Google Scholar] [CrossRef]
- Huang, X.; Zhang, J.; Li, D.; Li, P. Knowledge graph embedding based question answering. In Proceedings of the Twelfth ACM International Conference on Web Search and Data Mining, Melbourne, VIC, Australia, 11–15 February 2019; pp. 105–113. [Google Scholar]
- Zeng, Y.; Jin, Q.; Bao, T.; Li, W. Multi-modal knowledge hypergraph for diverse image retrieval. In Proceedings of the AAAI Conference on Artificial Intelligence, Washington, DC, USA, 7–14 February 2023; Volume 37, pp. 3376–3383. [Google Scholar]
- Sun, R.; Cao, X.; Zhao, Y.; Wan, J.; Zhou, K.; Zhang, F.; Wang, Z.; Zheng, K. Multi-modal knowledge graphs for recommender systems. In Proceedings of the 29th ACM International Conference on Information & Knowledge Management, Virtual Event, 19–23 October 2020; pp. 1405–1414. [Google Scholar]
- Chen, L.; Li, Z.; Wang, Y.; Xu, T.; Wang, Z.; Chen, E. MMEA: Entity alignment for multi-modal knowledge graph. In Knowledge Science, Engineering and Management, Proceedings of the 13th International Conference, KSEM 2020, Hangzhou, China, 28–30 August 2020; Proceedings, Part I 13; Springer: Berlin/Heidelberg, Germany, 2020; pp. 134–147. [Google Scholar]
- Liu, F.; Chen, M.; Roth, D.; Collier, N. Visual pivoting for (unsupervised) entity alignment. In Proceedings of the AAAI Conference on Artificial Intelligence, Virtual Event, 19–21 May 2021; Volume 35, pp. 4257–4266. [Google Scholar]
- Chen, L.; Li, Z.; Xu, T.; Wu, H.; Wang, Z.; Yuan, N.J.; Chen, E. Multi-modal siamese network for entity alignment. In Proceedings of the 28th ACM SIGKDD Conference on Knowledge Discovery and Data Mining, Washington, DC, USA, 14–18 August 2022; pp. 118–126. [Google Scholar]
- Liu, Y.; Li, H.; Garcia-Duran, A.; Niepert, M.; Onoro-Rubio, D.; Rosenblum, D.S. MMKG: Multi-modal knowledge graphs. In The Semantic Web, Proceedings of the 16th International Conference, ESWC 2019, Portorož, Slovenia, 2–6 June 2019; Proceedings 16; Springer: Berlin/Heidelberg, Germany, 2019; pp. 459–474. [Google Scholar]
- Chen, Z.; Chen, J.; Zhang, W.; Guo, L.; Fang, Y.; Huang, Y.; Zhang, Y.; Geng, Y.; Pan, J.Z.; Song, W.; et al. Meaformer: Multi-modal entity alignment transformer for meta modality hybrid. In Proceedings of the 31st ACM International Conference on Multimedia, Ottawa, ON, Canada, 29 October–3 November 2023; pp. 3317–3327. [Google Scholar]
- Lin, Z.; Zhang, Z.; Wang, M.; Shi, Y.; Wu, X.; Zheng, Y. Multi-modal contrastive representation learning for entity alignment. arXiv 2022, arXiv:2209.00891. [Google Scholar]
- Wang, M.; Wang, H.; Qi, G.; Zheng, Q. Richpedia: A large-scale, comprehensive multi-modal knowledge graph. Big Data Res. 2020, 22, 100159. [Google Scholar] [CrossRef]
- Chaudhary, C.; Goyal, P.; Prasad, D.N.; Chen, Y.P.P. Enhancing the quality of image tagging using a visio-textual knowledge base. IEEE Trans. Multimed. 2019, 22, 897–911. [Google Scholar] [CrossRef]
- Huang, J.; Chen, Y.; Li, Y.; Yang, Z.; Gong, X.; Wang, F.L.; Xu, X.; Liu, W. Medical knowledge-based network for patient-oriented visual question answering. Inf. Process. Manag. 2023, 60, 103241. [Google Scholar] [CrossRef]
- Mondal, P.; Chakder, D.; Raj, S.; Saha, S.; Onoe, N. Graph convolutional neural network for multimodal movie recommendation. In Proceedings of the 38th ACM/SIGAPP Symposium on Applied Computing, Tallinn, Estonia, 27–31 March 2023; pp. 1633–1640. [Google Scholar]
- Xie, R.; Liu, Z.; Luan, H.; Sun, M. Image-embodied knowledge representation learning. arXiv 2016, arXiv:1609.07028. [Google Scholar]
- Wang, Z.; Li, L.; Li, Q.; Zeng, D. Multimodal data enhanced representation learning for knowledge graphs. In Proceedings of the 2019 International Joint Conference on Neural Networks (IJCNN), Budapest, Hungary, 14–19 July 2019; IEEE: Piscataway, NJ, USA, 2019; pp. 1–8. [Google Scholar]
- Bordes, A.; Usunier, N.; Garcia-Duran, A.; Weston, J.; Yakhnenko, O. Translating embeddings for modeling multi-relational data. In Proceedings of the NIPS’13: Neural Information Processing Systems, Lake Tahoe, NV, USA, 5–10 December 2013; Volume 26. [Google Scholar]
- Moon, C.; Jones, P.; Samatova, N.F. Learning entity type embeddings for knowledge graph completion. In Proceedings of the 2017 ACM on Conference on Information and Knowledge Management, Singapore, 6–10 November 2017; pp. 2215–2218. [Google Scholar]
- Lu, X.; Wang, L.; Jiang, Z.; He, S.; Liu, S. MMKRL: A robust embedding approach for multi-modal knowledge graph representation learning. Appl. Intell. 2022, 52, 7480–7497. [Google Scholar] [CrossRef]
- Cheng, B.; Zhu, J.; Guo, M. MultiJAF: Multi-modal joint entity alignment framework for multi-modal knowledge graph. Neurocomputing 2022, 500, 581–591. [Google Scholar] [CrossRef]
- Zhu, J.; Huang, C.; De Meo, P. DFMKE: A dual fusion multi-modal knowledge graph embedding framework for entity alignment. Inf. Fusion 2023, 90, 111–119. [Google Scholar] [CrossRef]
- Wu, Y.; Liu, X.; Feng, Y.; Wang, Z.; Yan, R.; Zhao, D. Relation-Aware Entity Alignment for Heterogeneous Knowledge Graphs. In Proceedings of the Twenty-Eighth International Joint Conference on Artificial Intelligence, IJCAI-2019, Macao, China, 10–16 August 2019; pp. 5278–5284. [Google Scholar] [CrossRef]
- Shi, Y.; Wang, M.; Zhang, Z.; Lin, Z.; Zheng, Y. Probing the Impacts of Visual Context in Multimodal Entity Alignment. In Proceedings of the Web and Big Data, Wuhan, China, 6–8 October 2023; Li, B., Yue, L., Tao, C., Han, X., Calvanese, D., Amagasa, T., Eds.; Springer: Cham, Switzerland, 2023; pp. 255–270. [Google Scholar]
- Xu, B.; Xu, C.; Su, B. Cross-modal graph attention network for entity alignment. In Proceedings of the 31st ACM International Conference on Multimedia, Ottawa, ON, Canada, 29 October–3 November 2023; pp. 3715–3723. [Google Scholar]
- Chen, L.; Sun, Y.; Zhang, S.; Ye, Y.; Wu, W.; Xiong, H. Tackling Uncertain Correspondences for Multi-Modal Entity Alignment. In Proceedings of the Thirty-Eighth Annual Conference on Neural Information Processing Systems, Vancouver, BC, Canada, 10–15 December 2024. [Google Scholar]
- Hu, Z.; Gutiérrez-Basulto, V.; Xiang, Z.; Li, R.; Pan, J.Z. Leveraging Intra-modal and Inter-modal Interaction for Multi-Modal Entity Alignment. arXiv 2024, arXiv:2404.17590. [Google Scholar]
- Wang, L.; Qi, P.; Bao, X.; Zhou, C.; Qin, B. Pseudo-Label Calibration Semi-supervised Multi-Modal Entity Alignment. In Proceedings of the AAAI Conference on Artificial Intelligence, Vancouver, BC, Canada, 26–27 February 2024; Volume 38, pp. 9116–9124. [Google Scholar] [CrossRef]
- Guo, H.; Tang, J.; Zeng, W.; Zhao, X.; Liu, L. Multi-modal entity alignment in hyperbolic space. Neurocomputing 2021, 461, 598–607. [Google Scholar] [CrossRef]
- Velickovic, P.; Cucurull, G.; Casanova, A.; Romero, A.; Lio, P.; Bengio, Y. Graph attention networks. Stat 2017, 1050, 10–48550. [Google Scholar]
- Li, C.; Cao, Y.; Hou, L.; Shi, J.; Li, J.; Chua, T.S. Semi-Supervised Entity Alignment via Joint Knowledge Embedding Model and Cross-Graph Model; Association for Computational Linguistics: Stroudsburg, PA, USA, 2019. [Google Scholar]
- Xia, L.; Mi, S.; Zhang, J.; Luo, J.; Shen, Z.; Cheng, Y. Dual-Stream Feature Extraction Network Based on CNN and Transformer for Building Extraction. Remote Sens. 2023, 15, 2689. [Google Scholar] [CrossRef]
- Liu, Y.H. Feature extraction and image recognition with convolutional neural networks. J. Phys. Conf. Ser. 2018, 1087, 062032. [Google Scholar] [CrossRef]
- Simonyan, K.; Zisserman, A. Very deep convolutional networks for large-scale image recognition. arXiv 2014, arXiv:1409.1556. [Google Scholar]
- Guo, H.; Li, X.; Tang, J.; Guo, Y.; Zhao, X. Adaptive Feature Fusion for Multi-modal Entity Alignment. Acta Autom. Sin. 2024, 50, 758–770. [Google Scholar] [CrossRef]
- Guo, L.; Chen, Z.; Chen, J.; Chen, H. Revisit and outstrip entity alignment: A perspective of generative models. arXiv 2023, arXiv:2305.14651. [Google Scholar]
- Li, Q.; Guo, S.; Luo, Y.; Ji, C.; Wang, L.; Sheng, J.; Li, J. Attribute-consistent knowledge graph representation learning for multi-modal entity alignment. In Proceedings of the ACM Web Conference 2023, Austin, TX, USA, 30 April–4 May 2023; pp. 2499–2508. [Google Scholar]
- Li, Q.; Ji, C.; Guo, S.; Liang, Z.; Wang, L.; Li, J. Multi-modal knowledge graph transformer framework for multi-modal entity alignment. arXiv 2023, arXiv:2310.06365. [Google Scholar]
- Zhang, X.; Chen, T.; Wang, H. A Novel Method for Boosting Knowledge Representation Learning in Entity Alignment through Triple Confidence. Mathematics 2024, 12, 1214. [Google Scholar] [CrossRef]
- Li, Q.; Li, J.; Wu, J.; Peng, X.; Ji, C.; Peng, H.; Wang, L.; Philip, S.Y. Triplet-aware graph neural networks for factorized multi-modal knowledge graph entity alignment. Neural Netw. 2024, 179, 106479. [Google Scholar] [CrossRef] [PubMed]
Disclaimer/Publisher’s Note: The statements, opinions and data contained in all publications are solely those of the individual author(s) and contributor(s) and not of MDPI and/or the editor(s). MDPI and/or the editor(s) disclaim responsibility for any injury to people or property resulting from any ideas, methods, instructions or products referred to in the content. |
© 2025 by the authors. Licensee MDPI, Basel, Switzerland. This article is an open access article distributed under the terms and conditions of the Creative Commons Attribution (CC BY) license (https://creativecommons.org/licenses/by/4.0/).