Article

Symmetry-Informed Optimization and Verification of Loader Working Device Based on Improved Genetic Algorithm

1
School of Mechanical Engineering, Yanshan University, Hebei Street 438, Qinhuangdao 066004, China
2
XCMG Construction Machinery Co., Ltd., No. 99, Pengbei Road, Economic and Technological Development Zone, Xuzhou 221001, China
*
Author to whom correspondence should be addressed.
Symmetry 2025, 17(7), 1084; https://doi.org/10.3390/sym17071084
Submission received: 25 April 2025 / Revised: 8 June 2025 / Accepted: 17 June 2025 / Published: 7 July 2025
(This article belongs to the Section Engineering and Materials)

Abstract

The translation of motion lift, as an important performance metric of a reversing six-link loader working device, is influenced by multiple factors, such as the mechanical structure, system components, and operational experience. To ensure that the loader’s motion lift performance is optimized, this paper takes the fork trajectory and the horizontal angle between the bucket cylinder and the ground as the main optimization objectives. Kinematic modeling and multi-objective optimization are conducted to reduce the influence of external factors on the motion lift process. Firstly, a parametric model of the reversing six-link mechanism is established based on its geometric and symmetric characteristics, and the expressions for the fork’s motion trajectory and the cylinder–ground angle are derived. Then, an optimization model is constructed with the aim of minimizing both the translational error during fork lifting and the horizontal angle of the bucket cylinder. An improved multi-objective genetic algorithm is employed for the global search and optimization. Inspired by the principle of symmetry, the algorithm incorporates a structured search strategy that enhances convergence efficiency and solution balance. A multi-criteria decision function is further applied to identify the optimal solution from the Pareto front. Finally, a real-vehicle experiment validates the optimization results. The findings confirm that the proposed method significantly improves the translational performance of the fork and effectively controls the horizontal angle of the cylinder while also enhancing the driver’s visibility and coordination of the entire system. These results provide a theoretical and engineering basis for the symmetry-informed multi-objective performance optimization of loader working devices.

1. Introduction

With the continuous advancement of intelligent and high-performing construction machinery, researchers have gradually focused on the adaptability of loaders in various working conditions, the stability of operation control, and structure coordination. As the core component of the loader in operations such as loading, lifting, and unloading, the structure of the working device directly determines the operational performance of the entire machine [1]. The reverse six-link working device, due to its advantages in terms of motion characteristics and mechanical transmission, has been widely used in new-generation loader products. This structure is composed of components such as the boom, bucket, link, rocker arm, and oil cylinder. It achieves complex power transmission and mechanism coordination through nine hinge points, as shown in Figure 1. Among them, the translational motion of the fork is an important indicator for measuring the loading mechanism’s motion coordination, which directly affects the stability of the cargo posture during loading and the safety of operation control. This subject has received increasing attention in recent years. Good translational motion helps improve operational efficiency and reduce the risk of material tipping. However, in actual structural design, if it is only the translational motion of the fork that is pursued, it often leads to an excessively large horizontal angle between the bucket oil cylinder and the ground, which not only limits the driver’s forward view but also may cause the rocker arm to be too long, thereby affecting the structural layout and the performance of the entire machine.
Optimizing the design of a loader’s working device is key to enhancing the operational performance of construction machinery. In recent years, numerous scholars have conducted extensive research involving both theoretical modeling and optimization methods related to reverse six-bar linkages and related structures. Zhang Zhizhong established a parametric kinematic model of the reverse six-bar linkage and proposed full-parameter and partial-parameter optimization strategies, providing a systematic mathematical basis for the performance design of loaders [2]. However, his optimization mainly focused on theoretical modeling and lacked an in-depth consideration of the coordination of actual multi-working conditions. Kong utilized the sequential quadratic programming algorithm, taking the force of the arm cylinder as the objective function, and effectively optimized the working device [3]. On the other hand, the study only focused on a single performance indicator and ignored the balance between multiple performance indicators. Huang established a dynamic mathematical model of the loader based on the Dymola and Modelica platforms, successfully optimizing the cylinder’s retraction phenomenon and improving its dynamic performance [4]. However, the model used was highly complex and difficult to apply to real-time design optimization. Han Bin et al. significantly reduced the interference of mechanism motion and dead point self-locking problems by improving the complex method, enhancing the reliability of the mechanism motion [5]. Nevertheless, their method offered limited support for the comprehensive optimization of multiple performance indicators. Other optimization strategies used in the existing literature include the elite ant colony algorithm, employed by Xie Peiqing et al.; the simulated annealing algorithm, utilized by Zhang Xian; the particle swarm algorithm, used by Li; ADAMS simulation, as applied by Xing; and, finally, a sensitivity analysis, adopted by Wu. These authors achieved good results in aspects such as digging force, smooth mechanism motion, and screening of structural parameters [6,7,8,9,10]. However, most of these studies focused on improving single or local performance and failed to effectively solve the coordination problem among complex multi-objectives. Dong Weichao and Pang Haitong successfully improved the working device’s automatic leveling performance through 3D modeling and ADAMS parametric simulation [11]. Nevertheless, their study mainly focused on a single function (automatic leveling) and lacked comprehensive optimization including multiple working conditions and performance indicators, making it difficult to meet the complex operational requirements of loaders using their method. Cheng Ran et al. optimized the hinge points of a stone fork working device through kinematic simulation, enhancing the lifting force and improving the device’s adaptability to specific working conditions [12]. However, the optimization focus was limited to a single working condition and a single performance indicator, and the study did not systematically consider motion coordination and structural integrity under multiple working conditions. Chen Zhen constructed a kinematic model of the inverted six-bar linkage and analyzed performance indicators such as posture and smoothness under multiple working conditions [13]. Although the study did cover multiple working conditions, it mainly remained at the simulation analysis level and lacked in-depth multi-objective coordination optimization and experimental verification. Wen Hong et al. optimized the hinge points of the flipping mechanism based on ADAMS virtual prototypes and experimental data, significantly reducing the hinge point load and improving the mechanism’s lifespan [14]. However, the optimization objective was relatively limited and did not involve the multi-objective balance of motion coordination and smoothness of the loader’s working device, with a narrow application range. Finally, Gao Long et al. utilized the response surface method and genetic algorithm to optimize the hinge points of the boom, enhancing the lifting stability and smoothness [15]. Nevertheless, they focused on the optimization of dynamic performance and did not consider structural coordination indicators such as the fork’s translational motion and the angle of the cylinder, making it difficult to achieve multi-objective collaborative optimization.
Based on the above issues, the research object in this paper is the motion modeling and performance optimization of the inverted six-link working device, with the aim of improving the lateral movement of the fork and controlling the angle between the bucket cylinder and the ground. Specifically, in Section 2, a parametric geometric model and kinematic analysis method for the six-link mechanism are constructed, and the mathematical expressions of key performance parameters are derived, providing a theoretical basis for the optimization design. In Section 3, an optimization model with the dual objectives of minimizing the lateral movement of the fork and the angle between the cylinder and the ground is established, multiple performance constraints are introduced, and an improved multi-objective genetic algorithm is adopted; a multi-criteria decision function is also constructed to assist in the selection of the optimal solution. In Section 4, optimization calculations are carried out based on the algorithms and decision methods proposed in the previous section, and a set of design solutions with the best comprehensive performance is obtained. In Section 5, this optimal solution is applied to a real vehicle, and its feasibility and effectiveness in engineering practice are experimentally evaluated. Finally, in Section 6, the entire paper—including the research results—is summarized, and some directions for future work are proposed. This study provides theoretical support and an engineering reference for the multi-objective collaborative optimization design of loader working devices.

2. Mathematical Model

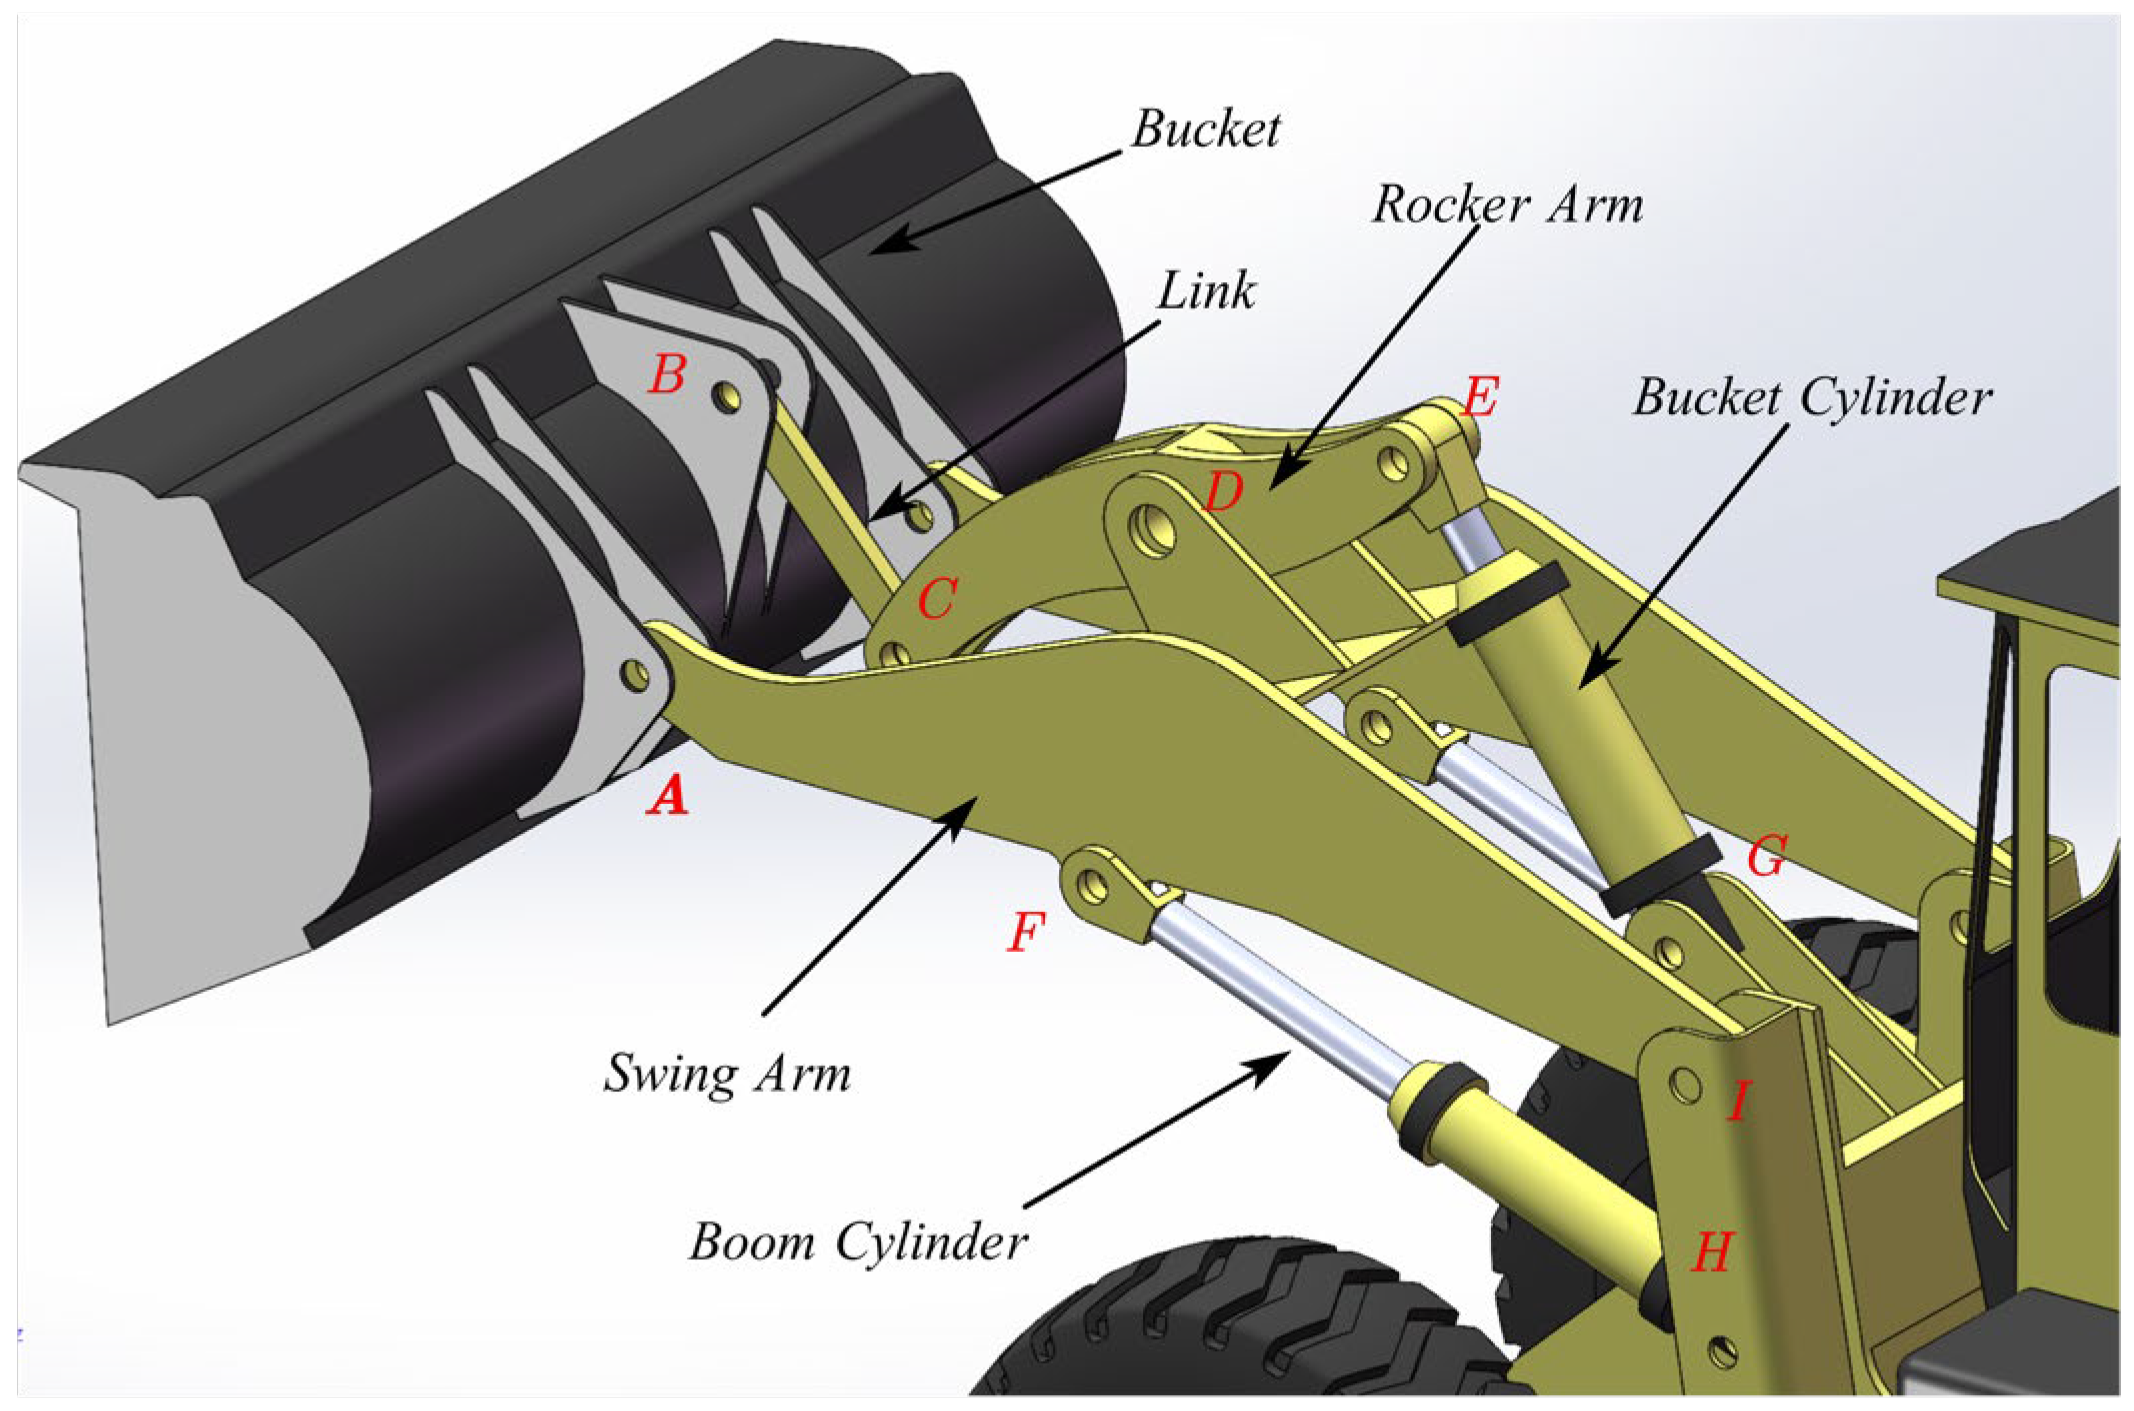
2.1. Problem Description

The six-link working device is a key part of the loader and has a significant impact on its overall performance. Optimizing the hinge position can improve the matching of the bucket digging force and unloading height, as well as optimize loader performance in various areas. This study constructs a mathematical model of the loader’s six-link working device and optimizes its performance by improving the traditional optimization algorithm.

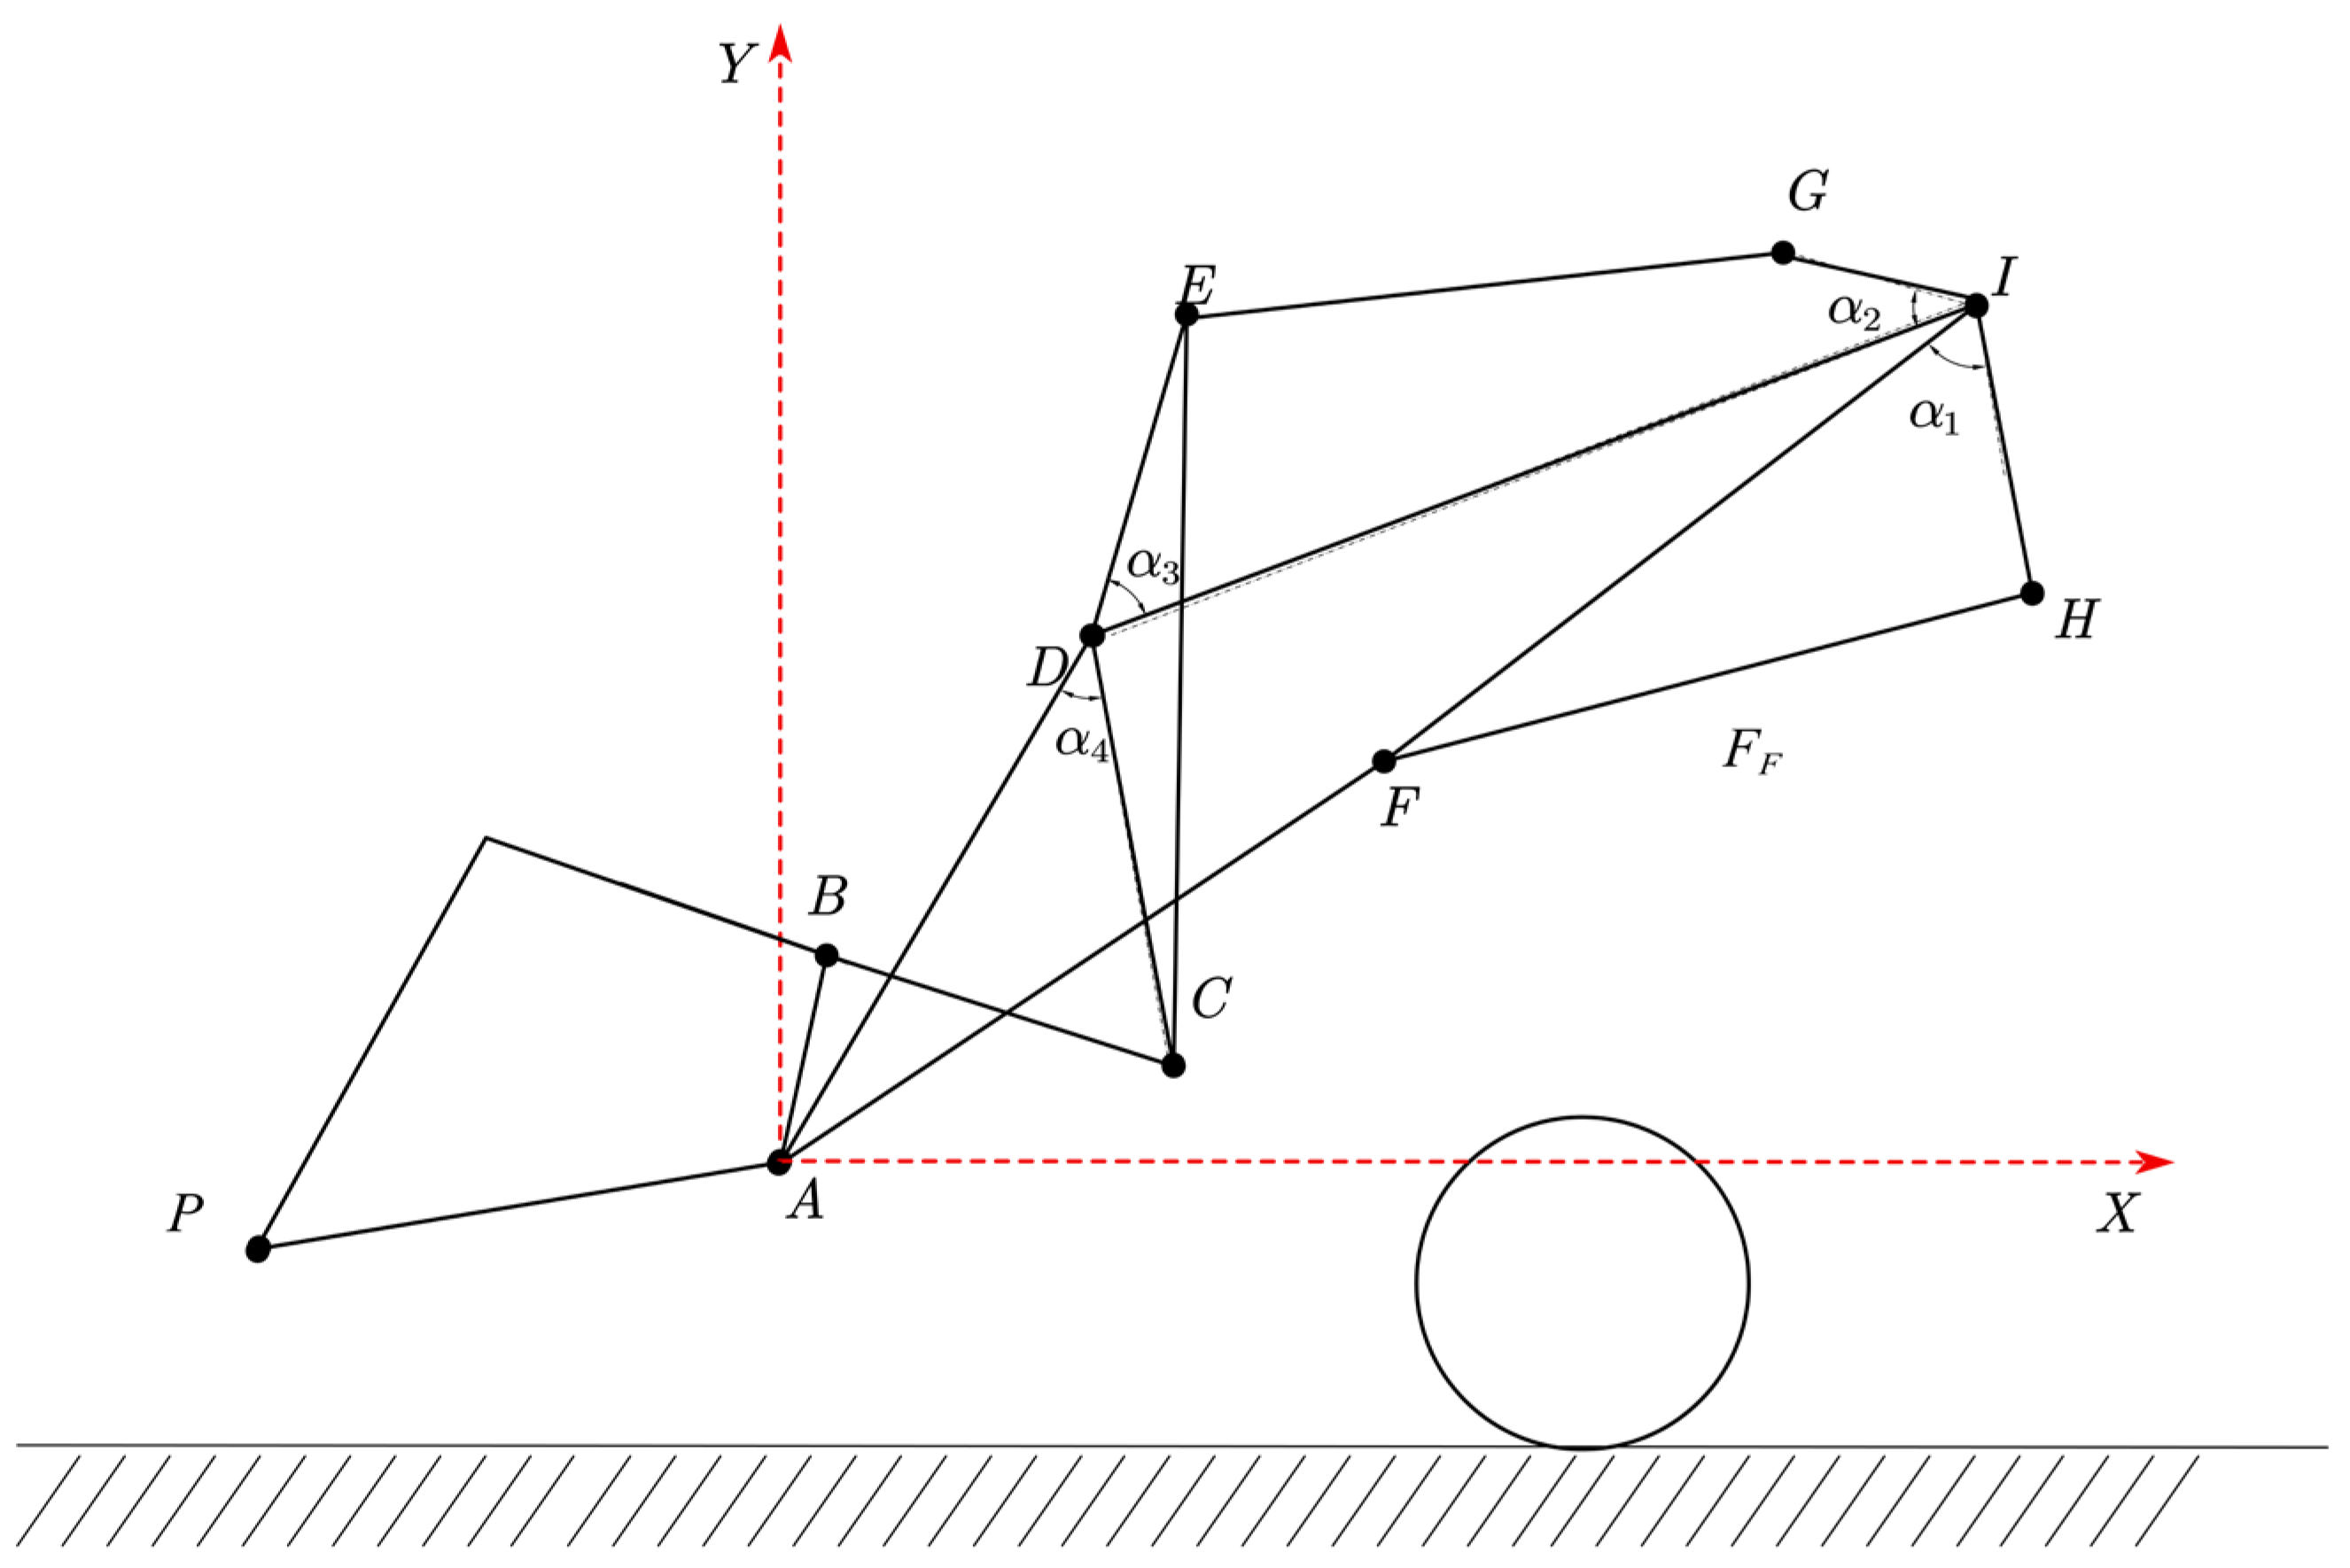
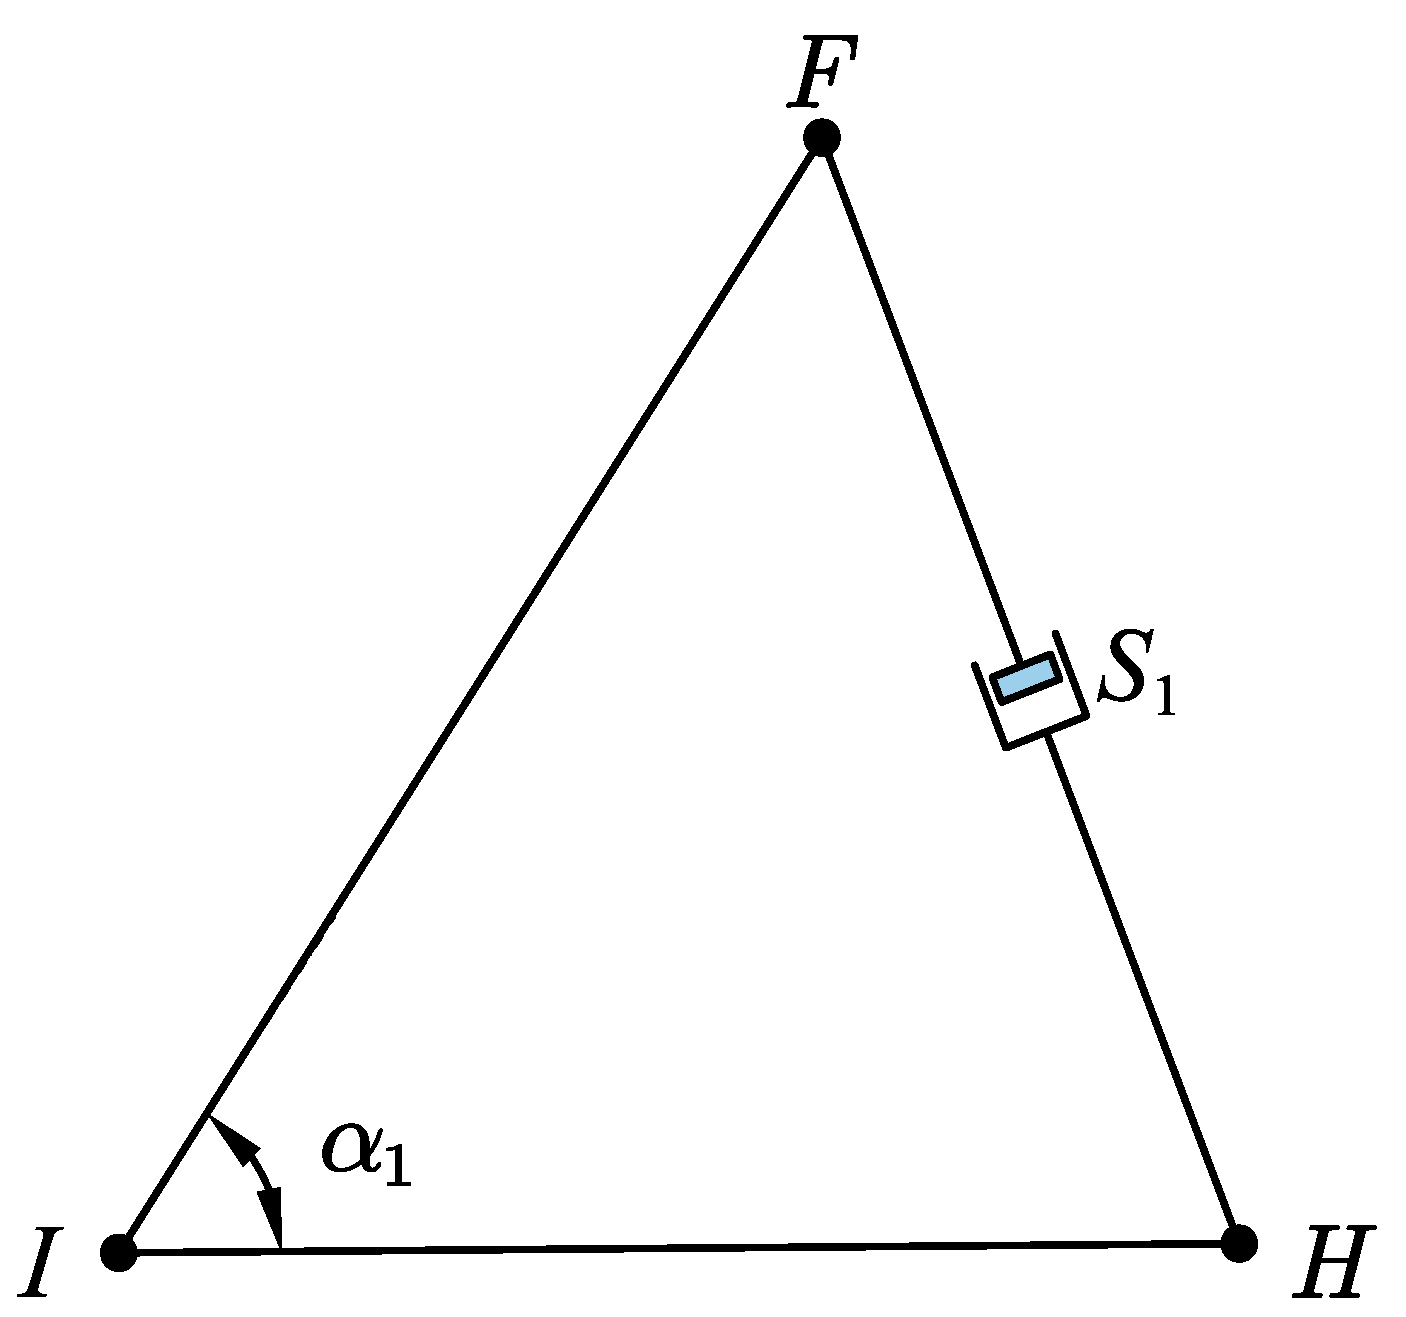
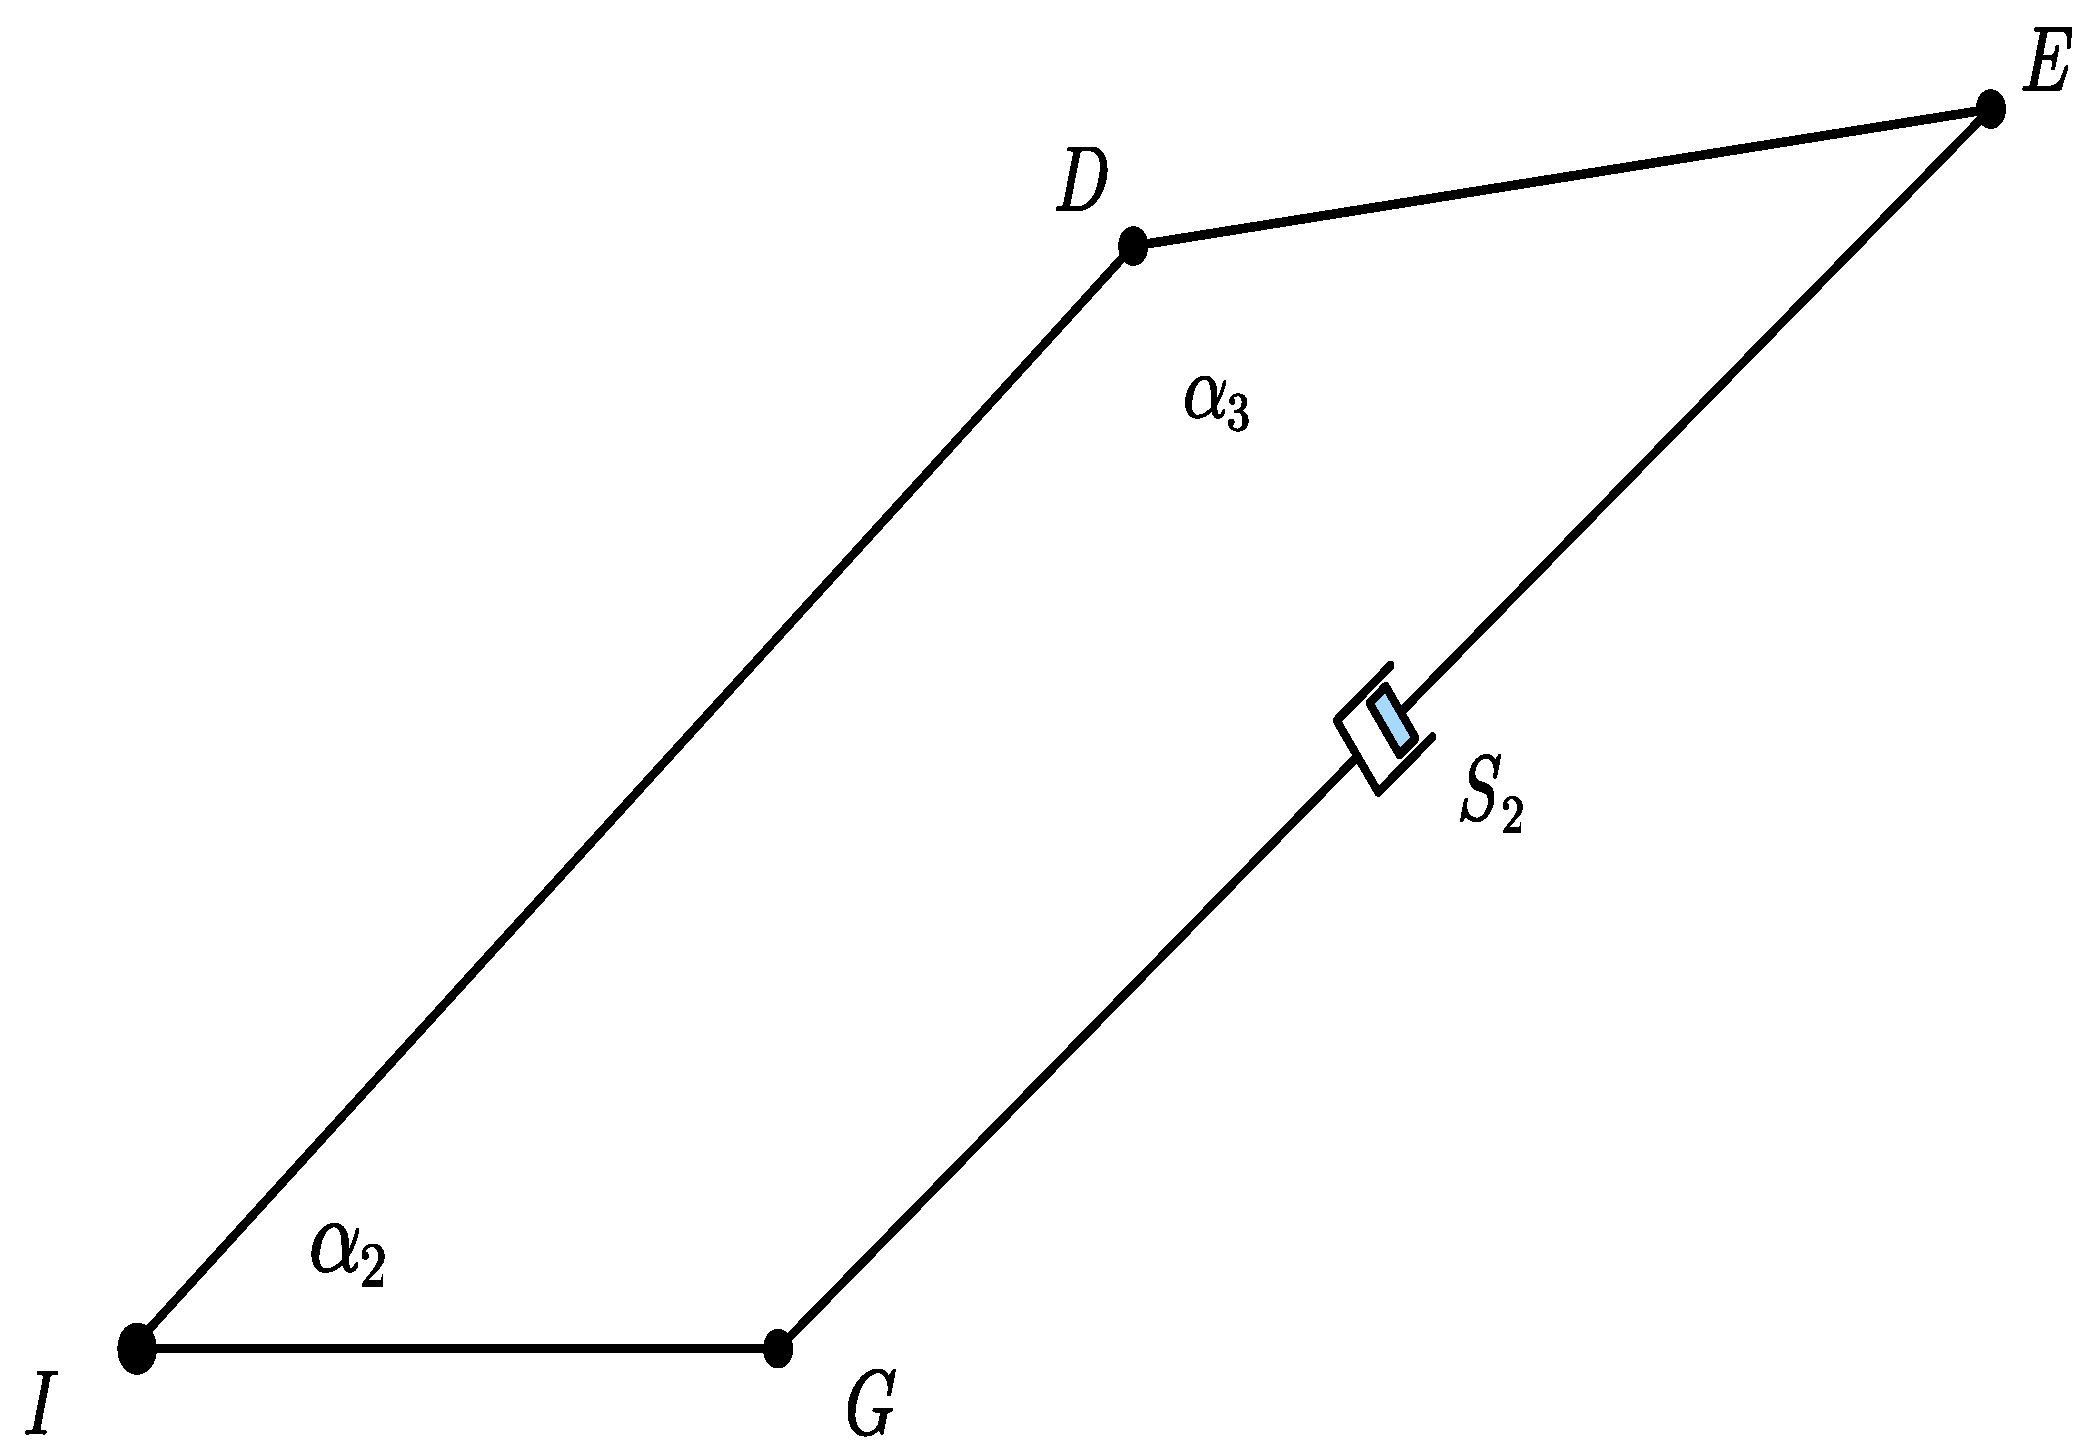
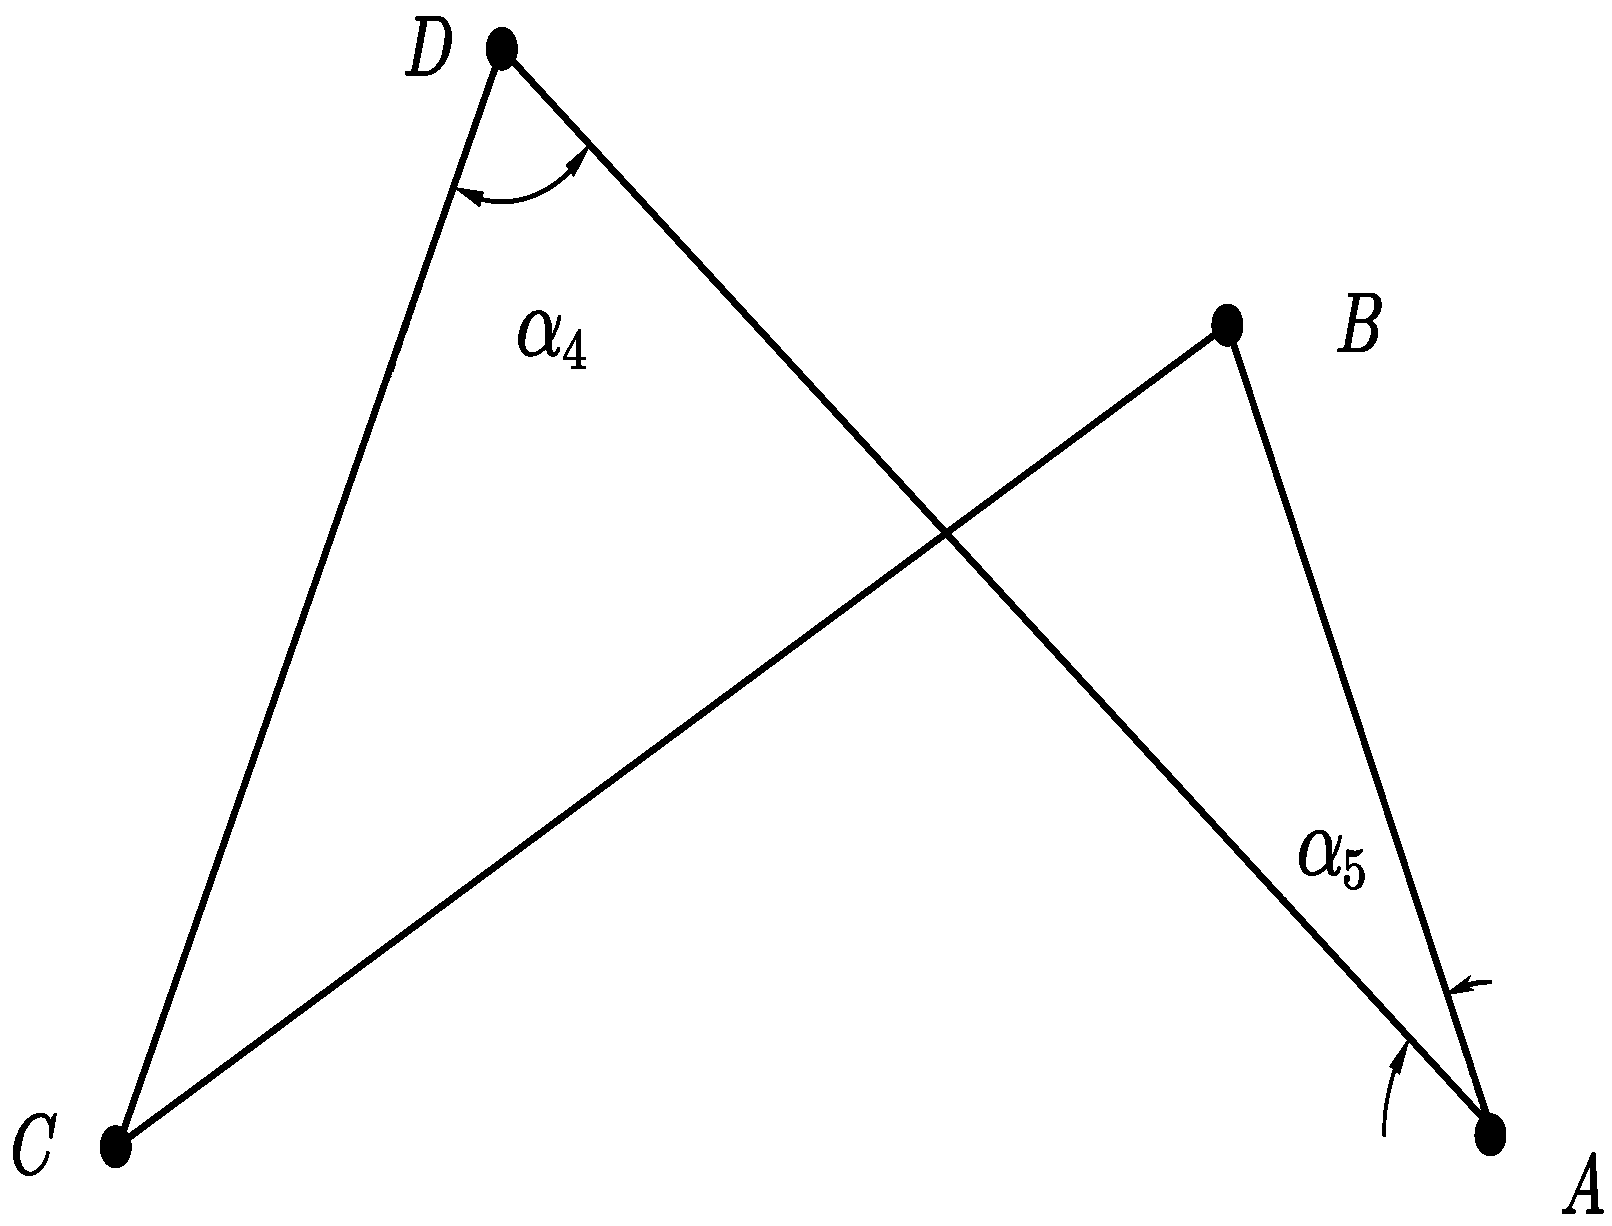
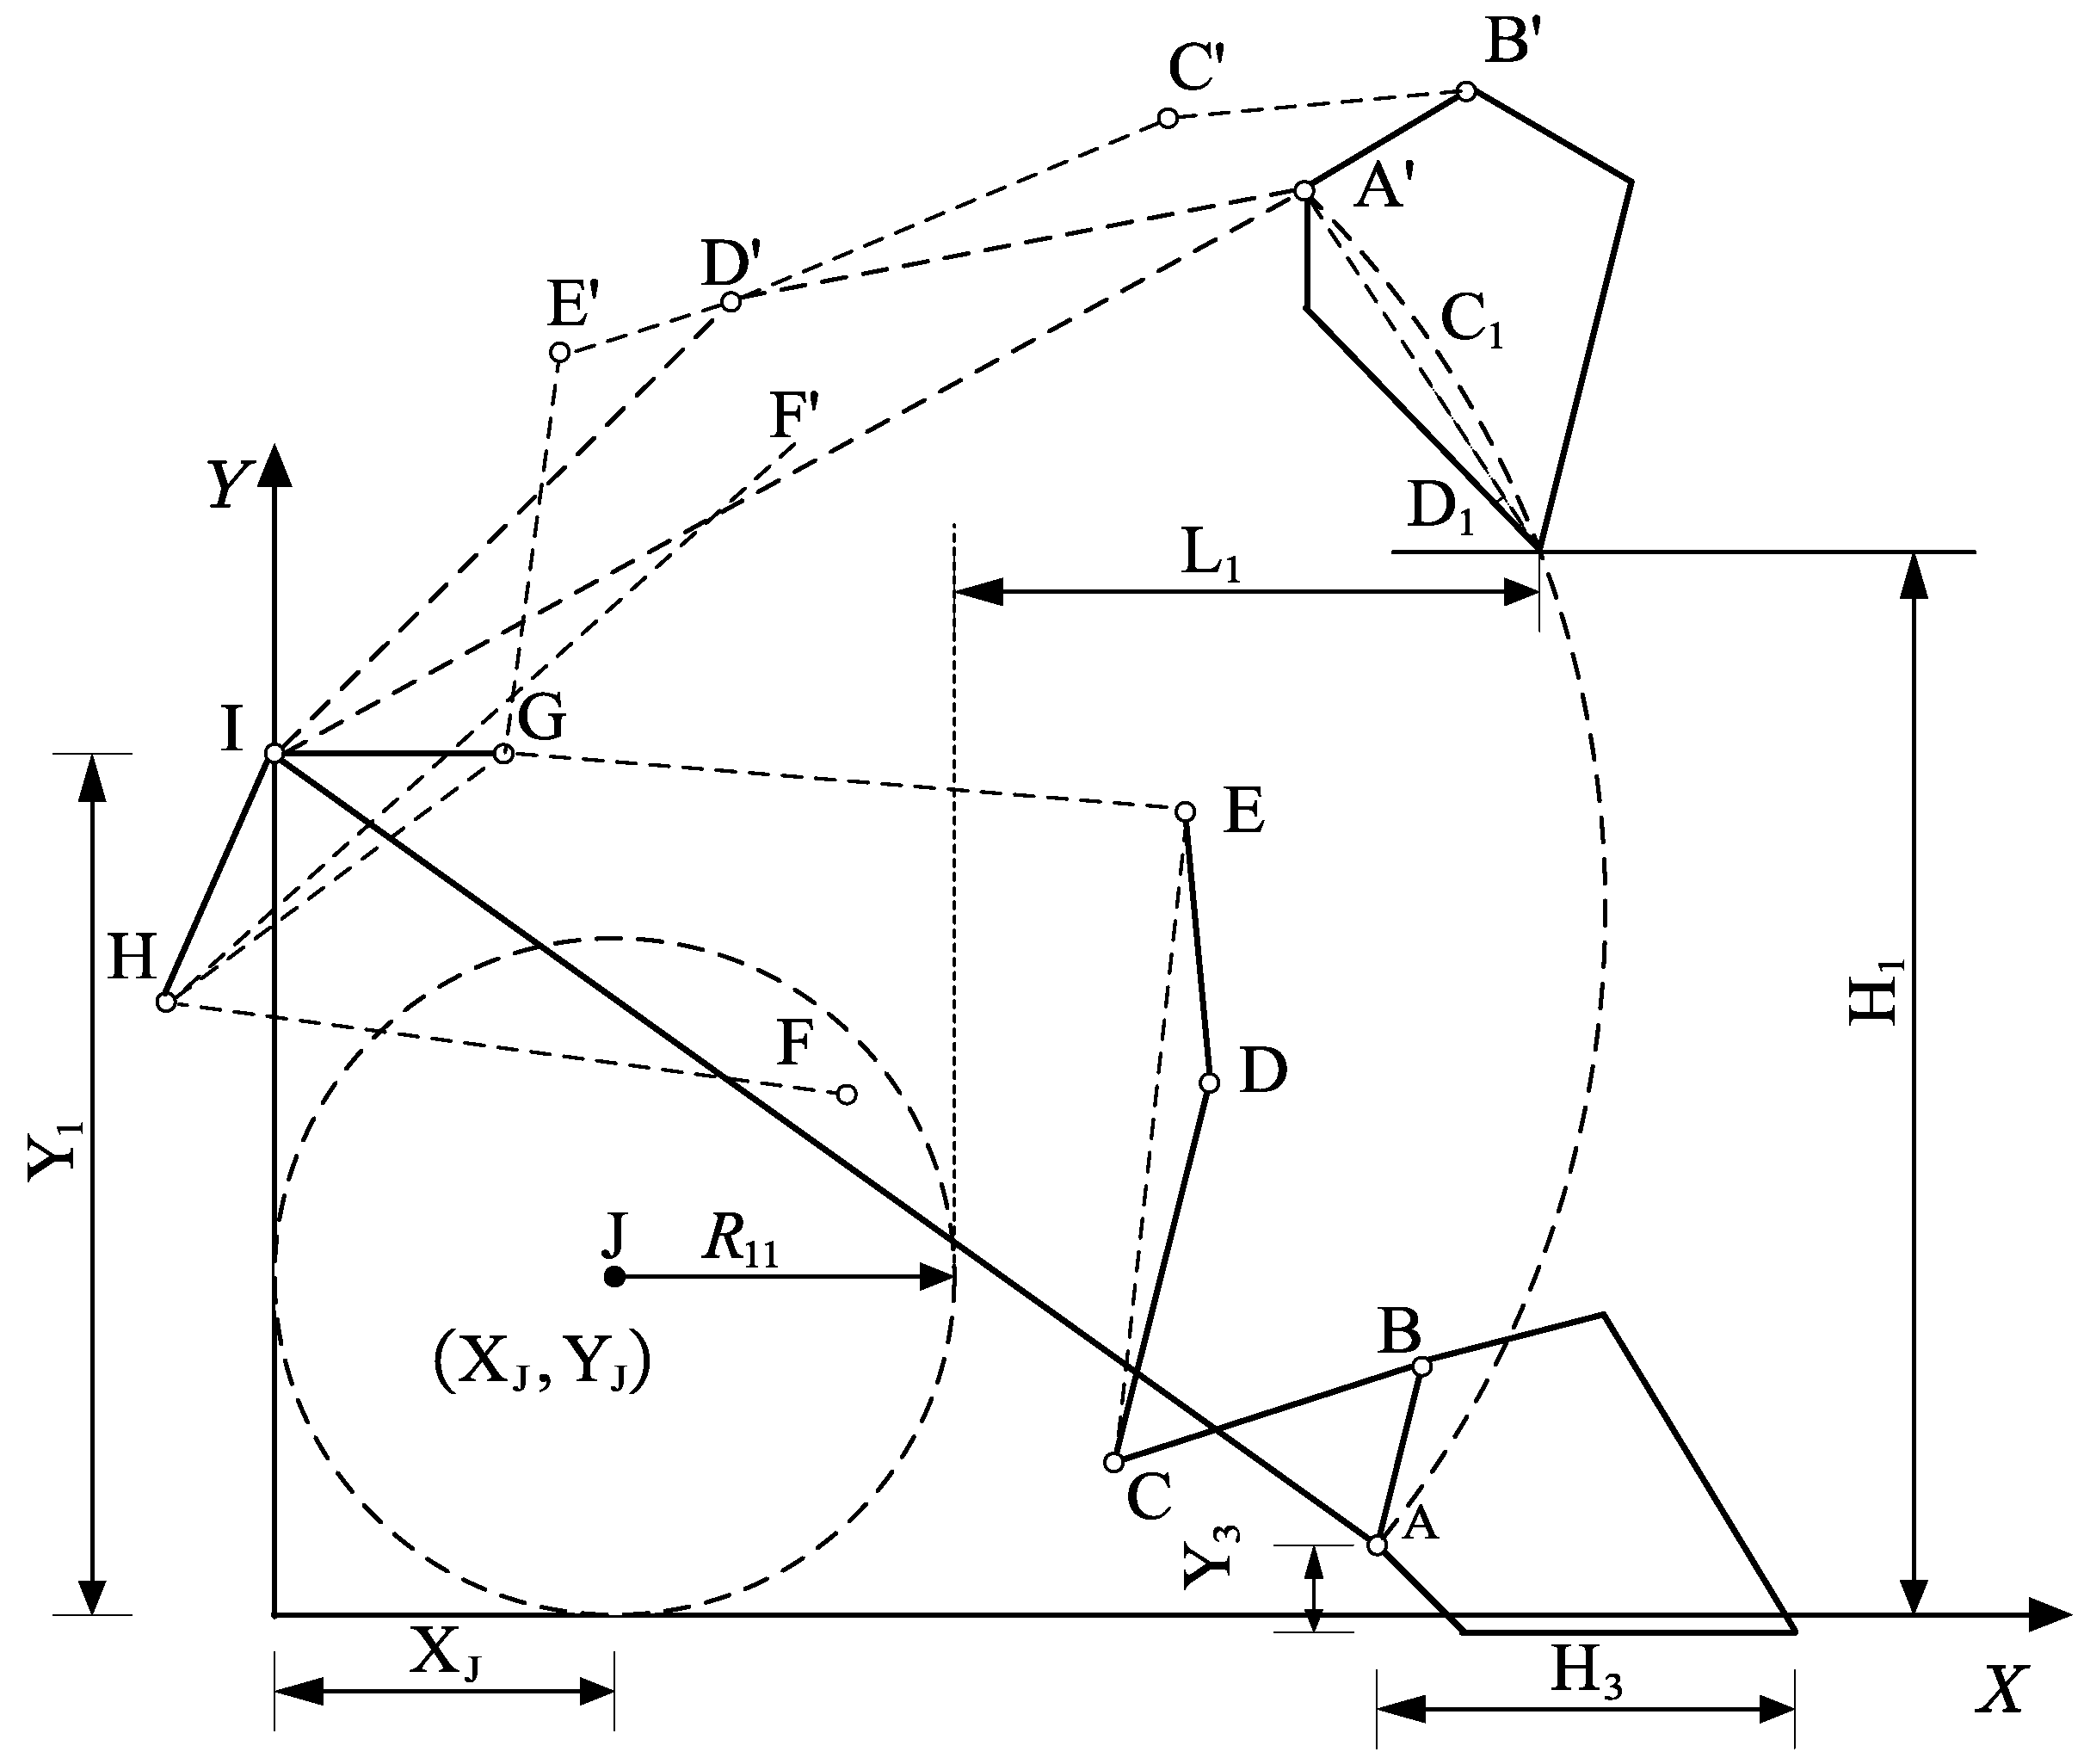
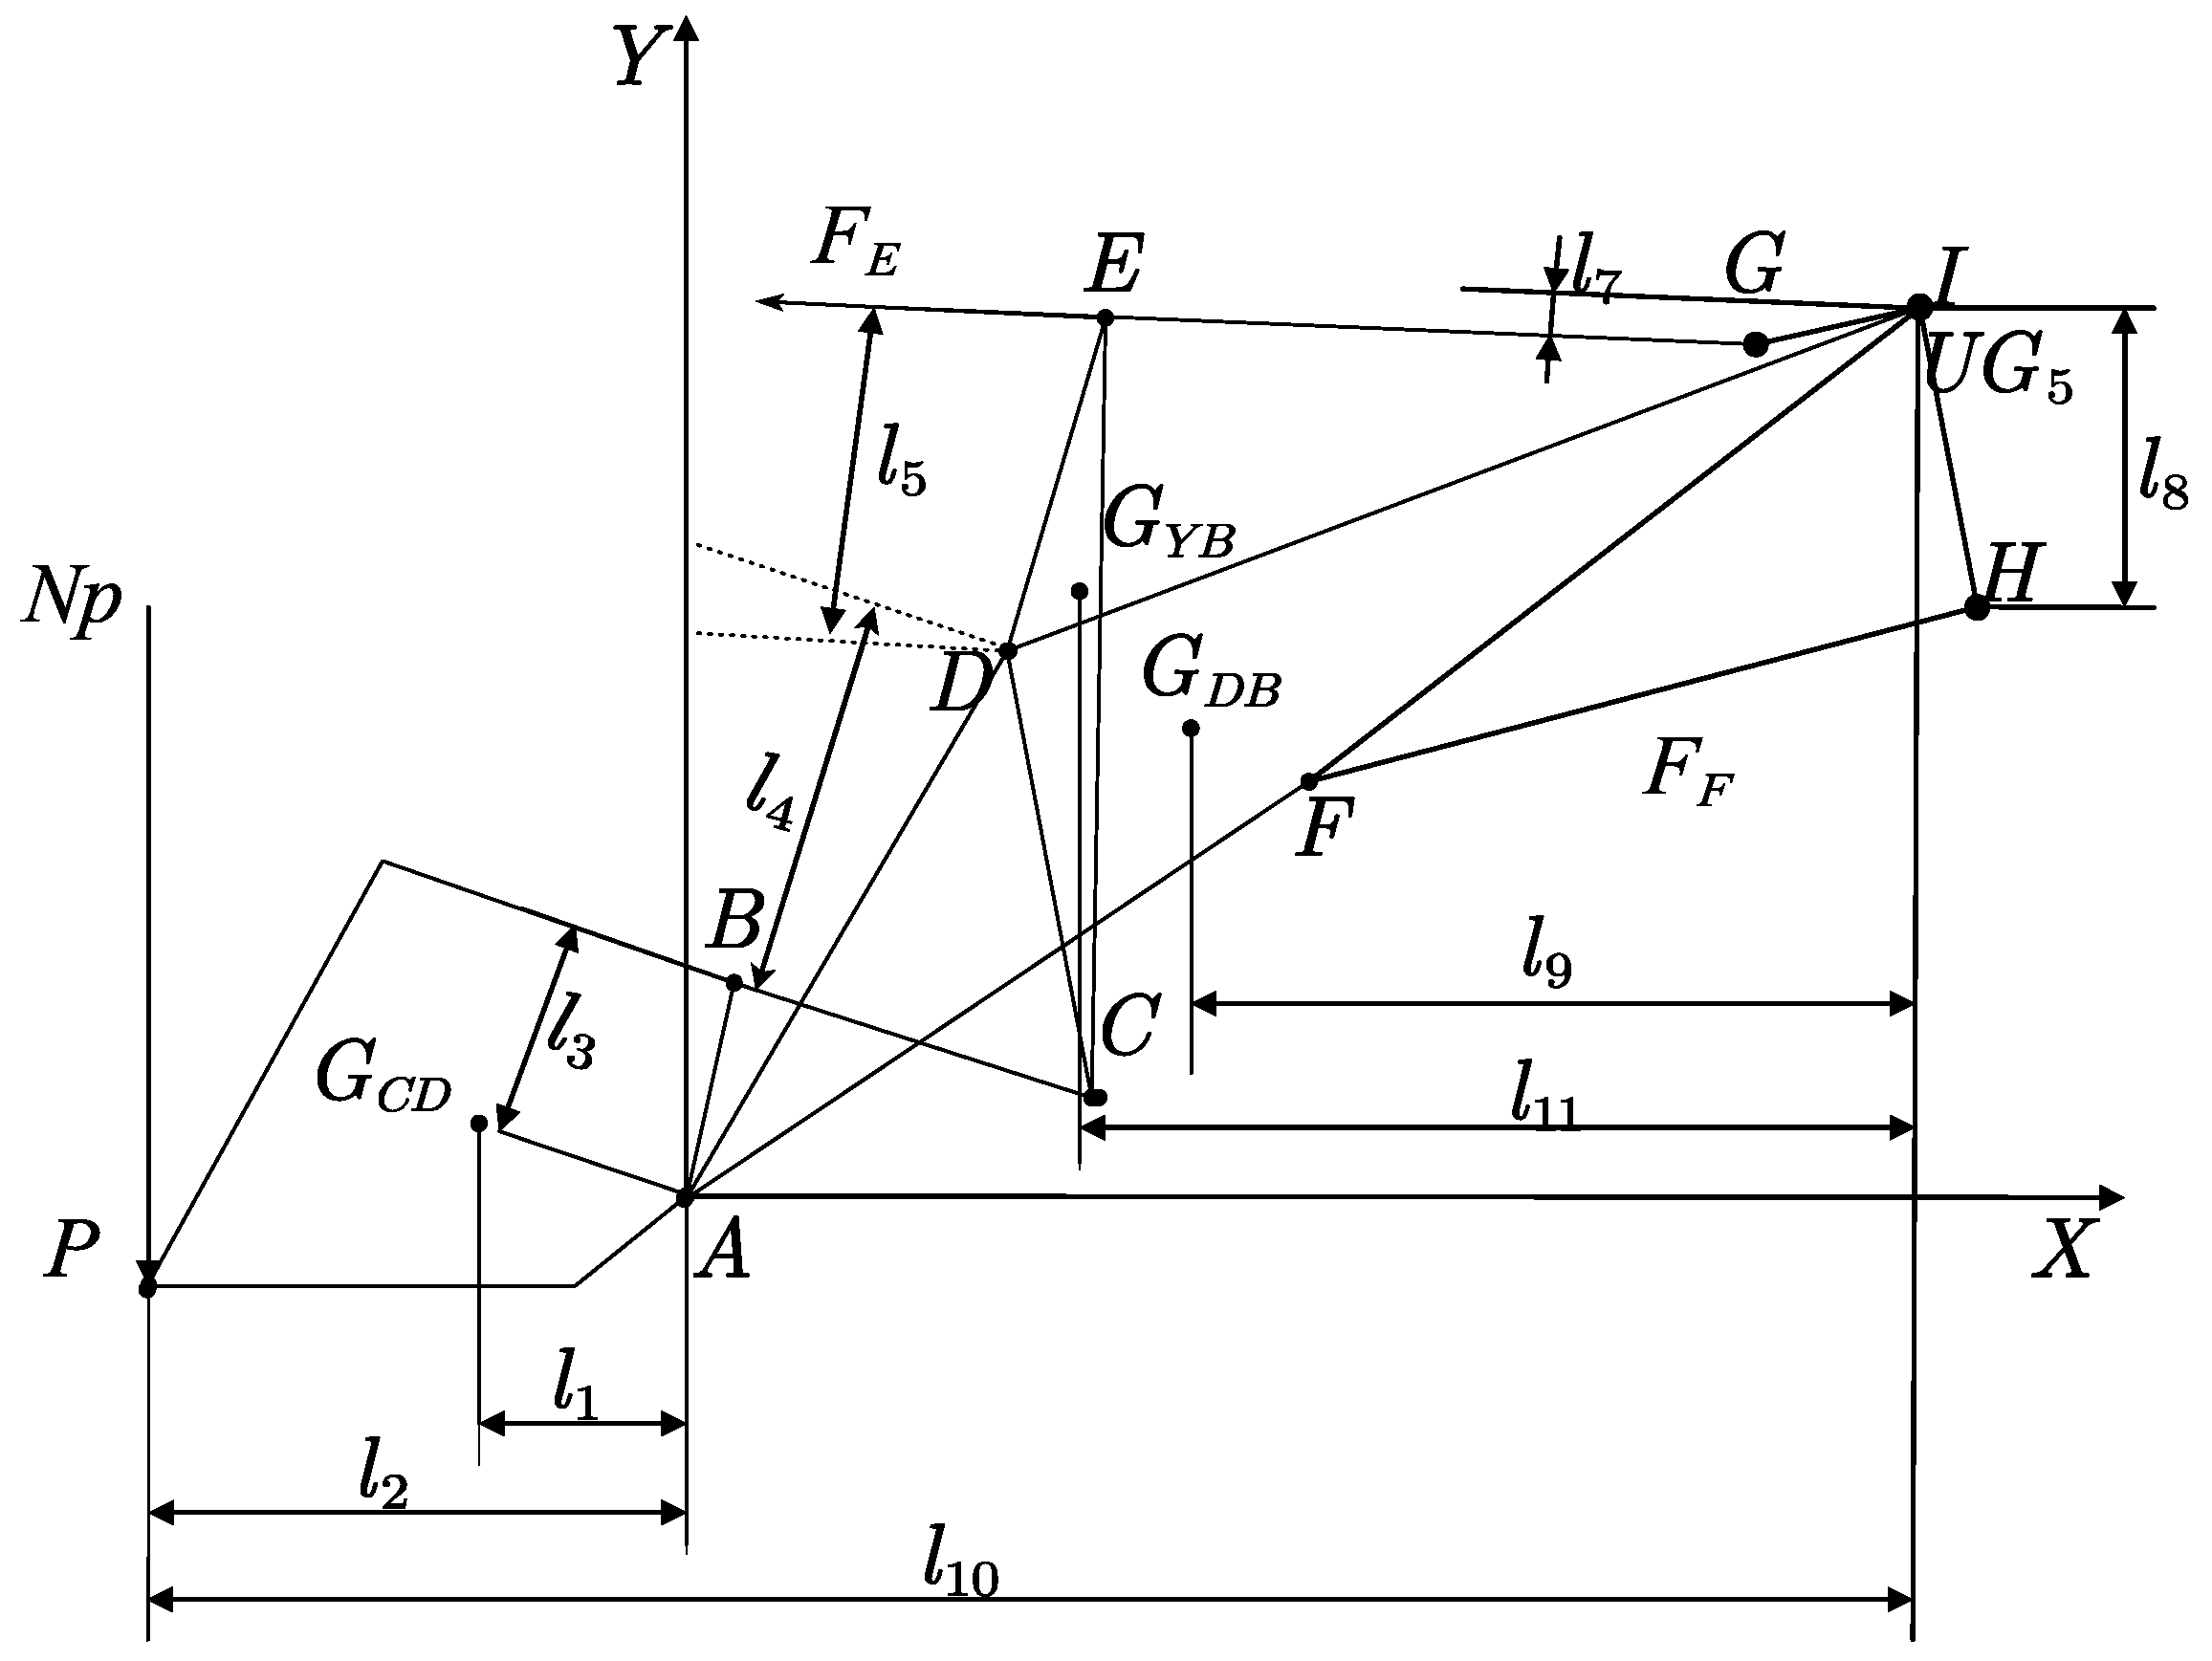
2.2. Kinematic Model
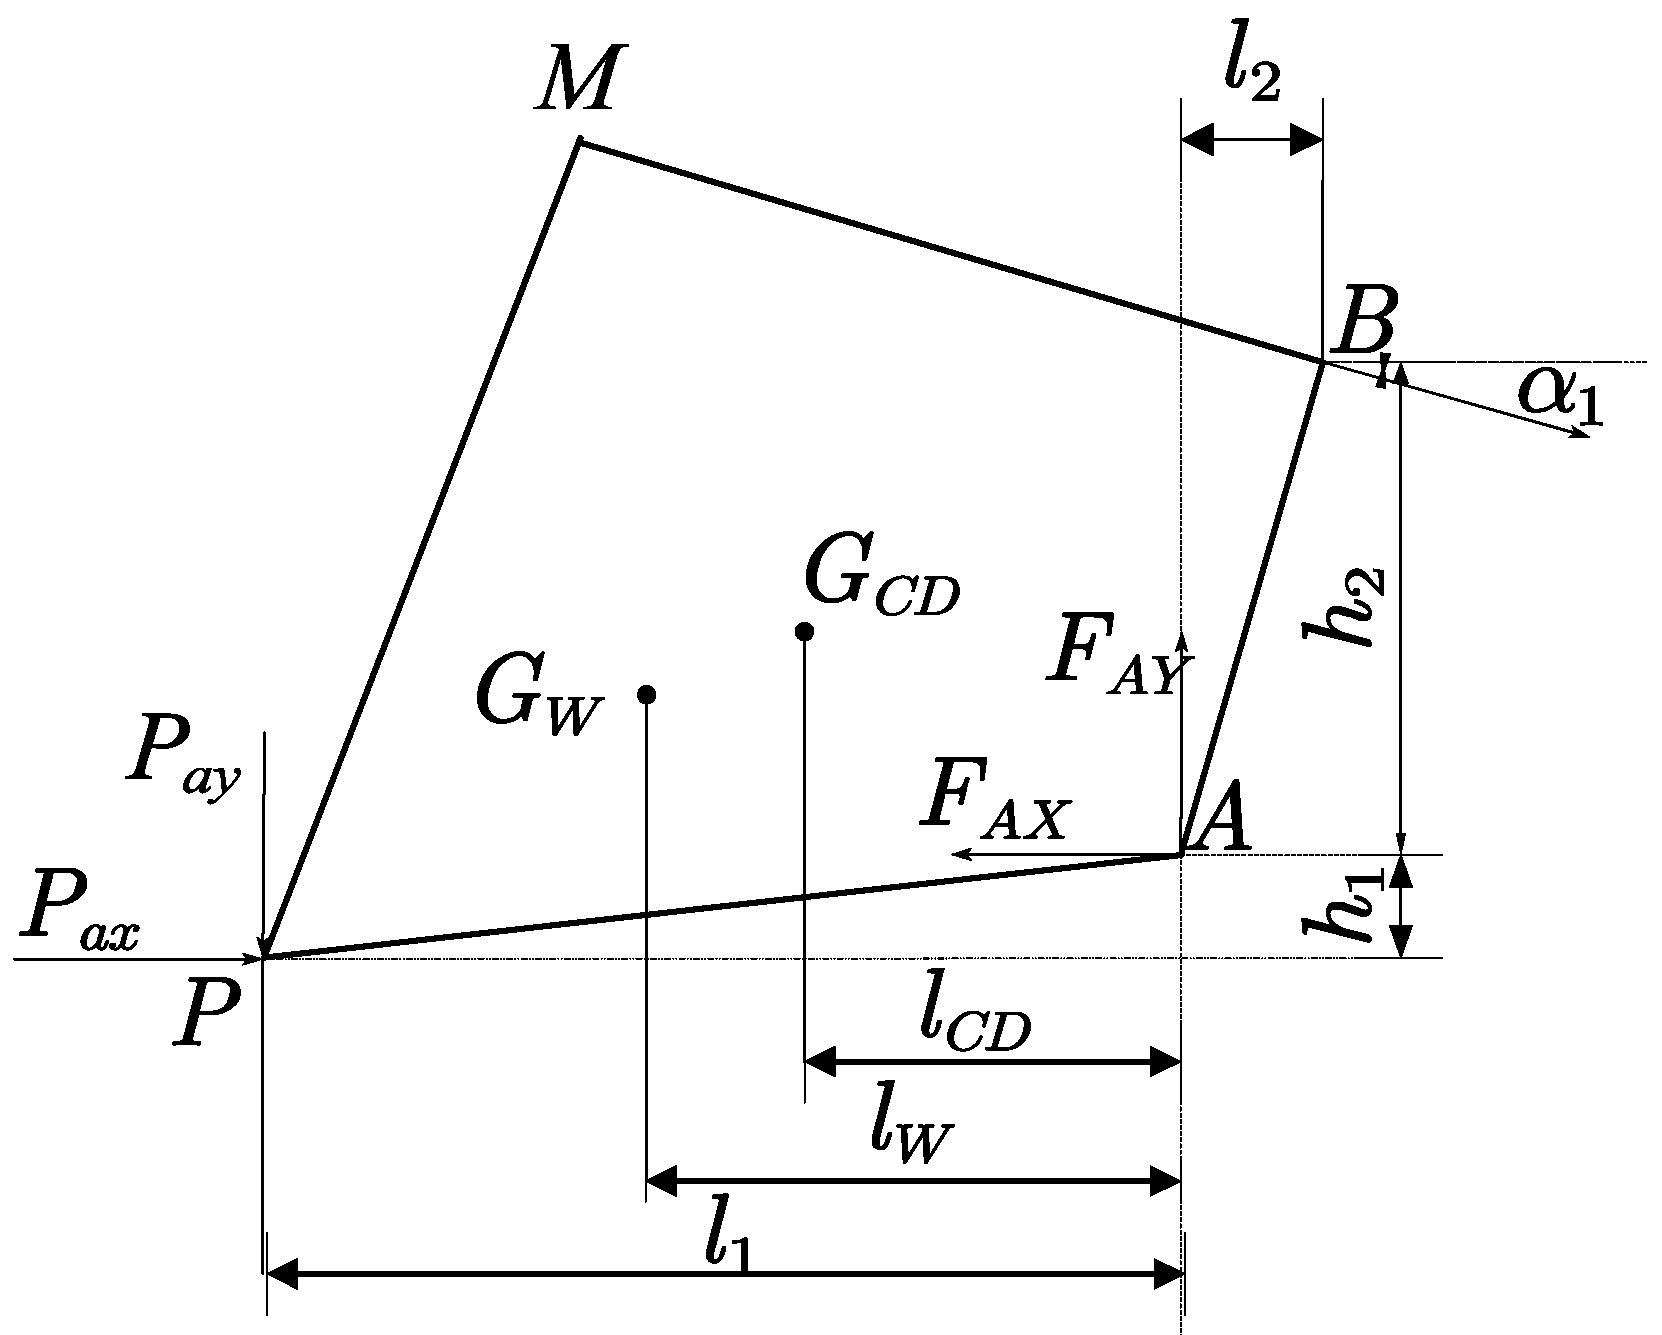
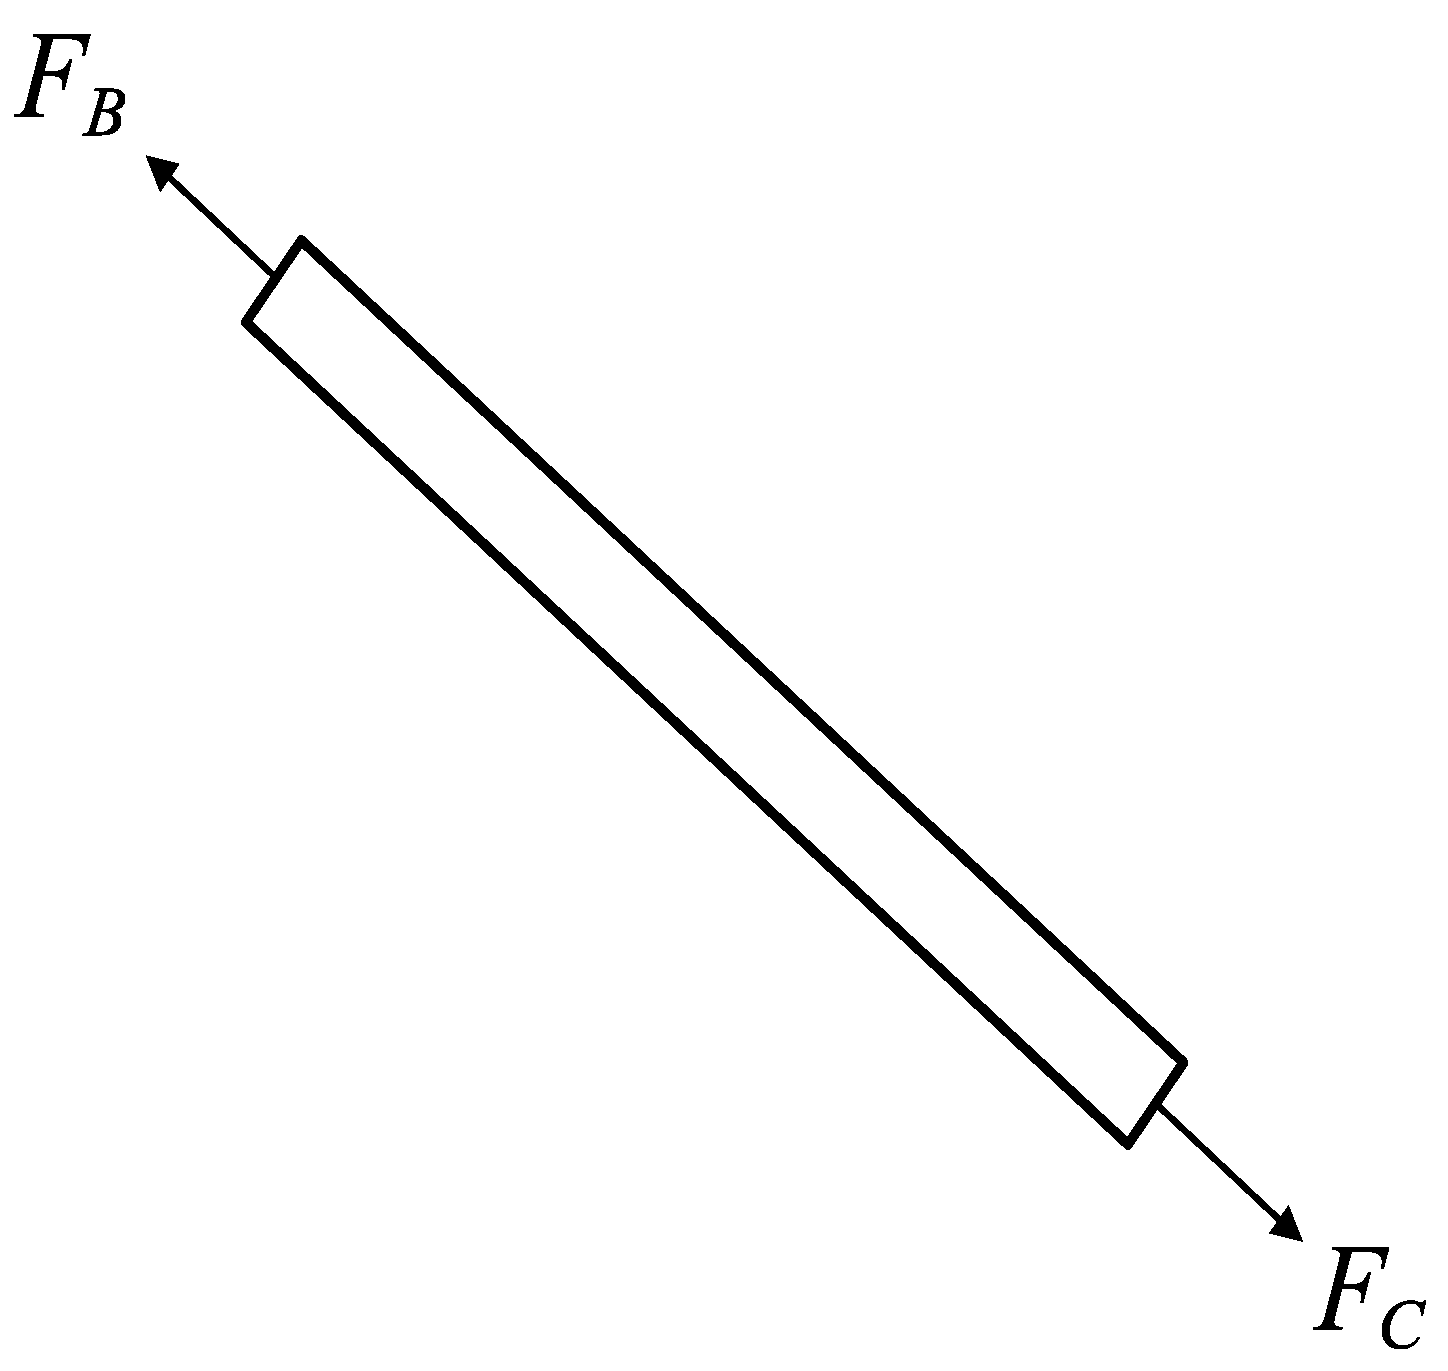
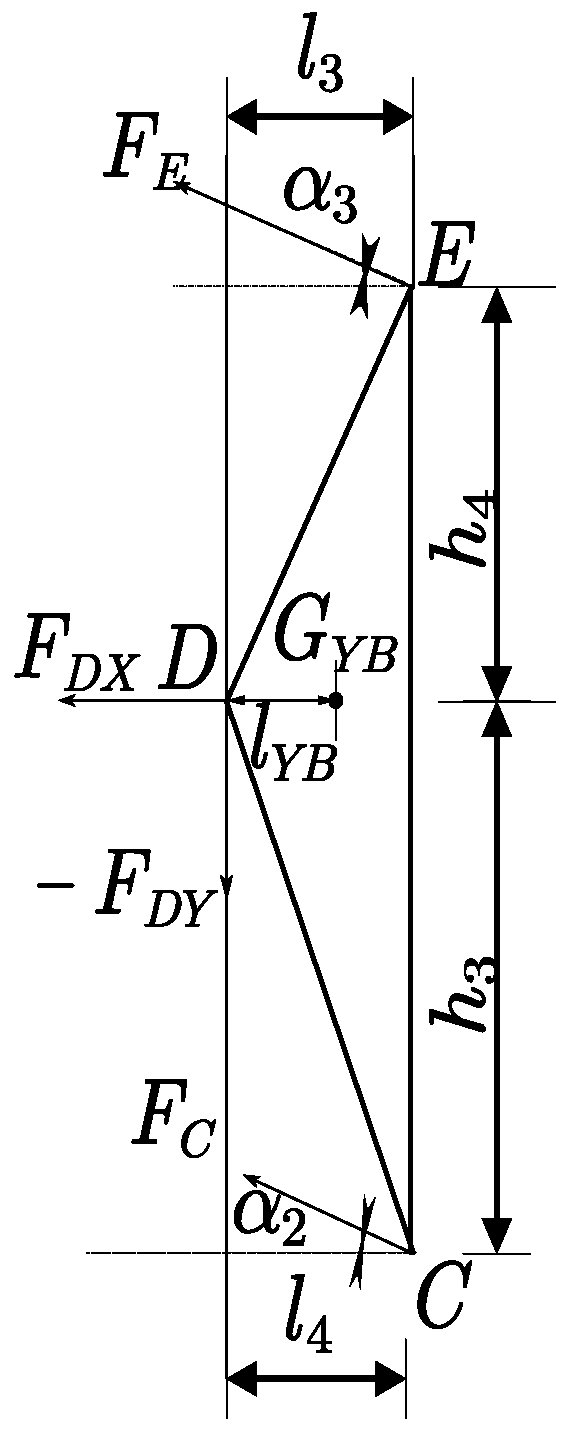
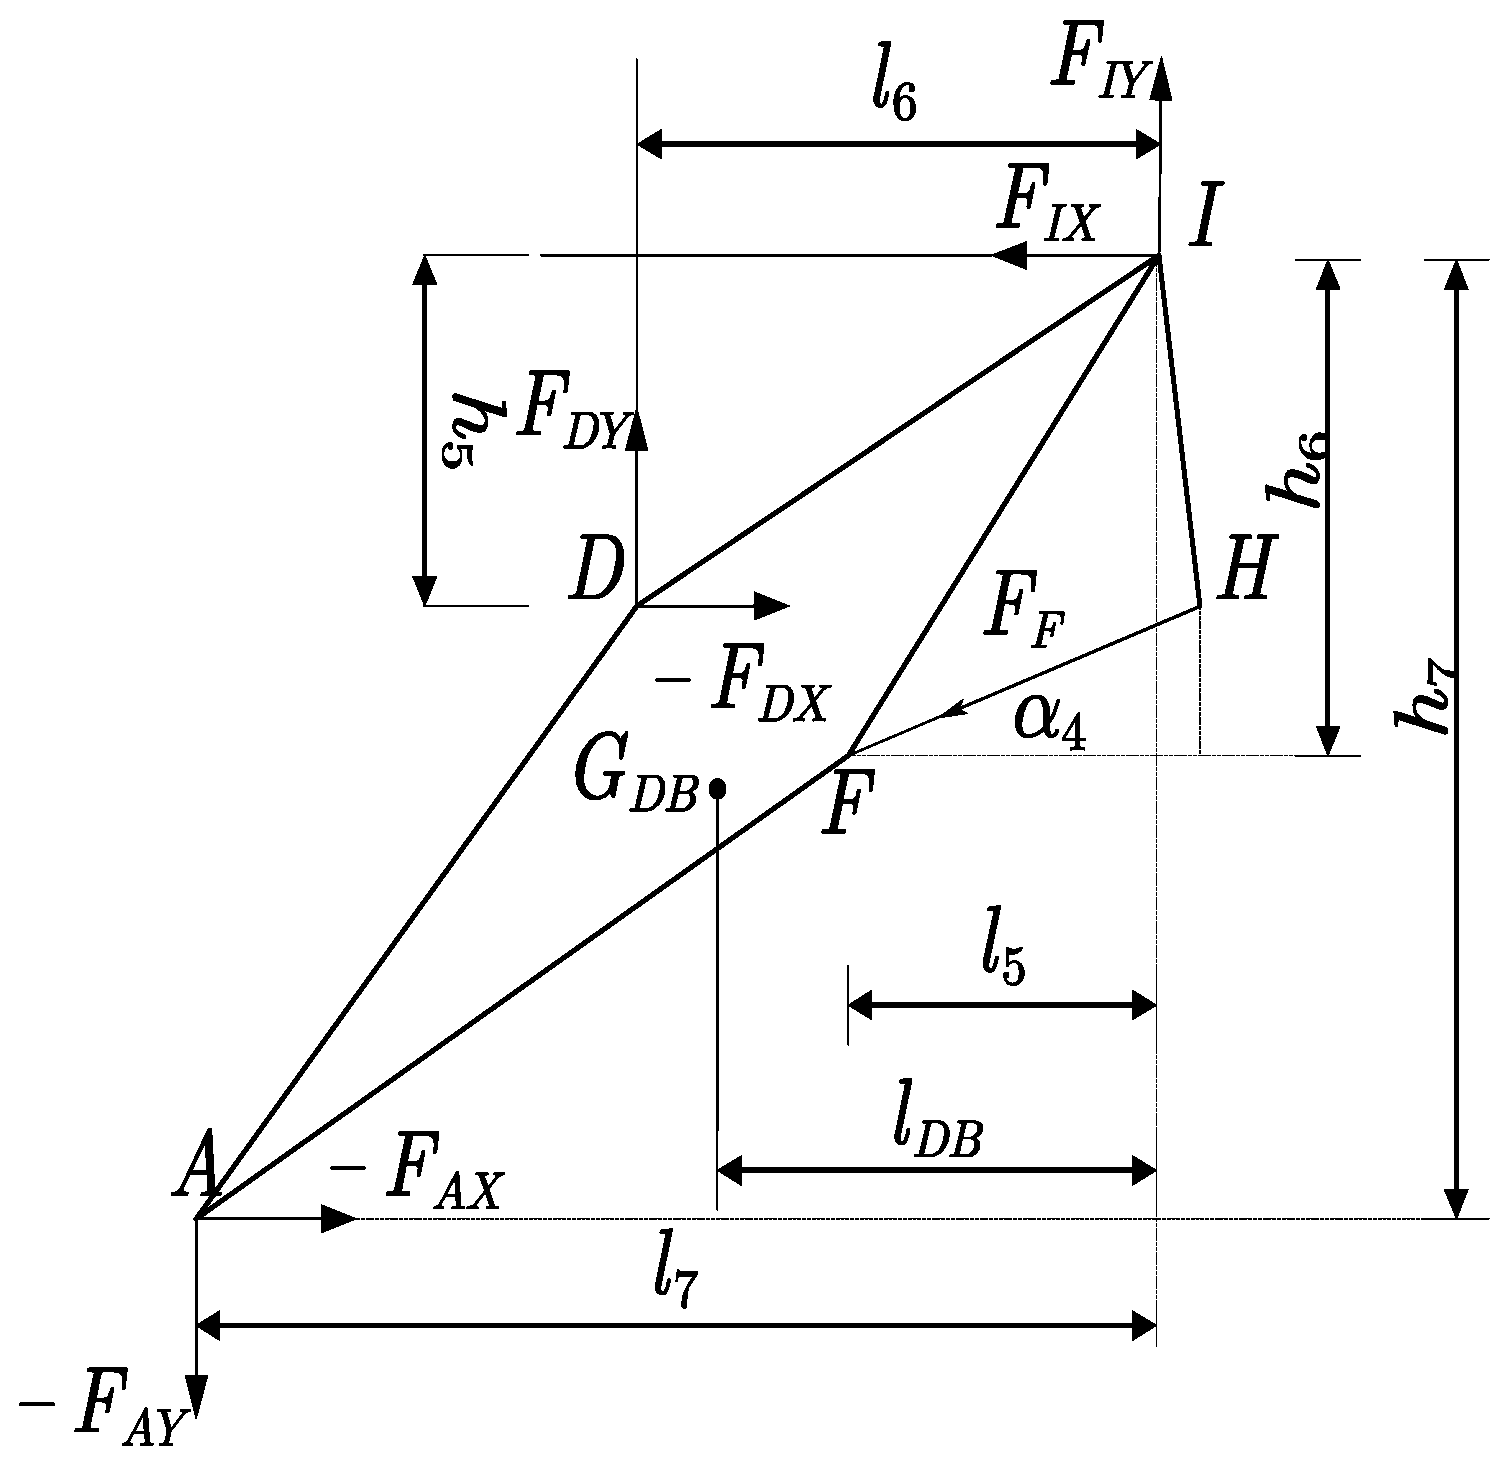
The kinematic model of the loader’s working device is simplified, as shown in Figure 2. A–I represent the 9 hinge points of the working device. HF and GE are the hydraulic cylinders of the boom and the bucket, respectively. AB is the bucket, BC is the connecting rod, EDC is the rocker arm, ADIF is the boom, and GIH is the frame. α 1 , α 2 , α 3 , and α 4 are the radian systems of the FIH, GID, EDI, and ADC angles, respectively, at the initial position of the working device.
In order to study the motion characteristics of the reversed working device during the working cycle, in the analysis of the kinematic model, the working device was divided into three parts: the three-bar mechanism (FIH), the double-rod mechanism (DEGI), and the crank–rocker mechanism (ABCD).
The three-bar mechanism (FIH) is shown in Figure 3. The boom angle α 1 ( F I H ) is determined based on the input boom cylinder length ( H F ).
F I H = arccos ( ( H I 2 + I F 2 H F 2 ) / ( 2 H I I F ) )
The dual-rocker arm mechanism (DEGI) is shown in Figure 4. Based on the input bucket cylinder length GE and the bucket rotation angle α 2 ( G I D ), the value of α 3  (EDI) can be calculated.
D I F = arccos ( I D 2 + I F 2 D F 2 ) / ( 2 I D I F )
G I H = arccos G I 2 + I H 2 G H 2 / 2 G I I H
G I D = G I H F I H D I F
G D = ( G I 2 + I D 2 2 G I I D cos ( G I D ) )
E D G = arccos ( G D 2 + D E 2 G E 2 ) / ( 2 G D D E )
G D I = arccos ( G D 2 + I D 2 G I 2 / ( 2 G D I D )
E D I = E D G + G D I
The crank–rocker mechanism (ABCD) is shown in Figure 5. Based on the relationship between the boom and the rocker arm, α 4  ( A D C ) can be calculated. α 1 an then be used as the input to the crank–rocker mechanism to compute the bucket angle.
C D E = arccos ( ( D E 2 + C D 2 C E 2 ) / 2 D E C D )
A D I = arccos ( I D 2 + A D 2 I A 2 ) / ( 2 I D A D )
When GID > 0, the calculation formula of ADC is
A D C = E D G + G D I + A D I C D E
When GID ≤ 0, the calculation formulas of ADC are
A D C = E D G G D I + A D I C D E
A C = ( A D 2 + C D 2 2 A D C D cos ( A D C ) )
D A C = arccos ( A C 2 + A D 2 C D 2 ) / ( 2 A C A D )
B A C = arccos ( A B 2 + A C 2 B C 2 ) / ( 2 A B A C )
B A D = B A C D A C
D A F = arccos ( A D 2 + A F 2 D F 2 ) / ( 2 A D A F )
B A F = B A D + D A F
U ( Bucket   Angle ) = ( ( F I H α 1 ) ( B A F α 2 ) ) ( 180 / π )

2.3. Force Analysis

The working device is essentially a complex multi-link mechanism constituting a spatial statically indeterminate system. It is quite challenging to accurately analyze the force conditions at each hinge point, and so this mechanism needs to be reasonably simplified. To this end (i.e., to simplify the statically indeterminate mechanism), the following assumptions are made: Assume that the bucket and the boom crossbeam will not interfere with the force and deformation of the components of the working device. Set the rotation axes of the boom, the rocker arm, and the connecting rods to be coplanar.
Based on the above assumptions, in this paper, the working device is divided into four functional components: the bucket, connecting rod, rocker arm, and boom. Each component is analyzed individually in terms of force conditions to determine the forces acting on the key hinge points A, B, C, D, E, F, and I. Here, l 1 l 7 and h 1 h 7 represent the moment arm lengths corresponding to each hinge point; P A X and P A Y denote the external loads; F A F I are the forces at each hinge point; and G C D , G Y B , and G D B represent the masses of the bucket, rocker arm, and boom, respectively.
The bucket is separated from the overall working device and analyzed as an independent component. Subsequently, a detailed force analysis is conducted on the bucket based on the principles of force equilibrium and moment equilibrium, as illustrated in Figure 6.
From M A = 0 , F X = 0 , and F Y = 0 ,
P A X h 1 + P A Y l 1 F B h 2 cos α 1 F B l 2 sin α 1 + G C D l 1 = 0
P a x F B cos α 1 + F A X = 0
F A Y F B sin α 1 P a y G c d = 0
The forces at points A and B can be obtained as
F B = P a x h 1 + P a y l 1 + G C D l 1 l 2 sin α 1 + h 2 cos α 1
F A X = P a x + F B cos α 1
F A Y = P a y + F B sin α 1 + G C D
The connecting rod is also analyzed separately from the entire working device. Given that the connecting rod is a two-force member, the reaction forces at its two hinge points are of the same magnitude but opposite in direction, as shown in Figure 7.
F B = F C
The rocker arm is also separated from the entire working device for independent analysis. Then, using the principles of torque and force balance, a detailed analysis of the forces acting on the rocker arm is conducted, as shown in Figure 8.
v F E = F C h 3 cos α 2 F C l 4 sin α 2 + G Y B l 4 h 4 cos α 3 + l 3 sin α 3
F D X = F C cos α 2 F E cos α 3
F D Y = F C sin α 2 + F E sin α 3 G Y B
The boom is analyzed mechanically as an independent component. Based on the basic principles of torque and force balance, a force analysis model can be established for the boom, as shown in Figure 9.
F F = F A X h 7 + F A Y l 7 + F D X h 5 F D Y l 6 + G D B l 9 h 6 cos α 4 l 5 sin α 4
F I X = F D X F F cos α 4 + F A X
F I Y = F A Y + F F sin α 4 F D Y + G D B
Among these,
α 1 = arctan ( y B y C ) / ( x B x C ) x B x C α 1 = π + arctan ( y B y C ) / ( x B x C ) x C < x B
α 2 = α 1
α 3 = arctan ( y E y G ) / ( x E x G ) x E x G α 3 = π + arctan ( y E y G ) / ( x E x G ) x G < x E
α 4 = arctan ( y F y H ) / ( x F x H )

2.4. Performance Model

As shown in Figure 10, upon analyzing the key performance of the loader’s six-link working device in detail, it is revealed that the positions of the hinge points have significant impacts on multiple key performance indicators. These performance indicators include three major forces (ground excavation force, ground lifting force, and high-position lifting force), the transmission angle, the unloading height, and the digging depth.
In the figure, R 11 is the radius of the front wheel tire, X J is the horizontal distance from the center of the tire to point I, H 1 is the vertical distance from shovel tip P to the ground, L 1 is the distance from the shovel tip to the front end of the wheel, H 3 is the horizontal distance from point A to shovel tip P, Y 3 is the horizontal distance from point A to the horizontal ground, and D is the length of AP and the angle between the bottom end of the bucket and AP.
(1) Three forces.
As illustrated above, the hinge points of the loader’s working mechanism influence the lengths of the force arms, thereby directly affecting the loader’s three principal forces. By applying the principles of moment and force equilibrium, the corresponding formulas for these forces can be derived. The definitions of the respective force arm lengths are provided in Figure 11.
N 1 = ( F E l 5 l 3 ) / l 4 G C D l 1 l 2
N 2 = G C D l 1 l 4 l 7 l 3 l 5 + F F l 8 G D B l 9 G Y B l 11 G C D l 12 l 10 l 2 l 4 l 7 / l 3 l 5
N 3 = G C D l 1 l 4 l 7 l 3 l 5 + F F l 8 G D B l 9 G Y B l 11 G C D l 12 l 12 l 1 l 4 l 7 / l 3 l 5
(2) Minimum transmission angle—The minimum transmission angles of ∠ABC, ∠BCD, ∠DEG are calculated as follows:
A B C = a r c c o s ( ( A B 2 + B C 2 A C 2 ) / ( 2 A B B C )
A C B = a r c c o s ( ( A C 2 + B C 2 A B 2 ) / ( 2 A C B C )
A C D = a r c c o s ( ( A C 2 + C D 2 A D 2 ) / ( 2 * A C * C D ) )
B C D = a r c c o s ( A C D A C B ) ( 180 / π )
D E G = a r c c o s ( ( D E 2 + G E 2 G D 2 ) / ( 2 D E G E ) )
γ ( Minimum   transmission   angle ) = m i n [ A B C , B C D , D E G ]
(3) Unloading height—The height from the lower hinge point of the boom to the ground when the boom is at maximum lifting height can be calculated as follows:
C 1 = Y 3 2 + H 3 2
D 1 = arctan ( Y 3 / H 3 )
H 1 = A I sin F I H H I Y π / 2 + Y G C 1 sin D 1 + π / 4
(4) Unloading distance—The distance between the lower hinge point of the boom and the front wheel when the boom cylinder is fully extended can be calculated as follows:
L 1 = A I cos ( F I H H I Y π / 2 ) + C 1 cos ( D 1 + π / 4 ) X J R 11
(5) Digging depth—The height between the lower hinge point of the boom and the ground when the boom cylinder is fully retracted can be calculated as follows:
H 2 = Y 3 C 1 sin ( D 1 )
(6) Automatic leveling—After high-position unloading, when the bucket cylinder is locked and the boom drops to the lowest point, the angle between the bottom of the bucket and the horizontal plane can be calculated as follows:
A = f ( H min )
(7) Fork translation—To calculate this value, the bucket cylinder is adjusted. The fork is adjusted to be balanced with the ground and lifted to the maximum limit of the boom and the maximum change in the machine angle.
H C = | C max | | C min |
(8) When the bucket cylinder is extended to the ground-level bucket dumping posture, and the boom cylinder is extended to its maximum length, the bucket angle formula U used in the kinematic analysis is introduced.
U Tall = U ( G E Initial , H F M ax )
(9) When the boom cylinder is extended to any arbitrary position and the bucket cylinder is retracted to its shortest length, the bucket angle formula UUU used in the kinematic analysis is applied.
U R a n d o m = U ( G E M i n , H F R a n d o m )
(10) For the maximum transport height of the bucket against the block, the maximum value of ADC is entered; GE is the sum of the bucket cylinder installation distance and stroke.
D E I = A D C + C D E A D I
E I = D E 2 + I D 2 2 D E I D c o s ( E D I )
E I G = c o s ( ( E I 2 + G I 2 G E 2 ) / ( 2 E I G I ) )
E I D = cos ( ( E I 2 + I D 2 D E 2 ) / ( 2 E I I D ) )
G I D = E I D E I G
F I H = G I H G I D D I F
U G = F I H H I Y + A I F
H Y S = Y I I A c o s ( U G )
(11) The bucket cylinder angle is
E G X = a r c c o s ( ( X G X E ) / E G )
where X G and X E are the x-coordinates of points G and E, respectively.

3. Multi-Objective Optimization Design of the Working Device

3.1. Selection of the Design Variables

The size of each component of the working device’s mechanism and their relative positions can determine the form of this mechanism. The positions of the bucket, connecting rod, rocker arm, boom, and frame can all be used as variables in optimization design. Point I is a fixed point and is not used as a design variable. Therefore, the 16 coordinates of the 8 hinge points of the six-bar linkage are used as design variables. In addition, the stroke and installation distance of the boom cylinder and bucket cylinder are also used as design variables. The design variables are expressed in vector form:
P = [ X A , Y A , X B , Y B , X C , Y C , X D , Y D , X E , Y E , X F , Y F , X G , Y G , X H , Y H ]
X A ~ Y H are the coordinates of the hinge point; D B X C , D B A Z J , C D X C ,   and   C D A Z J represent the stroke and installation distance of the boom cylinder and bucket cylinder, respectively.

3.2. Objective Function and Constraints

The focus of this paper is to optimize the six-link hinge point of the loader. In order to ensure the loader’s overall stability and better adapt it to the working conditions, we take fork translation as the optimization target. However, usually, when fork translation is good, the horizontal angle between the bucket cylinder and the ground is too large, which will affect the field of view of the cab and cause the rocker arm to be too long, affecting the device’s performance in other areas. Therefore, the horizontal angle between the bucket cylinder and the ground is taken as another optimization target.
min f 1 ( X ) = H C ( Fork translation ) = | C m a x | | C min |
min f 2 ( X ) = E G X ( Bucket cylinderangle ) = a r c c o s ( ( X G X E ) / E G )
In order to ensure that the loader performs well, key performance indicators, such as the three forces, transmission angle, automatic leveling, unloading distance, unloading height, unloading angle at any position, digging depth, and maximum transport height of the bucket against the block, are taken as constraints. These constraint models are mentioned in the mathematical model in Section 2. The specific constraint values are as follows:
g 1 ( X ) = N 1 ( Ground   toreakout   force ) > 100 g 2 ( X ) = N 2 ( Ground   liff ) > 80 g 3 ( X ) = N 3 ( High   lifting   force ) > 50 g 4 ( X ) = γ ( Minimum   transmission   angle ) > 14 g 5 ( X ) = H 1 ( Unhoading   helght ) = 4350 g 6 ( X ) = I 1 ( Unotaling   distance ) = 412 g 7 ( X ) = U ( Buckethigh   angle ) > 57 g 8 ( X ) = U ( Discharge   angle   at   any   position ) > 45 g 9 ( X ) = A ( Automatic   paralle ) < 19 g 10 ( X ) = H 2 ( Digging   depth ) = 185 g 11 ( X ) = H Y S ( Maximum   transport   height   of   bucket   agasinst   block ) > 800

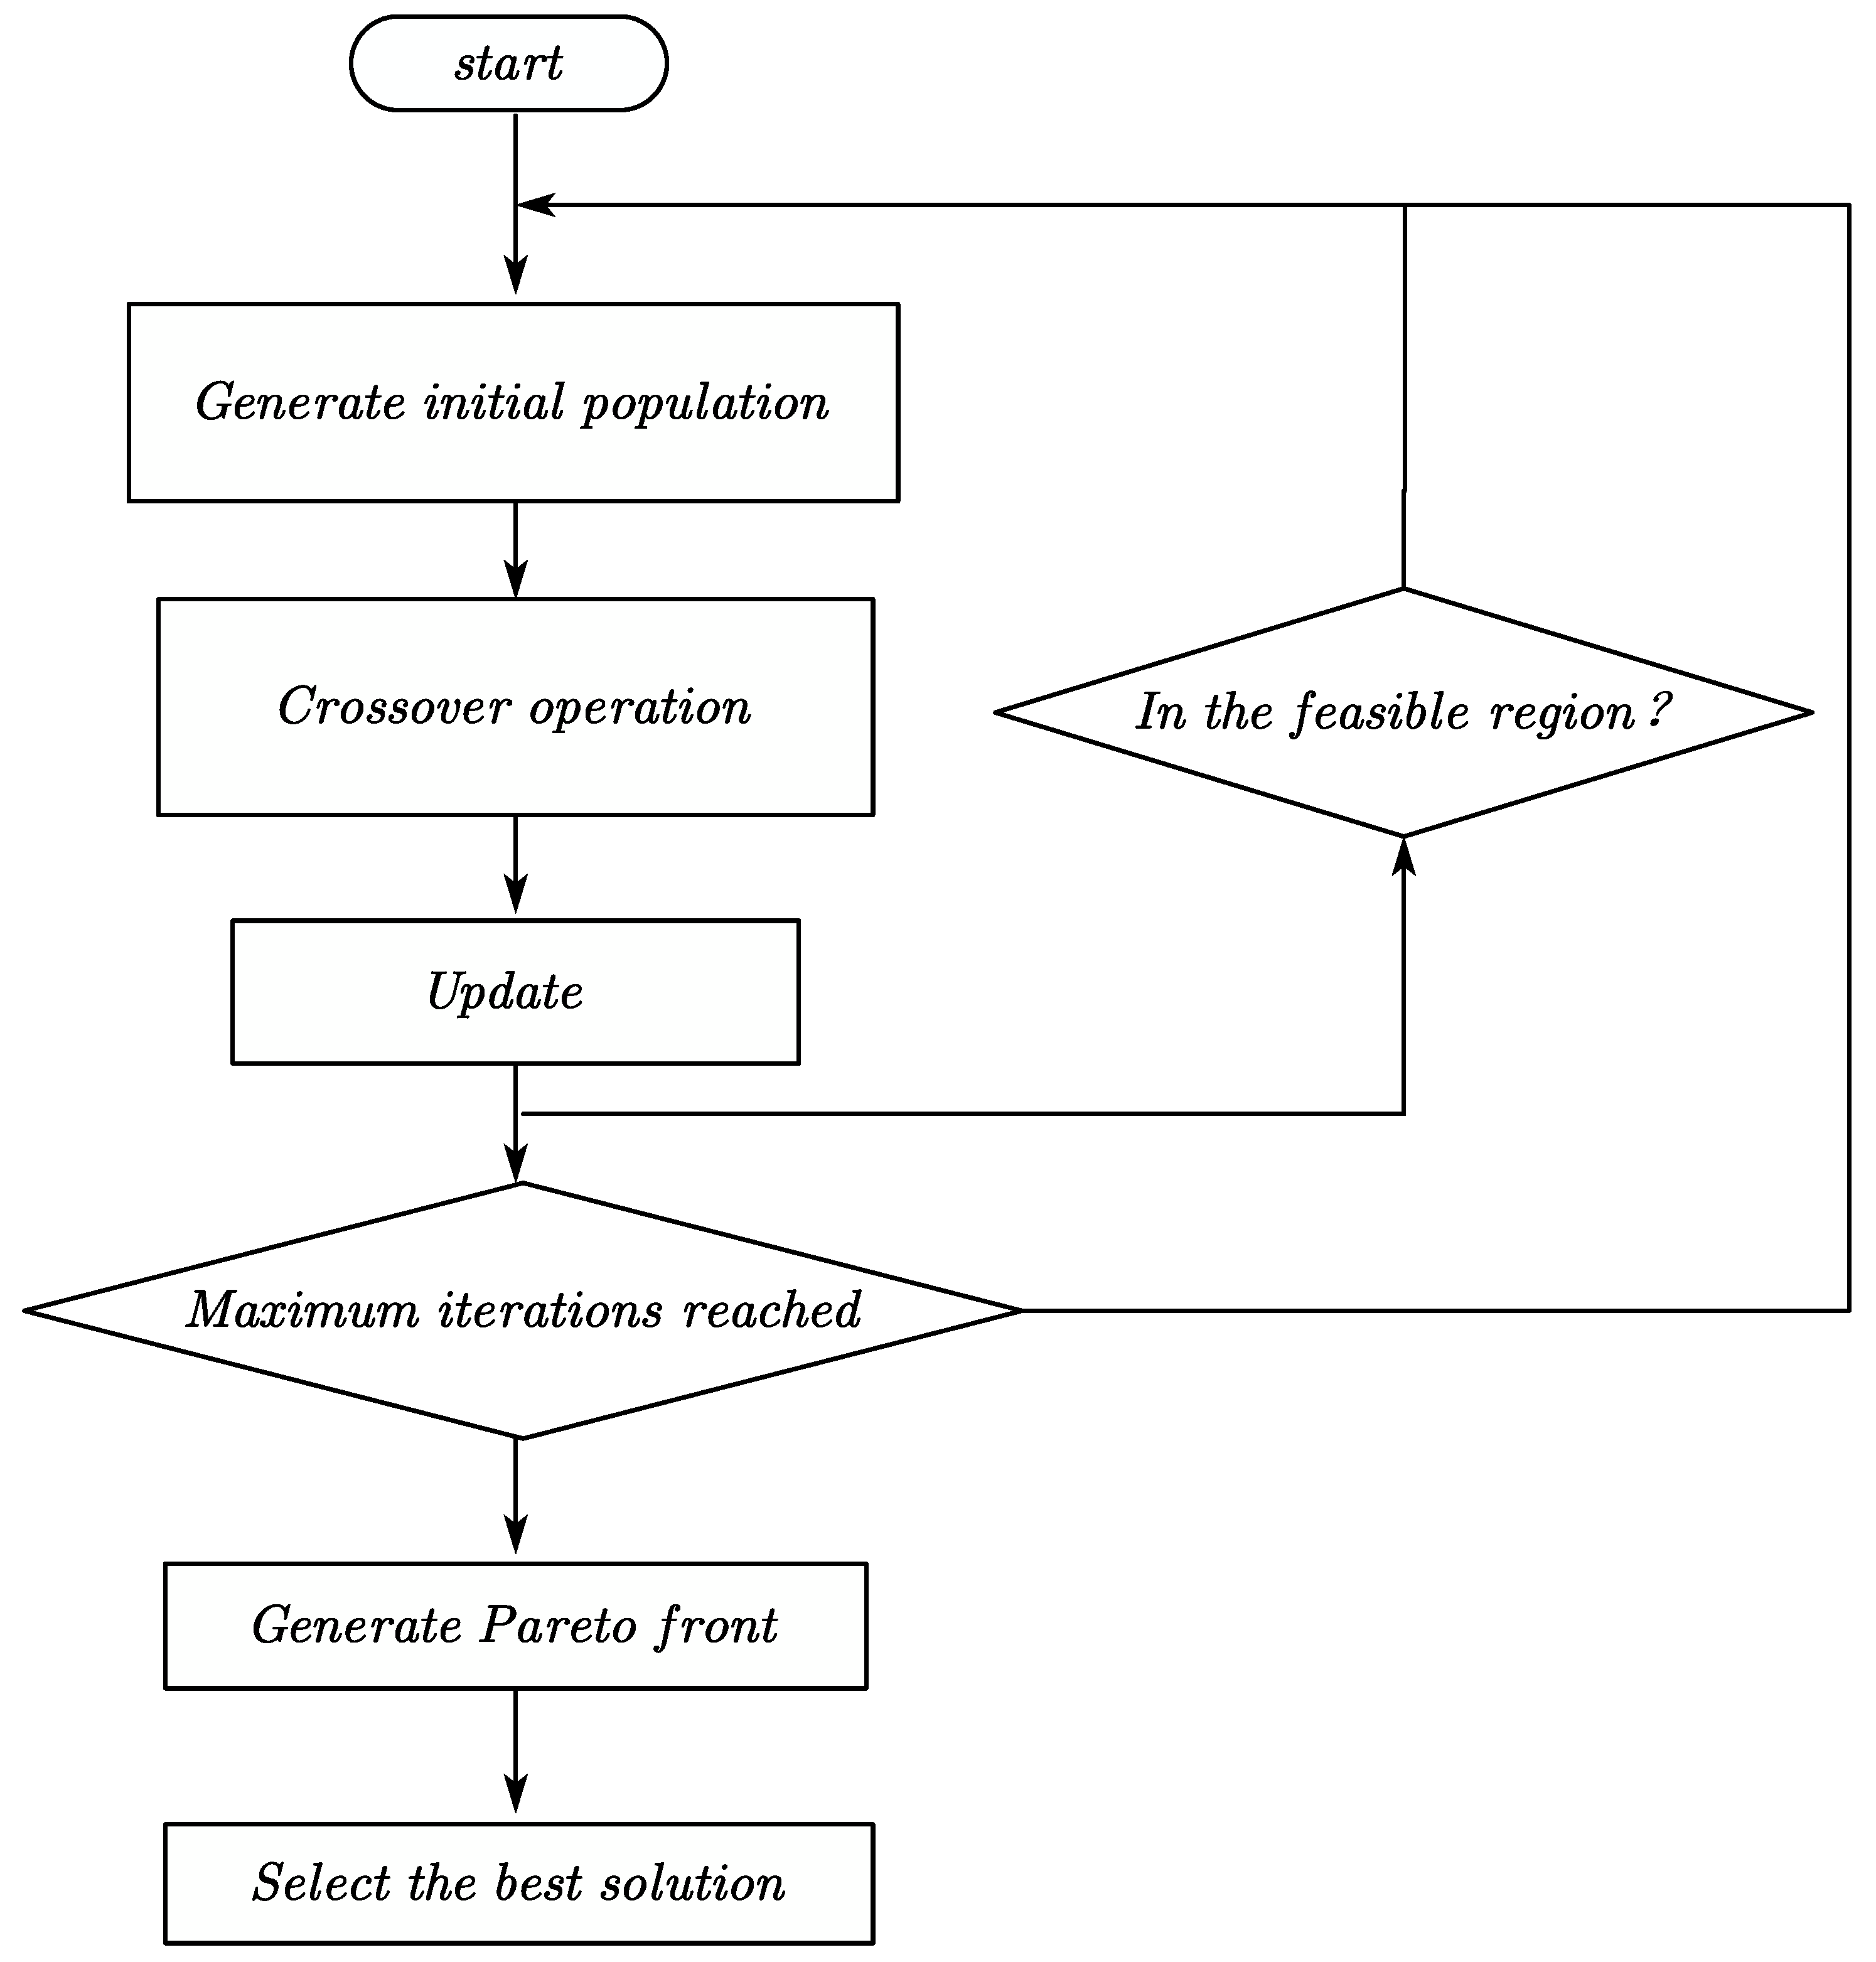
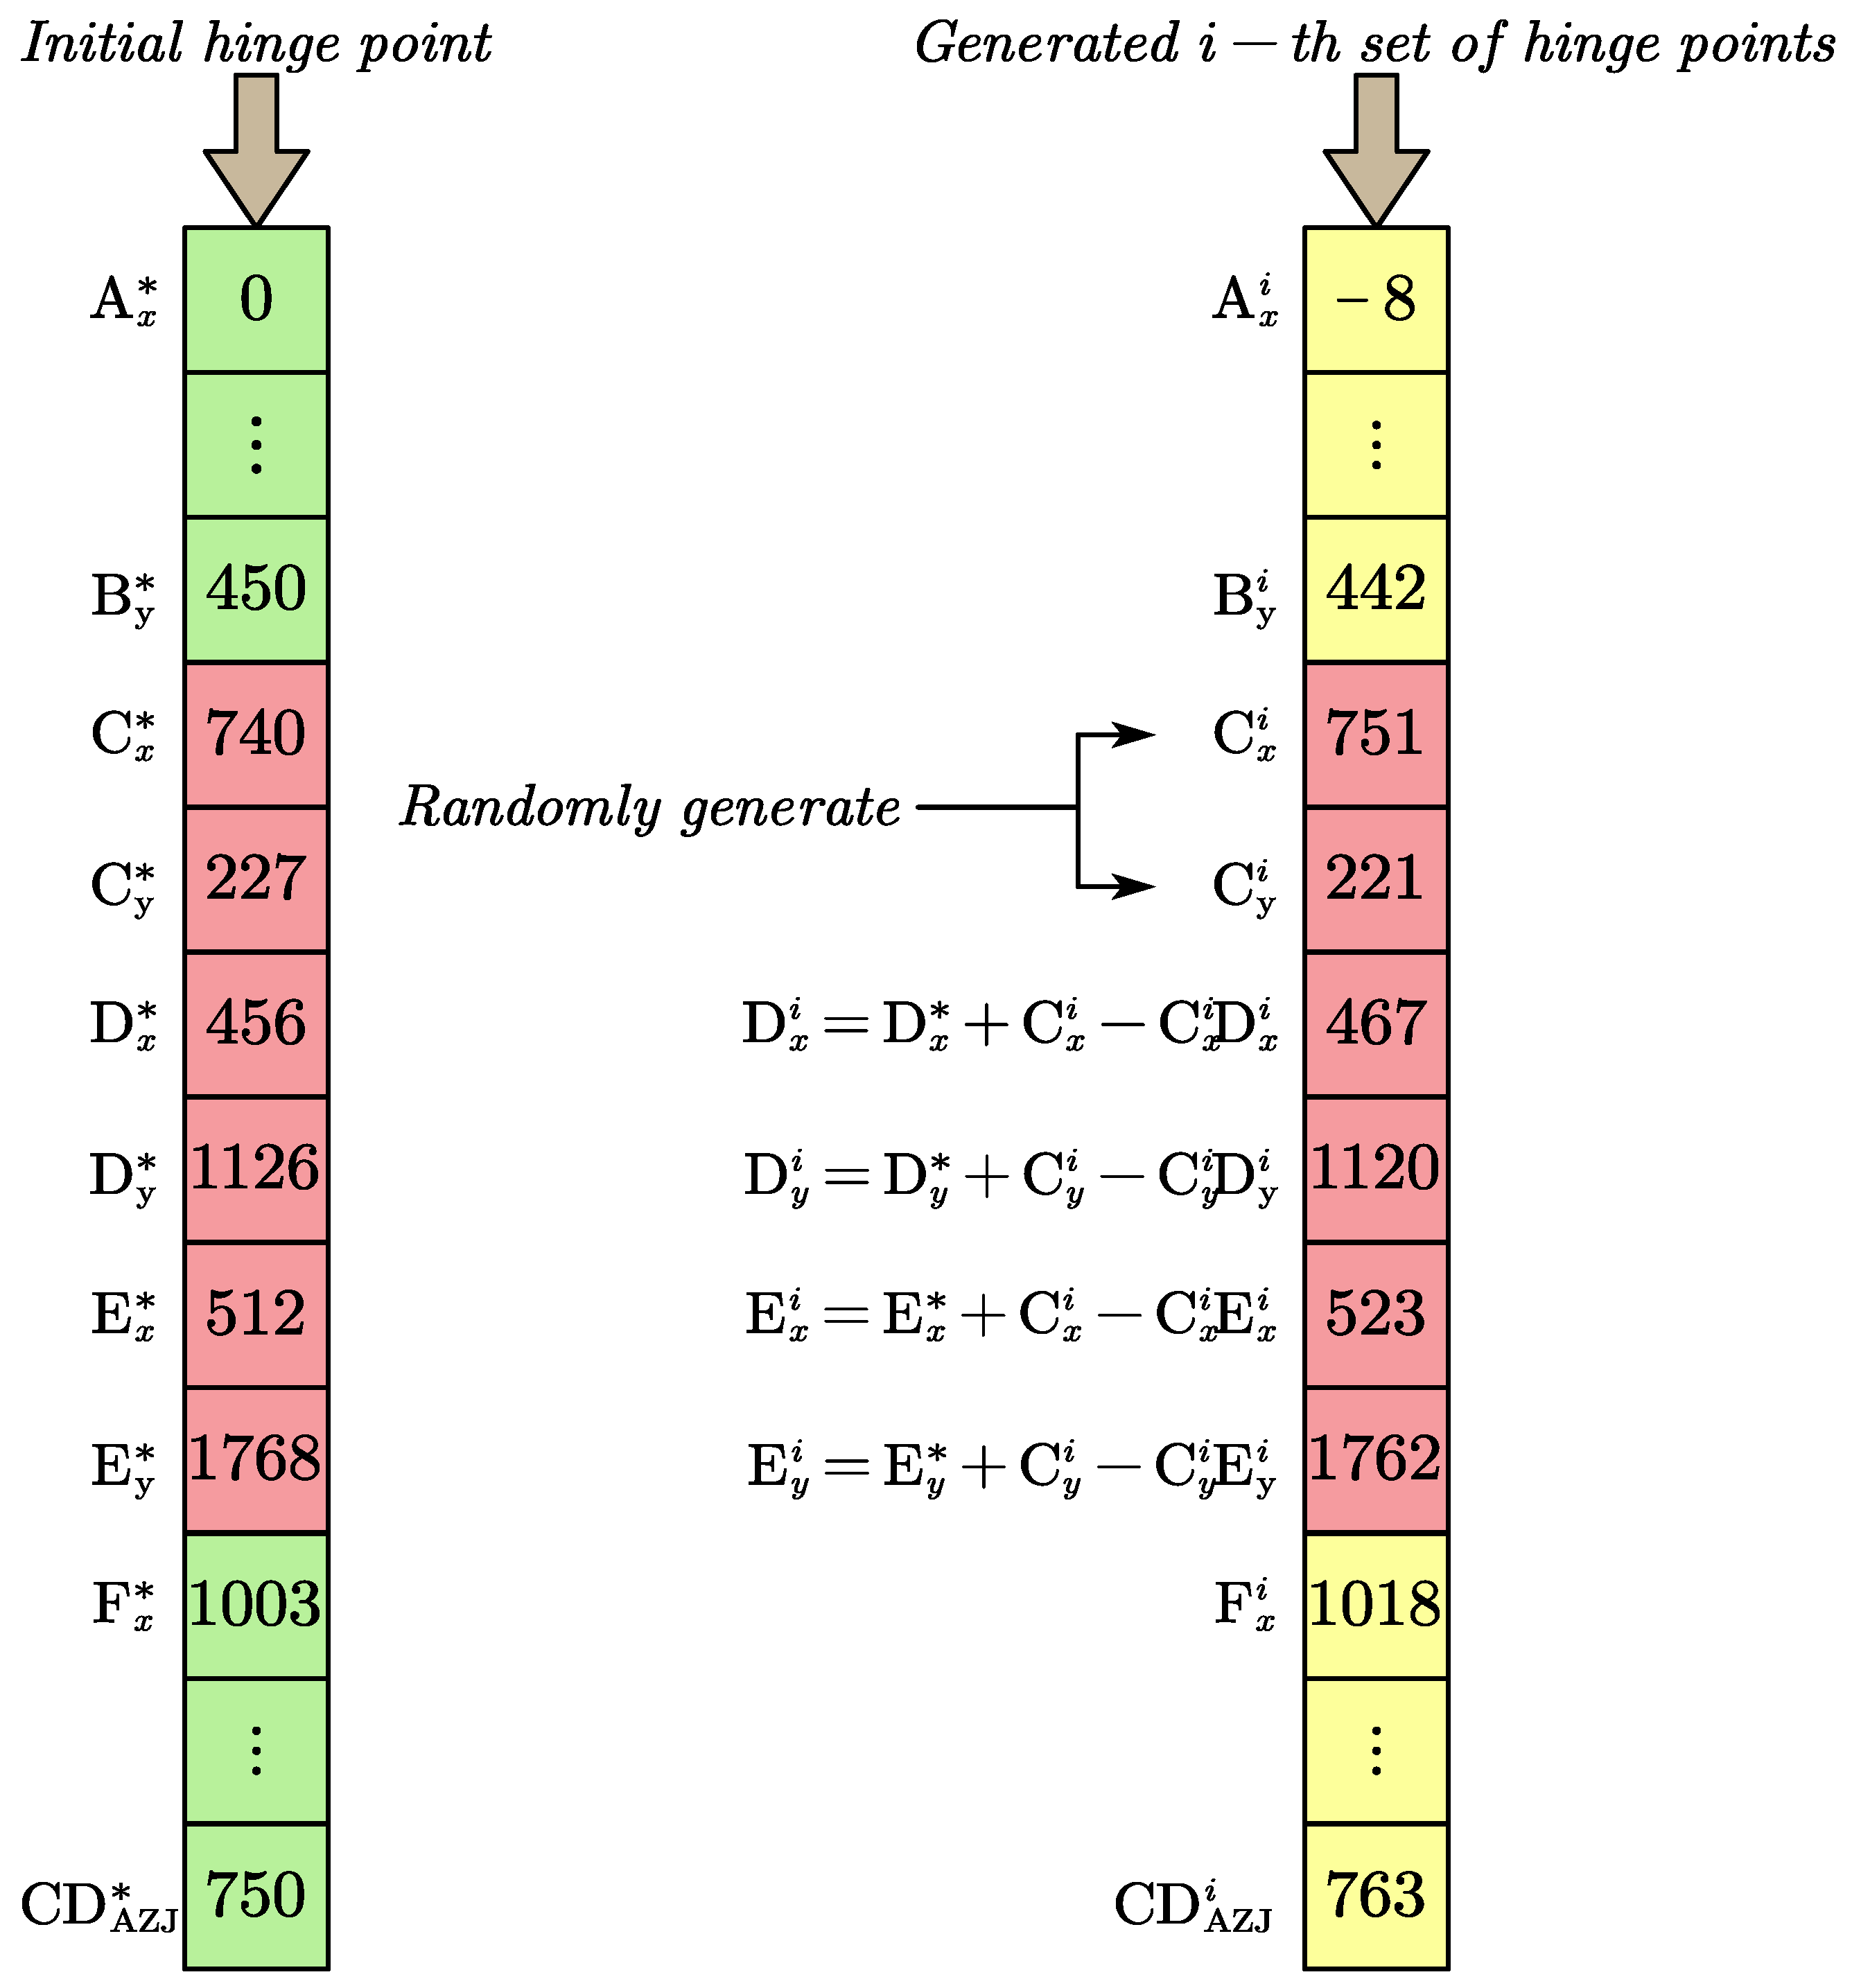
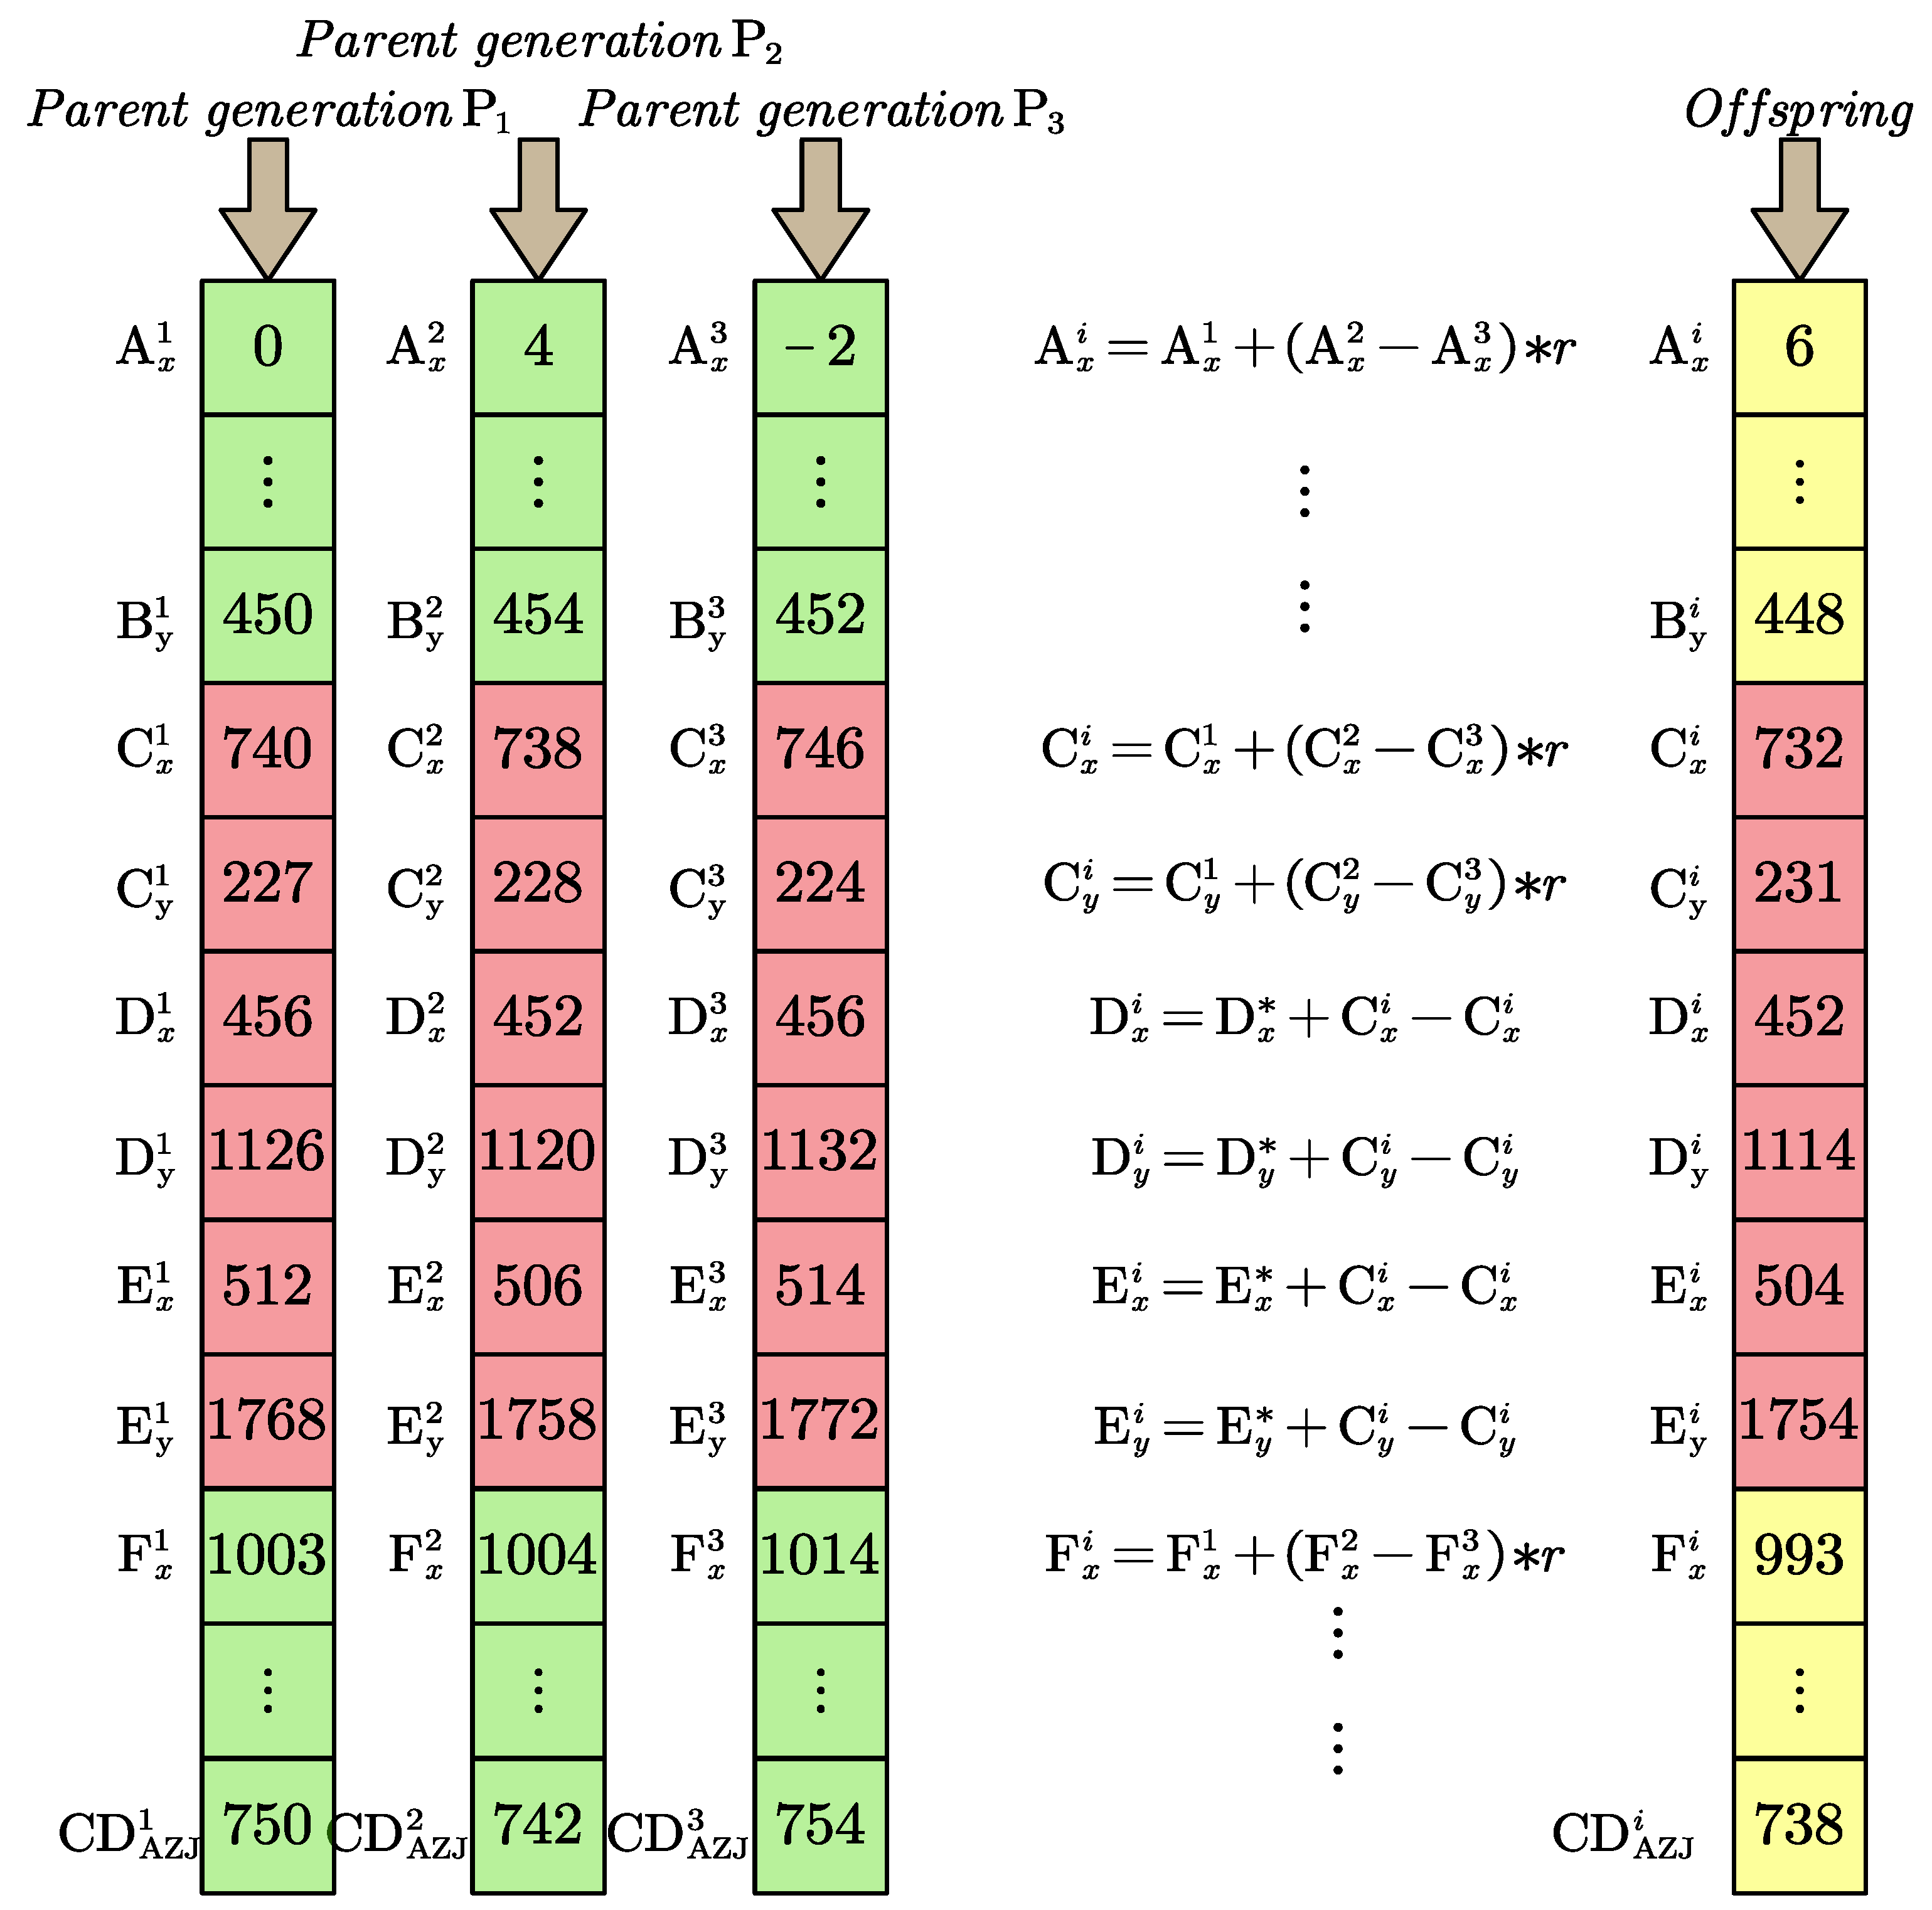
3.3. Improvement of the Optimization Algorithm

Genetic algorithms are optimization algorithms that simulate natural selection and genetic mechanisms. They represent solutions to problems as chromosomes through encoding, define fitness functions to evaluate the quality of the solutions, and then iteratively perform selection, crossover, and mutation operations: selection retains high-quality solutions, crossover combines genes to generate new solutions, and mutation introduces random disturbances to enhance diversity. Eventually, they gradually approach the optimal solution. Thus, they are widely applied in optimization problems. The optimization problem of the loader working device studied in this paper has relatively complex constraints. Traditional optimization algorithms will converge prematurely and slowly, with poor optimization effects on the population, making it very easy for individuals to jump out of the feasible domain during the optimization process. In order to make the optimization algorithm more suitable for the problem studied in this paper, the traditional genetic algorithm is upgraded by updating the particle speed and position in the particle swarm algorithm into the substitution mutation operation, improving the algorithm’s search ability. After the number of iterations meets the set number, the Pareto frontier is generated, and the itinerary plan is compared to select the best of the best. The overall process of the algorithm is shown in the Figure 12.
The algorithm first generates the initial population through random generation; it then operates on the initial population using an improved crossover method. Subsequently, it updates the population by applying the particle update process from the particle swarm optimization algorithm to further enhance its optimization capability. The algorithm checks whether the individual results are within the feasible region. If this is not the case during the process, it updates the individuals to be within the feasible region through the process of re-generation and re-crossover. After reaching the maximum number of iterations, the results are obtained based on the Pareto optimization method to obtain the Pareto front. The optimal solution is selected from the Pareto front. The specific process of the algorithm is as follows:
(1) Population size and quality.
To calculate the population quality coefficient, K can be expressed as the degree to which each individual violates the constraint condition. The smaller and more stable the K value, the higher the quality of the initial population. After calculating the individual quality coefficients of the population, the first half of population 1 is selected according to the size of the quality coefficient. Similarly, the first half of population 2 is selected, and the two are merged to form the initial population
K = i = 1 N | F M |
where F represents the value of the current constraint function; M represents the maximum or minimum value of the constraint condition; and N represents the number of constraints.
(2) Population generation method.
The population generation process is based on generating the initial hinge point. It is necessary to ensure that some of the structural parts are the same as those of the initial hinge point. When generating the initial population, the hinge point coordinates of the working device are used as individual genes. Taking the universal rocker arm as an example, when generating the initial population, the relative positions of the two sets of hinge point coordinates, C, D, and E, are guaranteed to remain unchanged. The coordinates of point C can be randomly generated first, and then points D and E are generated based on the relative position relationship between the initial hinge points D and E and point C. In this way, the rocker arm structure in the generated initial population can be guaranteed to be the same as the rocker arm structure of the initial hinge point. The process of generating individuals in the initial population while ensuring the universal rocker arm is shown in the Figure 13.
In Figure 13, C, D, and E represents the rocker arm section. During the optimization process, the structure of this section must remain unchanged, and the relative positions of points C, D, and E should also remain the same.
(3) Crossover rate control.
Using an adaptive mutation rate and an adaptive crossover rate can effectively improve the algorithm’s global search ability and adaptability. The improvement formula is as follows:
P c = P c 1 1 e 1 f m i n f m a x P c 1 , f a v e f max > a , f min f max > b k P c 1 o t h e r s
P m = P m 1 1 e 1 f m i n f m a x P m 1 , f a v e f max > a , f min f max > b k P m 1 o t h e r s
Above, fave represents the average fitness of the population; fmax represents the maximum fitness of the population; fmin represents the minimum fitness of the population; k is selected according to the actual problem (0.5~1); Pc1 represents the adaptive coefficient, which is 0.9 or 1; Pm1 represents the adaptive coefficient, which is 0.1; a represents the adaptive judgment coefficient, which is 0.5~1; and b represents the adaptive judgment coefficient, which is 0~1.
The closer fmin and fmax are, the better the concentration of the entire population; the closer fave and fmax are, the more concentrated the fitness of the entire population; and finally, the higher the value of a and b, the smoother the changes in Pc and Pm, and the more sensitive the changes when the opposite is true.
(4) Improvement in the crossover process.
The crossover process of the traditional genetic algorithm relies on selecting two parent individuals for gene crossover. The crossover result is highly random and does not easily fall into the local optimal solution. However, the constraints of this study are extremely complex, and it is difficult for the post-crossover results to fall into the feasible domain. Therefore, the following improvements are made to the crossover process: when selecting the parent generation, we select three individuals through the roulette wheel method of g = g 1 + ( g 2 g 3 ) × r , r ( 0.8 1.2 ) and perform the crossover operation according to the genes of the three parent generations. During the crossover process, it is also necessary to keep the commonality of some structural parts in the two sets of hinges. Taking the commonality of the rocker arm as an example, the coordinates of point C can be crossed first, followed by the coordinates of points D and E. The specific crossover process is shown in Figure 14.
In Figure 14, C, D, and E represents the rocker arm section. During the optimization process, the structure of this section must remain unchanged, and the relative positions of points C, D, and E should also remain the same.
(5) Particle speed and position updates.
After completing the crossover operation, the particle speed and position are updated to enhance the algorithm’s search capability. The speed update formula is as follows:
v i + 1 = w v i + c 1 r 1 ( p b e s t x ) + c 2 r 2 ( g b e s t x i )
where v i + 1 represents the speed at the next moment; v i represents the current speed; x i represents the current position; p b e s t represents the individual optimal position; g b e s t represents the global optimal position; w represents the inertia weight; c 1 and c 2 are the influencing factors of the speed update; r 1 and r 2 represent random numbers; and the value range is [0, 1]. The position update formula is as follows:
x i + 1 = x + v i + 1

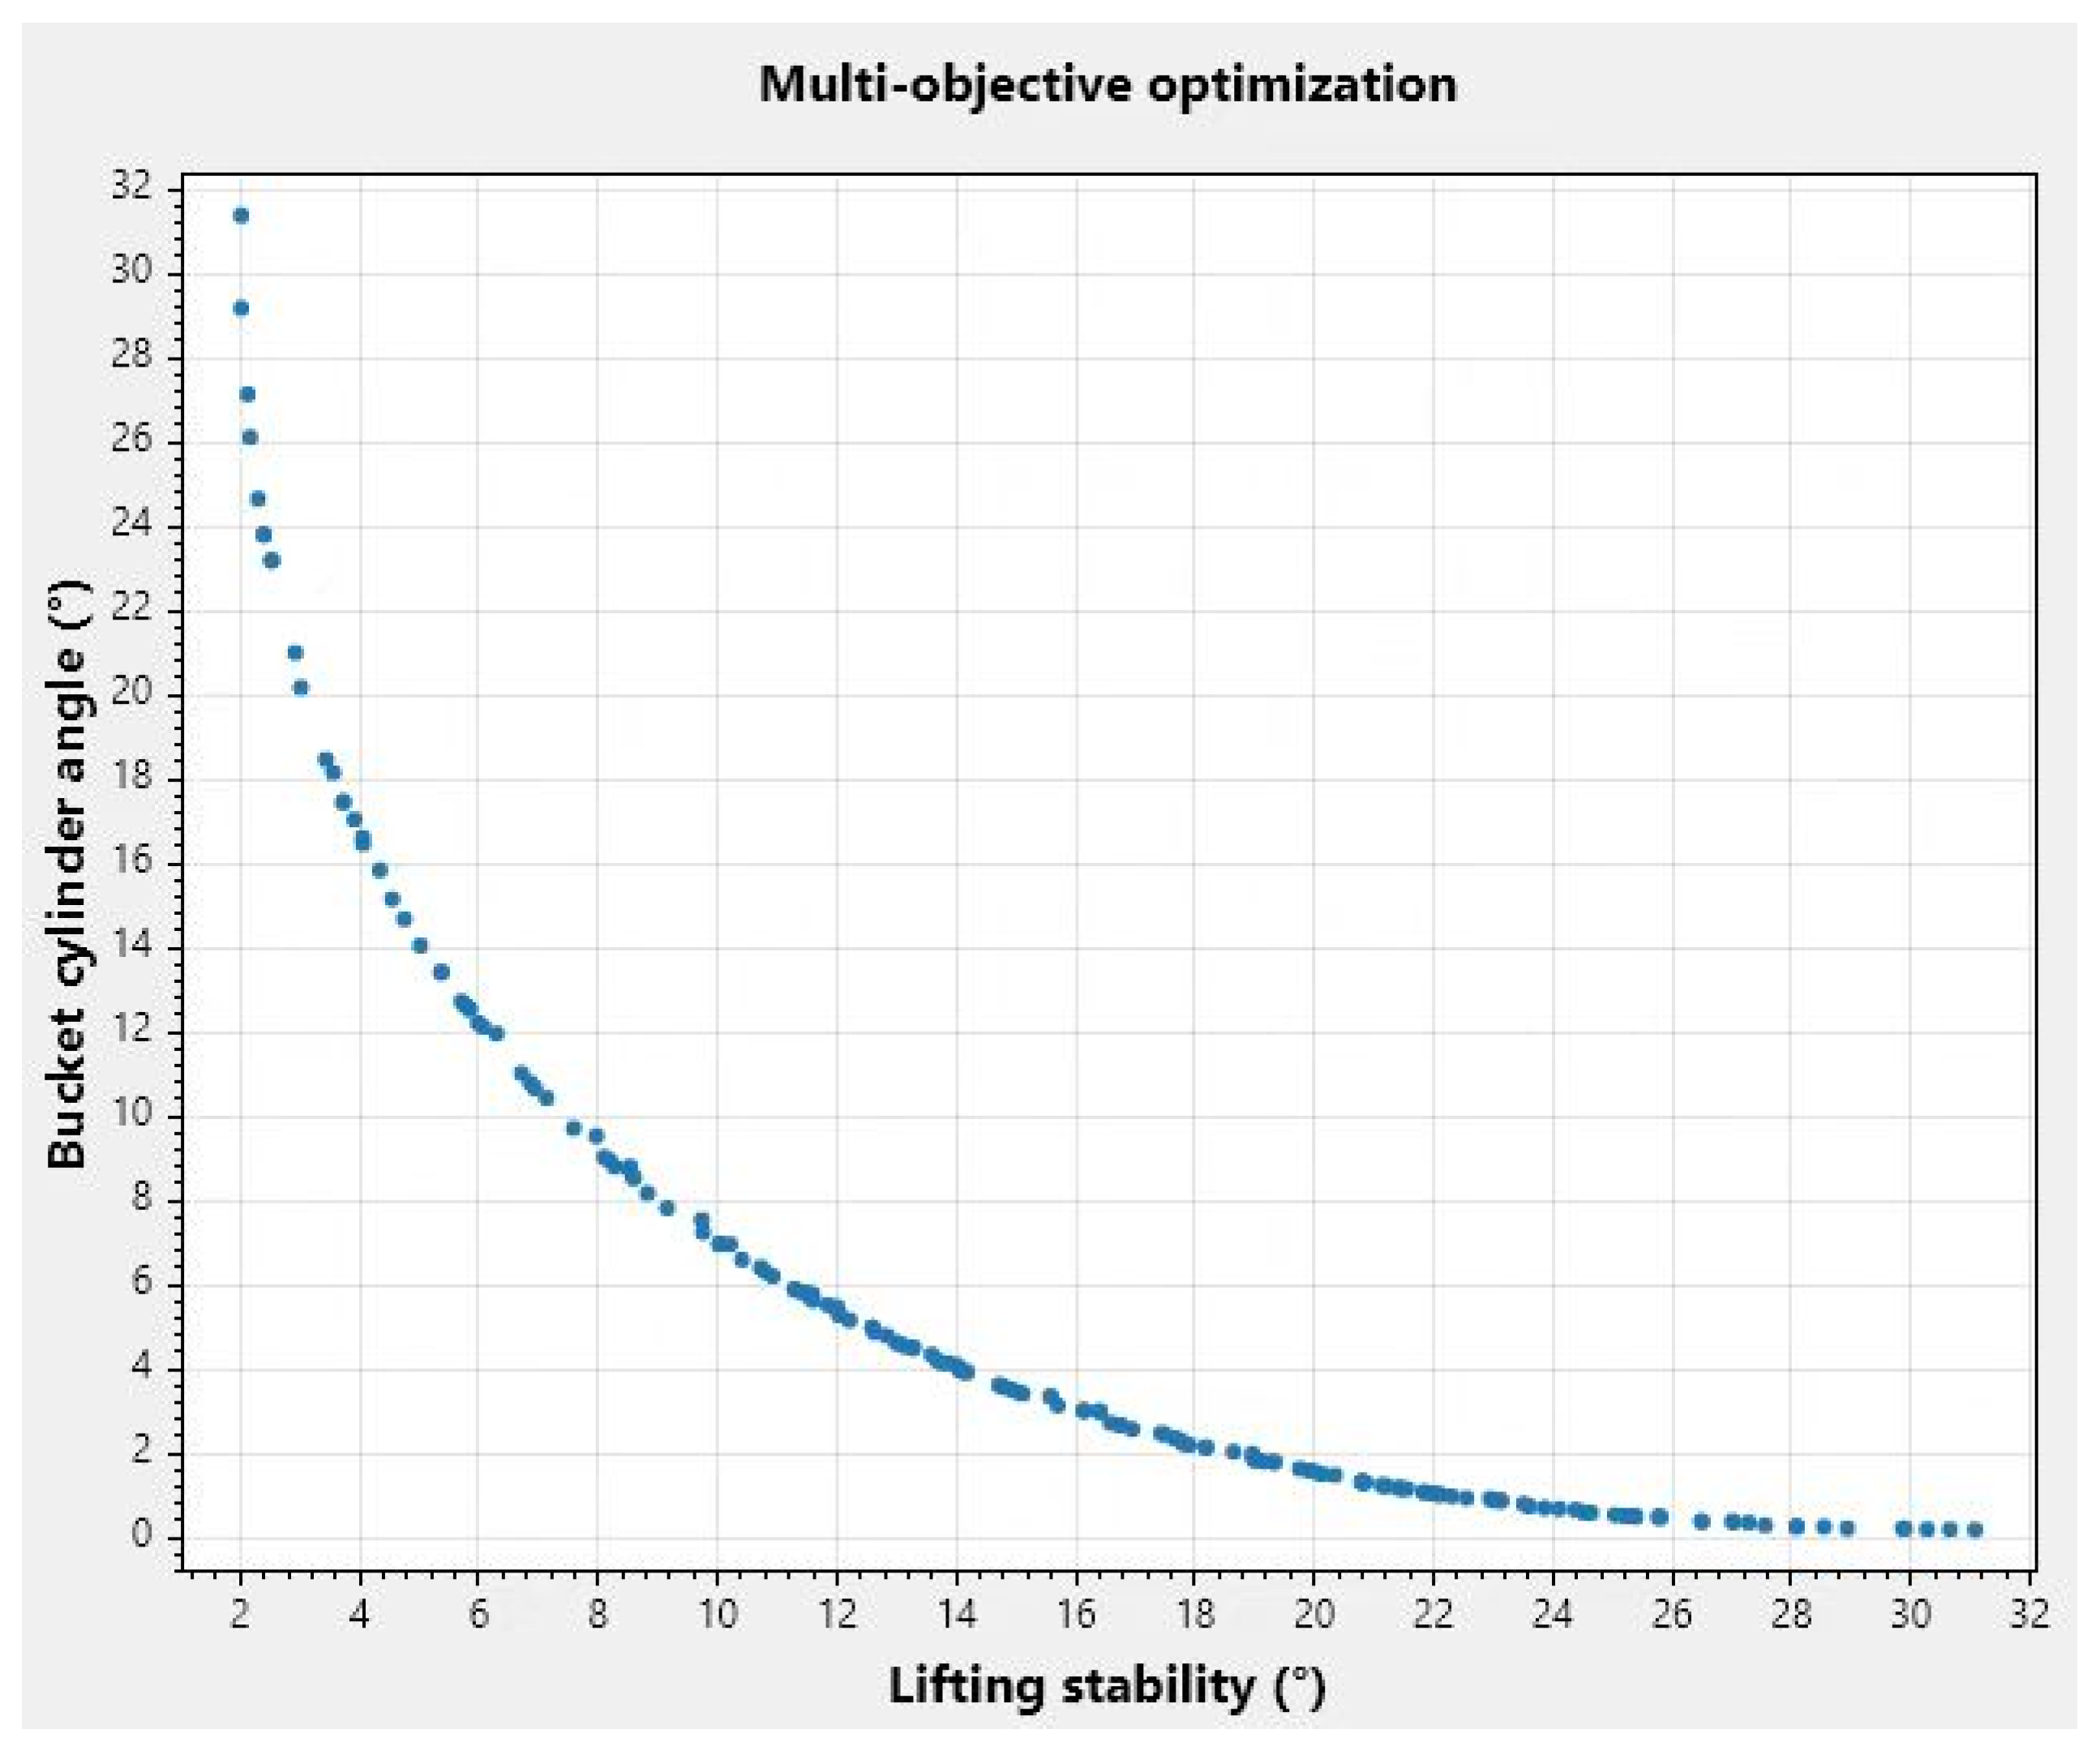
3.4. Multi-Objective Optimization

After completing the optimization, the Pareto frontier solution is solved among all solutions that meet the constraints, and multi-criteria decision-making and itinerary plans are compared among these solutions to select the best of the best.
(1)
Pareto optimality
In multi-objective optimization problems, multiple objectives often conflict with each other. Pareto optimality provides a trade-off analysis framework that does not require a priori preferences. If, and only if, there is no other feasible solution that is not inferior to it in all objectives and is strictly better in at least one objective, the set of all Pareto optimal solutions in the objective space is called the Pareto frontier.
For multi-objective optimization problems,
min x X F ( x ) = f 1 ( x ) , f 2 ( x ) , f k ( x ) T
where X is the feasible solution space and k ≥ 2 represents the number of targets.
If and only if i 1 , 2 k : f i x 1 f i x 2 ,   j : f j x 1 < f j x 2 , then x 1 , then x 1 can be considered to dominate x 2 . If a solution is better than other solutions in at least one objective without compromising other objectives, then the solution belongs to the Pareto frontier.
(2)
Multi-criteria decision-making
The multi-criteria decision-making method comprehensively considers multiple conflicting or competing criteria in a complex decision-making environment. The core of this method is to help decision makers identify, evaluate, and weigh the importance of different criteria through a systematic analysis framework so as to select the optimal solution or satisfactory solution from multiple feasible solutions. The process of selecting the optimal solution through multi-criteria decision-making is as follows:
(i) Constructing a decision matrix.
The decision matrix is the fundamental data source in multi-criteria decision-making and is a key step in achieving the best of the best. Each row of the decision matrix represents a solution, and each column represents a criterion.
(ii) Standardization of the decision matrix.
The elements of the decision matrix are standardized to eliminate the influence of the dimension and make different evaluation criteria comparable. The calculation formula is
r i j = x i j min x j max i = 1 , 2 , m x i j min i = 1 , 2 , , m x i j
(iii) Calculating the weight vector.
The weight vector is calculated based on the analytic hierarchy process w = w 1   w 2   w n T . The analytic hierarchy process is a subjective weighting method that determines the weights of multiple criteria by constructing a judgment matrix and calculating a weight vector. Its core is to decompose complex decision problems into a hierarchical structure and finally quantify the weight of each criterion by comparing the importance of the criteria two by two. The specific steps are, first, a judgment matrix is constructed A = a i j . Reciprocity is satisfied a i j = 1 / a i j and the diagonal is 1. The mean of the elements in each row is computed.
w i ¯ = j = 1 n a i j 1 n
Normalization occurs using the equation
w i = w i ¯ j = 1 n w i ¯
Finally, the eigenvalues and eigenvectors of the judgment matrix are calculated. The judgment matrix must satisfy logical consistency; otherwise, the weights are unreliable.
(3)
The weighted standardized decision matrix, denoted as W, is calculated as
W = w 1 r 11 w 2 r 12 w n r 1 n w 1 r 21 w 2 r 22 w n r 2 n w 1 r m 1 w 2 r m 2 w n r m n
The calculation formula is
v i j = w j r i j
(4)
Solution scoring
For each solution, a comprehensive score is calculated using the formula
S i = j = 1 m W i X i j

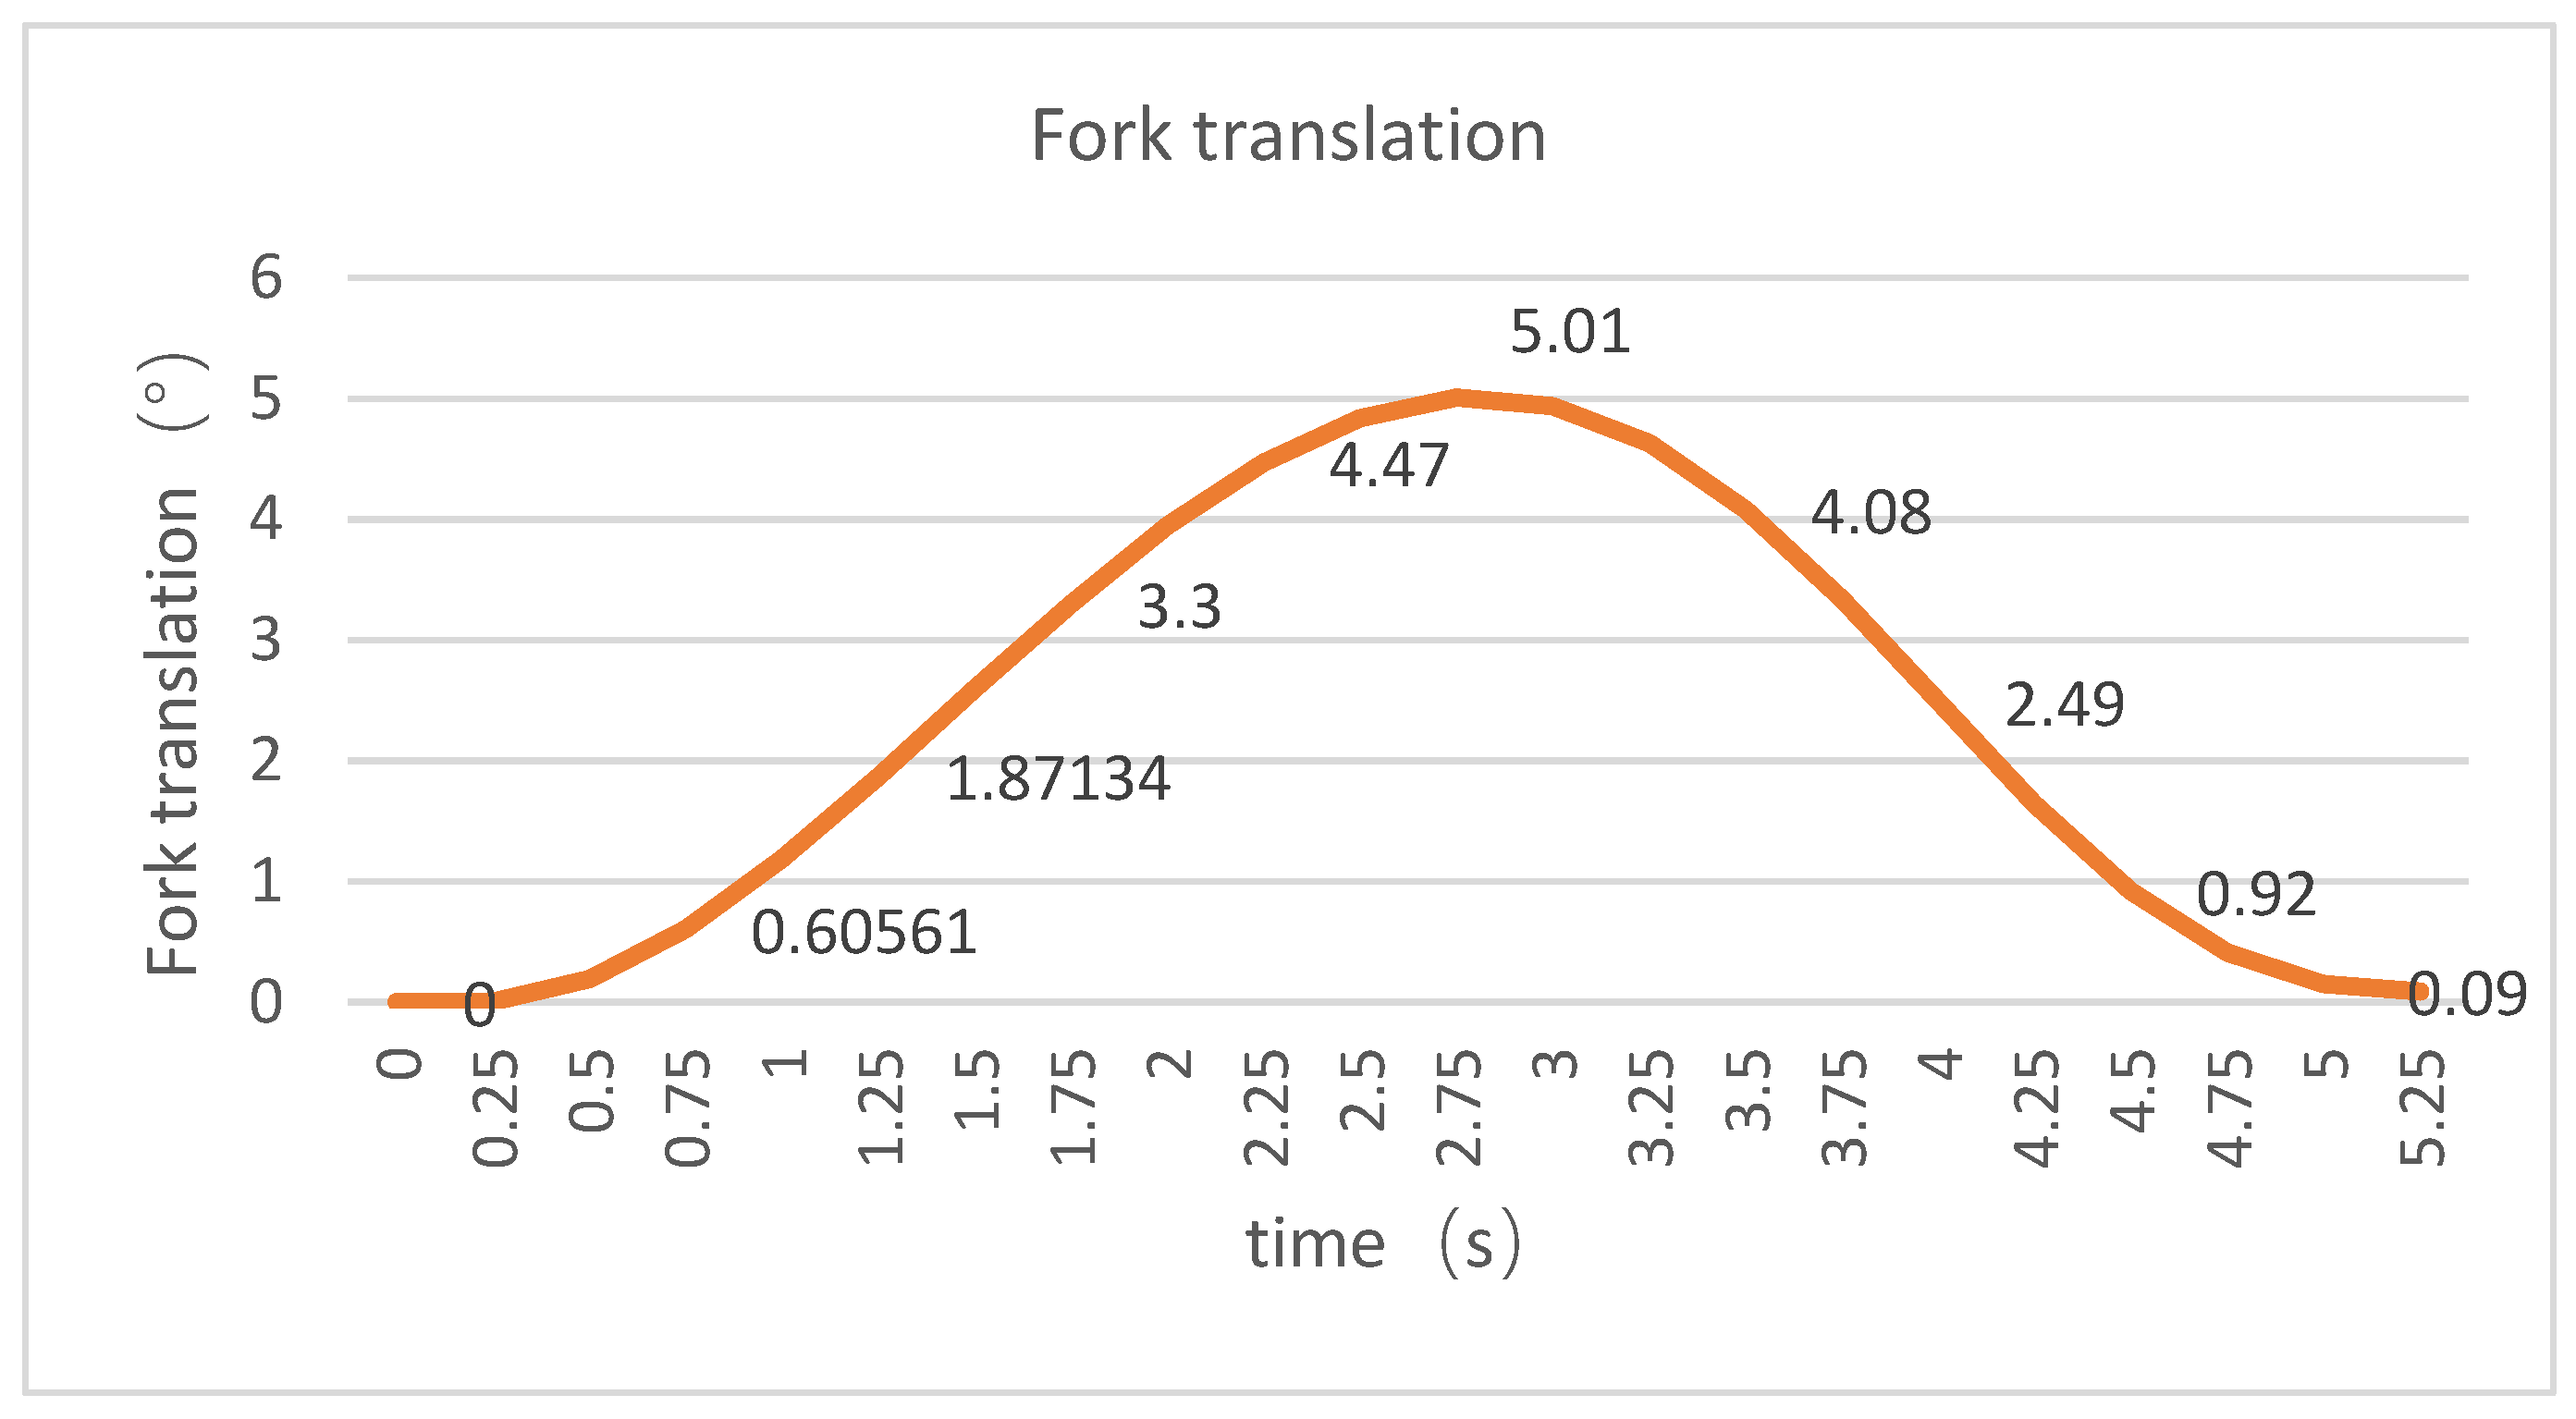
4. Simulation Optimization

After improving the algorithm, optimization calculations are performed. The Pareto frontier generated after the number of iterations has met the set number of times is used for multi-criteria decision-making and scheme comparison to successfully select the best of the best. After setting the design variables and constraints, the multi-objective function is input into the algorithm for optimization design. The Pareto frontier generated by non-dominated quick sorting is shown in Figure 15.
Based on the Pareto frontier, eight options were selected after preliminary screening, as shown in Table 1.
The relevant data from the above table are used as the decision matrix, and the data scheme of multi-criteria decision-making is continued. The optimal scheme is selected among those generated according to multi-criteria decision scoring, with the final results shown in Table 2. Evidently, the best scheme is Solution 6 in which the movement of the fork and the angle of the cylinder are both relatively low. Although neither of these two performance indicators is the best, they are relatively balanced, and other performance aspects are also superior.
Comparing the results of Scheme 6 with the optimized performance parameters and the optimization results obtained using the traditional optimization algorithm, it can be seen that the results achieved using the improved algorithm described in this paper are better than those achieved using the traditional algorithm.
As can be seen in Table 3, the solutions obtained using the improved optimization algorithm are slightly superior to those obtained using the traditional algorithm in certain aspects, except for the self-release translation.

5. Experimental Analysis

In order to further demonstrate the applicability and reliability of the algorithm developed in this paper in solving the problem of loader hinge point optimization, a real vehicle experiment was carried out on a loader after the hinge point was optimized. The actual unloading angle data at any position of the loader and the translational performance of the fork were measured during the experiment. The experimental photo is shown in Figure 16.
The experimental data of the fork translation performance is shown in Figure 17. The experimental data of the discharge angle at any position is shown in Figure 18. During this experiment, the lateral movement angle of the loaded machine’s fork after hinge point optimization was measured to be 5.01°, the discharging angle at any position was 47.1°, and the oil cylinder angle was 12.18°. Compared with the original model, although the angle of the oil cylinder was slightly larger, the lateral movement angle of the fork was greatly improved. This showcases the applicability and reliability of the algorithm in solving the hinge point optimization problem in loaded machines.

6. Conclusions

This study adjusted the key size parameters of the six-bar linkage, optimized the structural layout of the mechanism, changed its motion characteristics and geometric coordination, improved the translational performance of the fork during the lifting process, and effectively controlled the horizontal angle between the bucket cylinder and the ground. Based on the optimization goal, the improved multi-objective genetic algorithm was used to optimize the mechanism parameters and, finally, a set of optimal design schemes that take into account the translational performance and structural compactness of the fork were determined.
The six-bar linkage before and after optimization was subjected to a kinematic analysis, angle coordination evaluation, and performance comparison. The results showed that the optimized design significantly reduces the translational deviation of the fork within the full stroke range, and the maximum deviation is reduced by 24.21°; at the same time, the maximum angle between the bucket cylinder and the ground is controlled within a reasonable range, effectively avoiding problems such as a limited field of view and an excessive length of the rocker arm structure. The optimized structure improves control comfort and operation coordination without affecting the stability of the whole machine.
Further verification was carried out through virtual prototype simulation and a physical test. The test data were in good agreement with the simulation results, and the errors of all key indicators were controlled within the allowable range, indicating that the proposed optimization scheme is reliable and adaptable. Taking into account motion performance, structural coordination, and control safety, the optimized six-link mechanism design provides an effective solution for improving the performance of loader working devices and is highly applicable to future engineering works.

Author Contributions

Conceptualization, Z.D. and L.M. (Lingchao Meng); methodology, Z.D.; software, D.S.; validation, L.M. (Lingchao Meng), Z.W. and P.G.; formal analysis, D.S.; investigation, L.M. (Long Ma); resources, Y.S.; data curation, H.L.; writing—original draft preparation, M.Z.; writing—review and editing, Z.D.; visualization, L.M. (Lingchao Meng); supervision, Z.D.; project administration, Z.D.; funding acquisition, Z.D. All authors have read and agreed to the published version of the manuscript.

Funding

This research received no external funding. The APC was funded by Yanshan University.

Data Availability Statement

The data that support the findings of this study are available from the corresponding author upon reasonable request.

Acknowledgments

The authors would like to thank all collaborators and engineers from XCMG (Xuzhou Construction Machinery Group Co., Ltd.) for their technical support during the optimization and validation process.

Conflicts of Interest

Authors Huibin Liu, Menglong Zhang, and Yongkuan Sun were employed by the company Xuzhou Construction Machinery Group Co., Ltd. The remaining authors declare that this research was conducted in the absence of any commercial or financial relationships that could be construed as potential conflicts of interest.

References

  1. Ren, S. Fatigue Performance Study of Hydraulic Forming High-Strength Steel Wheel Rim D; Shenyang University of Technology: Shenyang, China, 2021; pp. 1–3. [Google Scholar]
  2. Zhang, Z. Kinematic Analysis and Optimization Design of Loader Working Device D; Tianjin University: Tianjin, China, 2017; pp. 44–48. [Google Scholar]
  3. Kong, H.E.; Fang, Z.; Zhu, D. Optimal Design of the Working Device for Loader Based on Virtual Prototype Technology. In Proceedings of the International Conference on Mechanical Engineering and Mechanics, Beijing, China, 21 October 2009; pp. 45–63. [Google Scholar]
  4. Huang, C.; Su, S.; Xu, K. Dynamics Modeling and Simulation of Loader Working Device Under Unloading Condition. In Proceedings of the 2016 International Conference on Artificial Intelligence and Engineering Applications, Hong Kong, China, 12–13 November 2016; Atlantis Press: Dordrecht, The Netherlands, 2016; pp. 481–486. [Google Scholar]
  5. Han, B.; Gao, G.; Zhang, T. Optimization Design of Loader Working Device Based on Composite Forming Method. Agric. Equip. Veh. Eng. 2013, 51, 29–33. [Google Scholar]
  6. Xie, P.; Lin, S. Parameter Optimization Design of Excavator Working Device Based on Elite Ant Colony Algorithm. J. Sanming Univ. 2011, 28, 46–51. [Google Scholar]
  7. Zhang, X.; Liu, B.; Qu, T. Research on Integrated Optimization of Excavator Working Device Parameters Based on Hybrid Algorithm. Mech. Transm. 2016, 40, 28–32. [Google Scholar]
  8. Li, X.; Wang, G.; Miao, S. Optimal Design of a Hydraulic Excavator Working Device Based on Parallel Particle Swarm Optimization. J. Braz. Soc. Mech. Sci. Eng. 2017, 39, 3793–3805. [Google Scholar] [CrossRef]
  9. Yuan, X.; Niu, Q. Optimization Design of Working Device of ZL-80 Loader Based on Adams. Int. J. Appl. Math. Stat. 2013, 50, 264–271. [Google Scholar]
  10. Wu, X.M.; Xiao, G.X.; Chen, R. Comprehensive Optimal Design of Working Device of Loader Based on Sensitivity. Adv. Mater. Res. 2012, 490, 3027–3031. [Google Scholar] [CrossRef]
  11. Dong, W.C.; Pang, H.T. Motion Simulation and Optimization of Loader Working Device. Constr. Mach. Maint. 2023, 6, 40–42. [Google Scholar]
  12. Cheng, R.; Liu, C.; Liu, H.B. Performance Optimization of Stone Fork Working Device of Loader Based on Kinematics Simulation. Constr. Mach. 2024, 55, 131–135+10. [Google Scholar]
  13. Chen, Z. Motion Analysis of Loader Working Device Construction Process Based on Matlab. Equip. Manag. Maint. 2025, 3, 111–116. [Google Scholar] [CrossRef]
  14. Wen, H.; Wang, H.; Liang, G. Multi-objective Optimization of the Flip Mechanism of Mobile Garbage Compression Device. Mech. Transm. 2024, 48, 69–75. [Google Scholar] [CrossRef]
  15. Gao, L.; Deng, M.Y.; Li, K.J. Hinge Point Optimization of Boom Lifting Mechanism of Multi-functional Operation Vehicle in Forest Land. Mech. Des. 2024, 41, 79–88. [Google Scholar]
Figure 1. Working device diagram.
Symmetry 17 01084 g001
Figure 2. Schematic diagram of the kinematic analysis.
Symmetry 17 01084 g002
Figure 3. Lifting mechanism.
Symmetry 17 01084 g003
Figure 4. Dual-rocker arm mechanism.
Symmetry 17 01084 g004
Figure 5. Crank–rocker mechanism.
Symmetry 17 01084 g005
Figure 6. Bucket force diagram.
Symmetry 17 01084 g006
Figure 7. Force diagram for the connecting rod.
Symmetry 17 01084 g007
Figure 8. Force diagram for the rocker arm.
Symmetry 17 01084 g008
Figure 9. Force diagram for the lifting arm.
Symmetry 17 01084 g009
Figure 10. Loader Performance Analysis Chart.
Symmetry 17 01084 g010
Figure 11. Force arm display diagram.
Symmetry 17 01084 g011
Figure 12. Overall process of the algorithm.
Symmetry 17 01084 g012
Figure 13. Diagram of the population generation method.
Symmetry 17 01084 g013
Figure 14. Crossover operation flowchart.
Symmetry 17 01084 g014
Figure 15. Pareto frontier.
Symmetry 17 01084 g015
Figure 16. An image of the real-world experiment.
Symmetry 17 01084 g016
Figure 17. Fork translation.
Symmetry 17 01084 g017
Figure 18. Discharge angle at any position.
Symmetry 17 01084 g018
Table 1. Performance comparison after multi-objective optimization.
Performance Parameter NameSolution 1Solution 2Solution 3Solution 4Solution 5Solution 6Solution 7Solution 8
High transmission angle (°)15.314.815.914.216.115.615.715.2
Automatic leveling (°)14.214.514.815.215.714.616.315.9
Unloading height (mm)43504350435043504350435043504350
Unloading distance (mm)412412412412412412412412
High position angle of the bucket (°)61.262.364.463.864.164.263.964.0
Ground lifting force (kN)82.8783.8287.1385.4482.1886.4985.3988.24
Ground digging force (kN)111.23107.19105.45108.61112.72110.7108.55107.60
High lifting force (kN)51.3350.0952.1650.7651.9753.954.6154.82
Digging depth (mm)185185185185185185185185
Discharge angle at any position (°)45.848.247.145.646.947.446.347.7
Maximum transportation height of the bucket with the guard block in place (mm)831836829841836835840837
Lateral movement of the fork lift (°)28.3122.0716.7912.488.734.924.022.01
Bucket cylinder angle (°)0.431.342.274.827.9112.3216.0831.8
Table 2. Score of each scheme.
SolutionSolution 1Solution 2Solution 3Solution 4Solution 5Solution 6Solution 7Solution 8
Score0.110.090.120.120.130.150.100.09
Table 3. Comparison of the performance parameters after optimization.
Performance Parameter NameOriginal Model ParametersOptimized Parameters (Improved Algorithm)Optimized Parameters (Traditional Algorithm)
High transmission angle (°)14.515.615.7
Automatic leveling17.814.613.4
(°)435043504350
Unloading height412412412
(mm)58.764.263.4
Unloading distance80.986.4984.15
(mm)102.4110.7108.2
High bucket angle (°)50.653.951.7
Ground lifting force185185185
(kN)4547.445.8
Ground digging force800835837
(kN)29.134.9210.34
High lifting force0.2312.329.47
Disclaimer/Publisher’s Note: The statements, opinions and data contained in all publications are solely those of the individual author(s) and contributor(s) and not of MDPI and/or the editor(s). MDPI and/or the editor(s) disclaim responsibility for any injury to people or property resulting from any ideas, methods, instructions or products referred to in the content.

