Abstract
As a classical statistical method, multiple regression is widely used for forecasting tasks in power, medicine, finance, and other fields. The rise of machine learning has led to the adoption of neural networks, particularly Long Short-Term Memory (LSTM) models, for handling complex forecasting problems, owing to their strong ability to capture temporal dependencies in sequential data. Nevertheless, the performance of LSTM models is highly sensitive to hyperparameter configuration. Traditional manual tuning methods suffer from inefficiency, excessive reliance on expert experience, and poor generalization. Aiming to address the challenges of complex hyperparameter spaces and the limitations of manual adjustment, an enhanced sparrow search algorithm (ISSA) with adaptive parameter configuration was developed for LSTM-based multivariate regression frameworks, where systematic optimization of hidden layer dimensionality, learning rate scheduling, and iterative training thresholds enhances its model generalization capability. In terms of SSA improvement, first, the population is initialized by the reverse learning strategy to increase the diversity of the population. Second, the mechanism for updating the positions of producer sparrows is improved, and different update formulas are selected based on the sizes of random numbers to avoid convergence to the origin and improve search flexibility. Then, the step factor is dynamically adjusted to improve the accuracy of the solution. To improve the algorithm’s global search capability and escape local optima, the sparrow search algorithm’s position update mechanism integrates Lévy flight for detection and early warning. Experimental evaluations using benchmark functions from the CEC2005 test set demonstrated that the ISSA outperforms PSO, the SSA, and other algorithms in optimization performance. Further validation with power load and real estate datasets revealed that the ISSA-LSTM model achieves superior prediction accuracy compared to existing approaches, achieving an RMSE of 83.102 and an of 0.550 during electric load forecasting and an RMSE of 18.822 and an of 0.522 during real estate price prediction. Future research will explore the integration of the ISSA with alternative neural architectures such as GRUs and Transformers to assess its flexibility and effectiveness across different sequence modeling paradigms.
1. Introduction
Optimization problems have long been a central research focus, and they arise in diverse practical domains, such as image classification, feature selection, autonomous driving, medical diagnosis, and energy management [1,2,3,4,5,6,7,8,9]. Solving complex optimization problems requires analyzing constraints and objectives and optimizing the objective function [10]. These problems are challenging due to multimodality, high dimensionality, and dynamic constraints. Traditional methods like gradient descent and Newton’s method rely on derivatives, are computationally expensive, and often get trapped in local optima, limiting their practical use. With the advancement of research, scholars have developed metaheuristic algorithms, which are inspired by intuitive experience or biological behavior patterns [11]. Metaheuristic optimization algorithms can be applied to optimize both symmetric and asymmetric engineering problems and are characterized by high computational efficiency, ease of implementation, flexibility, and simple frameworks. In recent years, a series of metaheuristics have been proposed, including particle swarm optimization (PSO) [12], ant colony optimization (ACO) [13], the whale optimization algorithm (WOA) [14], the grey wolf optimizer (GWO) [15], Harris hawk optimization (HHO) [16], differential evolution (DE) [17], the bat algorithm (BA) [18], ship rescue optimization (SRO) [19], the Rafflesia optimization algorithm [20], and the goose optimization algorithm (GOOSE) [21]. For example, PSO emulates bird flocking behavior, using particle velocity, position, and individual/global extrema to conduct a collaborative search in a solution space. The WOA innovatively incorporates a bubble-net hunting mechanism, where random or optimal search agents simulate humpback whale behavior to navigate solution spaces. GOOSE leverages the early-warning behavior and balance mechanisms of goose flocks, adaptively adjusting the search resolution and speed to enable precise exploration of multimodal solution spaces.
The sparrow search algorithm (SSA), proposed by Xue J and Shen B in 2020 [22], is a metaheuristic algorithm inspired by the foraging and anti-predation behaviors of sparrow populations. The SSA is characterized by a simple structure, few parameters, and high scalability. However, like other metaheuristic algorithms, it is prone to local optima and suffers from suboptimal optimization accuracy. Several improvements have been proposed to enhance the SSA’s performance. For example, Ouyang et al. [23] introduced a dynamic population partitioning method based on K-medoids clustering to balance local exploitation and global exploration. Su et al. [24] developed an adaptive hybrid SSA framework that incorporates differential evolution operators to improve population diversity and escape local optima. Yan et al. [25] proposed a multi-population collaborative search model based on K-means clustering, which avoids premature convergence while preserving global search capabilities. Huang et al. [26] suggested a chaotic optimization strategy using elite solution sets to guide population evolution. The effectiveness of these improvements has been demonstrated through benchmark testing, showing that the improved SSA algorithms outperform traditional methods in optimization tasks. Based on previous research, this paper proposes an improved sparrow search algorithm (ISSA). This algorithm generates the initial population using a reverse learning strategy to increase diversity, modifies the position update formula to prevent convergence to the origin, dynamically adjusts the step size to improve accuracy, and incorporates Lévy flight for enhanced global search capabilities. Simulations show that ISSA-LSTM outperforms other algorithms on the CEC2005 benchmark functions.
Multiple regression models analyze the relationships between multiple variables and a single response, providing better explanatory power than univariate methods by incorporating multiple factors [27,28]. This is particularly useful in time-series tasks, such as power load forecasting and real estate price prediction, where long-term dependencies and multi-factor interactions dominate the data dynamics [29,30]. However, traditional regression methods struggle with high-dimensional and non-stationary data. In contrast [31], deep learning models, such as LSTM networks, have revolutionized prediction tasks by autonomously extracting features from complex datasets. These models outperform traditional machine learning approaches, which rely on manual feature selection [32,33,34]. Recent research has combined metaheuristic optimization with LSTM networks to further enhance prediction accuracy. For instance, Sun et al. [35] proposed a PSO-LSTM hybrid to optimize hyperparameters, improving failure prediction accuracy. Lu et al. [36] demonstrated that differential evolution-optimized LSTMs outperform classical models in electricity forecasting. Pal et al. [37] showed that Bayesian-optimized shallow LSTMs achieve greater long-term prediction accuracy than deeper models. Furthermore, Cao et al. [38] integrated K-means clustering with IPSO to improve weather-resilient predictions. These advancements illustrate the potential of combining heuristic algorithms with LSTM networks to enhance predictive analytics.
This study introduces an ISSA to optimize LSTM hyperparameters for time-series prediction tasks, including hidden layer nodes, training epochs, and the learning rate, significantly improving prediction accuracy and reliability. Validation on two publicly available datasets—power load forecasting and real estate price prediction—shows that ISSA-LSTM outperforms other LSTM models optimized by alternative methods, with consistently lower error deviations. These results highlight the combined strength of the ISSA’s global search capabilities and LSTM’s sequential modeling.
The structure of this paper is as follows: Section 2 introduces the operational paradigms of the SSA and LSTM networks, providing the theoretical foundations for subsequent developments. Section 3 introduces the ISSA model, detailing its enhanced convergence mechanisms through a mathematical derivation. Section 4 validates the optimization superiority of the ISSA by benchmarking it against eight established metaheuristic algorithms using 10 test functions. In Section 5, an integrated ISSA-LSTM architecture is proposed and its performance is demonstrated through multivariate regression analysis on two publicly available datasets, outperforming eight state-of-the-art models. The conclusion summarizes the main contributions of this research and outlines three key research directions for advancing evolutionary algorithms.
2. Related Works
2.1. Sparrow Search Algorithm
The sparrow search algorithm (SSA) simulates the foraging behavior of sparrows to achieve population-based optimization through collaborative mechanisms. Its core principle involves dynamically dividing the population into discoverers and followers based on mutual observation and information exchange. Discoverers are responsible for locating high-quality solutions and guiding the swarm’s movement, while followers adjust their trajectories by observing the positions of the discoverers. Additionally, some individuals compete for better positions through a competitive mechanism, enhancing the overall allocation of resources. Compared to traditional swarm intelligence algorithms, the SSA exhibits stronger global search capabilities and faster convergence, making it well-suited for solving complex optimization problems.
The mathematical formulation of the SSA consists of solution vectors and corresponding fitness values, which are defined as follows:
Here, , , and represent the individual position matrix, the number of individuals in the population, and the dimension of the population in the SSA, respectively. is the position of the i-th individual in the j-th dimension. is the fitness function of the SSA, and the fitness matrix () is an matrix.
As the population evolves, discoverer individuals with higher fitness guide the global search by exploring promising regions, while followers perform localized refinements within these areas. The SSA achieves behavioral coordination by dividing individuals into three roles, each governed by distinct position update strategies.
The discoverers have higher energy. With the progress of each iteration, the formula for updating their positions is as follows:
In this equation, represents the spatial coordinate of the sparrow in the dimension at the (t + 1)-th iteration; is a stochastic decay coefficient modulating the exploration rate; denotes the termination criterion for the evolutionary iterations; and denote the safety threshold and early-warning value, with their value ranges being [0.5, 1] and (0, 1], respectively. The term represents a normally distributed random variable bounded within [−1, 1], and is a matrix.
Followers observe the movements of discoverers to identify promising directions. Once a discoverer is found to occupy a region with higher fitness, followers adjust their positions accordingly and engage in competitive replacement. Successful followers replace inferior individuals; otherwise, they continue to monitor other discoverers. The follower update mechanism is mathematically described as follows:
In this formula, represents the spatial coordinate of the sparrow in the dimension at the (t + 1)-th iteration. denotes the least-fit agent’s spatial configuration at iteration t; indexes the fitness hierarchy among the population members; and is the position of the individual with the best fitness at the -th iteration. constitutes a binary coefficient matrix, and the instances of take values of either 1 or −1. The term represents a normally distributed random variable bounded within [−1, 1], and is a matrix.
The pseudoinverse is used to calculate an update direction. To ensure the mathematical validity of this operation, the matrix is constructed as a full-rank binary matrix, with each element randomly assigned within {1, −1}. In this setting, is symmetric and nonsingular with high probability, thus guaranteeing the existence of the inverse and the correctness of the pseudoinverse expression.
In this formula, represents the spatial coordinate of the sparrow in the dimension at the (t + 1)-th iteration. encodes the elite agent’s optimal spatial state, where and are stochastic scaling factors. is negligible and has a constant value; its purpose is to prevent division by zero. denotes the fitness of the present individual, while (global best) and (global worst) are designations used to denote the maximum and minimum levels of fitness that can be achieved, respectively, by any given individual.
2.2. Long Short-Term Memory Neural Network
As an improved architecture of recurrent neural networks (RNNs), the LSTM model effectively mitigates the challenge of learning long-term dependencies in time-series prediction. This is achieved through a gating mechanism composed of input, forget, and output gates, which enables the selective retention and removal of historical information [39]. Compared to standard RNNs, LSTM significantly reduces the problems of gradient vanishing and explosion. The structure of the LSTM network is illustrated in Figure 1.
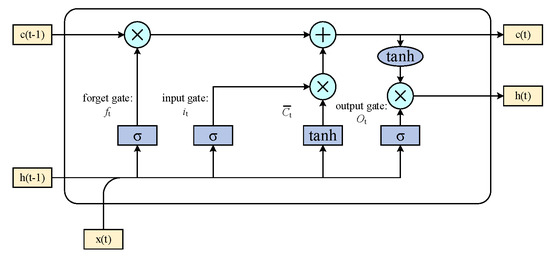
Figure 1.
The format followed by the schemes.
(1) The forget gate () controls which historical states in are discarded and transfers the remaining information to the current memory cell ():
In this formula, denotes the hidden state at time t − 1 and is the input vector at t. (weight) and (bias) are critical parameters defining the forget gate. The value of is generated by the sigmoid function. When , all previous states in are erased; if , is fully preserved.
(2) The input gate () determines how much new information from is stored in :
Similar to the forget gate, represents the hidden state at the previous time step, and is the input vector at the current time step. (weight) and (bias) are specific to the input gate. The value calculated through the sigmoid activation function () is within the interval [0, 1]. When , the gate blocks all input, while when it allows complete storage.
(3) The candidate state () is computed from and serves as an intermediate step to update .
Here, and are the weight matrix and bias parameter of the candidate state (), respectively. The value of calculated through the hyperbolic tangent activation function () is within the interval [−1, 1].
(4) Memory Cell Update
The memory cell update rule integrates historical and novel states:
The terms , , and are derived from Equations (7)–(9).
(5) The output gate () regulates how much of is propagated to at the same time step, and it outputs the filtered information.
The gate parameters are defined by the weight matrix () and the bias vector (), and through sigmoidal activation. Equation (12) updates the memory cell by blending and .
3. Improved Sparrow Search Algorithm Strategy
3.1. Oppositional Learning Strategy
Oppositional learning [40] enhances population diversity by performing mutation operations on the population after each iteration.
In this formula, and denote the upper and lower bounds, respectively. In the i-th iteration, represents the individual, whereas signifies the generated adversarial individual. The population size is expanded to 2 candidate solutions by merging the original individual () with the adversarial learning-generated individual (). The optimal solutions are filtered based on fitness ranking to update the location, and the iterative loop continues to optimize the quality of the population.
3.2. Producer Anti-Origin Convergence Strategy
The performance of the SSA was evaluated in Reference [22] through a series of benchmark experiments. The results indicated that when the early-warning variable (R2) exceeds the safety threshold (ST), discoverers update their positions toward the current global optimum using random perturbations following a normal distribution. Conversely, if R2 < ST, the position update mechanism drives individuals to converge toward the origin, which limits the algorithm’s ability to handle optimization tasks with distant optima. As a result, while the SSA performs well on problems with solutions near the origin, it often exhibits insufficient accuracy when addressing complex landscapes where the global optimum is far away. To address this limitation, this study introduces an improved position update rule for discoverers, as shown in Equation (14). The proposed strategy mitigates premature convergence to the origin and enhances the algorithm’s global search capability across diverse optimization scenarios:
In this equation, represents the spatial coordinate of the sparrow in the dimension at the (t + 1)-th iteration; the term represents a normally distributed random variable bounded within [−1, 1]; and is a matrix.
3.3. Lévy Flight Strategy
Lévy flight [41], a non-Gaussian stochastic process with heavy-tailed step-size distributions, exhibits the dual characteristics of frequent small steps for local exploration and occasional large jumps to search globally [42]. The standard SSA tends to fall into local optima, limiting its effectiveness in global optimization tasks. To address this issue, Lévy flight is integrated into the position update mechanism (Equation (6)), enabling a balance between short-range exploitation and long-range exploration. As the algorithm nears the global optimum, Lévy steps enhance fine-grained search capabilities while preventing premature convergence. By utilizing the displacement between the current and best-known solutions, the improved SSA maintains robust local search performance while expanding its global exploration potential. This enhanced update rule is formalized in Equation (15):
In this formula, d represents the spatial dimension. The Lévy calculation formulas are shown in Equations (16) and (17):
In these formulas, represents the gamma function, and are random numbers within the interval [0, 1], and is a constant.
3.4. Step-Size Factor Adjustment Strategy
In the standard SSA, the step-length control parameters (β and K in Equation (6)) play a crucial role in balancing global exploration and local exploitation. However, due to their inherently random nature, the search process often suffers from poor utilization of the solution space and a tendency to fall into local optima. To overcome this issue, this study proposes an improved strategy where β and K are adaptively adjusted: larger values promote a broader global search, while smaller values support precise local refinement [43]. The modified formulations for β and K are detailed in Equations (18) and (19), respectively:
In these formulas, denotes the best fitness value and is used to denote the worst fitness value, while T is used to denote the maximum number of iterations. Equation (18) shows that the improved step-length control parameters exhibit a nonlinear increasing trend. In early SSA iterations, high population diversity implies strong global exploration but weak local exploitation. Therefore, we set the control parameters to smaller values to enhance local exploitation. In later iterations, as sparrows converge to the current global optimum, the risk of premature convergence increases as the search space narrows. Larger control parameter values help avoid sparrows becoming trapped in local optima and facilitate further exploration. Equation (19) reveals biphasic modulation of the step-length factor (K): an ascending phase in the initial iterations promotes exhaustive search space exploration, while subsequent rapid attenuation expedites convergence. This dynamic adjustment of the step-length parameters balances the SSA’s global exploration and local exploitation, improving optimization accuracy while avoiding local optima.
3.5. The Pseudo-Code of the ISSA
To illustrate the improved sparrow search algorithm (ISSA), the pseudo-code is presented in Algorithm 1.
| Algorithm 1. The pseudo-code of the ISSA. |
| Input: The population size (n), the number of discoverers (PD), the number of followers (SD), the early-warning value (R2), the safety threshold (ST), and the maximum number of iterations (T). Output: The location of a sparrow and its fitness value. 1: Initialize the population using the oppositional learning strategy. 2: Calculate the fitness value of each sparrow and determine the optimal and worst individuals in the current population. 3: While(t < T) 4: for i = 1:PD 5: Update the position of the i-th sparrow according to Equation (14) (update the positions of the discoverers) 6: end for 7: for i = PD + 1:n 8: Update the position of the i-th sparrow according to Equation (4) (update the positions of the followers) 9: end for 10: for l = 1:SD 11: Update the position of the l-th sparrow according to Equations (15)–(18) (update the positions of the scouts); |
| 12: end for 13: Obtain the updated positions of all sparrows; 14: If the fitness value corresponding to the new updated position is higher than that of the current position, update the current position; 15: t = t + 1; 16: end while 17: Return the objective function value. |
4. Case Study
4.1. Parameter Settings
Computational experiments were executed on a workstation with a 2.40 GHz Intel i5-1135G7 processor and 16 GB of memory running 64-bit Windows 10 Pro. The ISSA framework was developed using MATLAB R2022a.
To evaluate the effectiveness of the ISSA in solving complex optimization problems, ten benchmark functions from the CEC 2005 test suite were selected for simulation experiments. As detailed in Table 1, these functions are 30-dimensional and fall into three categories: unimodal (F1–F3), multimodal (F4–F7), and composite (F8–F10). Unimodal functions are used to assess the convergence rates of algorithms, multimodal functions test their robustness in navigating local optima, and composite functions examine the balance between exploration and exploitation in intricate problem landscapes.

Table 1.
Benchmark test functions.
4.2. Comparative Algorithm Analysis
The ISSA’s performance, evaluated through 30 independent trials per benchmark function, was benchmarked against the SSA, SSA1 (the SSA optimized with Lévy flight), PSO, the GWO, DE, a GA, and GOOSE. All algorithms were initialized with identical configurations: T = 500 (maximum of 500 iterations), N = 30 (30 population members), and dimensionality (d = 30). Three evaluation metrics—the optimal value, mean value, and standard deviation—were derived from the 10 benchmark functions. Given the shared population-based iterative framework, the theoretical time complexity of the ISSA, the SSA, and PSO can be uniformly expressed as O(N × D × T), where N = 30, d = 30, and T = 500. Although the ISSA incorporates enhancements such as reverse learning and Lévy flight, these operations only incur constant-time overhead and do not alter the asymptotic complexity. The simulation results are shown in Table 2.

Table 2.
Simulation results of algorithm testing (d = 30).
Table 2 demonstrates that the ISSA, SSA1, and the SSA yielded the best results in solving the unimodal functions, F1, F2, and F3, outperforming traditional algorithms such as PSO, the GWO, DE, the GA, and GOOSE in terms of optimization accuracy. Notably, the ISSA achieved a mean and a standard deviation of zero, reflecting its exceptional consistency and robustness compared to the other methods.
In the case of the multimodal functions, the ISSA surpassed the SSA and SSA1 in optimization accuracy, achieving the best results for F4, F6, and F7. For F5, the ISSA yielded the solution closest to the theoretical optimum (0) among all tested algorithms. In terms of average performance, the ISSA demonstrated the highest accuracy, while the SSA ranked second. Regarding the standard deviation, the ISSA achieved superior consistency across most functions, except for F6 and F7.
Regarding the composite functions, F8–F10, all algorithms—except PSO, the GWO, DE, the GA, and GOOSE—approximated the optimal values to varying degrees. Among them, the ISSA achieved the lowest mean and standard deviation, signifying superior global search performance, robustness, and stability. These results confirm the ISSA’s competitive advantage across all three categories: unimodal, multimodal, and composite functions.
The convergence trajectories of the ISSA and the baseline algorithms for different benchmark functions are visualized in Figure 2. The x-axis represents the iteration number, while the y-axis denotes the best fitness value obtained. The figure clearly illustrates the ISSA’s faster convergence toward the global optimum.
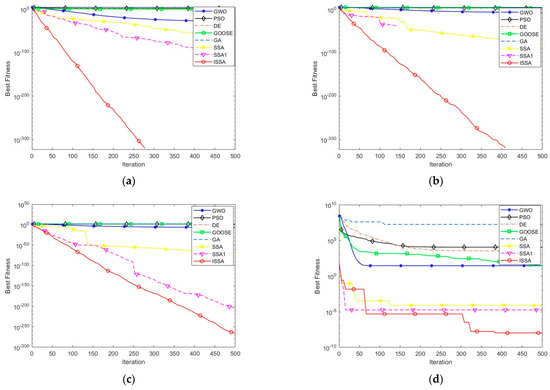
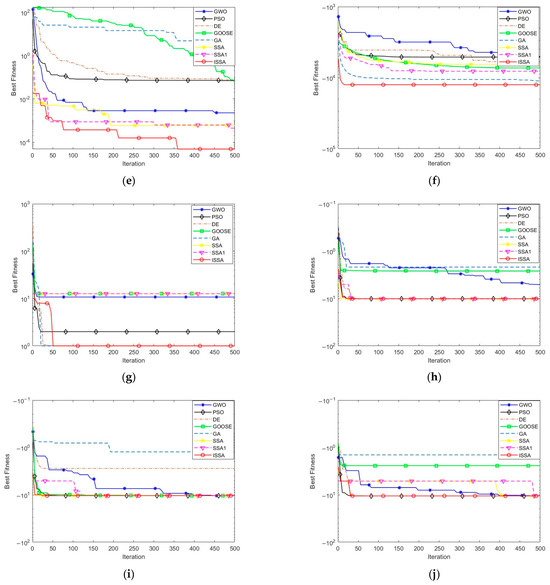
Figure 2.
Comparison of convergence curves between ISSA and other algorithms. (a) F1. (b) F2. (c) F3. (d) F4. (e) F5. (f) F6. (g) F7. (h) F8. (i) F9. (j) F10.
Figure 2 illustrates the convergence trajectories for three function types: unimodal (F1–F3), multimodal (F4–F7), and composite (F8–F10).
Unimodal functions (F1–F3): The ISSA, SSA1, and the SSA showed superior global exploration performance compared to PSO, the GWO, DE, the GA, and GOOSE. Notably, the ISSA achieved rapid early-stage convergence, reaching near-optimal solutions faster, while PSO and the GWO converged more slowly in the initial iterations.
Multimodal functions (F4–F7): The ISSA excelled at avoiding local optima, benefiting from a robust global search mechanism. Its ability to balance exploration and exploitation effectively prevented early stagnation while maintaining solution accuracy.
Composite functions (F8–F10): The ISSA gradually converged toward superior solutions. Specifically, for F10, although PSO performed well initially, the ISSA demonstrated consistent convergence across the iterations and reliably approached the global optimum.
In summary, the ISSA achieves rapid convergence in unimodal tasks through efficient search dynamics. In multimodal problems, it reliably escapes local optima and locates the global optimum with high accuracy. In composite scenarios, the ISSA ensures stable convergence across iterations, showcasing strong adaptability and robustness in complex optimization settings. These strengths make the ISSA a valuable tool for solving high-dimensional predictive and optimization problems.
5. Multiple Regression Prediction Based on ISSA-LSTM
Multiple regression prediction plays a vital role across various domains by integrating multiple influencing factors to forecast outcomes. Optimization of LSTM neural networks via ISSA enhances prediction accuracy and reliability. However, as the number of influencing factors increases, discrepancies between predicted and actual results tend to grow. Therefore, improving the precision of multiple regression prediction has become a significant research focus in recent years.
In this section, the predictive performance of the ISSA-LSTM framework is comparatively evaluated against benchmark models. Empirical results demonstrate its superior accuracy in multivariate regression tasks.
5.1. Dataset Information
This study employed two diverse datasets from Kaggle, representing typical application domains for multivariate regression: an electricity load dataset and a real estate housing price dataset. The electricity load data comprised 625 hourly consumption records collected in June 2020 across three Indian cities (Mumbai, Delhi, and Chennai), featuring 12 variables, including temperature, humidity, and wind speed and direction, as well as temporal indicators like the date and time. Temporal features such as the time of day, the day of the week, and lagged load values were also extracted. Missing values were addressed using linear interpolation, and Min–Max normalization was applied.
The real estate dataset contained 1460 housing transaction records, each characterized by 12 attributes such as the number of bedrooms, the number of bathrooms, the living area, the year the house was built, and location-based parameters. House prices were normalized into units of thousands to facilitate interpretation.
The selection of these datasets ensured a comprehensive evaluation of the ISSA-LSTM model’s adaptability, robustness, and generalization in scenarios with both structured and sequential data.
5.2. ISSA-LSTM Load Forecasting Model
The initial hyperparameter settings of LSTM neural networks often result in suboptimal prediction performance [44]. To overcome this, the ISSA was introduced to dynamically optimize three critical hyperparameters: the number of hidden layer nodes, the number of training epochs, and the learning rate. Specifically, the learning rate controls convergence behavior—a rate that is too low slows training, while a rate that is too high risks entrapment in local optima. Meanwhile, the complexity of the hidden layer and the training duration directly impact predictive accuracy [45]. The ISSA-LSTM model was implemented as follows:
Step 1: Preprocess the data to define the inputs and outputs for the ISSA-LSTM regression model. Feature parameters are extracted from the housing price and electric load datasets as inputs, with corresponding target values as outputs. Due to differences in dimensionality and scale, normalization is applied before splitting the dataset into training and testing subsets at a 4:1 ratio.
Step 2: Configure ISSA parameters including the dimensionality, population size, maximum iterations, and early-warning thresholds. Initialize the sparrow population and establish the LSTM regression model along with the hyperparameter search ranges.
Step 3: Employ the ISSA to iteratively optimize the three hyperparameters: the learning rate, the number of hidden nodes, and the number of epochs. During optimization, experimental data train the model, and the test set RMSE is used as the objective metric. After T iterations, the algorithm converges to an optimal hyperparameter set that minimizes prediction error while balancing the computational cost.
Step 4: Deploy the optimized ISSA-LSTM model for multivariate regression prediction. Validate its performance by comparing the predicted outputs with the ground-truth values of the test set and quantify its accuracy through statistical error metrics to demonstrate improved predictive power and robustness.
5.3. Model Parameter Settings and Evaluation Indicators
This study employed a single-layer LSTM network architecture and selected “Adam” as the optimizer. The gradient clipping threshold was set to 1.0 to avert gradient explosion. All remaining network parameters adopted default configurations, with only the target hyperparameters undergoing optimization.
The basic parameter configurations for each algorithm in the LSTM neural network optimization are shown in Table 3. To ensure experimental fairness, key parameters were kept consistent across the algorithms. Based on the proposed ISSA-LSTM model and the comparative models, multiple regression prediction experiments were conducted on the two datasets described earlier.

Table 3.
Basic parameter settings of optimization algorithm.
The performance assessment metrics employed in this study were as follows:
RMSE quantifies the quadratic mean deviation between model predictions and ground-truth observations:
The Mean Absolute Error (MAE) is mathematically defined as the average of absolute differences between predicted values and corresponding actual measurements:
For the Coefficient of Determination (), the closer its value is to one, the more accurate the results:
5.4. Experimental Results and Analysis of Multiple Regression Prediction
This study employed the ISSA alongside other optimization algorithms to identify the optimal hyperparameter configurations for LSTM prediction models. Experimental validation was performed on models optimized by each algorithm using two datasets.
Figure 3 and Figure 4 illustrate the prediction curves of LSTM models optimized by different algorithms for the electric load and real estate price datasets, respectively. The ISSA-LSTM model demonstrated the closest fit to the actual data, exhibiting minimal deviation in both cases. Table 4 and Table 5 further confirm that ISSA-LSTM achieved the lowest prediction errors across all evaluated metrics.
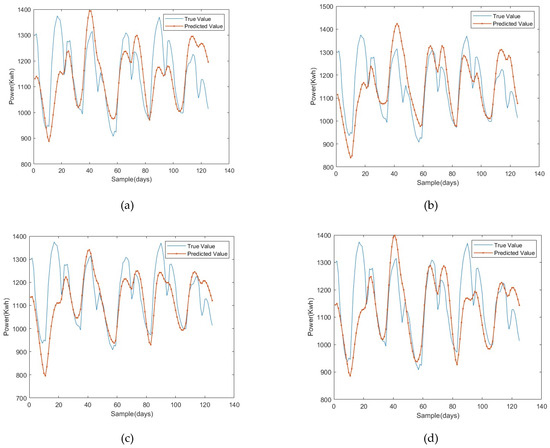
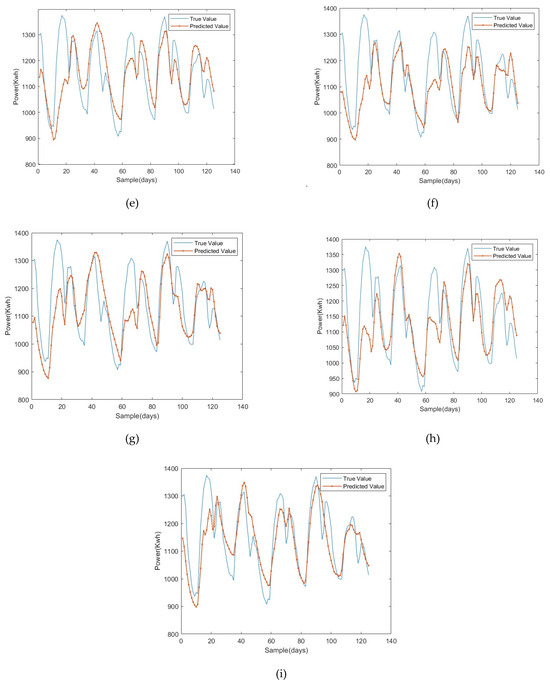
Figure 3.
Comparison plots of true and predicted values for electric load dataset. (a) LSTM. (b) GWO-LSTM. (c) PSO-LSTM. (d) GOOSE-LSTM. (e) DE-LSTM. (f) GA-LSTM. (g) SSA-LSTM. (h) SSA1-LSTM. (i) ISSA-LSTM.
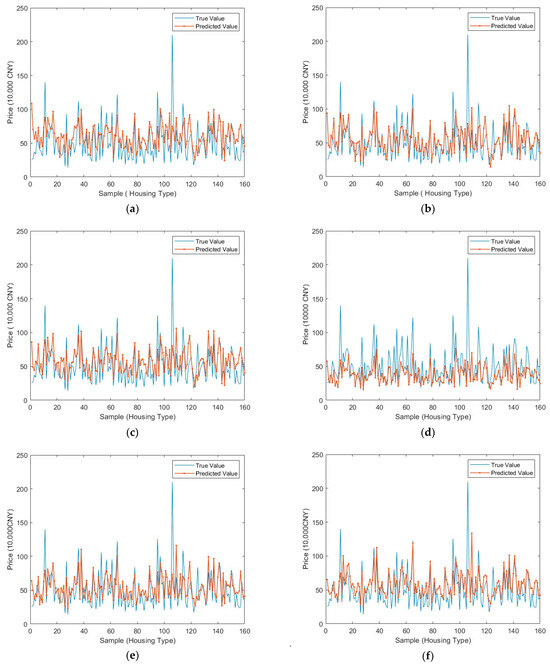
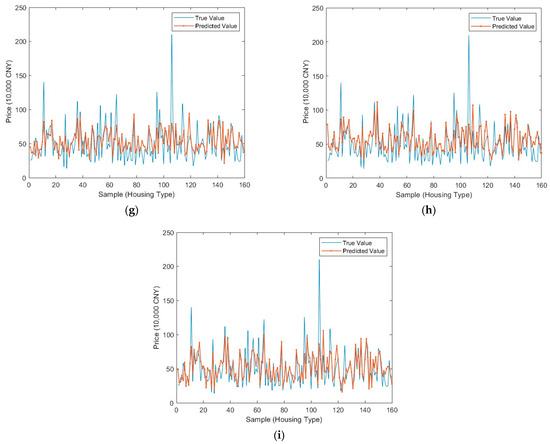
Figure 4.
Comparison plots of true and predicted values for real estate housing price dataset. (a) LSTM. (b) GWO-LSTM. (c) PSO-LSTM. (d) GOOSE-LSTM. (e) DE-LSTM. (f) GA-LSTM. (g) SSA-LSTM. (h) SSA1-LSTM. (i) ISSA-LSTM.

Table 4.
Prediction errors and hyperparameters of different models (electric load dataset).

Table 5.
Prediction errors and hyperparameters of different models (real estate housing price dataset).
Building on the critical role of hyperparameter optimization, comparative experiments revealed the superior fitting performance of the ISSA-LSTM model. Table 5 highlights that ISSA-LSTM attained the smallest average prediction errors, with significantly better MAE and RMSE values compared to SSA-LSTM, GWO-LSTM, and other models. Its forecasting deviation was also notably lower than that of the PGOA-LSTM framework [46], underscoring its enhanced prediction accuracy.
Table 5 reinforces these findings, showing that ISSA-LSTM consistently achieved the highest accuracy and the lowest MAE/RMSE values, confirming its robustness and effectiveness.
In summary, the ISSA-LSTM model exhibits outstanding prediction accuracy and a strong generalization ability in electric load and real estate price forecasting, offering a reliable solution for time-series prediction in these domains.
6. Conclusions
This study presented an ISSA framework and assessed its optimization performance against several metaheuristic algorithms through extensive benchmarking on 10 standard test functions. The results show that the ISSA achieved faster convergence on unimodal functions by swiftly approaching the optimal solution. For multimodal functions, it effectively balanced global exploration and local exploitation, improving the search for optimal solutions and reducing the risk of local optima. In composite function optimization, the ISSA demonstrated high stability and efficiency, consistently converging to optimal solutions across multiple trials. By integrating the ISSA with the LSTM neural network, we developed the ISSA-LSTM model for multivariate regression prediction, where the ISSA adaptively optimizes three critical hyperparameters: the number of training epochs, the hidden layer size, and the learning rate. Experimental validations on two datasets revealed that ISSA-LSTM significantly outperformed competing models in prediction accuracy, confirming its effectiveness and superiority in multivariate regression tasks. The model’s enhanced predictive performance arises from the synergy between the ISSA’s strong global optimization capabilities and LSTM’s proficiency in modeling sequential data. The ISSA improves hyperparameter search through reverse learning-based population initialization, adaptive step-size control, and Lévy flight, enabling broader exploration of the parameter space and mitigating premature convergence. This leads to parameter configurations better aligned with data characteristics, allowing the LSTM to capture nonlinear relationships and long-term dependencies more effectively, thereby boosting generalization and prediction stability.
Despite promising results, there remains potential for improvement. This work focused on optimizing three hyperparameters: the number of hidden layer nodes, the number of training epochs, and the learning rate. Nonetheless, other aspects such as the number of layers, the connectivity patterns, and the forget gate thresholds also influence accuracy. Future research will employ the ISSA to further optimize these elements and comprehensively enhance the LSTM model.
Author Contributions
Conceptualization, J.-S.P. and S.-C.C.; Data curation, Y.Z.; Formal analysis, Y.Z.; Investigation, Y.Z. and A.R.Y.; Methodology, Y.Z. and J.-S.P.; Resources, Y.Z. and A.R.Y.; Software, Y.Z.; Validation, Y.Z. and A.R.Y.; Writing—original draft, Y.Z.; Writing—review and editing, J.-S.P. and S.-C.C.; Supervision, J.-S.P. and S.-C.C. All authors have read and agreed to the published version of the manuscript.
Funding
This research received no external funding.
Data Availability Statement
The data are contained within this article.
Conflicts of Interest
The authors declare no conflict of interest.
References
- Bharanidharan, N.; Rajaguru, H. Improved chicken swarm optimization to classify dementia MRI images using a novel controlled randomness optimization algorithm. Int. J. Imaging Syst. Technol. 2020, 30, 605–620. [Google Scholar] [CrossRef]
- Hu, H.; Shan, W.; Chen, J.; Xing, L.; Heidari, A.A.; Chen, H.; He, X.; Wang, M. Dynamic individual selection and crossover boosted forensic-based investigation algorithm for global optimization and feature selection. J. Bionic Eng. 2023, 20, 2416–2442. [Google Scholar] [CrossRef]
- Shalamov, V.; Filchenkov, A.; Shalyto, A. Heuristic and metaheuristic solutions of pickup and delivery problem for self-driving taxi routing. Evol. Syst. 2019, 10, 3–11. [Google Scholar] [CrossRef]
- Baghdadi, N.A.; Malki, A.; Abdelaliem, S.F.; Balaha, H.M.; Badawy, M.; Elhosseini, M. An automated diagnosis and classification of COVID-19 from chest CT images using a transfer learning—Based convolutional neural network. Comput. Biol. Med. 2022, 144, 105383. [Google Scholar] [CrossRef] [PubMed]
- Daniel, E.; Anitha, J.; Kamaleshwaran, K.K.; Rani, I. Optimum spectrum mask based medical image fusion using Gray Wolf Optimization. Biomed. Signal Process. Control 2017, 34, 36–43. [Google Scholar] [CrossRef]
- Chopra, N.; Ansari, M.M. Golden jackal optimization: A novel nature-inspired optimizer for engineering applications. Expert Syst. Appl. 2022, 198, 116924. [Google Scholar] [CrossRef]
- Lorestani, A.; Gharehpetian, G.B.; Nazari, M.H. Optimal sizing and techno-economic analysis of energy-and cost-efficient standalone multi-carrier microgrid. Energy 2019, 178, 751–764. [Google Scholar] [CrossRef]
- Ma, G.; Wang, Z.; Liu, W.; Fang, J.; Zhang, Y.; Ding, H.; Yuan, Y. Estimating the state of health for lithium-ion batteries: A particle swarm optimization-assisted deep domain adaptation approach. IEEE/CAA J. Autom. Sin. 2023, 1, 1530–1543. [Google Scholar] [CrossRef]
- Mohanty, S.; Subudhi, B.; Ray, P.K. A grey wolf-assisted perturb & observe MPPT algorithm for a PV system. IEEE Trans. Energy Convers. 2017, 32, 340–347. [Google Scholar]
- Singh, G.; Singh, A. A hybrid algorithm using particle swarm optimization for solving transportation problem. Neural Comput. Appl. 2020, 32, 11699–11716. [Google Scholar] [CrossRef]
- Bredael, D.; Vanhoucke, M. A genetic algorithm with resource buffers for the resource constrained multi-project scheduling problem. Eur. J. Oper. Res. 2024, 315, 19–34. [Google Scholar] [CrossRef]
- Kennedy, J.; Eberhart, R. Particle swarm optimization. In Proceedings of the ICNN’95-International Conference on Neural Networks, Perth, WA, Australia, 27 November–1 December 1995; pp. 1942–1948. [Google Scholar]
- Dorigo, M.; Birattari, M.; Stutzle, T. Ant colony optimization. IEEE Comput. Intell. Mag. 2007, 1, 28–39. [Google Scholar] [CrossRef]
- Mirjalili, S.; Lewis, A. The whale optimization algorithm. Adv. Eng. Softw. 2016, 95, 51–67. [Google Scholar] [CrossRef]
- Mirjalili, S.; Mirjalili, S.M.; Lewis, A. Grey wolf optimizer. Adv. Eng. Softw. 2014, 69, 46–61. [Google Scholar] [CrossRef]
- Heidari, A.A.; Mirjalili, S.; Faris, H.; Aljarah, I.; Mafarja, M.; Chen, H. Harris hawks optimization: Algorithm and applications. Future Gener. Comput. Syst. 2019, 97, 849–872. [Google Scholar] [CrossRef]
- Storn, R.; Price, K. Differential evolution—A simple and efficient heuristic for global optimization over continuous spaces. J. Glob. Optim. 1997, 11, 341–359. [Google Scholar] [CrossRef]
- Yang, X.S.; He, X. Bat algorithm: Literature review and applications. Int. J. Bio-Inspired Comput. 2013, 5, 141–149. [Google Scholar] [CrossRef]
- Chu, S.C.; Wang, T.T.; Yildiz, A.R.; Pan, J.S. Ship rescue optimization: A new metaheuristic algorithm for solving engineering problems. J. Internet Technol. 2024, 25, 61–78. [Google Scholar]
- Pan, J.S.; Fu, Z.; Hu, C.C.; Tsai, P.W.; Chu, S.C. Rafflesia optimization algorithm applied in the logistics distribution centers location problem. J. Internet Technol. 2022, 23, 1541–1555. [Google Scholar]
- Hamad, R.K.; Rashid, T.A. GOOSE algorithm: A powerful optimization tool for real-world engineering challenges and beyond. Evol. Syst. 2024, 15, 1249–1274. [Google Scholar] [CrossRef]
- Xue, J.; Shen, B. A novel swarm intelligence optimization approach: Sparrow search algorithm. Syst. Sci. Control Eng. 2020, 8, 22–34. [Google Scholar] [CrossRef]
- Ouyang, C.T.; Zhu, D.L.; Qiu, Y.X. Improved sparrow search algorithm based on clustering algorithm. Comput. Simul. 2022, 39, 392–397. [Google Scholar]
- Su, Y.Y.; Wang, S.X. Adaptive hybrid strategy sparrow search algorithm. Comput. Eng. Appl. 2023, 59, 75–85. [Google Scholar]
- Yan, S.; Liu, W.; Yang, P.; Wu, F.; Yan, Z. Multi group sparrow search algorithm based on k-means clustering. J. Beijing Univ. Aeronaut. Astronaut. 2022, 50, 508–518. [Google Scholar]
- Huang, H.X.; Zhang, G.Y.; Chen, S.Y. WOA based on chaotic weight and elite guidance. Transducer Microsyst. Technol. 2020, 39, 113–116. [Google Scholar]
- Licht, M.H. Multiple regression and correlation. In Reading and Understanding Multivariate Statistics; Grimm, L.G., Yarnold, P.R., Eds.; American Psychological Association: Washington, DC, USA, 1995; pp. 19–64. [Google Scholar]
- Knofczynski, G.T.; Mundfrom, D. Sample sizes when using multiple linear regression for prediction. Educ. Psychol. Meas. 2008, 68, 431–442. [Google Scholar] [CrossRef]
- Zhang, D.; Shen, D. Alzheimer’s Disease Neuroimaging Initiative, Multi-modal multi-task learning for joint prediction of multiple regression and classification variables in Alzheimer’s disease. NeuroImage 2012, 59, 895–907. [Google Scholar] [CrossRef]
- Heim, C.; Newport, D.J.; Wagner, D.; Wilcox, M.M.; Miller, A.H.; Nemeroff, C.B. The role of early adverse experience and adulthood stress in the prediction of neuroendocrine stress reactivity in women: A multiple regression analysis. Depress. Anxiety 2002, 15, 117–125. [Google Scholar] [CrossRef]
- Chu, C.W.; Zhang, G.P. A comparative study of linear and nonlinear models for aggregate retail sales forecasting. Int. J. Prod. Econ. 2003, 86, 217–231. [Google Scholar] [CrossRef]
- Acharya, U.R.; Oh, S.L.; Hagiwara, Y.; Tian, J.H.; Adam, M.; Gertych, A.; Tan, R.S. A deep convolutional neural network model to classify heartbeats. Comput. Biol. Med. 2017, 89, 389–396. [Google Scholar] [CrossRef]
- Xue, Y.; Onzo, B.M.; Mansour, R.F.; Su, S. Deep Convolutional Neural Network Approach for COVID-19 Detection. Comput. Syst. Sci. Eng. 2022, 42, 201–211. [Google Scholar] [CrossRef]
- Kim, T.Y.; Cho, S.B. Predicting residential energy consumption using CNN-LSTM neural networks. Energy 2019, 182, 72–81. [Google Scholar] [CrossRef]
- Sun, Y.G.; Liu, K.J. Failure rate of avionics system forecasting based on PSO-LSTM network. Aeronaut. Sci. Technol. 2021, 32, 17–22. [Google Scholar]
- Peng, L.; Liu, S.; Liu, R.; Wang, L. Effective long short-term memory with differential evolution algorithm for electricity price prediction. Energy 2018, 162, 1301–1314. [Google Scholar] [CrossRef]
- Pal, R.; Sekh, A.A.; Kar, S.; Prasad, D.K. Neural network based country wise risk prediction of COVID-19. Appl. Sci. 2020, 10, 6448. [Google Scholar] [CrossRef]
- Yan, B.; Peng, H.; Fu, J.; Wang, D.; Lu, H. Learning Spatio-emporal Transformer for Visual Tracking. In Proceedings of the IEEE/CVF International Conference on Computer Vision, Montreal, QC, Canada, 11–17 October 2021; pp. 10448–10457. [Google Scholar]
- Hochreter, S.; Schmidhuber, R. Long short-term memory. Neural Comput. 1997, 9, 1735–1780. [Google Scholar] [CrossRef]
- Tizhoosh, H.R. Opposition-based learning: A new scheme for machine intelligence. In Proceedings of the International Conference on Computational Intelligence for Modelling, Control and Automation, and International Conference on Intelligent Agents, Web Technologies and Internet Commerce, Vienna, Austria, 28–30 November 2005; pp. 695–701. [Google Scholar]
- Reynolds, A. Liberating Lévy walk research from the shackles of optimal foraging. Phys. Life Rev. 2015, 14, 59–83. [Google Scholar] [CrossRef]
- Iacca, G.; Junior, V.C.D.S.; Melo, V.V.D. An improved Jaya optimization algorithm with Lévy flight. Expert Syst. Appl. 2020, 165, 113902. [Google Scholar] [CrossRef]
- Gao, L.F.; Rong, X.J. Improved YSGA algorithm combining declining strategy and Fuch chaotic mechanism. J. Front. Comput. Sci. Technol. 2021, 15, 564–576. [Google Scholar]
- Ordieres, J.; Vergara, E.; Capuz, R.; Salazar, R. Neural network prediction model for fine particulate matter (PM2. 5) on the US–Mexico border in El Paso (Texas) and Ciudad Juárez (Chihuahua). Environ. Model. Softw. 2005, 20, 547–559. [Google Scholar] [CrossRef]
- Lin, S.L.; Huang, C.F.; Liou, M.H.; Chen, C.Y. Improving Histogram-based Reversible Information Hiding by an Optimal Weight-based Prediction Scheme. J. Inf. Hiding Multimed. Signal Process. 2013, 4, 19–33. [Google Scholar]
- Pan, J.-S.; Wang, W.; Chu, S.-C.; Shao, Z.-Y.; Yang, H.-M. LSTM Neural Network with Parallel Swarm Optimization Algorithm for Multiple Regression Prediction. J. Internet Technol. 2024, 25, 1035–1049. [Google Scholar] [CrossRef]
Disclaimer/Publisher’s Note: The statements, opinions and data contained in all publications are solely those of the individual author(s) and contributor(s) and not of MDPI and/or the editor(s). MDPI and/or the editor(s) disclaim responsibility for any injury to people or property resulting from any ideas, methods, instructions or products referred to in the content. |
© 2025 by the authors. Licensee MDPI, Basel, Switzerland. This article is an open access article distributed under the terms and conditions of the Creative Commons Attribution (CC BY) license (https://creativecommons.org/licenses/by/4.0/).