Article

Relationship Between Offensive Performance and Symmetry of Muscle Function, and Injury Factors in Elite Volleyball Players

1
Department of Physical Education, Gangneung-Wonju National University, Gangneung 25457, Republic of Korea
2
College of Sport Science, Sungkyunkwan University, Suwon 16419, Republic of Korea
3
Laboratory of Integrated Physiology, Department of Health and Human Performance, University of Houston, Houston, TX 77204, USA
*
Authors to whom correspondence should be addressed.
Symmetry 2025, 17(6), 956; https://doi.org/10.3390/sym17060956 (registering DOI)
Submission received: 12 May 2025 / Revised: 12 June 2025 / Accepted: 14 June 2025 / Published: 16 June 2025
(This article belongs to the Section Life Sciences)

Abstract

:
In volleyball, successful offensive performance is influenced not only by physical muscle function but also by injury status. The purpose of this study was to analyze the relationship between muscle function—including strength, balance, and symmetry—and injury history in relation to offensive performance (OP) and ultimately sought to find factors required to improve OP. The final analysis included 60 players in attacking positions (36 in the symmetry group and 24 in the asymmetry group). Muscle strength was assessed using isokinetic testing for shoulder and knee extension. Balance was evaluated using the Upper Quarter Y-Balance Test (UQ-YBT) and the Lower Quarter Y-Balance Test (LQ-YBT). The asymmetry index (AI, ≥10%) was calculated by comparing the dominant and non-dominant sides. The results showed that the asymmetry group had a higher injury rate and lower offensive performance (OP) than the symmetry group (p < 0.05). In multiple regression analysis, no significant predictors were found on the non-dominant side, whereas significant variables were identified only on the dominant side. The key variables influencing OP were shoulder and knee extension strength, UQ-YBT scores, and the AI of knee extension. A 13.8% improvement in shoulder extension strength on the dominant side increased the likelihood of enhanced offensive performance (OP) by 2.54 times. A 10.5% improvement in the asymmetry index (AI) of knee extension was associated with a 1.52-fold increase in OP (p < 0.05). Shoulder and knee flexion did not significantly affect OP in any of the tests (p > 0.05). In conclusion, offensive performance in volleyball is associated with the greater shoulder and knee extension strength of the dominant side, as well as positive changes in UQ-YBT scores and the AI of knee extension.

1. Introduction

Volleyball is a dynamic sport that requires players to excel in physical, technical, tactical, and mental skills to perform well [1]. One of the key techniques that determines the outcome of a volleyball game is offensive performance (OP), such as spiking or hitting. OP directly contributes to a team’s ability to score points, regain service rights, and boost team morale [2]. Due to the repetitive jumping and attacking actions involved in Challoumas volleyball, performance is influenced by intrinsic player factors such as muscle strength, balance, asymmetry, and injury history—even when psychological and technical elements are excluded [3].
The strength is also used as a predictor of an athlete’s potential capacity, and in volleyball, it often reflects the power behind an attack. A study by Leeuw et al. investigated the relationship between offensive and defensive performance using the training and physical profiles of elite multi-sport athletes, finding that lower-body strength training was associated with improved attack performance [4]. Jennifer et al. conducted a retrospective analysis exploring the correlation between strength status and in-game performance through correlation and multiple regression analyses. Their findings showed that, regardless of playing position, defense, blocking, and offense were all correlated with players’ strength and conditioning. Offensive success, in particular, was strongly influenced by vertical jump ability, squat performance, and overall strength [5]. Brumitt et al. conducted a longitudinal analysis of the performance of each position during the season after performing various muscle function tests before the season. They reported that the results of the bilateral lower extremity balance and the left single-leg hop test were significantly correlated with the increase in hitter points [6].
Volleyball is a sport in which the unilateral movement of the upper limbs is strongly revealed due to the nature of the game. Therefore, the study reported asymmetry in shoulder strength in 50% of the participants [7]. Hadzic et al. specifically examined shoulder asymmetry, noting that dominant limbs typically exhibited greater strength than non-dominant ones, regardless of position or injury status [8]. Additionally, asymmetry in lower-limb strength and neuromuscular imbalances have been shown to negatively affect jump performance [9]. As a result, experts have emphasized that muscle function asymmetry in both upper and lower extremities should not be overlooked, as it plays a crucial role in injury prevention and athletic performance improvement [8].
Dynamic balance has been applied for injury prevention, prediction, and functional evaluation and also in various ways as a tool to comprehensively evaluate muscle function in volleyball players [10]. Previous studies have investigated the weakness of balance in unilateral athletes, such as volleyball players. It has been reported that athletes in symmetrical sports such as swimming and sprinting have a better balance between the upper and lower body than athletes in asymmetrical sports such as volleyball. This phenomenon is said to apply not only to dominants but also to non-dominants [11]. Wang et al. explored the relationship between balance ability and other athletic factors in volleyball players, finding significant correlations between lower-limb strength, explosive power, agility, and sports-related injuries [12]. Furthermore, upper-body perturbation training over 6 weeks was shown to improve shoulder strength, proprioception, and upper-limb performance in volleyball players [13]. Asymmetry in dynamic balance not only reduces vertical jump height but also serves as a marker for injury risk. It may impair offensive success through diminished strength, loss of motor control, increased error rates, and heightened mental distress [10,14]. In volleyball players, lower limb injuries are more common than upper limb injuries, and asymmetry of lower limb balance can predict lower limb injuries; asymmetry can also appear after injuries. Therefore, it was explained that it is very useful to check asymmetry through YBT for volleyball players [10].
In this context, understanding how strength, balance, asymmetry, and injury interact to influence OP is essential. While many studies have investigated the factors contributing to OP, few have addressed the relative importance of upper-body dynamic balance and asymmetry using comparative data from consecutive seasons. Additionally, identifying cut-off values and corresponding odds ratios for these variables would represent a novel contribution.
Therefore, this study aimed to analyze the relationship between muscle function, injury, and OP across two seasons in elite volleyball players specializing in attacking positions, such as outside hitter and opposite spiker. The study hypothesized that strength, balance, and injury status would significantly influence OP.

2. Methods

2.1. Design and Participants

The participants in this study were players from two teams in the first division of the Korean men’s professional volleyball league, and the data of players who visited a sports training center and agreed to the research purpose were included. The visits were made during the post-season after the off-season. The timing was May or June.
To select an appropriate sample size, G*power 3.1.9.4 (G*power, University of Düsseldorf, Düsseldorf, NRW, Germany) was used. In this study, the most important analysis was multiple regression analysis, and 60 people were included under the following conditions: α err prob, 0.05; power (1-β err prob), 0.80. The initial data pool consisted of 67 players, but three were excluded due to surgery or serious injury that prevented measurements. Additionally, three players were excluded because they sustained injuries to both upper and lower extremities during the same season, and four players missed more than 50% of the season due to surgery or long-term rehabilitation. The final sample consisted of 60 players, 26 of whom had two consecutive seasons. Since data were collected from players who visited the center and agreed to the research content, the sampling method was convenience sampling.
The players’ mean age was 26.2 ± 3.5 years, height was 194.5 ± 4.6 cm, weight was 87.6 ± 4.8 kg, and volleyball experience was 14.1 ± 2.4 years. Only attackers (outside hitters and opposite spikers), whose primary role was offense, were included in the analysis. All players were informed of the purpose and procedures of the study and gave written consent before participation. The research was approved by the Sungkyunkwan University Institutional Review Board (No. 2024-05-028).

2.2. Data Curation

Data collection included information on current and past injuries, OP as attack success rate, isokinetic knee and shoulder strength tests, and dynamic balance assessments using the Upper Quarter Y-Balance Test (UQ-YBT) and Lower Quarter Y-Balance Test (LQ-YBT). OP is the success rate for attack attempts in %; OP = (success/attempts) × 100. This is the method proposed by the Volleyball Information System of the International Volleyball Federation [15]. We compared the OP of last season and this season and divided them into groups that increased and groups that decreased. We compared the OP of last season and this season and divided them into a decreasing group (DG) and an increasing group (IG) of OP. Injuries were recorded for the previous season and this season, and in this study, they were divided into “Yes” and “No” based on the history of missing games due to injuries.
For muscle strength and balance, we confirmed the increase and decrease by adopting actual values from last season and this season and calculating the change rate. In addition, we calculated the asymmetry index (AI, %) to check the asymmetry between the dominant and non-dominant; AI (%) = ((max limb − min limb)/max limb) × 100. Asymmetry was defined as a difference of 10% or more [16,17]. If any part of strength and balance had an AI of ≥10%, it was classified as an “asymmetry group”. If all parts had an AI of <10%, it was classified as a “symmetry group” [12].

2.3. Isokinetic Strength Test

Knee and shoulder muscle strength were measured using a computer-controlled isokinetic device (CSMi HUMAC NORM, Stoughton, MA, USA), assessing extension and flexion at an angular velocity of 60°/s [18,19]. Sufficient time was provided for stretching and warm-ups before the test. Testing was performed on the shoulder first, followed by the knee after adequate rest. For safety, the healthy or dominant side was tested first, followed by the opposite side. To create a familiar testing environment for the players, observation and demonstration were conducted, and the players were allowed to practice. The number of repetitions of the exercise was 4, with a minimum rest period of 60 s. After that, the number of repetitions of the actual test was 4, and the peak value was used for the analysis. The examiner gave verbal encouragement to motivate the participant to express maximum muscle strength. Upon the examiner’s signal (“start”), the participant performed extension with maximum effort. On a second “start” signal, the participant performed flexion. If the participant demonstrated a lack of understanding or improper posture, the test was repeated [20]. The results were recorded in Newton-meters (Nm) and normalized for body mass (Nm/kg) by dividing by body weight [21].
Shoulder flexion and extension: The participant lay in a supine and attentive position. The examiner adjusted the dynamometer so that the axis aligned with the center of the humeral head, and the adapter length was set to keep the arm straight. To minimize unnecessary movement during the test, the participant held a fixed handle with the opposite hand, and the chest, waist, and knees were secured with straps. The participant gripped the testing handle and remained in a flexed position until the test began. The range of motion for the test was from 0° to 180° [19].
Knee flexion and extension: The equipment was adjusted to a chair-type setup with a backrest. The participant held the handles of the device to stabilize the upper body, while the chest, waist, and thighs were secured with straps. The rotational axis was aligned with the lateral epicondyle of the femur, and the adapter was positioned at the distal end of the tibia and secured with straps. The test was conducted from 0° of extension to 90° of flexion [18].

2.4. YBT Test

The YBT is a dynamic balance assessment performed using a YBT kit (FMS Inc., Chatham, VA, USA) [22]. The upper quarter (UQ) was measured first, followed by the lower quarter (LQ). The intra-rater reliability of this test for LQ-YBT was 0.88–0.90 [23], and it ranges from 0.80 to 0.99 for UQ-YBT [24]. Measurements were taken in the following sequence: anterior, posteromedial, and posterolateral directions. The stance limb or arm was positioned on the central platform, while the opposite limb or arm reached as far as possible along the designated pads. Measurements were recorded in centimeters, and the highest value from three trials was used for analysis. Limb Length Measurements: Lower limb length: Measured from the right anterior superior iliac spine to the right medial malleolus in the supine position. Upper limb length: The athlete abducted the arm to 90°, and the length was measured from the C7 vertebra to the tip of the middle finger.
Since the YBT score is affected by the length of the upper and lower limbs, normalizations were performed to take this into account, and it was calculated using the following formula: YBT score = [(sum distance of three directions)/(limb length × 3)] × 100 [22].

2.5. Data Analysis

Data were analyzed using SPSS (version 25.0) (IBM Corp., Armonk, NY, USA). Shapiro–Wilk was used to test for normality for continuous variables, and parametric methods were applied because the data were normalized. An independent t-test and chi-square test were conducted to compare groups with increased and decreased attack success rates compared to the previous year. Subsequently, Pearson correlation analysis was performed to examine relationships among all variables related to OP, including strength, balance, and symmetry. Variables showing significant correlations were then included in a multiple regression analysis with stepwise selection to identify key factors influencing OP. Following this, a receiver operating characteristic (ROC) curve and area under the curve (AUC) analysis was conducted to determine cut-off values for the variables affecting OP. Finally, logistic regression analysis was performed using these cut-off values to calculate odds ratios and to assess the likelihood of an increase in OP. Statistical significance was set at p < 0.05, with a 95% confidence interval.

3. Results

3.1. General Characteristics

Table 1 summarizes the data for each group. Statistical analysis revealed no significant differences in age, height, weight, and playing career (p < 0.05). However, a significant difference was observed in offensive performance. There were 6 players in the symmetry group and 7 in the asymmetry group who sustained upper body injuries, and 8 and 10 in the lower body, respectively. So, a total of 17 players sustained injuries during the season, resulting in time loss from the game. The time loss due to upper body injuries was 17.8 ± 1.7 days and 18.0 ± 1.5 days, respectively, and the time loss due to lower body injuries was 18.6 ± 2.6 days and 19.4 ± 2.2 days, respectively, with no significant difference.

3.2. Muscle Function and Asymmetry Index at Last and This Season

Table 2 shows the results comparing muscle function and AI from last season and this season. First, shoulder and knee extension already showed significant differences in the AI in the offense-decreased group (DG) and offense-increased group (IG) last season (Table 2). This season, the DG group continued to exhibit significant asymmetry in shoulder and knee extension, with additional asymmetry observed in both the UQ- and LQ-YBT. In the IG group, shoulder extension strength asymmetry was 15.0% last season; although shoulder extension strength of the dominant side improved slightly, it still showed 11.7% asymmetry this season.
Next are the results for strength and balance. In the IG group, improvements were observed in UQ-YBT and shoulder extension strength on the dominant side compared to last season. However, in the DG group, the same variables declined. Overall, asymmetry increased in the group with lower OP, while players with better performance showed improvements in symmetry.

3.3. Correlation and Multiple Regression of Between Attack and Strength and Balance

Table 3 calculated the correlation using the change rate of muscle function and OP this season compared to last season. Through this analysis, we aimed to determine whether increases or decreases in OP were related to any variables of strength and balance. DMN side in UQ-YBT and in shoulder and knee extension strength had a significant positive relationship. The AI in LQ-YBT and in shoulder and knee extension strength showed a negative correlation.
Table 4 shows the multiple regression analysis using the significant variables given in Table 3. Through this process, factors that have a greater influence on the attack success rate were found. Four variables were finally selected as factors that affect OP. Dominant side in shoulder and knee extension strength, dominant side in UQ-YBT, and AI in knee extension strength were selected (Table 4).

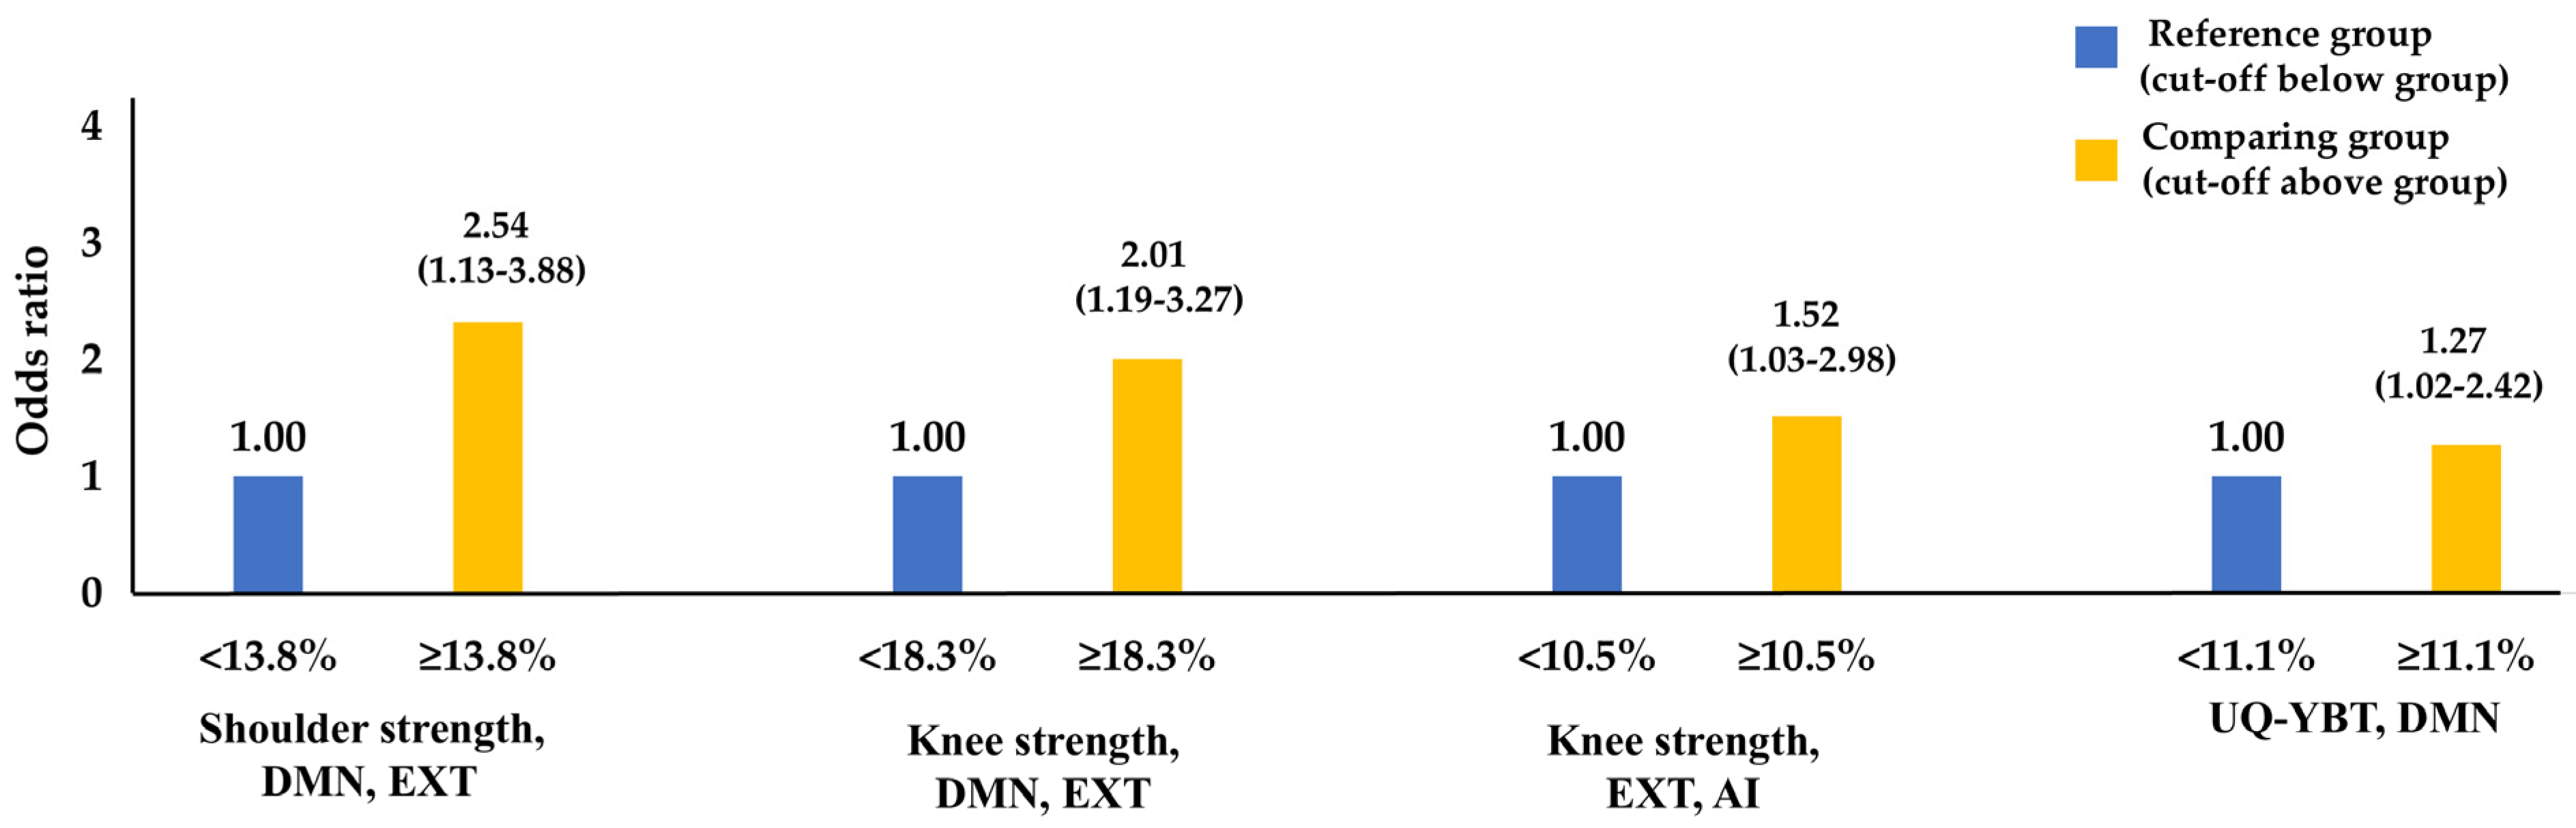
3.4. Cut-Off Values for Offensive Performance and Odds Ratio

This analysis found the cut-off value for OP using the variables selected in Table 4. The improvement rate of the variables this year compared to last year was calculated, and the ROC curve analysis method was used using the value. Therefore, the cut-off values were 13.8% for the dominant side in shoulder extension strength, 18.3% for the dominant side in knee extension strength, 10.5% for the AI in knee extension strength, and 11.1% for the dominant side in UQ-YBT (Table 5).
The odds ratio of OP was calculated using these cut-off values. First, when the shoulder extension strength in the dominant side improved by 13.8% or more, the likelihood of OP improvement increased by 2.54 times. Similarly, an 18.3% improvement in knee extension strength of dominant was associated with a 2.01-fold increase in OP, a 10.5% improvement in knee extension strength of AI was associated with a 1.52-fold increase in OP, and finally, an 11.1% improvement in UQ-YBT of dominant was associated with a 1.27-fold increase in OP (Figure 1).

4. Discussion

In a previous study, although attackers may not possess superior overall physical strength compared to other positions, they performed better in 60 s sit-ups. Additionally, attackers demonstrated greater spike and block reach, highlighting their specific physical attributes [25]. This study focused on the relationship between upper and lower body strength, balance, and asymmetry in elite volleyball attackers and their attack success rate.
One of the main findings was that knee extension strength had a significant impact on performance. This result aligns with trends reported in previous studies. Bunn et al. conducted a study on elite male volleyball players, comparing 76 Division I college athletes with varying levels of physical strength across positions and performance levels. They found that attack success was positively correlated with vertical jump height, squat performance, and overall strength [5]. Similarly, a study by Leeuw et al. used wearable devices to monitor body load in volleyball players, with movement analysis performed by a video analyst. They applied a method to identify predictive variables related to attack performance and found that players who engaged in intensive lower-body strength training for 4 weeks showed improved attack performance. In contrast, those with lower attack performance exhibited a correlation with reduced jump height [4]. However, some studies have reported differing results. Challoumas et al. analyzed predictors of attack performance in 22 elite male volleyball players and found that only age showed a significant correlation with attack effectiveness. Other factors, including vertical jump height, spike speed, volleyball experience, training frequency, and resistance training, were not significantly related to attack performance [26].
In this study, shoulder extension strength was also a positive factor in attack power. Volleyball attackers often make strong spikes. Therefore, the posterior deltoid, latissimus dorsi, and teres major, which correspond to the extensor muscles, are bound to have high activity [27]. Marques et al. investigated differences in physical strength by position in elite male volleyball players. They found that opposite hitters—who primarily perform spikes—had significantly greater maximum bench press strength compared to setters and liberos [28]. Conversely, another study presented a differing perspective, reporting that excessive upper-body strength training was negatively correlated with attack performance. The authors suggested that this may be due to an overemphasis on upper body strength, potentially reducing accuracy and control in attacks [4].
In this study, an attempt was made to confirm the association between YBT and OP. Among these, UQ-YBT performance showed significance in both the OP increasing and decreasing groups. The UQ-YBT assesses not only upper body balance but also core stability; therefore, a high UQ-YBT score ultimately reflects the essential role of core muscles [29]. The UQ-YBT score could predict injuries in volleyball players. In a prospective study conducted on 132 volleyball players, the incidence of injury increased by 1% for each increase in score [30]. To our knowledge, no direct relationship between UQ-YBT and OP has been studied yet. However, there are several studies that have investigated the relationship between influencing factors OP and UQ-YBT. It was reported that the UQ-YBT of the dominant side in volleyball players was related to the isometric strength of the lower trapezius [31]. In a study conducted by Zarei et al., a significant interaction effect was observed with improvement in UQ-YBT through short-term intensive training for the upper extremities in volleyball players, but there was no improvement in proprioception [32]. However, in a study by Mendez-Rebolledo et al., the relationship between upper limb joint stability and proprioception and UQ-YBT in volleyball players was investigated, and only a correlation was found between the inferolateral direction of UQ-YBT and active joint position sense, but no significant results were shown with any variables in the other two directions [33].
The results of the YBT indicated a decrease in the lower quarter LQ-YBT performance in the DG group. In a study examining various positions in volleyball, attackers scored lower on the LQ-YBT than setters and liberos, which contrasts with strength-related findings [6]. This may be because setters and liberos engage in more lateral movements and a wider range of motion compared to attackers, whose movements are primarily jump-oriented. In this study, injury was identified as a key factor contributing to decreased attack power, while the absence of injury increased the likelihood of OP improvement. This finding applies not only to volleyball but also to other sports [34,35]. Specifically, the LQ-YBT asymmetry results observed in the DG group during the previous season were consistent with those found in earlier studies. The YBT has been shown to function as an effective tool for assessing inter-limb asymmetry and the risk of non-contact lower limb injuries, highlighting its utility as an injury-specific test [12]. Longitudinal studies on lower extremity muscle function and volleyball point provide important information for researchers. Brumitt and colleagues measured the standing long jump, single-leg hop, lower extremity functional test, and the LQ-YBT before the season and recorded performance during the season. The results showed that the variable that significantly correlated with the point of the hitters was the LQ-YBT on both sides. In addition, the LQ-YBT showed significant results with the performance of not only hitters but also liberos’ digs and setters’ assists [6]. In addition, another study by Brumitt used the asymmetry of the single-leg hop test to track the risk of injury during the season. The results showed that the group with asymmetry had a 6.2-fold increased risk of injury compared to the control group [36].
Various studies have investigated the symmetry of muscle function in volleyball players. A study conducted by Mattes et al. measured grip strength, leg press, and trunk rotation in volleyball players but reported no significant left–right asymmetry [37]. In contrast, Kozinc’s study performed various physical tests on volleyball players and found that variables with AI greater than 10% included maximal knee torque, rate of torque development, and counter-movement jump [12]. While sports scientists generally do not view asymmetry positively, they are unable to determine whether it is due to unilateral activity or injury resulting from the technical demands of volleyball. This is because asymmetry can have a negative impact on both performance and injury risk [38]. This phenomenon is not limited to volleyball; similar patterns have been observed in other sports as well. Notably, contrast training has been shown to help resolve asymmetry, with improvements achieved in just 8 weeks during the season [39].
In a large-scale study of 422 volleyball players, 60% reported shoulder problems. Attackers, in particular, experienced more issues related to jumping, and asymmetry in coracoid tightness and pain was significantly correlated with these problems. Fortunately, risk factors for players, such as instability, tightness, strength, and balance, are modifiable (excluding age and gender), highlighting the importance of injury prevention programs [40].
Asymmetry of muscle function has been considered as a potential injury risk for athletes. It changes joint kinematics because it causes an uneven distribution of mechanical load during dynamic movements, and repetitive stress acts as an overload that exceeds the physiological tolerance [41]. Biomechanical imbalances generate compensatory movements, which in turn create a vicious cycle that adds to other stresses. Asymmetry causes neuromuscular coordination and proprioception to decrease, which ultimately increases the risk of injury because it changes the optimal neuromuscular mechanism [42].
The sports scientists have made various attempts to improve volleyball OP. However, each study has reported different results. For instance, a study using video analysis with high-speed camera footage suggested that the probability of attack success is related to attack speed [43]. On the other hand, Challoumas reported that while spike speed was correlated with vertical jump height and resistance training, it was not related to attack effectiveness [26]. These contrasting results suggest that offensive performance in volleyball is not necessarily proportional to technical and tactical factors rather to physical strength and highlight the need for further research in volleyball.
Despite the many strengths of this study, this study has several strengths compared to other research. It analyzed UQ- and LQ-YBT asymmetry in relation to OP and identified a potential cut-off value through the ROC curve. These findings suggest that the results could be applied effectively in the field. The study also highlighted that knee extension, rather than flexion, is a key factor affecting attack success, emphasizing the critical need for injury management. Furthermore, it indicates that knee asymmetry should be addressed systematically by both the team and the individual player.
This study has several limitations that cannot be overlooked. Because participants were recruited using convenience sampling, there is a lack of representativeness, there is a possibility of bias, and there is a possibility that the researcher’s intention may be involved. Since the focus was on OP, only attackers and hitters were analyzed. The success of an attack requires not only strength and balance but also the ability to hit the target accurately, as well as the skill to navigate beyond the opponent’s blocking and defense. Thus, focusing solely on strength and balance as methods to increase attack success can be misleading. Consequently, there is a risk of interpretive errors. Injuries to athletes cannot be artificially controlled, and the possibility of injury increases as the frequency and duration of participation in games increase. OP is highly affected by injuries. However, this study did not include detailed information about the severity and type of injuries. The fact that it is limited to male players and that it fails to diversify positions is a fundamental limitation of this study. Therefore, this part may lead to an error of overgeneralization. Additional limitations include the following factors: training load variations and coaching style differences according to the characteristics of the training between the leader and the team, and psychological performance according to the personal tendencies of the players, which are potential confounding variables that may have influenced this study. However, this is an unanalyzable part due to a lack of data collection. The following are limitations according to statistical results: Although the ROC curve analysis is significant, the AUC is less than 0.6, and the confidence interval ranges from 0.503 to 0.597, suggesting weak discriminative power.
Although not analyzed in this study, one of the physical variables that affects the performance of volleyball players is flexibility. In a study conducted by Gulati et al., two groups were divided using flexibility, and the group with high flexibility showed significantly higher performance in agility, acceleration speed, and lower body muscular power than the group with low flexibility [44].
Future research should focus on accumulating data across various positions to identify physical factors that contribute to skills such as reception, setting, blocking, and serving, ultimately relating these factors to game outcomes (win or loss). Additionally, it will be important to develop training methods tailored to the specific game skills of each gender by comparing data between women and men. Moreover, while the ROC curve analysis was applied as a novel approach in this study, it will be necessary to validate the practicality of this cut-off value in other groups in future research.

5. Conclusions

This study explored offensive performance and its influencing factors in adult male volleyball players. Offensive performance was significantly higher in the dominant side compared to the non-dominant side and in shoulder and knee extension compared to flexion. The offensive performance was lower in the asymmetry group compared to the symmetry group. Increased offensive performance was significantly associated with shoulder and knee extension strength, as well as improvements in the UQ-YBT. In particular, improvement in knee extension asymmetry was found to increase the likelihood of a successful attack by 1.52 times.

Author Contributions

Conceptualization, M.S. and J.L.; Methodology, M.S. and Y.K.; Formal analysis, C.C. and Y.K.; Investigation, C.C. and J.L.; Writing—original draft, C.C., M.S. and J.L.; Writing—review & editing, P.S., M.S. and J.L.; Visualization, P.S., M.S. and Y.K.; Supervision, M.S. and J.L. All authors have read and agreed to the published version of the manuscript.

Funding

This research received no external funding.

Institutional Review Board Statement

The study was approved by the Institutional Review Board of Sungkyunkwan University (approval number: 2024-05-028, 14 May 2024).

Informed Consent Statement

Written informed consent was obtained from all participants.

Data Availability Statement

The original contributions presented in the study are included in the article, further inquiries can be directed to the corresponding authors.

Acknowledgments

The authors would like to thank Sungkyunkwan University for administrative support. All individuals included in this section have consented to the acknowledgement.

Conflicts of Interest

The authors declare no conflicts of interest.

References

  1. Oliinyk, I.; Doroshenko, E.; Melnyk, M.; Tyshchenko, V.; Shamardin, V. Modern approaches to analysis of technical and tactical actions of skilled volleyball players. Teorìâ Ta Metod. Fìzičnogo Vihovannâ 2021, 21, 235–243. [Google Scholar] [CrossRef]
  2. Rotta, K.; Poling, A. Attacking and Scoring by College Volleyball Players: A Matching Analysis. Psychol. Rec. 2021, 71, 389–395. [Google Scholar] [CrossRef]
  3. Molla, R.Y.; Fatahi, A.; Khezri, D.; Ceylan, H.I.; Nobari, H. Relationship between impulse and kinetic variables during jumping and landing in volleyball players. BMC Musculoskelet. Disord. 2023, 24, 619–628. [Google Scholar] [CrossRef]
  4. de Leeuw, A.-W.; van Baar, R.; Knobbe, A.; van der Zwaard, S. Modeling match performance in elite volleyball players: Importance of jump load and strength training characteristics. Sensors 2022, 22, 7996. [Google Scholar] [CrossRef]
  5. Bunn, J.A.; Ryan, G.A.; Button, G.R.; Zhang, S. Evaluation of strength and conditioning measures with game success in Division I collegiate volleyball: A retrospective study. J. Strength Cond. Res. 2020, 34, 183–191. [Google Scholar] [CrossRef]
  6. Brumitt, J.; Patterson, C.; Dudley, R.; Sorenson, E.; Hill, G.; Peterson, C. Comparison of lower quarter Y-balance test scores for female collegiate volleyball players based on competition level, position, and starter status. Int. J. Sports Phys. Ther. 2019, 14, 415–423. [Google Scholar] [CrossRef]
  7. de Lira, C.A.B.; Vargas, V.Z.; Vancini, R.L.; Andrade, M.S. Profiling isokinetic strength of shoulder rotator muscles in adolescent asymptomatic male volleyball players. Sports 2019, 7, 49. [Google Scholar] [CrossRef]
  8. Hadzic, V.; Sattler, T.; Veselko, M.; Markovic, G.; Dervisevic, E. Strength asymmetry of the shoulders in elite volleyball players. J. Athl. Train. 2014, 49, 338–344. [Google Scholar] [CrossRef]
  9. Fort-Vanmeerhaeghe, A.; Gual, G.; Romero-Rodriguez, D.; Unnitha, V. Lower limb neuromuscular asymmetry in volleyball and basketball players. J. Hum. Kinet. 2016, 50, 135–143. [Google Scholar] [CrossRef]
  10. Iglesias-Caamaño, M.; Carballo-López, J.; Álvarez-Yates, T.; Cuba-Dorado, A.; García-García, O. Intrasession reliability of the tests to determine lateral asymmetry and performance in volleyball players. Symmetry 2018, 10, 416. [Google Scholar] [CrossRef]
  11. Heshmati, S.; Tabrizi, K.G.; Daneshjoo, A.; Hosseini, E.; Bahiraei, S.; Sahebozamani, M.; Konrad, A.; Behm, D.G. Effects of Asymmetric and Symmetric Sport Load on Upper and Lower Extremity Strength and Balance: A Comparison Between the Dominant and Non-Dominant Side in Adolescent Female Athletes. Sports 2025, 13, 89. [Google Scholar] [CrossRef] [PubMed]
  12. Wang, J.; Qin, Z.; Zhang, Q.; Wang, J. Lower limb dynamic balance, strength, explosive power, agility, and injuries in volleyball players. J. Orthop. Surg. Res. 2025, 20, 211–224. [Google Scholar] [CrossRef] [PubMed]
  13. Soltanabadi, E.; Hadadnezhad, M.; Khaleghi, M. The effect of perturbation training on volleyball players’ strength, proprioception and performance. Sport Sci. Health Res. 2023, 15, 23–33. [Google Scholar]
  14. Bisht, N.; Srivastava, S. Impact of Physical and Mental Training on Overall Performance and Sports Injury Prevention in Female Volleyball Athletes. Indian J. Physiother. Occup. Ther. 2021, 15, 64–70. [Google Scholar] [CrossRef]
  15. Drikos, S.; Barzouka, K.; Nikolaidou, M.-E.; Sotiropoulos, K. Game variables that predict success and performance level in elite men’s volleyball. Int. J. Perform. Anal. Sport 2021, 21, 767–779. [Google Scholar] [CrossRef]
  16. Boccia, G.; D’Emanuele, S.; Brustio, P.R.; Beratto, L.; Tarperi, C.; Casale, R.; Sciarra, T.; Rainoldi, A. Strength asymmetries are muscle-specific and metric-dependent. Int. J. Environ. Res. Public Health 2022, 19, 8495. [Google Scholar] [CrossRef]
  17. Domínguez-Navarro, F.; Gámez-Payá, J.; Ricart-Luna, B.; Chulvi-Medrano, I. Exploring the Implications of Inter-Limb Asymmetries on Sprint, Agility, and Jump Performance in Young Highly-Trained Basketball Athletes: Is There a Relevant Threshold? Medicina 2024, 60, 131. [Google Scholar] [CrossRef]
  18. Soylu, Ç.; Altundağ, E.; Akarçeşme, C.; Ün Yildirim, N. The relationship between isokinetic knee flexion and extension muscle strength, jump performance, dynamic balance and injury risk in female volleyball players. J. Hum. Sport Exerc. 2020, 15, 502–514. [Google Scholar] [CrossRef]
  19. Eshghi, S.; Zarei, M.; Abbasi, H.; Alizadeh, S. The effect of shoulder injury prevention program on shoulder isokinetic strength in young male volleyball players. Res. Sports Med. 2022, 30, 203–214. [Google Scholar] [CrossRef]
  20. Parcell, A.C.; Sawyer, R.D.; Tricoli, V.A.; Chinevere, T.D. Minimum rest period for strength recovery during a common isokinetic testing protocol. Med. Sci. Sports Exerc. 2002, 34, 1018–1022. [Google Scholar] [CrossRef]
  21. Gerdijan, N.; Nikolic, S.; Pavlovic, R.; Dragicevic-Cvjetkovic, D. Effects of Isokinetic Training on the Muscles After Anterior Cruciate Ligament (ACL) Reconstruction. Int. J. Early Child. Spec. Educ. 2022, 14, 2491–2498. [Google Scholar]
  22. Smith, C.A.; Chimera, N.J.; Warren, M. Association of y balance test reach asymmetry and injury in division I athletes. Med. Sci. Sports Exerc. 2015, 47, 136–141. [Google Scholar] [CrossRef] [PubMed]
  23. Powden, C.J.; Dodds, T.K.; Gabriel, E.H. The reliability of the star excursion balance test and lower quarter y-balance test in healthy adults: A systematic review. Int. J. Sports Phys. Ther. 2019, 14, 683. [Google Scholar] [CrossRef] [PubMed]
  24. Gorman, P.P.; Butler, R.J.; Plisky, P.J.; Kiesel, K.B. Upper Quarter Y Balance Test: Reliability and performance comparison between genders in active adults. J. Strength Cond. Res. 2012, 26, 3043–3048. [Google Scholar] [CrossRef]
  25. Đurković, T.; Marelić, N.; Zekić, R. Specificity of the anthropometric characteristics and fitness abilities of male volleyball players. In Proceedings of the 12th International Conference on Kinanthropology. Sport and Quality of Life, Brno, Czech Republic, 7–9 November 2019; Cacek, J., Ed.; pp. 19–27. [Google Scholar]
  26. Challoumas, D.; Artemiou, A. Predictors of attack performance in high-level male volleyball players. Int. J. Sports Physiol. Perform. 2018, 13, 1230–1236. [Google Scholar] [CrossRef]
  27. Mousavi Sadati, S.K.; Yazdani, H. Comparison of the Kyphosis Angle, Position, Muscles Strength, and Range of Motion of Shoulders in Volleyball Players With and Without Shoulder Impingement Syndrome. Phys. Treat.-Specif. Phys. Ther. J. 2020, 10, 79–88. [Google Scholar] [CrossRef]
  28. Marques, M.C.; Van den Tillaar, R.; Gabbett, T.J.; Reis, V.M.; González-Badillo, J.J. Physical fitness qualities of professional volleyball players: Determination of positional differences. J. Strength Cond. Res. 2009, 23, 1106–1111. [Google Scholar] [CrossRef]
  29. Bauer, J.; Gruber, M.; Muehlbauer, T. Correlations between core muscle strength endurance and upper-extremity performance in adolescent male sub-elite handball players. Front. Sports Act. Living 2022, 4, 1050279–1050289. [Google Scholar] [CrossRef]
  30. Soltanirad, S.; Hosseinzadeh, M. Can Upper Y Balance and Davis Test Predict Upper Quarter Injuries among Volleyball Players? J. Exerc. Health Sci. 2022, 2, 15–24. [Google Scholar]
  31. Mendez-Rebolledo, G.; Cools, A.M.; Ramirez-Campillo, R.; Quiroz-Aldea, E.; Habechian, F.A. Association between lower trapezius isometric strength and Y-balance test upper quarter performance in college volleyball players. J. Sport Rehabil. 2021, 31, 140–145. [Google Scholar] [CrossRef]
  32. Zarei, M.; Eshghi, S.; Hosseinzadeh, M. The effect of a shoulder injury prevention programme on proprioception and dynamic stability of young volleyball players; a randomized controlled trial. BMC Sports Sci. Med. Rehabil. 2021, 13, 71. [Google Scholar] [CrossRef] [PubMed]
  33. Mendez-Rebolledo, G.; Ager, A.L.; Ledezma, D.; Montanez, J.; Guerrero-Henriquez, J.; Cruz-Montecinos, C. Role of active joint position sense on the upper extremity functional performance tests in college volleyball players. PeerJ 2022, 10, e13564. [Google Scholar] [CrossRef] [PubMed]
  34. Palmer-Green, D.; Fuller, C.; Jaques, R.; Hunter, G. The Injury/Illness Performance Project (IIPP): A novel epidemiological approach for recording the consequences of sports injuries and illnesses. J. Sports Med. 2013, 2013, 523974–523982. [Google Scholar] [CrossRef] [PubMed]
  35. Migliorini, F.; Rath, B.; Tingart, M.; Niewiera, M.; Colarossi, G.; Baroncini, A.; Eschweiler, J. Injuries among volleyball players: A comprehensive survey of the literature. Sport Sci. Health 2019, 15, 281–293. [Google Scholar] [CrossRef]
  36. Brumitt, J.; Mattocks, A.; Loew, J.; Lentz, P. Preseason functional performance test measures are associated with injury in female college volleyball players. J. Sport Rehabil. 2020, 29, 320–325. [Google Scholar] [CrossRef]
  37. Mattes, K.; Wollesen, B.; Manzer, S. Asymmetries of maximum trunk, hand, and leg strength in comparison to volleyball and fitness athletes. J. Strength Cond. Res. 2018, 32, 57–65. [Google Scholar] [CrossRef]
  38. Helme, M.; Tee, J.; Emmonds, S.; Low, C. Does lower-limb asymmetry increase injury risk in sport? A systematic review. Phys. Ther. Sport 2021, 49, 204–213. [Google Scholar] [CrossRef]
  39. Mesfar, A.; Hammami, R.; Selmi, W.; Gaied-Chortane, S.; Duncan, M.; Bowman, T.G.; Nobari, H.; van den Tillaar, R. Effects of 8-week in-season contrast strength training program on measures of athletic performance and lower-limb asymmetry in male youth volleyball players. Int. J. Environ. Res. Public Health 2022, 19, 6547. [Google Scholar] [CrossRef]
  40. Reeser, J.C.; Joy, E.A.; Porucznik, C.A.; Berg, R.L.; Colliver, E.B.; Willick, S.E. Risk factors for volleyball-related shoulder pain and dysfunction. PM&R 2010, 2, 27–36. [Google Scholar]
  41. Wayner, R.A.; Robinson, R.; Simon, J.E. Gait asymmetry and running-related injury in female collegiate cross-country runners. Phys. Ther. Sport 2023, 59, 1–6. [Google Scholar] [CrossRef]
  42. Gao, Z. The effect of application of asymmetry evaluation in competitive Sports: A systematic review. Phys. Act. Health 2022, 6, 257–272. [Google Scholar] [CrossRef]
  43. Fellingham, G.W.; Hinkle, L.J.; Hunter, I. Importance of attack speed in volleyball. J. Quant. Anal. Sports 2013, 9, 87–96. [Google Scholar] [CrossRef]
  44. Gulati, A.; Jain, R.; Lehri, A.; Kumar, R. Effect of high and low flexibility on agility, acceleration speed and vertical jump performance of volleyball players. Eur. J. Phys. Educ. Sport Sci. 2021, 6, 120–130. [Google Scholar] [CrossRef]
Figure 1. Odds ratio of offensive performance. DMN, dominant; EXT, extension; AI, asymmetry index; UQ-YBT, upper quarter balance test.
Symmetry 17 00956 g001
Table 1. General information about participants.
VariablesSymmetry (n = 36)Asymmetry (n = 24)tEffect Sizep
Age, years26.0 ± 3.426.4 ± 3.8−0.6700.1100.508
Height, cm195.8 ± 4.7193.6 ± 4.61.3500.4730.187
Weight, kg87.6 ± 4.586.8 ± 5.30.4330.1620.668
Career, years14.5 ± 2.213.7 ± 2.60.9030.3320.374
Offensive performance, %55.6 ± 4.148.6 ± 5.63.0481.426<0.001
Mean game duration, min98.4 ± 28.288.3 ± 24.30.8430.383<0.001
Time loss for upper injury (n = 6 and 7), days17.8 ± 1.716.0 ± 1.5 0.3541.1220.726
Time loss for lower injury (n = 8 and 10), days18.6 ± 2.619.4 ± 2.2−0.9360.3320.390
Table 2. Test of muscle function on the last and this season (n = 26).
VariablesLast SeasonThis SeasonSize Effect
DMNNDMNAIDMNNDMNAIDMNNDMN
DG (n = 12)
UQ-YBT87.2 ± 6.985.0 ± 3.82.575.3 ± 8.4 b84.3 ± 5.512.0 a1.5480.148
Shoulder, FLX0.83 ± 0.120.84 ± 0.101.20.85 ± 0.110.83 ± 0.122.40.1730.090
Shoulder, EXT1.15 ± 0.141.28 ± 0.2016.7 a1.12 ± 0.131.29 ± 0.1323.2 a0.2220.059
LQ-YBT95.3 ± 9.2107.8 ± 7.311.6 a87.3 ± 7.4 b105.5 ± 10.020.8 a0.9580.262
Knee, FLX1.59 ± 0.161.56 ± 0.221.91.50 ± 0.181.54 ± 0.192.70.5280.097
Knee, EXT3.08 ± 0.383.46 ± 0.3511.0 a2.88 ± 0.18 b3.32 ± 0.5213.2 a0.6720.315
IG (n = 14)
UQ-YBT87.2 ± 6.384.5 ± 5.43.194.8 ± 7.8 b90.5 ± 6.7 b4.51.0710.986
Shoulder, FLX0.83 ± 0.070.82 ± 0.061.20.89 ± 0.110.88 ± 0.141.10.6500.557
Shoulder, EXT1.13 ± 0.131.30 ± 0.12 15.0 a1.20 ± 0.13 b1.34 ± 0.2511.7 a0.5380.203
LQ-YBT104.2 ± 8.8105.0 ± 6.0−0.8106.0 ± 6.2105.3 ± 7.70.70.2360.043
Knee, FLX1.51 ± 0.171.46 ± 0.193.31.53 ± 0.131.51 ± 0.211.30.1320.231
Knee, EXT3.18 ± 0.593.57 ± 0.6612.3 a3.36 ± 0.42 b3.45 ± 0.582.70.3510.193
DG, decreasing group; IG, increasing group; UQ-YBT, upper quarter balance test; LQ-YBT, lower quarter Y balance test; DMN, dominant; NDMN, non-dominant; AI, asymmetry index; FLX, flexion; EXT, extension.
Table 3. Pearson’s correlation between offensive performance and effect factors.
ValuesUQ-YBTShoulder Strength, FLXShoulder Strength, EXT
DMNNDMNAIDMNNDMNAIDMNNDMNAI
OPr0.2520.108−0.0940.0450.086−0.0220.3270.047−0.279
p<0.0010.4830.6800.3610.6390.878<0.0010.2150.003
ValuesLQ-YBTKnee Strength, FLXKnee Strength, EXT
DMNNDMNAIDMNNDMNAIDMNNDMNAI
OPr0.1050.083−0.2500.0500.104−0.0610.2680.114−0.159
p0.4450.248<0.0010.7610.8290.866<0.0010.610<0.001
OP, offensive performance; UQ-YBT, upper quarter balance test; LQ-YBT, lower quarter Y balance test; DMN, dominant; NDMN, non-dominant; AI, asymmetry index; FLX, flexion; EXT, extension.
Table 4. Multiple regression for offensive performance.
VariablesUnstandardized CoefficientsStandardized CoefficientstpCollinearity Statistics
BStd. ErrorBetaToleranceVIF
(Constant)19.34410.672-1.813<0.001--
Shoulder strength, DMN, EXT5.2771.5330.3093.443<0.0010.7671.304
Knee strength, DMN, EXT3.7061.3950.3762.657<0.0010.3093.237
Knee strength, EXT, AI−0.2580.112−0.232−2.3030.0100.6101.640
UQ-YBT, DMN0.1400.1340.1551.0400.0310.2793.580
Independent variable, offensive performance; F value, 33.582; R2, 0.808; standard error of the estimate, 2.740
CI, confidence interval; UQ-YBT, upper quarter balance test; DMN, dominant; AI, asymmetry index; EXT, extension; VIF, variance inflation factor.
Table 5. Cut-off values of selective variables for offensive performance.
VariablesCut-Off (%)AUC (95% CI)SensitivitySpecificityp
Shoulder strength, DMN, EXT13.80.568 (0.544–0.597)56.761.40.003
Knee strength, DMN, EXT18.30.547 (0.541–0.589)55.660.80.002
Knee strength, EXT, AI10.50.537 (0.513–0.574)53.159.70.007
UQ-YBT, DMN11.10.532 (0.503–0.570)52.958.60.014
AUC, area under the curve; UQ-YBT, upper quarter balance test; DMN, dominant; AI, asymmetry index; EXT, extension.
Disclaimer/Publisher’s Note: The statements, opinions and data contained in all publications are solely those of the individual author(s) and contributor(s) and not of MDPI and/or the editor(s). MDPI and/or the editor(s) disclaim responsibility for any injury to people or property resulting from any ideas, methods, instructions or products referred to in the content.

