Article

Hybrid Optimization of Phase Masks: Integrating Non-Iterative Methods with Simulated Annealing and Validation via Tomographic Measurements

1
National Laboratory of Solid State Microstructures, College of Engineering and Applied Sciences, Nanjing University, Nanjing 210023, China
2
School of Chemistry and Chemical Engineering, Nanjing University, Nanjing 210023, China
3
College of Information and Electrical Engineering, China Agricultural University, 17 Qinghua East Road, Haidian, Beijing 100083, China
4
National Innovation Center for Digital Fishery, China Agricultural University, Beijing 100083, China
5
College of Engineering, China Agricultural University, 17 Qinghua East Road, Haidian, Beijing 100083, China
*
Authors to whom correspondence should be addressed.
Symmetry 2025, 17(4), 530; https://doi.org/10.3390/sym17040530
Submission received: 17 February 2025 / Revised: 27 March 2025 / Accepted: 28 March 2025 / Published: 31 March 2025
(This article belongs to the Special Issue Symmetry and Asymmetry Study in Graph Theory)

Abstract

:
The development of holography has facilitated significant advancements across a wide range of disciplines. A phase-only spatial light modulator (SLM) plays a crucial role in realizing digital holography, typically requiring a phase mask as its input. Non-iterative (NI) algorithms are widely used for phase mask generation, yet they often fall short in delivering precise solutions and lack adaptability in complex scenarios. In contrast, the Simulated Annealing (SA) algorithm provides a global optimization approach capable of addressing these limitations. This study investigates the integration of NI algorithms with the SA algorithm to enhance the optimization of phase mask generation in digital holography. Furthermore, we examine how adjusting annealing parameters, especially the cooling strategy, can significantly improve system optimization performance and symmetry. Notably, we observe a considerable improvement in the efficiency of the SA algorithm when non-iterative methods are employed to generate the initial phase mask. Our method achieves a perfect representation of the symmetry in desired light fields. The efficacy of the optimized phase masks is evaluated through optical tomographic measurements using two-dimensional mutually unbiased bases (MUBs), with the resulting average similarity reaching 0.99. These findings validate the effectiveness of our methodin optimizing phase mask generation and underscore its potential for high-precision optical mode recognition and analysis.

1. Introduction

Over the past three decades, digital holography has garnered extensive attention, particularly in areas such as hyper-realistic imaging [1], ultra-high-speed data transmission [2], data storage [3], and real-time display [4]. Generally, the complete information of an optical wave, encompassing both amplitude and phase, can be reconstructed from the hologram [5,6]. Computer Generated Holograms (CGHs) offer the advantage of eliminating the need to record the hologram of a real physical scene, thereby enabling the use of virtual objects instead [7,8]. This has led to widespread applications in three-dimensional displays [9], virtual reality [10], and augmented reality [11].
Recently, researchers have also made new breakthroughs in the study of holograms and image reconstruction. Current deep learning approaches for holographic imaging largely rely on the statistical correlations within the training data [12,13]. This reliance can undermine their robustness in real-world imaging scenarios where various physical perturbations—such as mechanical motion and optical fluctuations—are present [14]. In 2023, Chanseok Lee et al. [15] introduced a novel deep learning framework that integrates a parameterized physical forward model, enabling the simultaneous reconstruction of both the complex amplitude and the object-to-sensor distance, even when the latter extends beyond the range covered by the training dataset. In 2024, SIWOO LEE et al. [16] introduced HoloSR, an innovative deep learning-driven super-resolution method that converts low-resolution RGBD inputs into high-resolution computer-generated holograms, thereby enabling real-time rendering of photorealistic three-dimensional scenes. By integrating an advanced deep super-resolution network with resizing and convolutional layers, HoloSR directly generates high-resolution holograms without the need for additional interpolation. Conventional holography often results in 3D scenes with unnatural defocus and prominent speckle noise, primarily due to the spatial light modulator’s limited space-bandwidth product. In 2015, Zhenxing Dong et al. [17] proposed a Motion Hologram technique that achieves precise, photorealistic, and speckle-free 3D imaging. This method utilizes a single hologram alongside an adaptable, learnable motion trajectory, both of which are concurrently optimized within a deep reinforcement learning framework.
In holographic displays utilizing SLMs, the complex amplitude information is typically encoded into phase-only holograms (POHs) or amplitude-only holograms (AOHs), depending on the modulation modes of the SLM [18]. POHs, in contrast to AOHs, exhibit superior diffraction efficiency and eliminate the formation of conjugate images, attributes that have garnered considerable interest in the research community [19]. As a result, POHs have emerged as the dominant encoding technique in contemporary CGHs [20].
Several non-iterative methods exist for generating CGHs [21,22], including random phase mask methods [23], patterned phase-only holography[24], double-phase methods [25], and random phase-free methods [26]. However, due to the inherent nature of POHs, the holography generation problem lacks a simple direct solution, often requiring approximation methods to reach the optimal result. The Gerchberg–Saxton (GS) algorithm, an iterative technique for phase retrieval [27,28], recovers phase information from intensity data and was first introduced by Roy Gerchberg and Warren Saxton in 1972 [29]. Despite its broad application, the GS algorithm has inherent limitations [30], including the potential to become trapped in local optima during the iterative process. Additionally, the optimized light field distribution often exhibits significant Gibbs oscillations, leading to poor uniformity in the reconstructed image, especially at the edges.
The performance of the optical system also affects the quality of the generated light fields in CGHs. Optical aberrations, introduced by components such as lenses, including spherical aberration, coma, and air turbulence, can deteriorate the desired light field [31,32]. Addressing these challenges requires calibration based on actual measurements to ensure that the symmetry of the optical field is preserved and optimized [33].
To achieve the desired light field, we employ the SA algorithm to optimize the phase masks. In the early 1980s, Kirkpatrick, Gelatt, and Vecchi [34] introduced the novel application of annealing concepts to combinatorial optimization problems. Inspired by the physical annealing process in materials science, the SA algorithm is particularly suited for solving optimization problems, overcoming the limitation of Monte Carlo methods that often become trapped in local minima by using an efficient Metropolis acceptance criterion [35]. In addition, SA is recognized as a versatile metaheuristic approach [36,37,38] for tackling complex black-box [39] global optimization problems, especially in cases where the objective function is not directly available and its evaluation relies on computational simulations. Given the complexity of evaluating the objective function, involving a high-dimensional state space and substantial memory requirements, SA proves to be the appropriate method for addressing these challenges [40,41,42]. Among the various optimization techniques, the SA algorithm has emerged as a robust and versatile global optimization method in optical field [43,44]. Unfortunately, the efficiency of simulated annealing markedly decreases when applied to large-scale optimization problems. This reduction in performance is often attributed to premature convergence or the algorithm becoming stuck in a stagnation phase. In 2017, Mohamed Lalaoui et al. proposed a self-tuned SA algorithm. Their study sought to address this challenge by employing a self-adjusting strategy that utilized a machine learning technique known as the Hidden Markov Model. The fundamental concept involved enabling the SA to modify its cooling schedule autonomously at each iteration based on past search experiences [45]. In 2018, they focused on mitigating the challenges encountered in simulated annealing by integrating a fuzzy logic controller. The approach aimed to dynamically adapt the neighborhood structure during the simulated annealing process, thereby enhancing its performance and addressing inherent limitations [46].
Furthermore, we propose a diagnostic approach that utilizes vector mode decompositions tailored to individual modes, complemented by a tomographic method designed to quantitatively evaluate the orbital angular momentum (OAM) degree of freedom [47]. The initial measurement of quantum correlations in the OAM basis was reported by Mair and colleagues in 2001 [48,49]. Unlike polarization, which is confined to a two-dimensional Hilbert space, OAM spans an infinite-dimensional Hilbert space, theoretically enabling the encoding of an infinite amount of information onto a single photon [50]. Using CGHs recorded on holographic film, Mair et al. demonstrated that, like polarization and spin angular momentum, OAM is an intrinsic property of individual photons.
High-dimensional entangled photons provide substantial advantages in areas like quantum communication and cryptography. By encoding more information per photon than is possible with polarization alone, these states not only enhance the data capacity of each photon but also bolster security in communication protocols [51]. For instance, in 2013, Mhlambululi Mafu et al. investigated high-dimensional quantum key distribution protocols that utilize mutually unbiased bases, implemented via photons encoded with OAM [52]. In 2014, Mario Krenn et al. examined the generation of a ( 100 × 100 )-dimensional entangled quantum system by exploiting the spatial modes of photons [53]. In 2017, Alicia Sit et al. demonstrated a single-photon quantum key distribution system that operated over a 0.3 km turbulent free-space link in the city of Ottawa by exploiting both the spin and OAM degrees of freedom of photons. Their findings revealed that even under moderate turbulence and without active wavefront correction, high-dimensional photon states significantly enhanced the secure transmission of information [54].
Quantum state tomography, initially proposed in 1957 [55], has become a well-established technique within quantum optics [56,57]. Jack et al. advanced this methodology by employing digital holograms encoded on SLMs to reconstruct the density matrix of a two-dimensional entangled state in the OAM basis [58]. Furthermore, quantum state tomography has been successfully implemented using MUBs. In this work, one set of MUBs is represented by the the pure OAM states ( ψ = ± ) and the other consists of superposition states of these pure OAM states ( ψ = + exp ( i ϕ ) ) [59]. In this study, we select Hermite–Gaussian(HG) modes and Laguerre–Gaussian(LG) modes to validate the superiority of the SA algorithm, as both serve as eigenfunctions of the Fourier transform and solutions to the paraxial wave equation and are eigenmodes of parabolic refractive index waveguides and quantum harmonic oscillators [60,61,62].
Based on the SA algorithm, we compare two methods for optimizing phase masks: a numerical optimization approach (NOSAA) executed solely on a computer, and an optical experimental approach (OESAA) in which the simulated annealing algorithm is integrated into a feedback system during optical experiments to adaptively optimize the phase masks. We propose a hybrid optimization approach that integrates NI algorithms with SA. In our method, the NI algorithms are first employed to rapidly generate an initial phase mask, which is subsequently refined using the SA algorithm. This combined strategy leverages the fast convergence of NI methods and the robust global search capabilities of SA, ultimately yielding phase masks that deliver excellent reconstruction accuracy and enhanced symmetry in the resulting light fields. Our method not only highlights the potential of SA algorithm in advancing the design of optical systems but also underscores its potential for broader adoption in cutting edge photonics research [63,64,65], particularly in applications that require the precise symmetry of light fields and optimization of complex optical modes [66,67,68].

2. Theory

2.1. LG Modes and HG Modes in Optical System

In recent years, laser beams carrying OAM have garnered significant attention [69,70,71]. These beams can be described using LG modes [72,73,74]. LG modes propagate with a rotating Poynting vector around the beam axis. They are defined by two numbers: the azimuthal integer (denoted ) and the radial integer (denoted p) [75,76]. The standard formula for the amplitude of any normalized LG mode is expressed as [77]
u p = 2 p ! π ( p + | | ) ! 1 w ( z ) r 2 | | w ( z ) exp r 2 w 2 ( z ) L p | | 2 r 2 w 2 ( z )
× exp i φ exp i k 0 r 2 z 1 2 ( z 2 + z R 2 ) exp i ψ ( z )
where z R = π w 0 2 / λ is the Rayleigh range with wavelength λ and wavevector k 0 = 2 π / λ , w ( z ) = w 0 z 2 + z R 2 / z R 2 1 / 2 is the radius of the beam with beam waist w 0 and ψ ( z ) = ( 2 p + | | ) arctan z / z R is the Gouy phase. In the context of LG modes, the radial index p and the azimuthal index delineate a spectrum of distinct modal configurations. Specifically, the parameter p assumes values as a non-negative integer, whereas spans the set of all integers. These indices facilitate the characterization of the modes through the application of generalized Laguerre polynomials L p , whose explicit formulation is described by the following equation:
L p ( x ) = n = 0 p ( 1 ) n ( p + ) ! ( p n ) ! ( + n ) ! n ! x n
The HG modes constitute a set of solutions to the paraxial wave equation in free space when expressed within the Cartesian coordinate framework [78,79,80,81,82]. Along one dimension, an HG mode’s electric field is [83]
u n ( x , z ) = 2 π 1 4 e i ( 2 n + 1 ) ψ ( z ) 2 n n ! w ( z ) 1 2 × H n 2 x w ( z ) e i k x 2 2 R ( z ) e x 2 w 2 ( z )
where n denotes the mode index for higher-order beams, k represents the wavevector, and H n corresponds to the Hermite polynomial of degree n. The beam’s radius w ( z ) , measured at a specific point z along its direction of propagation, is given by
w ( z ) = w 0 1 + z z R 2 1 2
where w 0 is the radius of the beam at the beam waist and the Rayleigh length is defined as z R = π w 0 2 / λ , with the wavelength of the beam denoted by λ . The Gouy phase is given by ψ ( z ) = tan 1 z / z R . The radius of curvature is R ( z ) = z 1 + z R / z 2 .
The HG mode’s 2D electric field is given by
u n m ( x , y , z ) = u n ( x , z ) u m ( y , z ) ,
where u m ( y , z ) has a similar form to Equation (3).

2.2. SA Algorithm

The SA algorithm is an iterative optimization technique that uses acceptance probabilities to explore the solution space and find near-optimal solutions [84]. Compared to traditional optimization methods, the SA algorithm is less prone to becoming trapped in local optima, making it highly suitable for global optimization problems. This process involves cooling a solid to a low-energy state after raising its temperature. The flowchart of the SA algorithm is shown in Figure 1.

2.2.1. Initial Temperature

The core principle of the SA algorithm involves gradually decreasing a control parameter known as temperature, which governs the acceptance of solutions during the optimization process [85]. The temperature is updated iteratively as follows:
T k = α k T 0 T 0 > 0 , 0 < α < 1 , k = 1 , 2 , 3 ,
where T 0 is the initial temperature and T k is the temperature of the k t h iteration. α is the decay factor which is a positive constant smaller than but close to one. Typical values for α range from approximately 0.8 to 0.99 [86]. The choice of the initial temperature plays an important role in the efficiency of subsequent optimization iterations.
The concept of the mushy state [87] provides guidance for selecting the initial temperature. It occurs at an initial temperature, characterized by an acceptance rate of 80–85%, where the algorithm accepts both better and worse solutions with significantly high probability. This allows extensive exploration of the solution space and avoids premature convergence to local minima.
There is another, more precise method for selecting the initial temperature. The initial temperature c 0 is computed following a well-defined and systematic procedure [86]. First, we let m 1 denote the total number of proposed transitions that strictly decrease the value of cost function, and m 2 represents the number of other proposed transitions. Additionally, Δ f ( + ) is defined as the average cost difference across all increasing transitions. The acceptance rate χ ( c ) is approximated by the expression
χ ( c ) m 1 + m 2 e Δ f ( + ) c m 1 + m 2 ,
where c is the temperature control parameter.
The initial temperature c 0 is calculated from the acceptance rate:
c 0 Δ f ( + ) ln m 2 m 2 χ ( c ) m 1 ( 1 χ ( c ) ) .
In practice, c 0 is first set to zero, and a sequence of transitions is generated to compute m 1 and m 2 . The value of c 0 is then computed using Equation (8), where χ ( c ) is defined by us. This initial value of c 0 is used as the starting temperature in the cooling process. The procedure ensures that in the early stages of the SA algorithm, a larger number of state transitions are accepted, allowing for extensive exploration of the solution space. As the temperature decreases, the algorithm gradually becomes more selective, accepting only transitions that lead to improvements or minor deteriorations, which results in the algorithm eventually converging to a global optimum.

2.2.2. Decay of the Control Parameter

The temperature decay (Cooling Schedule) in the SA algorithm is determined by the relationship between successive control parameters c k and c k + 1 . The core idea is that as the temperature gradually decreases, the probability distribution of the SA algorithm should transition smoothly, avoiding drastic fluctuations. In order to ensure that the stationary distributions remain sufficiently close when the control parameter changes from c k to c k + 1 , this closeness can be quantified by the following formula [88,89]:
i S , 1 1 + δ < q i ( c k ) q i ( c k + 1 ) < 1 + δ ,
where δ denotes a small positive constant specified in advance and S is the state space. q i ( c k ) is stationary distribution which is typically represented by the Boltzmann distribution:
i S , q i ( c k ) = e f ( i ) c k j S e f ( j ) c k ,
where f ( i ) denotes the objective function value (the energy associated with state i) and c k represents the current temperature.
We consider the stationary distribution q ( c k ) of the Markov chain resulting from the simulated annealing process at iteration k. We let c k and c k + 1 be two consecutive values of the control parameter, with c k + 1 < c k . Then, Equation (9) is satisfied if
i S , e Δ i 1 c k + 1 1 c k < 1 + δ ,
where Δ i = f ( i ) f opt , and f opt denotes the optimal value of f.
An equivalent form of the necessary condition Equation (11) is given by
i S , c k + 1 > c k 1 + c k ln 1 + δ f ( i ) f opt .
It can be rigorously established that Condition (12) admits the following approximation:
i S , c k + 1 > c k 1 + c k ln 1 + δ 3 σ c k ,
where σ c k denotes the standard deviation computed at temperature c k .
The specified parameter δ governs the extent to which the temperature c is reduced. Larger values of δ lead to more substantial decreases in c, whereas smaller values cause more moderate reductions.

2.2.3. Cost Function

To evaluate the quality of the phase masks, the correlation coefficient β between the target image and the image reconstructed is used as the cost function [90]
β = R ( x , y ) T * ( x , y ) d A 2 R ( x , y ) 2 d A T ( x , y ) 2 d A .
It is the overlap integral between the replay field (R) in an area of interest (A) and some target distribution (T). In discrete domain, this corresponds to a normalized dot product:
β = i = 0 n R i T i * 2 i = 0 n R i 2 .
As the temperature gradually decreases during the SA algorithm, this technique is more suitable for optimizing the minimum value of a problem rather than the maximum value. Hence, in the SA algorithm, we define the cost function as
E = 1 β .

2.2.4. Metropolis Principle

The optimization begins with an initial phase mask, generated from a uniform distribution in the range [ 0 , 2 π ] . The corresponding cost function is calculated, and a new phase mask is generated by introducing random perturbations. Then, the cost function of the new phase mask is calculated. The acceptance probability P for transitioning to the new solution is given by
P = exp E new E old T k , if E new > E old , 1 , otherwise .
where E n e w is the value of cost function of the new solution and E o l d is the value of cost function of the old solution.
This probabilistic acceptance mechanism allows the algorithm to escape local minima by temporarily accepting solutions with worse performance. As the temperature decreases, the likelihood of accepting worse solutions diminishes, refining the search around promising regions in the solution space [91,92,93].

2.3. Analytical Optimization Approaches for Hologram Generation

In order to use phase-only SLM to reconstruct a desired optical field E desired ( x , y ) = A desired ( x , y ) e i Φ desired ( x , y ) , a hologram H ( x , y ) is adopted to transform an input field E in ( x , y ) = A in ( x , y ) e i Φ in ( x , y ) into the target field and to spatially separate the desired beam from the zero-order reflection.
This relationship can be expressed analytically as
E i n ( x , y ) e i k i n · r ^ · e i H ( x , y ) = E desired ( x , y ) e i k desired · r ^ ,
where k i n in a transmissive SLM is the input wavevector and it refers to the reflected wavevector in a reflective SLM. Meanwhile, k d e s i r e is the output wavevector. The hologram H ( x , y ) is defined as
H ( x , y ) = f A r e l ( x , y ) Φ ( x , y ) ,
where Φ ( x , y ) is defined as:
Φ ( x , y ) = Φ d e s i r e d ( x , y ) Φ i n ( x , y ) + Φ grating ( x , y ) ,
where A r e l is the relative amplitude of input and output beams. f is a user-defined function to optimize the diffraction efficiency. Φ g r a t i n g ( x , y ) is grating phase to split the light into different diffraction orders in practice.
H ( x , y ) can take various forms. In this work, we use three methods to calculate H ( x , y ) .
Method A, proposed by Davis et al. [94], is given by
H ( x , y ) = 1 1 π sin c 1 ( A ( x , y ) ) Φ ( x , y ) ,
f ( A ( x , y ) ) = 1 1 π sin c 1 ( A ) ,
where sinc ( a ) = sin a / a .
This technique encodes amplitude information onto a phase-only filter using a single liquid-crystal SLM. It offers several advantages: it preserves 100% of the incident light, ensuring no loss in transmission; it is straightforward to implement with a single liquid-crystal SLM, eliminating the need for complex setups or multiple modulators; and it combines amplitude and phase modulation, enabling versatile optical applications such as low-pass and high-pass filtering, as well as inverse filters.
Method B, proposed by Bolduc et al. [95], introduces an enhanced technique that applies a correction:
H ( x , y ) = M ( Φ ( x , y ) π M ) ,
M = 1 + 1 π sin c 1 ( A ) .
This approach enables the simultaneous encoding of both the amplitude and phase of an optical field into a phase-only hologram. The main benefits of this approach include precise control over spatial transverse modes, which is crucial for various applications in optics. It eliminates unwanted phase alterations caused by intensity masking, ensuring the accurate reproduction of the desired optical field.
Method C, proposed by Arrizón et al. [96], introduces an alternative method for generating holograms:
H ( x , y ) = Φ ( x , y ) + f ( A ( x , y ) ) sin ( Φ ( x , y ) ) ,
J 0 f ( A ( x , y ) ) = A ( x , y ) ,
where J 0 is the zero-order Bessel function.
The method offers several advantages for encoding scalar complex fields using phase CGHs. First, one of the proposed holograms can be implemented with a phase modulator that has a reduced phase range, making it adaptable to conventional liquid crystal SLMs. Second, this reduced phase range, close to ±1.2 rad, makes the holograms suitable for applications such as optical trapping in biological systems.

2.4. Tomographic Measurement

Modal decomposition is a technique that expresses an unknown optical field as a linear combination of basis functions. These basis functions are typically chosen from an orthogonal set of spatial modes. The optical field u ( r ) can be written as
u ( r ) = l = 1 c l ψ l ( r ) ,
where r = ( x , y ) represents the spatial coordinates and c l = q l e i Δ ϕ l is the complex expansion coefficient, with q l being the amplitude and Δ ϕ l = ϕ l ϕ 0 representing the intermodal phase. The function ψ l ( r ) denotes the basis function.
The process of modal decomposition involves measuring the coefficients that describe the unknown field. This field can be expressed as a combination of modes, each with specific weightings and phase relationships. The decomposition is performed by measuring the inner product between the field and each mode, yielding coefficients defined by ρ l 2 = | u | ψ l | 2 . This measurement provides an intensity in the Fourier plane (on-axis), which is proportional to the power content of each mode, normalized such that ρ l 2 = 1 .
To evaluate the capability of encoding and detecting transverse spatial modes, we apply this method to generate and detect states in MUBs [97,98,99,100]. The eigenstates of the sets { | u i } and { | v j } are referred to as MUBs in a d-dimensional Hilbert space, with the condition that | u i | v j | 2 = 1 / d for all i and j [101]. For each mode, a complete set of projections is conducted to identify the generated mode. The process of reconstructing a state from all measurement outcomes is known as quantum state tomography, which is highly reliable but requires extensive measurements, as it involves generating and detecting all independent eigenstates and superpositions.
Without loss of generality, we simplify the analysis by neglecting the radial component of the optical field and focusing only on the azimuthal part related to optical OAM [102]. An optical beam with an azimuthal phase term exp ( i ϕ ) carries a well-defined OAM value per photon, where ϕ is the azimuthal angle. Such beams correspond to the eigenstates associated with the z-axis component of the OAM operator, providing a comprehensive set of basis functions within the azimuthal coordinate system [103].
MUBs form a comprehensive set of bases. In a Hilbert space of dimension d, if d is a prime number or can be expressed as a power of a prime, the known maximum number of such bases is d + 1 [59,104]. In the context of a two-dimensional OAM Hilbert space, three MUBs are specifically the eigenstates associated with the Pauli matrices [105]. In a two-dimensional Hilbert space, the complete set of MUBs is given by
I = { | 0 , | 1 } II = | 0 + | 1 2 , | 0 | 1 2 , III = | 0 + i | 1 2 , | 0 i | 1 2 .
Tomographic measurements play a crucial role in quantum optics [106] and information processing [107], particularly in quantum entanglement [108], quantum communication [109], and quantum computation [106]. By combining digital holography and SLMs, these measurements allow for efficient reconstruction and analysis of quantum states [110]. This technique enables the extraction of key physical quantities, such as intensity, phase, wavefront, Poynting vector, polarization, and OAM density [111,112]. Digital holography, in conjunction with SLMs, enhances the precision of quantum state tomography, enabling the accurate reconstruction of the quantum state’s density matrix [103,113]. This method has proven especially useful for high-dimensional quantum systems, where traditional two-level quantum states (like polarization) are extended to OAM states, offering greater potential in quantum communication and quantum key distribution [114]. The ability to perform high-dimensional quantum tomography significantly increases the information capacity per photon, making it a vital tool for improving the efficiency and security of quantum communication systems [115].

3. Experiment and Result

3.1. NI Algorithms for Hologram Generation

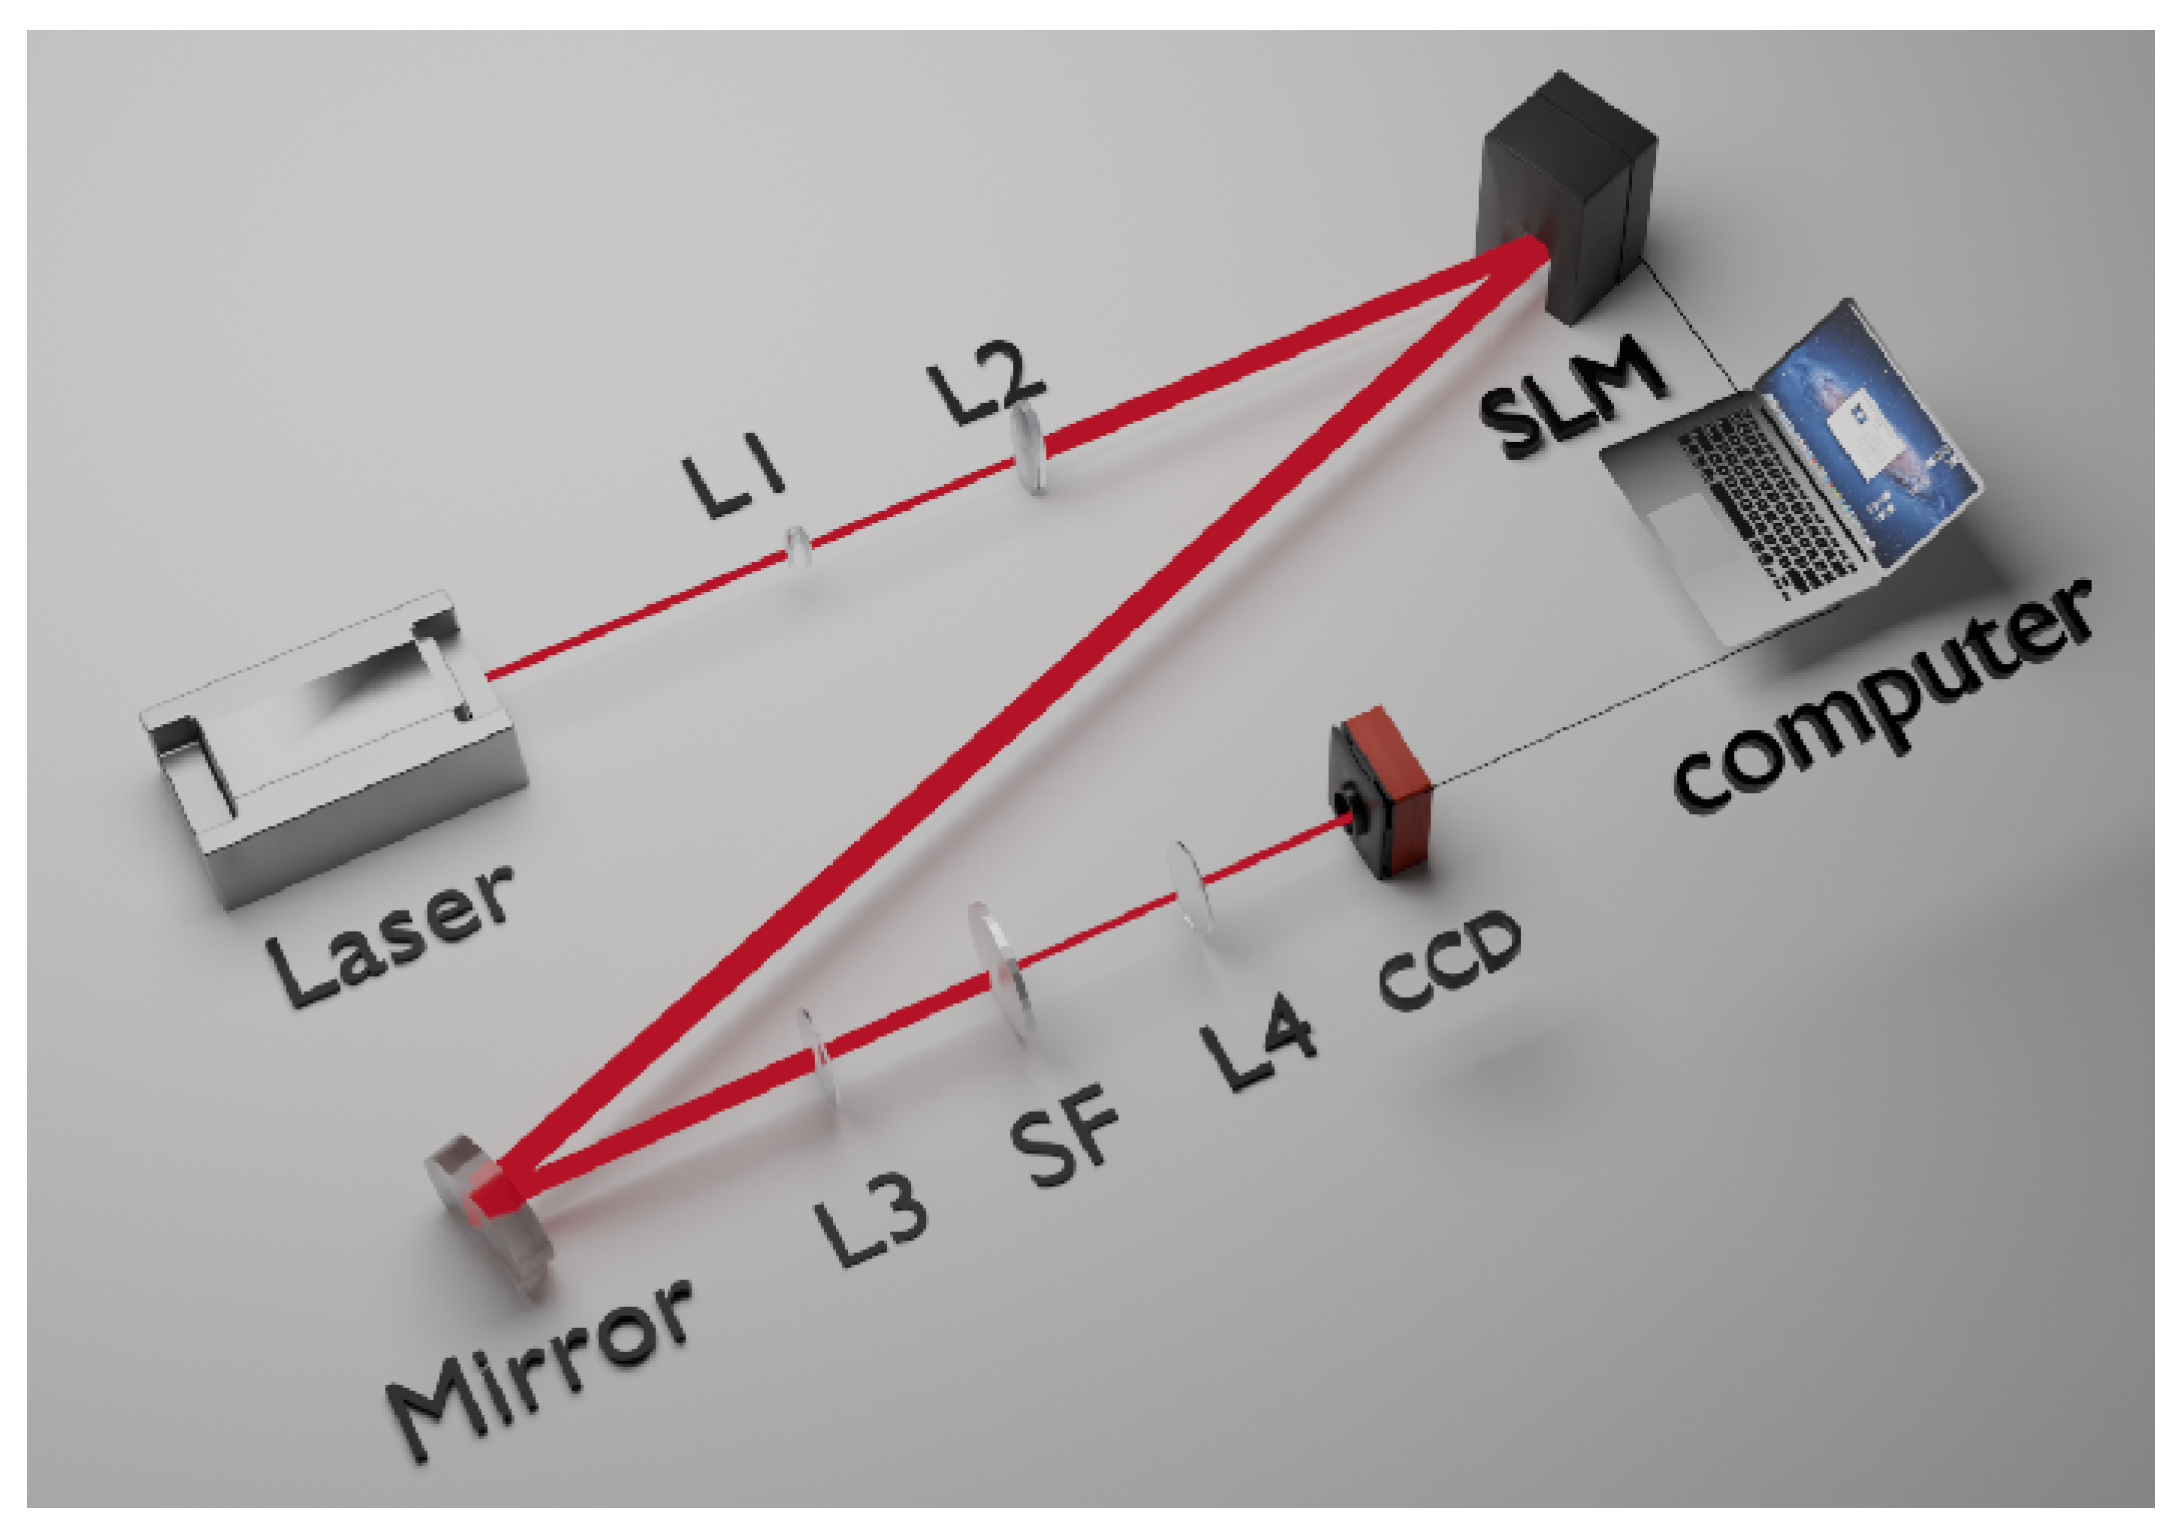
We conducted optical experiments to evaluate non-iterative methods for hologram generation techniques based on the quality of the obtained modes. The schematic diagram of the experimental setup is depicted in Figure 2. The light source is a He-Ne laser (Thorlabs S1FC660, Newton, NJ, USA) with a wavelength of 660 nm. The beam expander is used to expand and collimate the laser, projecting it onto the SLM (MeadowlarkOptics P1920-400 800-HDMI, Meadowlark Optics Inc., Frederick, CO, USA). A phase mask optimized by non-iterative methods is loaded onto the SLM. An 8-bit reflective phase-only SLM is employed, with a sampling interval of 9.2 µm × 9.2 µm and a resolution of 1920 × 1152. A 4 f system, consisting of Lens 3 (focal length: 200 mm) and Lens 4 (focal length: 200 mm) along with a spatial filter (SF), is utilized to remove the zero-order light effect from the SLM. To enhance the filtering of zero-order light, a blazed grating is added and superimposed onto the phase masks. The outgoing modes form an image on the camera. We used a charge-coupled device (Andor, iStar CCD 05577H, Oxford Instruments Technology (Shanghai) Co. Limited, Shanghai, China) to capture the reconstructed image.
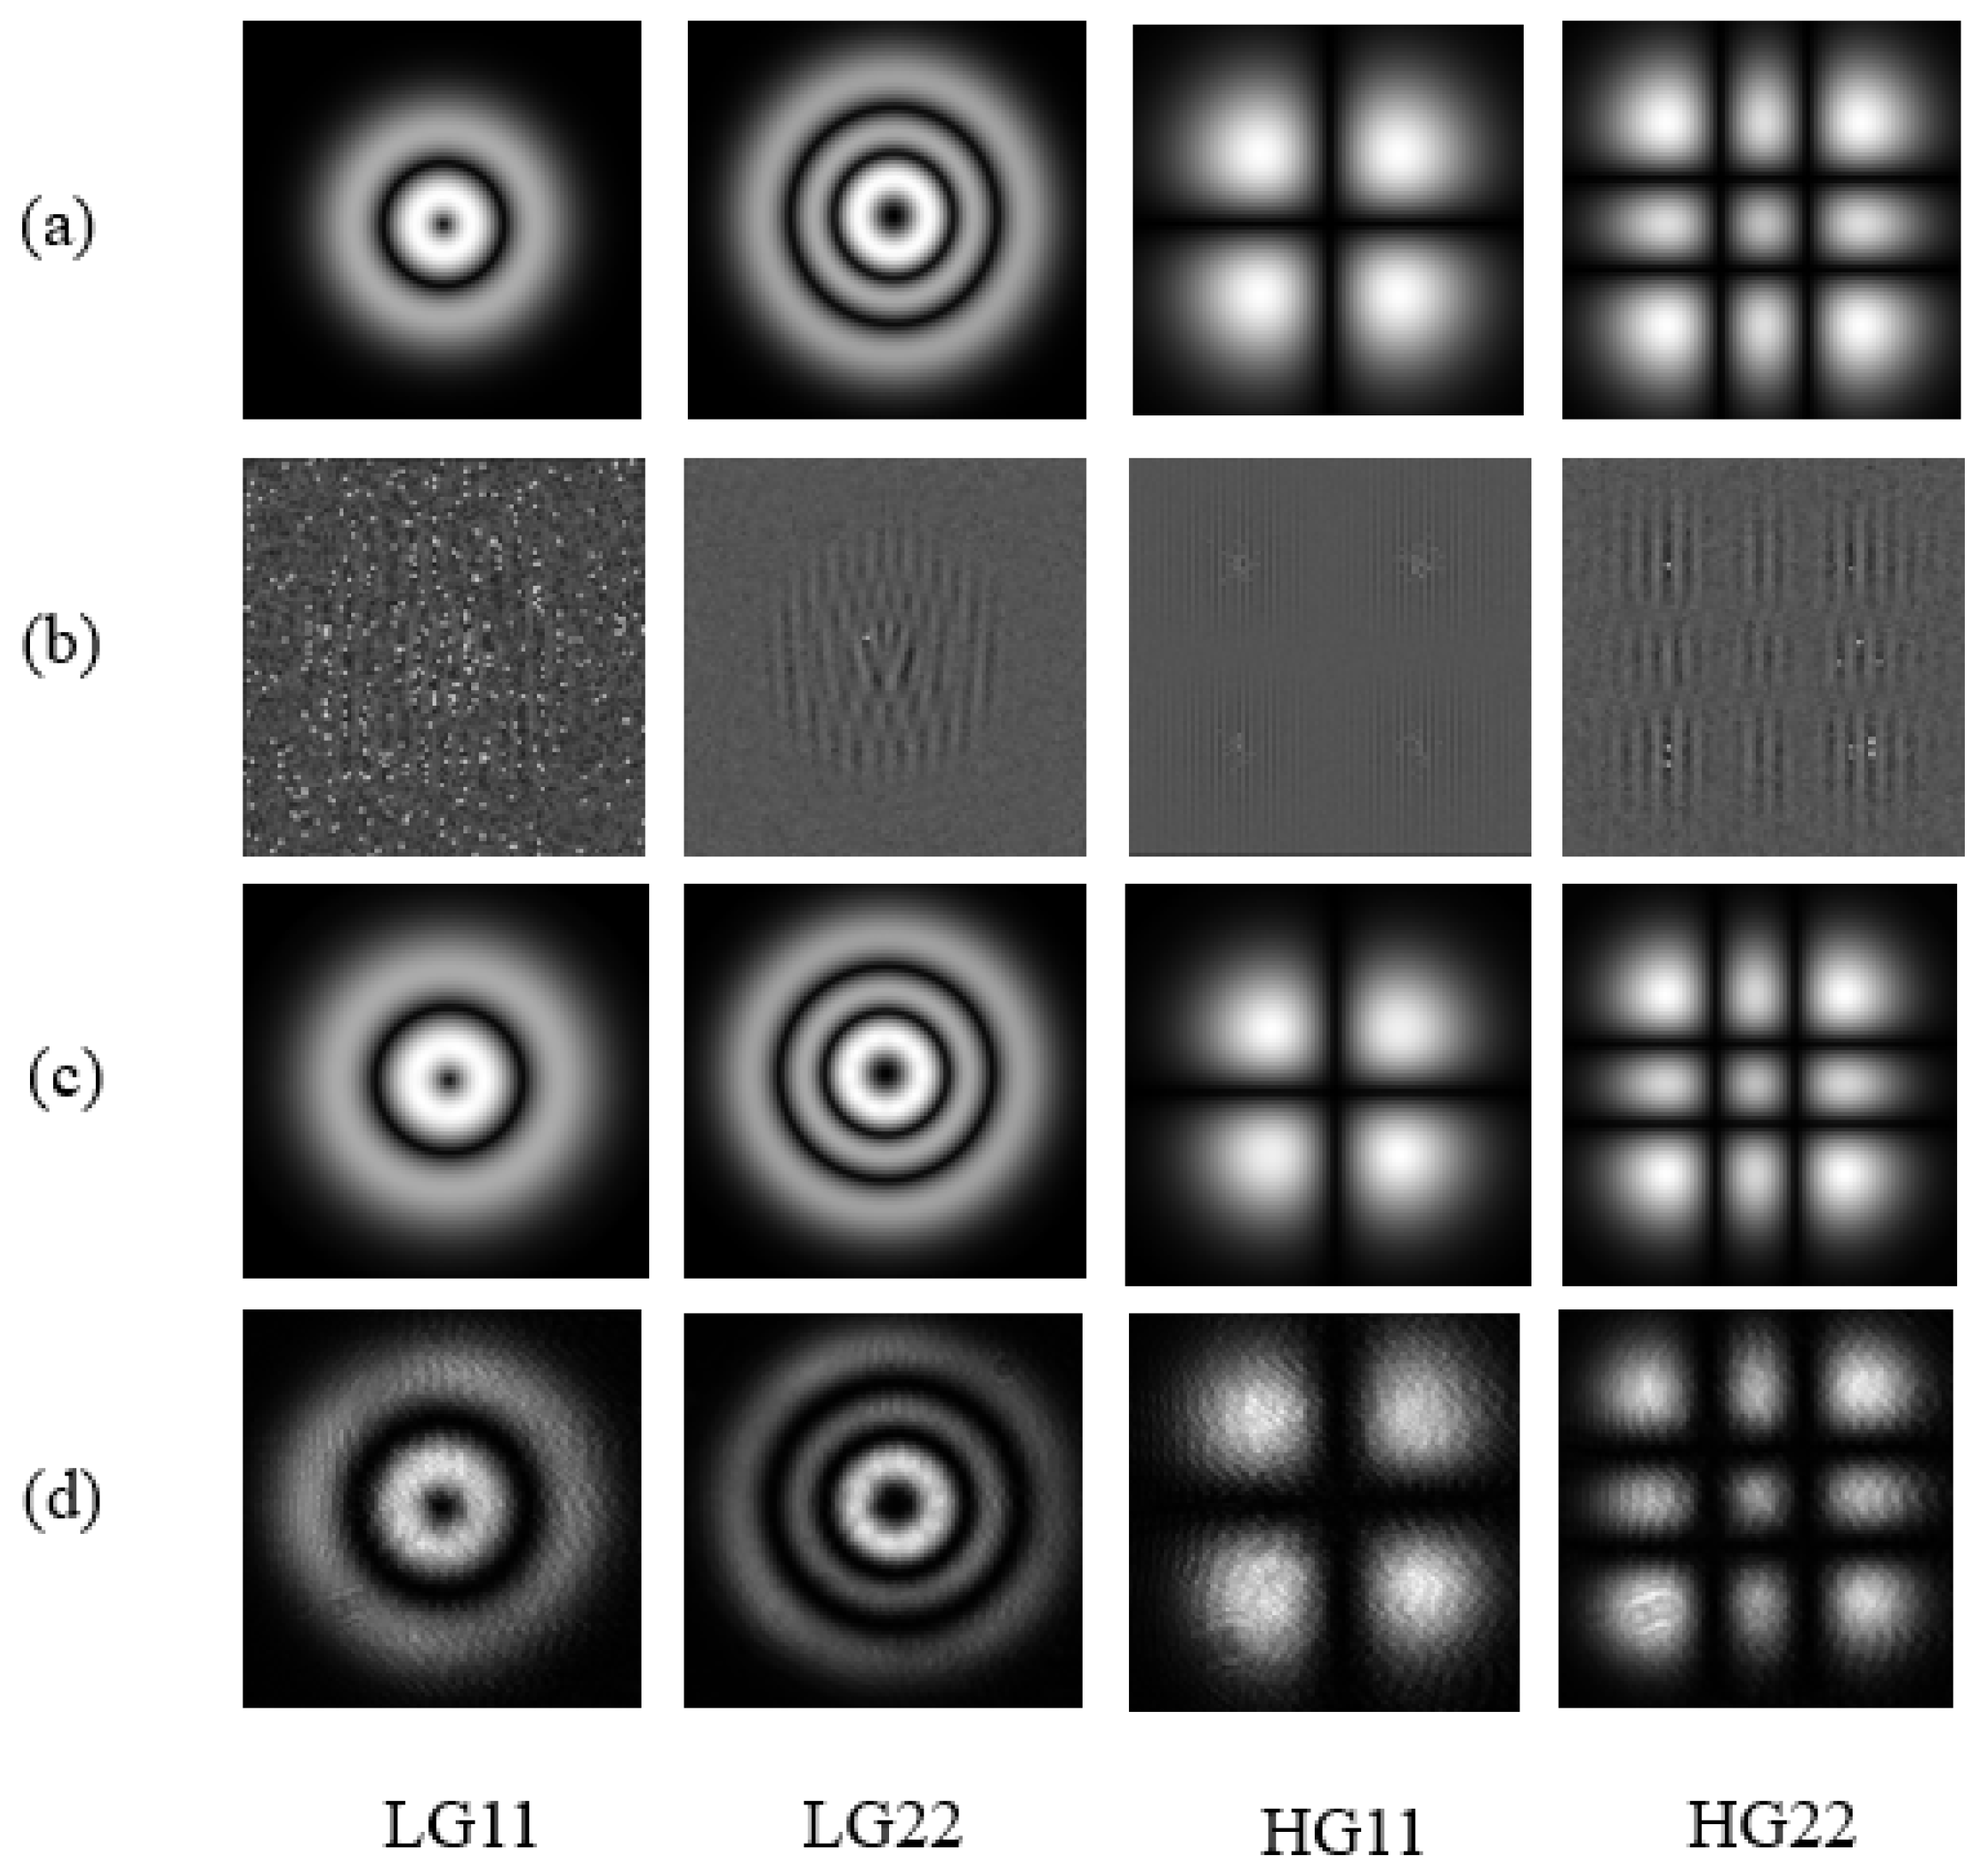
First, we performed numerical simulations to predict the experimental results. The results are shown in Figure 3. Figure 3a shows the numerical simulation results of the phase masks without optimization. Figure 3b–d, respectively, show the numerical simulation results of the phase masks optimized using Methods A, B, and C. We simulated this process by applying a Fourier transform to E desired ( x , y ) and then multiplying the transformed field with a circular mask, ensuring that all values outside the designated circular region are set to zero. An inverse Fourier transform was subsequently applied to the filtered data to reconstruct the amplitude and phase of the modified light field at the imaging plane of the SLM.
Then, we conducted the experiment according to the experimental setup diagram. The experimental results of non-iterative methods are shown in Figure 4. Figure 4a shows the desired modes (LG11, LG22, HG11, HG22). Figure 4b shows the phase distribution of the desired modes. To compare different optimization methods, Figure 4c presents the experimental results of the non-optimized phase masks. Figure 4d displays the modes obtained using the phase by Method A. Figure 4e presents the modes generated by Method B, while Figure 4f shows the modes obtained through Method C.
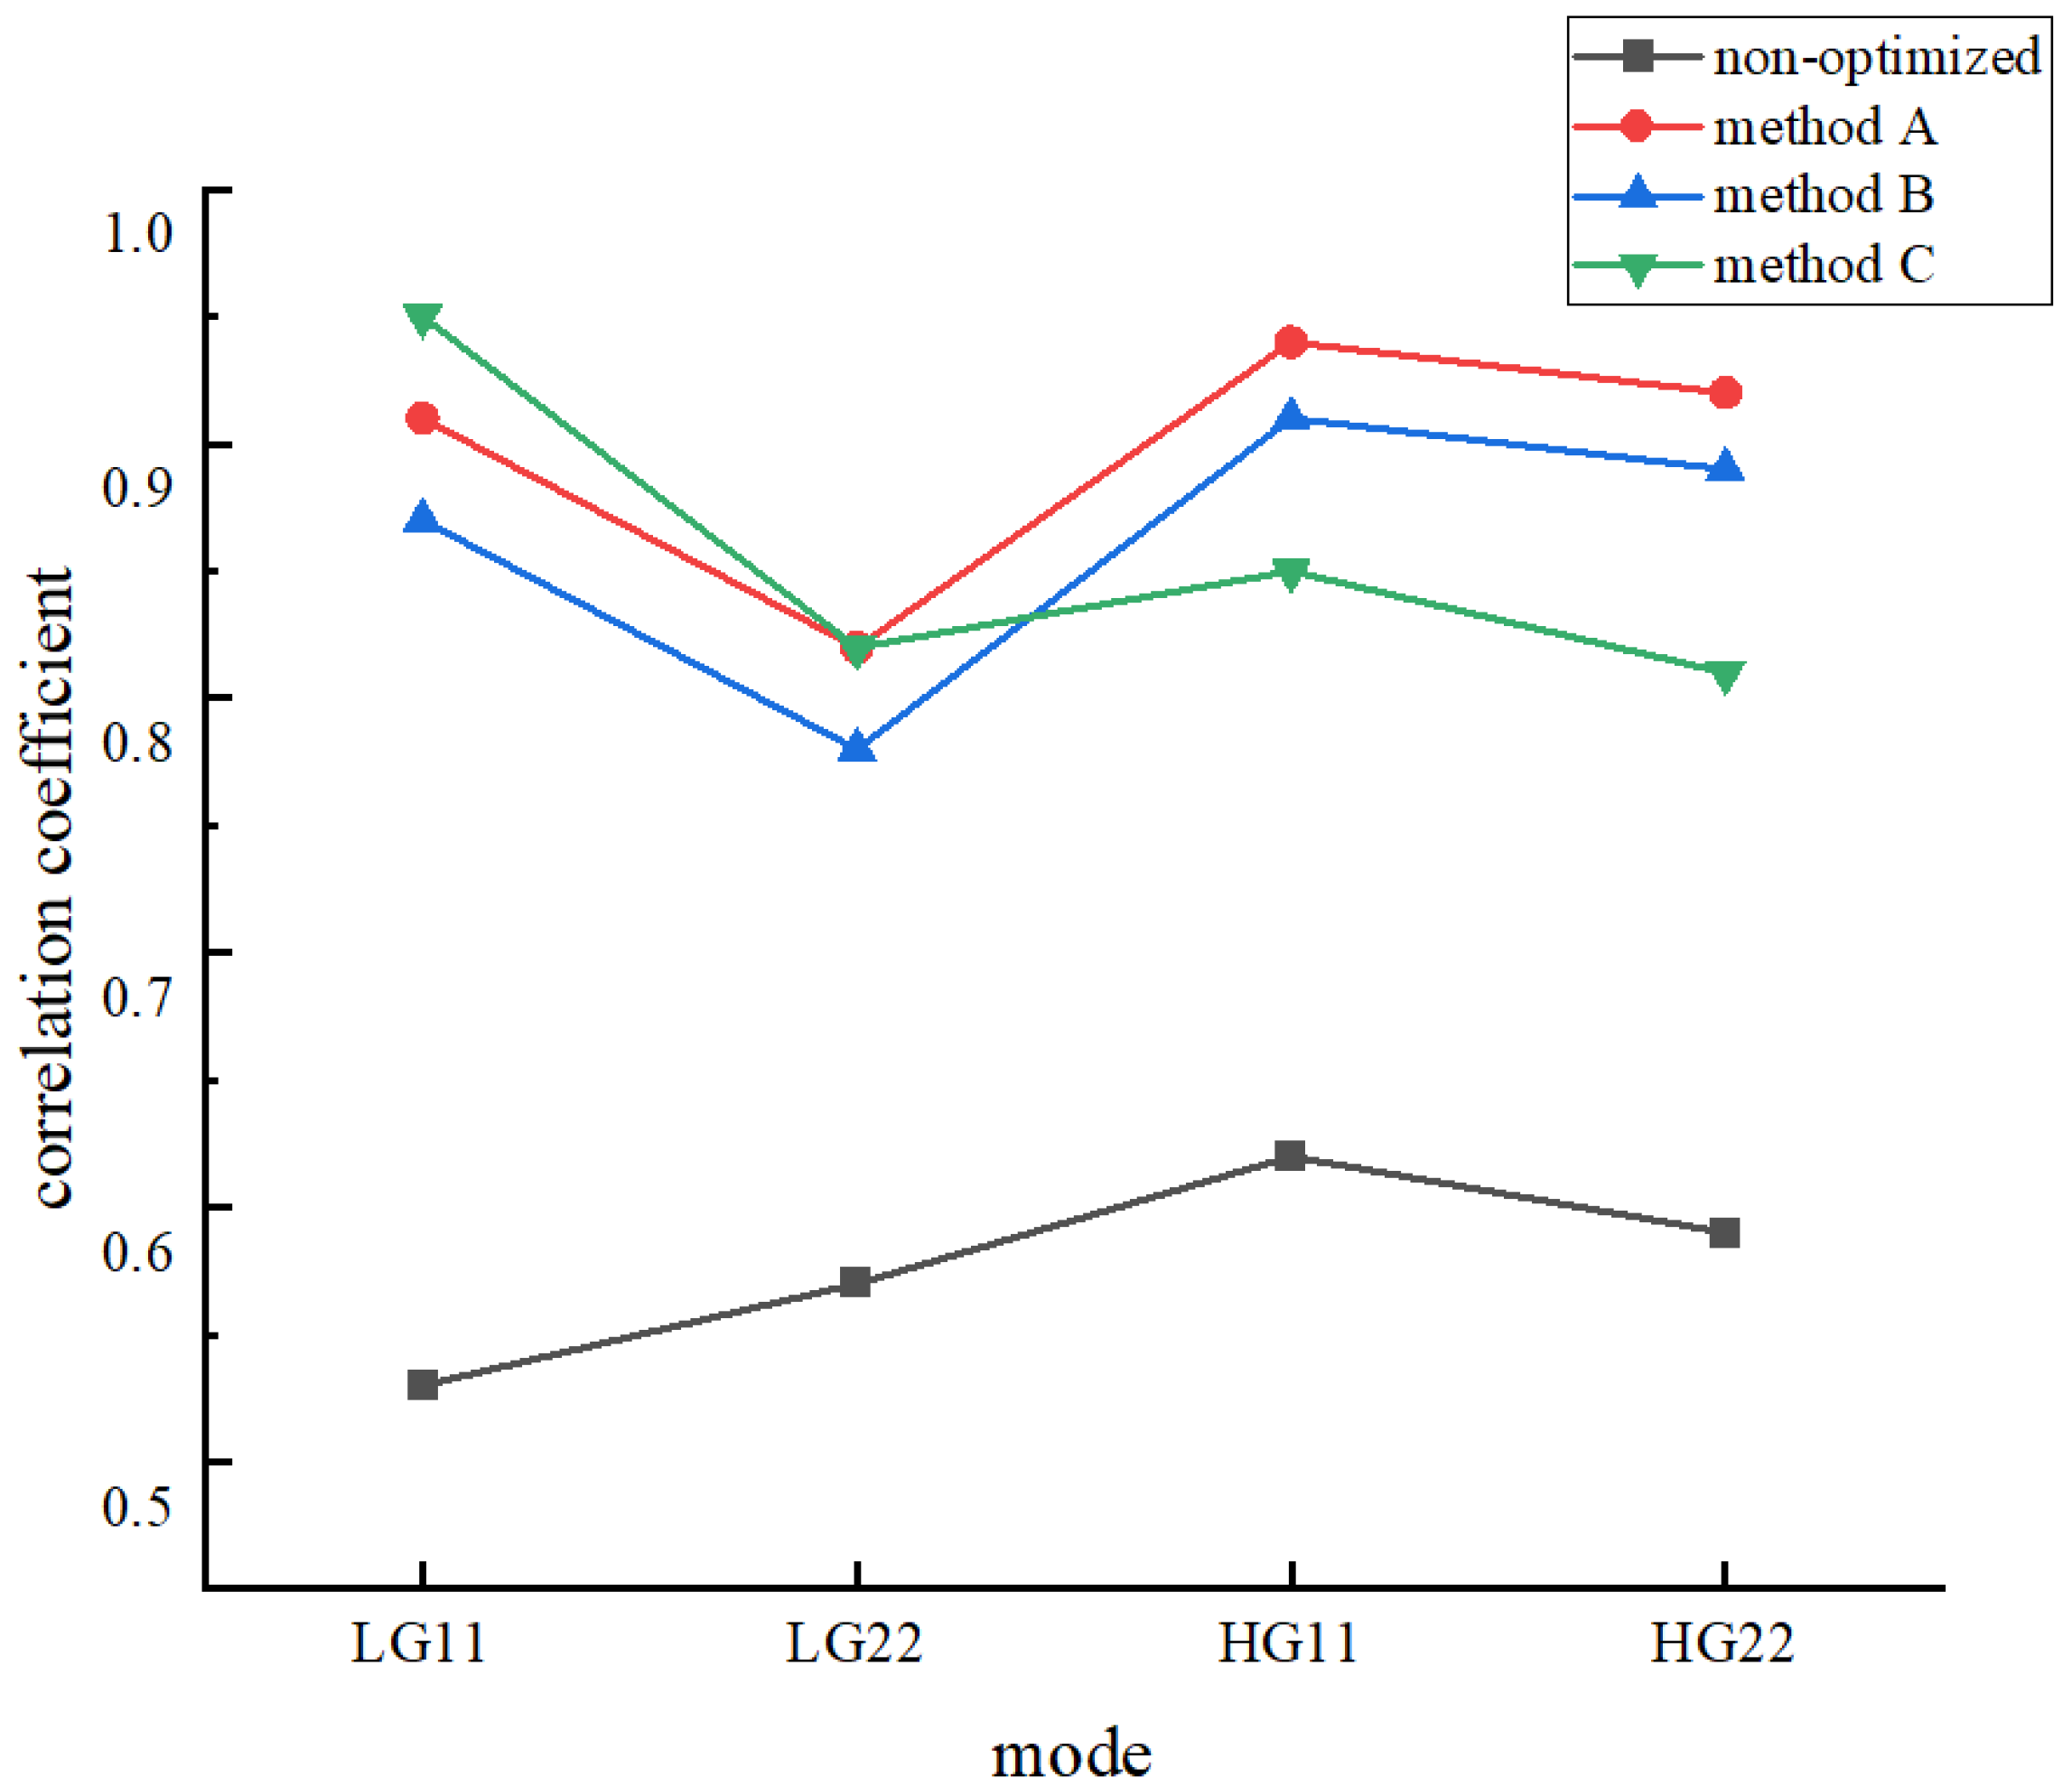
We quantitatively compared the modes obtained using non-optimized and optimized masks by calculating their correlation coefficients. The line chart in Figure 5 illustrates the correlation coefficients obtained from the non-optimized mask and the mask optimized using non-iterative methods. As expected, we obtained lower correlation values with the non-optimized mask, whereas significantly higher correlation values were observed with the optimized mask. The correlation coefficients of desired modes from the non-optimized method were 53%, 57%, 62%, and 59%, respectively. In our analysis, Method A produced correlation coefficients of 91 % , 82 % , 94 % , and 94 % , respectively. In comparison, Method B produced slightly lower coefficients, measuring 87 % , 78 % , 91 % , and 89 % , while Method C yielded correlation coefficients of 95 % , 82 % , 85 % , and 81 % . These findings highlight the varying effectiveness of different methods in enhancing correlation. Our results indicate that Method A outperforms the others. Through experimental investigation, we found that the optimization effectiveness of the same method varies for different light fields. Overall, the NI optimization algorithm yields an imperfect representation of the symmetry in the desired light fields.
To address these issues, we propose using combination of NI algorithms and SA algorithm to optimize the phase masks, ensuring that ideal results can be obtained for any desired modes and images.

3.2. Combination of NI Algorithms and SA Algorithm for Hologram Generation

The GS algorithm is well known among iterative algorithms; however, it is prone to becoming trapped in local optima. To demonstrate the performance of the GS and SA algorithms in light field reconstruction, we selected the ‘pine’ image as the test image. Furthermore, we compared the result obtained using the SA algorithm with those obtained using the GS algorithm. Figure 6 shows the result from the GS algorithm, where it is evident that the algorithm becomes trapped in a local optimum during the iterative process.
To evaluate the symmetry of the reconstructed image, we employ the following computational method:
S y m m e t r y = 1.0 1 255 · h · w 2 y = 0 h 1 x = 0 w 2 1 I ( y , x ) I ( y , w x 1 )
where h is the height (number of rows) of the image, w is the width (number of columns) of the image, I ( y , x ) is the grayscale value at the yth row and xth column of the image, and I ( y , w x 1 ) is the grayscale value at the symmetric position on the right side of the image.
According to Equation (29), the symmetry of Figure 6 is calculated to be 86%. Subsequently, we generated CGHs using the SA algorithm, known as NOSAA, to reconstruct the ‘pine’ image. Figure 7 illustrates the entire process of NOSAA. Figure 7a shows the evolution of the phase masks from iteration 1 to 900, while Figure 7b presents the corresponding reconstructed images. It can be observed that, with an increasing number of iterations, more intricate image details are reconstructed, and the brightness of the resulting images becomes closer to that of the target image. All other parameters were kept constant as described in the simulation setup. The phase mask from the final iteration was loaded onto the SLM. For comparison, Figure 8a illustrates the target image. The reconstructed image is presented in Figure 8b.
In Figure 8b, the reconstructed ‘pine’ image exhibits very poor quality. To mitigate the influence of objective factors such as laser instability and random fluctuations, we repeated the experiment hourly, for a total of five runs. The correlation coefficients were found to be 52%, 52%, 53%, 51%, and 52%, while the symmetry values were 76%, 75%, 75%, 77%, and 76% respectively. Experimental results demonstrated that when phase masks, generated by the NOSAA method, were loaded onto the SLM, the outcomes were less than perfect, leading to significant disruption of image symmetry. The result shows a discrepancy between the theoretical and experimental outcomes, which may arise from sensitivity to parameter configuration and sampling conditions. Specifically, this is because NOSAA requires extremely precise alignment of the actual optical path. In our theoretical calculations, we preseted the displacement of the first-order optical diffraction and the diameter of the circular aperture filter; however, our optical system cannot perfectly match these preset values. Moreover, objective factors such as lens aberrations and air turbulence within the optical path can affect the optimization results. Then, we used Method A for image reconstruction, with the results shown in Figure 8c. Through the calculations, the correlation coefficient is 92%, and the symmetry is 90%. The experiment demonstrates that the results obtained from the non-iterative optimization method are superior to those obtained from NOSAA within a limited time.
Experimental results confirm that for the reconstruction of ideal images, optimizing phase masks using the SA algorithm within an optical feedback system experiment, known as OESAA, is essential. Considering the disadvantages of NOSAA, such as long computation times and high requirements for experimental accuracy, we utilized the phase masks generated by non-iterative optimization methods as initial phase masks for OESAA. By adopting this combined optimization strategy, our method not only overcame the inefficiency of starting from scratch under the curse of dimensionality and the sensitivity of the experimental setup associated with NOSAA, but also provided a more robust initial value.
In this experiment, the SA algorithm is employed with two loops: an inner loop and an outer loop. In each inner loop, the phase mask randomly perturbed from the previous one is loaded to the SLM to modulate the light. A CCD capture the modulated light and send the captured image back to a computer to calculate the value of cost function. If the value of cost function is lower than the previous value, it can be accepted. If it is higher, it might still be accepted with a certain probability based on the Metropolis principle.
The inner loop is limited to a preset maximum number of iterations. Once the maximum is reached, the system decreases the temperature and starts a new inner loop. This process continues until the value of cost function falls below a preset threshold.
The parameters of the OESAA used in our experiment are as follows. The temperature decay factor, α , is set to 0.97, with an initial high temperature of 10 and a final temperature of 0.001. In each inner loop iteration, the pixel value is randomly perturbed by 1. The Markov chain has a length of 100, indicating 100 iterations at each temperature level. A Markov chain is a stochastic process that models a sequence of potential events, where the probability of each event depends solely on the state achieved in the preceding event. Figure 8d shows the result obtained by combining the non-iterative method with the SA algorithm. According to the calculation, the correlation coefficient is 98%, and the symmetry is 97%. In Figure 8e, the bar chart illustrates the results of the correlation coefficient.
By reconstructing the ‘pine’ using different methods, the proposed approach shows significant improvement in both the correlation coefficient and symmetry compared to the GS algorithm and the NI optimization algorithm. The primary reason is that when using OESAA, we accounted for objective factors in the optical path, such as lens aberrations. Our proposed method can adaptively optimize the quality degradation resulting from these factors.
Due to the fact that LG modes and HG modes play an important role in many disparate areas of physics, we used the combination of NI algorithms and SA algorithm to optimize their phase masks.
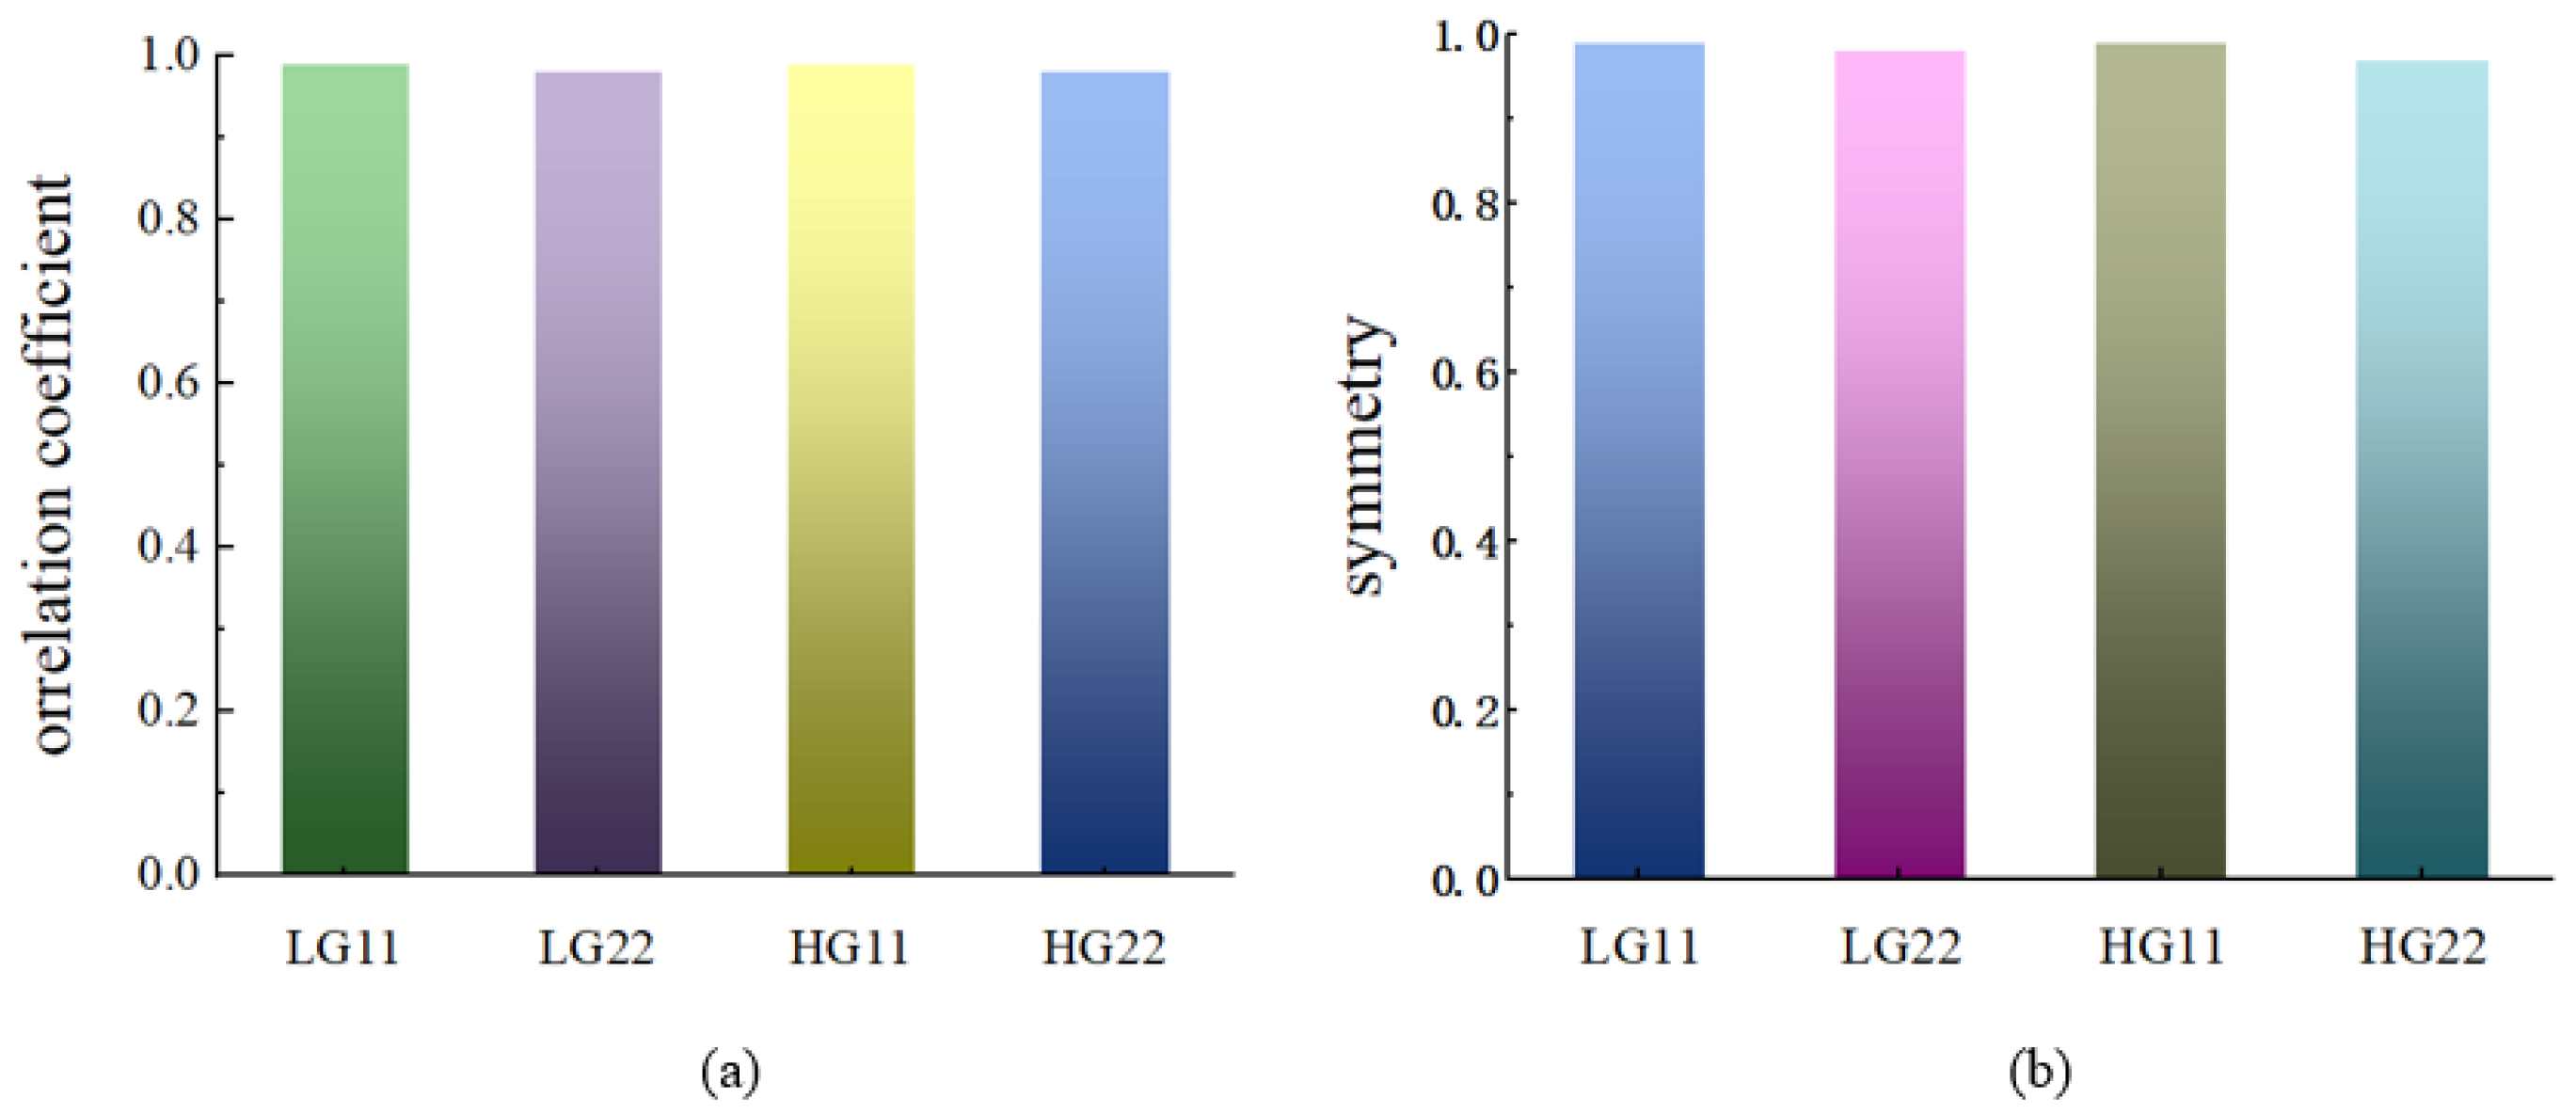
Figure 9 shows the optimized phase masks through OESAA and their corresponding resulting modes. Figure 9a shows the desired modes (LG11, LG22, HG11, HG22) and Figure 9b shows the optimized phase masks by OESAA. Figure 9c,d show the numerical results and the modes obtained using the optimized phase masks from Figure 9b. By evaluating the cost function, the correlation coefficients of the modes are presented in Figure 10a. The results demonstrate that, through OESAA, the correlation coefficients of the modes reached 99%, 98%, 99%, and 98%, respectively, indicating significant improvements over NI algorithms. The results of symmetry reached 99%, 97%, 98%, and 97% in Figure 10b. The experimental results demonstrate that optimizing the light fields using a combination of NI algorithms and the SA algorithm yields a more perfect symmetry in the results.
Our experimental investigations substantiate that the integration of NI algorithms with the SA algorithm markedly improves optimization efficiency. To further confirm the reliability and efficacy of this combined approach, we performed tomographic measurements on the optimized light fields.

3.3. Experiment of Tomographic Measurement

The experimental setup for the MUBs test is illustrated in Figure 11. Projective measures are performed on the OAM degree of freedom using holograms encoded onto S L M 2 (Hamatsu LCOS-SLM, X15213, HAMAMATSU PHOTONICS K.K., Iwata City, Japan). We created six different holograms on S L M 2 to represent the two pure OAM modes as well as four orientations of the superposition states:
| 1 + exp ( i θ ) | 2 , θ = 0 , π / 2 , π , 3 π / 2
A modal decomposition is performed by performing an inner product of the incident field with a match hologram and measuring the on-axis intensity on a camera situated after lens L5. Results of tomographic measurements are shown in Figure 12. Figure 13 shows a specific quantitative description. The quality of the system is assessed using a measure called similarity S, which is analogous to fidelity in pair states. The calculated similarities of desired modes (LG11, LG22, HG11, HG22) are S L G 11 = 0.995 , S L G 22 = 0.987 , S H G 11 = 0.992 , and S H G 22 = 0.981 , respectively.

4. Conclusions

This study employed a hybrid approach combining NI algorithms with the SA algorithm to optimize phase masks for the generation of high-fidelity desired modes. Our experimental findings demonstrate that the optimized phase masks significantly enhance the correlation coefficient of the target mode. By comparing our method with traditional NI algorithms and other optimization techniques, we show that our approach yields superior results in terms of mode reconstruction accuracy and light field purity. The integration of the SA algorithm with non-iterative methods provides a notable improvement in computational efficiency, overcoming the individual limitations of each approach.
A quantitative comparison between the expected modes and the modulated modes through correlation measurements reveals that achieving optimal efficiency requires the careful optimization of the phase masks. The SA algorithm proves to be well suited for this task, effectively addressing the challenges of phase mask generation. These results confirm the practical applicability and superior performance of our method in optical field reconstruction. Furthermore, we introduce novel diagnostic techniques, vector mode decomposition and tomographic measurements, for evaluating the quality of the generated modes. These methods offer valuable insights into the underlying processes and the symmetry of the optical modes, providing a more comprehensive understanding of the phase mask optimization.
Our proposed method exhibits significant potential for enhancing the overall performance of optical systems. This technology not only enables precise control of the light field—improving directional transmission accuracy and stability in applications such as laser processing and optical trapping—but also effectively reduces noise and distortion through real-time adjustment of light field parameters in adaptive imaging, thereby significantly enhancing image resolution and quality for precise imaging solutions in biomedical and industrial inspections. Furthermore, our method facilitates high-precision encoding and decoding of optical signals in multimodal communication systems, improving transmission rates and signal-to-noise ratios, and providing robust support for high-speed, low-energy optical and quantum communications. Integrating this approach with emerging fields such as machine learning can further equip systems with self-adaptive learning and intelligent optimization capabilities, meeting the demands of real-time control in complex environments. Overall, this method demonstrates substantial research value and broad application prospects in both expanding new application areas and enhancing the performance of optical systems.

Author Contributions

Conceptualization: Z.L., H.W. and R.-F.W. Data curation: Z.L. and C.S. Fogrmal analysis: Z.L. and C.S. Investigation: Z.L. and C.S. Methodology: Z.L., H.W. and R.-F.W. Software: C.S. Validation: Z.L. and C.S. Visualization: Z.L. and C.S. Writing—original draft: Z.L. Writing—review and editing: Z.L., H.W., R.-F.W. and C.S. All authors have read and agreed to the published version of the manuscript.

Funding

This research was funded by Natural Science Foundation of Jiangsu Province grant number BK20243060.

Data Availability Statement

The original contributions presented in the study are included in the article; further inquiries can be directed to the corresponding authors.

Acknowledgments

The author Zhiwen Li acknowledges Lijian Zhang for helpful discussions; we thank the anonymous reviewers for their valuable comments and suggestions.

Conflicts of Interest

The authors declare no conflicts of interest.

Abbreviations

The following abbreviations are used in this manuscript:
SASimulated Annealing
SLMSpatial Light Modulators
NINon-Iterative
MUBMutually Unbiased Bases
CGHComputer-Generated Holography
POHPhase-Only Holograms
AOHAmplitude-Only Holograms
GSGerchberg-Saxton
OAMOrbital Angular Momentum
HGHermite–Gaussian
LGLaguerre–Gaussian
NOSAANumerical Optimization Strategy Based on Simulated Annealing Algorithm
OESAAOptical Experiments Using the Simulated Annealing Algorithm

References

  1. Schröter, J. Technologies beyond the Still and the Moving Image: The Case of the Multiplex Hologram. Hist. Photogr. 2011, 35, 23–32. [Google Scholar]
  2. Gentet, P.; Joung, J.; Gentet, Y.; Lee, S.H. A Zerotrope™ with an ultra-realistic full-color digital hologram. In Proceedings of the Digital Holography and Three-Dimensional Imaging 2019, Bordeaux, France, 19–23 May 2019; p. M3A.7. [Google Scholar]
  3. Yoneda, N.; Saita, Y.; Nomura, T. Computer-generated-hologram-based holographic data storage using common-path off-axis digital holography. Opt. Lett. 2020, 45, 2796–2799. [Google Scholar] [PubMed]
  4. Zeng, T.; Zhu, Y.; Lam, E.Y. Deep learning for digital holography: A review. Opt. Express 2021, 29, 40572–40593. [Google Scholar] [PubMed]
  5. Sahin, E.; Stoykova, E.; Mäkinen, J.; Gotchev, A. Computer-generated holograms for 3D imaging: A survey. ACM Comput. Surv. (CSUR) 2020, 53, 1–35. [Google Scholar]
  6. Shi, L.; Li, B.; Kim, C.; Kellnhofer, P.; Matusik, W. Towards real-time photorealistic 3D holography with deep neural networks. Nature 2021, 591, 234–239. [Google Scholar] [CrossRef]
  7. Shoydin, S.A.; Pazoev, A.L. Transmission of 3D holographic information via conventional communication channels and the possibility of multiplexing in the implementation of 3D hyperspectral images. Photonics 2021, 8, 448. [Google Scholar] [CrossRef]
  8. Kim, M.K. Principles and techniques of digital holographic microscopy. SPIE Rev. 2010, 1, 018005. [Google Scholar]
  9. Blinder, D.; Birnbaum, T.; Ito, T.; Shimobaba, T. The state-of-the-art in computer generated holography for 3D display. Light Adv. Manuf. 2022, 3, 572–600. [Google Scholar]
  10. Qin, H.; Han, C.; Shi, X.; Gu, T.; Sun, K. Complex-valued generative adversarial network for real-time and high-quality computer-generated holography. Opt. Express 2024, 32, 44437–44451. [Google Scholar] [CrossRef]
  11. Kara, K.; Lloret, J.; Romero, O.; Sendra, S. Performance Test of Holographic Video Communication System. In Proceedings of the 2024 International Conference on Multimedia Computing, Networking and Applications (MCNA), Valencia, Spain, 17–20 September 2024; pp. 15–20. [Google Scholar]
  12. Nazir, A.; Hussain, A.; Singh, M.; Assad, A. A novel approach in cancer diagnosis: Integrating holography microscopic medical imaging and deep learning techniques—Challenges and future trends. Biomed. Phys. Eng. Express 2025, 11, 022002. [Google Scholar]
  13. Ni, Y.; Feng, J.; Liu, J.; Yu, H.; Wei, H.; Du, Y.; Liu, L.; Sun, L.; Zhou, J.; Xu, W. An artificial nerve capable of UV-perception, NIR–vis switchable plasticity modulation, and motion state monitoring. Adv. Sci. 2022, 9, 2102036. [Google Scholar]
  14. Wang, J.Z.; Zhao, S.; Wu, C.; Adams, R.B.; Newman, M.G.; Shafir, T.; Tsachor, R. Unlocking the emotional world of visual media: An overview of the science, research, and impact of understanding emotion. Proc. IEEE 2023, 111, 1236–1286. [Google Scholar]
  15. Lee, C.; Song, G.; Kim, H.; Ye, J.C.; Jang, M. Deep learning based on parameterized physical forward model for adaptive holographic imaging with unpaired data. Nat. Mach. Intell. 2023, 5, 35–45. [Google Scholar]
  16. Lee, S.; Nam, S.W.; Lee, J.; Jeong, Y.; Lee, B. HoloSR: Deep learning-based super-resolution for real-time high-resolution computer-generated holograms. Opt. Express 2024, 32, 11107–11122. [Google Scholar] [CrossRef]
  17. Zhou, G.; Wang, R.F. The Heterogeneous Network Community Detection Model Based on Self-Attention. Symmetry 2025, 17, 432. [Google Scholar] [CrossRef]
  18. Park, J.; Kang, H. Holo-VQVAE: VQ-VAE for phase-only holograms. arXiv 2024, arXiv:2404.01330. [Google Scholar]
  19. Fan, M.; Wang, J.; Du, C.; Yang, J.; Wang, H.; Xu, X. Generation of Non-Iterative POHs based on Optimized Hybrid Phase for Fresnel Lensless Holographic Projection. Teh. Vjesn. 2024, 31, 262–271. [Google Scholar]
  20. Liu, Q.; Chen, J.; Qiu, B.; Wang, Y.; Liu, J. DCPNet: A dual-channel parallel deep neural network for high quality computer-generated holography. Opt. Express 2023, 31, 35908–35921. [Google Scholar]
  21. Zhang, C.; Han, P.; Shi, J.; Zhou, H.; Zhang, Q.; Cheng, H.; Shen, C.; Zhang, F.; Han, C.; Wei, S. Non-Iterative 3D Computer-Generated Hologram Based on Single Full-Support Optimized Random Phase and Phase Compensation. New J. Phys. 2024, 26, 063032. [Google Scholar] [CrossRef]
  22. Zhang, C.; Wu, F.; Zhou, J.; Wei, S. Non-iterative phase hologram generation for color holographic display. Opt. Express 2021, 30, 195–209. [Google Scholar] [CrossRef]
  23. Wang, W.; Wang, X.; Xu, B.; Chen, J. Optical image encryption and authentication using phase-only computer-generated hologram. Opt. Lasers Eng. 2021, 146, 106722. [Google Scholar]
  24. Tsang, P.; Chow, Y.T.; Poon, T.C. Generation of patterned-phase-only holograms (PPOHs). Opt. Express 2017, 25, 9088–9093. [Google Scholar] [CrossRef] [PubMed]
  25. Kishk, S.; Javidi, B. Information hiding technique with double phase encoding. Appl. Opt. 2002, 41, 5462–5470. [Google Scholar] [CrossRef] [PubMed]
  26. Chen, L.; Zhang, H.; He, Z.; Wang, X.; Cao, L.; Jin, G. Weighted constraint iterative algorithm for phase hologram generation. Appl. Sci. 2020, 10, 3652. [Google Scholar] [CrossRef]
  27. Yang, G.Z.; Dong, B.Z.; Gu, B.Y.; Zhuang, J.Y.; Ersoy, O.K. Gerchberg–Saxton and Yang–Gu algorithms for phase retrieval in a nonunitary transform system: A comparison. Appl. Opt. 1994, 33, 209–218. [Google Scholar] [CrossRef]
  28. Guo, C.; Liu, S.; Sheridan, J.T. Iterative phase retrieval algorithms. I: Optimization. Appl. Opt. 2015, 54, 4698–4708. [Google Scholar] [CrossRef]
  29. Gaunt, A.; Hadzibabic, Z. Robust Digital Holography For Ultracold Atom Trapping. Sci. Rep. 2012, 2, 721. [Google Scholar]
  30. Zhao, T.; Chi, Y. Modified Gerchberg–Saxton (G-S) Algorithm and Its Application. Entropy 2020, 22, 1354. [Google Scholar] [CrossRef]
  31. Reddy, A.N.K.; Dev, V.; Pal, V.; Ganeev, R.A. The Effect of a Parabolic Apodizer on Improving the Imaging of Optical Systems with Coma and Astigmatism Aberrations. Photonics 2023, 11, 14. [Google Scholar] [CrossRef]
  32. Wang, H.; Liu, J.; Liu, L.; Zhao, M.; Mei, S. Coupling technology of OpenSURF and Shannon-Cosine wavelet interpolation for locust slice images inpainting. Comput. Electron. Agric. 2022, 198, 107110. [Google Scholar]
  33. Kelley, E.F. Calibration Requirements for Demanding Measurement Challenges. Inf. Disp. 2018, 34, 28–54. [Google Scholar] [CrossRef]
  34. Bertsimas, D.; Tsitsiklis, J. Simulated annealing. Stat. Sci. 1993, 8, 10–15. [Google Scholar] [CrossRef]
  35. Junior, H.A.; Ingber, L.; Petraglia, A.; Petraglia, M.R.; Machado, M.A.S. Stochastic Global Optimization and Its Applications with Fuzzy Adaptive Simulated Annealing; Springer Science & Business Media: Berlin/Heidelberg, Germany, 2012; Volume 35. [Google Scholar]
  36. Osaba, E.; Villar-Rodriguez, E.; Del Ser, J.; Nebro, A.J.; Molina, D.; LaTorre, A.; Suganthan, P.N.; Coello, C.A.C.; Herrera, F. A tutorial on the design, experimentation and application of metaheuristic algorithms to real-world optimization problems. Swarm Evol. Comput. 2021, 64, 100888. [Google Scholar] [CrossRef]
  37. Wang, S.; Wang, Y.; Wang, M. Connectivity and matching preclusion for leaf-sort graphs. J. Interconnect. Netw. 2019, 19, 1940007. [Google Scholar] [CrossRef]
  38. Zhao, C.T.; Wang, R.F.; Tu, Y.H.; Pang, X.X.; Su, W.H. Automatic Lettuce Weed Detection and Classification Based on Optimized Convolutional Neural Networks for Robotic Weed Control. Agronomy 2024, 14, 2838. [Google Scholar] [CrossRef]
  39. Dong, H.; Dong, Z. Surrogate-assisted grey wolf optimization for high-dimensional, computationally expensive black-box problems. Swarm Evol. Comput. 2020, 57, 100713. [Google Scholar] [CrossRef]
  40. Lavin, A.; Krakauer, D.; Zenil, H.; Gottschlich, J.; Mattson, T.; Brehmer, J.; Anandkumar, A.; Choudry, S.; Rocki, K.; Baydin, A.G.; et al. Simulation intelligence: Towards a new generation of scientific methods. arXiv 2021, arXiv:2112.03235. [Google Scholar]
  41. Abdulazeez, D.H.; Askar, S.K. Offloading mechanisms based on reinforcement learning and deep learning algorithms in the fog computing environment. IEEE Access 2023, 11, 12555–12586. [Google Scholar] [CrossRef]
  42. Tu, Y.H.; Wang, R.F.; Su, W.H. Active Disturbance Rejection Control—New Trends in Agricultural Cybernetics in the Future: A Comprehensive Review. Machines 2025, 13, 111. [Google Scholar] [CrossRef]
  43. Yarmohamadi, H.; Mirhosseini, S. A new dynamic simulated annealing algorithm for global optimization. J. Math. Comput. Sci 2015, 14, 16–23. [Google Scholar] [CrossRef]
  44. Wang, S.; Wang, M. The strong connectivity of bubble-sort star graphs. Comput. J. 2019, 62, 715–729. [Google Scholar]
  45. Lalaoui, M.; El Afia, A.; Chiheb, R. A self-tuned simulated annealing algorithm using hidden markov model. Int. J. Electr. Comput. Eng. 2018, 8, 291–298. [Google Scholar] [CrossRef]
  46. Lalaoui, M.; El Afia, A.; Chiheb, R. Simulated Annealing with Adaptive Neighborhood using Fuzzy Logic Controller. In Proceedings of the International Conference on Learning and Optimization Algorithms: Theory and Applications, New York, NY, USA, 2–5 May 2018. LOPAL ’18. [Google Scholar]
  47. Weng, Y.; Pan, Z. Orbital angular momentum based sensing and their applications: A review. J. Light. Technol. 2022, 41, 2007–2016. [Google Scholar]
  48. Mair, A.; Vaziri, A.; Weihs, G.; Zeilinger, A. Entanglement of the orbital angular momentum states of photons. Nature 2001, 412, 313–316. [Google Scholar] [CrossRef] [PubMed]
  49. Wang, H.; Mei, S.L. Shannon wavelet precision integration method for pathologic onion image segmentation based on homotopy perturbation technology. Math. Probl. Eng. 2014, 2014, 601841. [Google Scholar]
  50. Forbes, A.; Dudley, A.; McLaren, M. Creation and detection of optical modes with spatial light modulators. Adv. Opt. Photonics 2016, 8, 200–227. [Google Scholar]
  51. Ndagano, B.; Perez-Garcia, B.; Roux, F.S.; McLaren, M.; Rosales-Guzman, C.; Zhang, Y.; Mouane, O.; Hernandez-Aranda, R.I.; Konrad, T.; Forbes, A. Characterizing quantum channels with non-separable states of classical light. Nat. Phys. 2017, 13, 397–402. [Google Scholar]
  52. Mafu, M.; Dudley, A.; Goyal, S.; Giovannini, D.; McLaren, M.; Padgett, M.J.; Konrad, T.; Petruccione, F.; Lütkenhaus, N.; Forbes, A. Higher-dimensional orbital-angular-momentum-based quantum key distribution with mutually unbiased bases. Phys. Rev. A 2013, 88, 032305. [Google Scholar]
  53. Krenn, M.; Huber, M.; Fickler, R.; Lapkiewicz, R.; Ramelow, S.; Zeilinger, A. Generation and confirmation of a (100× 100)-dimensional entangled quantum system. Proc. Natl. Acad. Sci. USA 2014, 111, 6243–6247. [Google Scholar]
  54. Sit, A.; Bouchard, F.; Fickler, R.; Gagnon-Bischoff, J.; Larocque, H.; Heshami, K.; Elser, D.; Peuntinger, C.; Günthner, K.; Heim, B.; et al. High-dimensional intracity quantum cryptography with structured photons. Optica 2017, 4, 1006–1010. [Google Scholar]
  55. Fano, U. Description of States in Quantum Mechanics by Density Matrix and Operator Techniques. Rev. Mod. Phys. 1957, 29, 74–93. [Google Scholar]
  56. James, D.F.V.; Kwiat, P.G.; Munro, W.J.; White, A.G. Measurement of qubits. Phys. Rev. A 2001, 64, 052312. [Google Scholar]
  57. de Burgh, M.D.; Langford, N.K.; Doherty, A.C.; Gilchrist, A. Choice of measurement sets in qubit tomography. Phys. Rev. A 2008, 78, 052122. [Google Scholar]
  58. Jack, B.; Leach, J.; Ritsch, H.; Barnett, S.M.; Padgett, M.J.; Franke-Arnold, S. Precise quantum tomography of photon pairs with entangled orbital angular momentum. New J. Phys. 2009, 11, 103024. [Google Scholar]
  59. Spengler, C.; Huber, M.; Brierley, S.; Adaktylos, T.; Hiesmayr, B.C. Entanglement detection via mutually unbiased bases. Phys. Rev. A 2012, 86, 022311. [Google Scholar]
  60. Zhou, Y. Optical Communication with Structured Photons Propagating Through Dynamic, Aberrating Media; University of Rochester: Rochester, NY, USA, 2021. [Google Scholar]
  61. Bastiaans, M.J. Applications of the Wigner distribution to partially coherent light beams. Adv. Inf. Opt. Photonics 2008, 6, 27. [Google Scholar]
  62. Kovsh, D.I. Laser Beam Propagation Through Bulk Nonlinear Media: Numerical Simulation and Experiment; University of Central Florida: Orlando, FL, USA, 1999. [Google Scholar]
  63. Wang, M.; Lin, Y.; Wang, S. The nature diagnosability of bubble-sort star graphs under the PMC model and MM model. Int. J. Eng. Appl. Sci. 2017, 4, 2394–3661. [Google Scholar]
  64. Wang, M.; Ren, Y.; Lin, Y.; Wang, S. The tightly super 3-extra connectivity and diagnosability of locally twisted cubes. Am. J. Comput. Math. 2017, 7, 127–144. [Google Scholar]
  65. Sun, S.; Liu, J.; Sun, S. Hyperspectral subpixel target detection based on interaction subspace model. Pattern Recognit. 2023, 139, 109464. [Google Scholar]
  66. Wang, R.F.; Su, W.H. The application of deep learning in the whole potato production Chain: A Comprehensive review. Agriculture 2024, 14, 1225. [Google Scholar] [CrossRef]
  67. Wang, Z.; Wang, R.; Wang, M.; Lai, T.; Zhang, M. Self-supervised transformer-based pre-training method with General Plant Infection dataset. In Proceedings of the Chinese Conference on Pattern Recognition and Computer Vision (PRCV), Urumqi, China, 18–20 October 2024; Springer: Berlin/Heidelberg, Germany, 2024; pp. 189–202. [Google Scholar]
  68. Ni, Y.; Wang, Y.; Xu, W. Recent process of flexible transistor-structured memory. Small 2021, 17, 1905332. [Google Scholar]
  69. Chen, J.; Wan, C.; Zhan, Q. Engineering photonic angular momentum with structured light: A review. Adv. Photonics 2021, 3, 064001. [Google Scholar]
  70. Noor, S.K.; Yasin, M.N.M.; Ismail, A.M.; Osman, M.N.; Soh, P.J.; Ramli, N.; Rambe, A.H. A review of orbital angular momentum vortex waves for the next generation wireless communications. IEEE Access 2022, 10, 89465–89484. [Google Scholar]
  71. Khare, K.; Lochab, P.; Senthilkumaran, P. Orbital Angular Momentum States of Light: Propagation Through Atmospheric Turbulence; IOP Publishing: Bristol, UK, 2024. [Google Scholar]
  72. Padgett, M.; Arlt, J.; Simpson, N.; Allen, L. An experiment to observe the intensity and phase structure of Laguerre-Gaussian laser modes. Am. J. Phys. 1996, 64, 77–81. [Google Scholar]
  73. Mardan Dezfouli, A. Generation and Detection of Optical Vortex Beam. Ph.D. Thesis, Department of Physics, Faculty of Science, University of Zagreb, Zagreb, Croatia, 2024. [Google Scholar]
  74. Bae, J.Y.; Jeon, C.; Pae, K.H.; Kim, C.M.; Kim, H.S.; Han, I.; Yeo, W.J.; Jeong, B.; Jeon, M.; Lee, D.H.; et al. Generation of low-order Laguerre-Gaussian beams using hybrid-machined reflective spiral phase plates for intense laser-plasma interactions. Results Phys. 2020, 19, 103499. [Google Scholar]
  75. Kovalev, A.; Kotlyar, V.; Porfirev, A. Asymmetric laguerre-gaussian beams. Phys. Rev. A 2016, 93, 063858. [Google Scholar]
  76. Ghaderi Goran Abad, M.; Mahmoudi, M. Laguerre-Gaussian modes generated vector beam via nonlinear magneto-optical rotation. Sci. Rep. 2021, 11, 5972. [Google Scholar]
  77. Longman, A.; Fedosejevs, R. Mode conversion efficiency to Laguerre-Gaussian OAM modes using spiral phase optics. Opt. Express 2017, 25, 17382–17392. [Google Scholar]
  78. Pampaloni, F.; Enderlein, J. Gaussian, hermite-gaussian, and laguerre-gaussian beams: A primer. arXiv 2004, arXiv:physics/0410021. [Google Scholar]
  79. Kim, H.C.; Lee, Y.H. Hermite–Gaussian and Laguerre–Gaussian beams beyond the paraxial approximation. Opt. Commun. 1999, 169, 9–16. [Google Scholar]
  80. Saghafi, S.; Sheppard, C.; Piper, J. Characterising elegant and standard Hermite–Gaussian beam modes. Opt. Commun. 2001, 191, 173–179. [Google Scholar] [CrossRef]
  81. Casperson, L.W.; Tovar, A.A. Hermite–sinusoidal-Gaussian beams in complex optical systems. J. Opt. Soc. Am. A 1998, 15, 954–961. [Google Scholar] [CrossRef]
  82. Laabs, H. Propagation of Hermite-Gaussian-beams beyond the paraxial approximation. Opt. Commun. 1998, 147, 1–4. [Google Scholar] [CrossRef]
  83. Hofer, L.; Jones, L.; Goedert, J.; Dragone, R. Hermite–Gaussian mode detection via convolution neural networks. J. Opt. Soc. Am. A 2019, 36, 936–943. [Google Scholar] [CrossRef]
  84. Luo, Y.Z.; Tang, G.J.; Zhou, L.N. Simulated annealing for solving near-optimal low-thrust orbit transfer. Eng. Optim. 2005, 37, 201–216. [Google Scholar] [CrossRef]
  85. Delahaye, D.; Chaimatanan, S.; Mongeau, M. Simulated annealing: From basics to applications. In Handbook of Metaheuristics; Springer: Cham, Switzerland, 2019; pp. 1–35. [Google Scholar]
  86. Burke, E.K.; Burke, E.K.; Kendall, G.; Kendall, G. Search Methodologies: Introductory Tutorials in Optimization and Decision Support Techniques; Springer: Berlin/Heidelberg, Germany, 2014. [Google Scholar]
  87. Shakouri G., H.; Shojaee, K.; T. Behnam, M. Investigation on the choice of the initial temperature in the simulated annealing: A mushy state SA for TSP. In Proceedings of the 2009 17th Mediterranean Conference on Control and Automation, Thessaloniki, Greece, 24–26 June 2009; pp. 1050–1055. [Google Scholar]
  88. Glover, F.W.; Kochenberger, G.A. Handbook of metaheuristics; Springer Science & Business Media: Berlin/Heidelberg, Germany, 2003; Volume 57. [Google Scholar]
  89. Wang, H.; Zhang, X.; Mei, S. Shannon-Cosine Wavelet Precise Integration Method for Locust Slice Image Mixed Denoising. Math. Probl. Eng. 2020, 2020, 4989735. [Google Scholar] [CrossRef]
  90. Carpenter, J.; Wilkinson, T.D. Graphics processing unit–accelerated holography by simulated annealing. Opt. Eng. 2010, 49, 095801. [Google Scholar] [CrossRef]
  91. Gallego-Ruiz, R.; Álvarez-Castaño, M.; Herrera-Ramírez, J.; Correa, N. Optimization of phase masks using simulated annealing algorithm for mode conversion. J. Phys. Conf. Ser. 2020, 1547, 012007. [Google Scholar] [CrossRef]
  92. Berdagué, S.; Facq, P. Mode division multiplexing in optical fibers. Appl. Opt. 1982, 21, 1950–1955. [Google Scholar] [CrossRef]
  93. Fang, L.; Zuo, H.; Pang, L.; Yang, Z.; Zhang, X.; Zhu, J. Image reconstruction through thin scattering media by simulated annealing algorithm. Opt. Lasers Eng. 2018, 106, 105–110. [Google Scholar] [CrossRef]
  94. Davis, J.A.; Cottrell, D.M.; Campos, J.; Yzuel, M.J.; Moreno, I. Encoding amplitude information onto phase-only filters. Appl. Opt. 1999, 38, 5004–5013. [Google Scholar] [PubMed]
  95. Bolduc, E.; Bent, N.; Santamato, E.; Karimi, E.; Boyd, R.W. Exact solution to simultaneous intensity and phase encryption with a single phase-only hologram. Opt. Lett. 2013, 38, 3546–3549. [Google Scholar]
  96. Arrizón, V.; Ruiz, U.; Carrada, R.; González, L.A. Pixelated phase computer holograms for the accurate encoding of scalar complex fields. J. Opt. Soc. Am. A 2007, 24, 3500–3507. [Google Scholar]
  97. Lima, G.; Neves, L.; Guzmán, R.; Gómez, E.S.; Nogueira, W.; Delgado, A.; Vargas, A.; Saavedra, C. Experimental quantum tomography of photonic qudits via mutually unbiased basis. Opt. Express 2011, 19, 3542–3552. [Google Scholar] [PubMed]
  98. Adamson, R.; Steinberg, A.M. Improving quantum state estimation with mutually unbiased bases. Phys. Rev. Lett. 2010, 105, 030406. [Google Scholar] [CrossRef]
  99. Fernández-Pérez, A.; Klimov, A.; Saavedra, C. Quantum process reconstruction based on mutually unbiased basis. Phys. Rev. A 2011, 83, 052332. [Google Scholar]
  100. Giovannini, D.; Romero, J.; Leach, J.; Dudley, A.; Forbes, A.; Padgett, M.J. Characterization of high-dimensional entangled systems via mutually unbiased measurements. Phys. Rev. Lett. 2013, 110, 143601. [Google Scholar]
  101. Coles, P.J.; Berta, M.; Tomamichel, M.; Wehner, S. Entropic uncertainty relations and their applications. Rev. Mod. Phys. 2017, 89, 015002. [Google Scholar]
  102. Padgett, M.J.; Courtial, J. Poincaré-sphere equivalent for light beams containing orbital angular momentum. Opt. Lett. 1999, 24, 430–432. [Google Scholar] [CrossRef]
  103. Toninelli, E.; Ndagano, B.; Vallés, A.; Sephton, B.; Nape, I.; Ambrosio, A.; Capasso, F.; Padgett, M.J.; Forbes, A. Concepts in quantum state tomography and classical implementation with intense light: A tutorial. Adv. Opt. Photonics 2019, 11, 67–134. [Google Scholar] [CrossRef]
  104. Wu, K.D.; Streltsov, A.; Regula, B.; Xiang, G.Y.; Li, C.F.; Guo, G.C. Experimental progress on quantum coherence: Detection, quantification, and manipulation. Adv. Quantum Technol. 2021, 4, 2100040. [Google Scholar]
  105. Krenn, M.; Malik, M.; Erhard, M.; Zeilinger, A. Orbital angular momentum of photons and the entanglement of Laguerre–Gaussian modes. Philos. Trans. R. Soc. A Math. Phys. Eng. Sci. 2017, 375, 20150442. [Google Scholar]
  106. Jullien, T.; Roulleau, P.; Roche, B.; Cavanna, A.; Jin, Y.; Glattli, D. Quantum tomography of an electron. Nature 2014, 514, 603–607. [Google Scholar] [PubMed]
  107. Maire, E.; Withers, P.J. Quantitative X-ray tomography. Int. Mater. Rev. 2014, 59, 1–43. [Google Scholar]
  108. Kokail, C.; van Bijnen, R.; Elben, A.; Vermersch, B.; Zoller, P. Entanglement Hamiltonian tomography in quantum simulation. Nat. Phys. 2021, 17, 936–942. [Google Scholar]
  109. Cozzolino, D.; Da Lio, B.; Bacco, D.; Oxenløwe, L.K. High-dimensional quantum communication: Benefits, progress, and future challenges. Adv. Quantum Technol. 2019, 2, 1900038. [Google Scholar]
  110. Thekkadath, G.; England, D.; Bouchard, F.; Zhang, Y.; Kim, M.; Sussman, B. Intensity interferometry for holography with quantum and classical light. Sci. Adv. 2023, 9, eadh1439. [Google Scholar]
  111. Pachava, S.; Dharmavarapu, R.; Vijayakumar, A.; Jayakumar, S.; Manthalkar, A.; Dixit, A.; Viswanathan, N.K.; Srinivasan, B.; Bhattacharya, S. Generation and decomposition of scalar and vector modes carrying orbital angular momentum: A review. Opt. Eng. 2020, 59, 041205. [Google Scholar]
  112. Angelsky, O.; Bekshaev, A.Y.; Vasnetsov, M.; Zenkova, C.Y.; Maksimyak, P.; Zheng, J. Optical phase singularities: Physical nature, manifestations and applications. Front. Phys. 2022, 10, 1060787. [Google Scholar]
  113. Defienne, H.; Ndagano, B.; Lyons, A.; Faccio, D. Polarization entanglement-enabled quantum holography. Nat. Phys. 2021, 17, 591–597. [Google Scholar]
  114. Erhard, M.; Fickler, R.; Krenn, M.; Zeilinger, A. Twisted photons: New quantum perspectives in high dimensions. Light Sci. Appl. 2018, 7, 17146. [Google Scholar]
  115. Ni, Y.; Yang, L.; Feng, J.; Liu, J.; Sun, L.; Xu, W. Flexible optoelectronic neural transistors with broadband spectrum sensing and instant electrical processing for multimodal neuromorphic computing. SmartMat 2023, 4, e1154. [Google Scholar]
Figure 1. Flowchart of the SA algorithm used to optimize phase mask.
Symmetry 17 00530 g001
Figure 2. Experimental setup scheme of the optical system using SLM. The input laser beam is expanded and collimated by the beam expander, consisting of Lens 1 (L1) and Lens (L2), to produce a plane wave before the SLM. The SLM is used to modulate the input beam with a phase mask. A mirror is employed to fold the optical path and guide the modulated beam through a 4f imaging system L3 and L4. The SF is used to select the desired diffraction order. Finally, the CCD camera captures the modulated beam for data acquisition and analysis.
Symmetry 17 00530 g002
Figure 3. Numerical results of 4 different modes (LG11, LG22, HG11, HG22). (a) Reconstruction results using non-optimized phase masks. (b) Corresponding outcomes from Method A. (c) Outcomes from Method B. (d) Analysis results by Method C.
Symmetry 17 00530 g003
Figure 4. (a) Desired modes. (b) The phase distribution of desired modes. (c) Obtained modes without optimized mask. (d) Modes acquired by implementing Method A. (e) Modes captured utilizing Method B. (f) Modes obtained through the application of Method C.
Symmetry 17 00530 g004
Figure 5. Comparison of correlation coefficients between non-optimized and various non-iterative optimization methods.
Symmetry 17 00530 g005
Figure 6. Reconstruction result of the ‘pine’ image utilizing the GS algorithm.
Symmetry 17 00530 g006
Figure 7. The entire process of NOSAA. (a) Variation of the phase mask with iteration number n ranging from 1 to 900. (b) Transformation of the reconstructed image as a function of iteration number n spanning from 1 to 900.
Symmetry 17 00530 g007
Figure 8. Optical results: (a) Target image. (b) The image captured by CCD after NOSAA. (c) Reconstructed result by Method A. (d) Reconstructed result by OESAA. (e) The results of the correlation coefficient.
Symmetry 17 00530 g008
Figure 9. The results of OESAA. (a) Desired modes. (b) The optimized phase masks by OESAA. (c) Numerical results of 4 modes using optimized phases. (d) Obtained modes with optimized masks.
Symmetry 17 00530 g009
Figure 10. (a) Correlation coefficients of optimized masks by OESAA. (b) Symmetry of optimized masks by OESAA.
Symmetry 17 00530 g010
Figure 11. Experimental setup scheme of tomographic measurement.
Symmetry 17 00530 g011
Figure 12. Tomography measurement obtained by projection of modes into six OAM states.
Symmetry 17 00530 g012
Figure 13. Characterization of projection measurements into the six states.
Symmetry 17 00530 g013
Disclaimer/Publisher’s Note: The statements, opinions and data contained in all publications are solely those of the individual author(s) and contributor(s) and not of MDPI and/or the editor(s). MDPI and/or the editor(s) disclaim responsibility for any injury to people or property resulting from any ideas, methods, instructions or products referred to in the content.