Article

Association Between Gait Lower Limb Intra and Interlimb Coordination and Fear of Falling and Falling History in Older Adults

by
Márcia Castro
1,
Juliana Moreira
1,2 and
Andreia S. P. Sousa
1,*
1
CIR, E2S, Polytechnic of Porto, Rua Dr. António Bernardino de Almeida, 4249-015 Porto, Portugal
2
Research Center in Physical Activity, Health and Leisure, Faculty of Sports, University of Porto, 4200-450 Porto, Portugal
*
Author to whom correspondence should be addressed.
Symmetry 2025, 17(6), 818; https://doi.org/10.3390/sym17060818
Submission received: 15 April 2025 / Revised: 16 May 2025 / Accepted: 22 May 2025 / Published: 24 May 2025
(This article belongs to the Section Life Sciences)

Abstract

:
Aging often leads to a decline in intersegmental coordination, particularly in the lower limbs, which can negatively impact gait stability and symmetry. While fear of falling (FoF) and a history of falls (HoF) increase fall risk in older adults, their relationship with intra- and intersegmental coordination during gait remains understudied. This cross-sectional observational study involved 60 participants aged 60 and older. The three-dimensional range of motion of lower limb joints during gait was assessed using an optoelectronic system. Intra- and intersegmental coordination were evaluated via the Continuous Relative Phase (CRP) variable, including its mean, standard deviation, and coefficient of variation. The results showed that the HoF and FoF groups had higher mean CRP values in the left hip-knee (HOF, p = 0.004) and hip-ankle (FOF, p = 0.030) in the sagittal plane, as well as higher standard deviation values in the left knee-ankle (HOF, p = 0.006) and right hip-ankle (HOF, p = 0.004). Inter-segmental coordination differences were also observed, with higher mean CRP values between the knee joints in the sagittal plane (HOF, p = 0.046) and lower mean and standard deviation values between the ankle joints (FOF, p = 0.048 and p = 0.038, respectively). This study concludes that fear of falling and history of falling are significantly associated with altered intra- and intersegmental coordination in older adults, which may contribute to fall risk. Understanding these altered coordination patterns is crucial, as it underscores the therapeutic significance of targeting these changes, which could lead to interventions aimed at improving gait stability and reducing fall risk in elderly individuals.

1. Introduction

Aging has been linked to several changes in gait control, a topic widely discussed in recent years. Even under healthy circumstances, aging has been associated with spatio-temporal, kinematic, and kinetic changes in gait [1,2,3]. Compared with young healthy adults, previous studies have demonstrated that older adults tend to exhibit a diminished range of joint motion, particularly in the hip, knee, and ankle joints [1,2]. For instance, Noble & Prentice [1] showed that during walking on inclined surfaces, older adults have reduced hip and knee movement, limiting their adaptability to environmental demands. Similarly, Ogaya et al. [2] linked decreased coordination between lower limb joints with slower gait speeds in elderly women, increasing fall risk. A systematic review by Aboutorabi et al. [4] further highlighted that these reductions in joint range of motion lead to shorter step length, reduced cadence, and wider step width. Herssens et al. [5] reported increased gait variability across the lifespan, which, combined with decreased joint mobility, negatively affects balance control. Such changes compromise dynamic stability and limit the ability to recover from disruptions during walking, thereby heightening the risk of falls [6,7]. Additionally, reduced trunk mobility and weakened musculoskeletal support [7] further exacerbate these effects, contributing to a cautious gait pattern adopted by older adults to mitigate fall risk. Accordingly, to compensate for these age-related impairments, elderly individuals tend to adopt protective gait strategies, such as walking with a wider base or raising their feet less during the swing phase—frequently resulting in a shuffling walk [3].
Gait has been recognized as a sensitive and reliable indicator of overall health status and is closely linked to life expectancy among older adults [3]. Consequently, gait abnormalities may negatively impact social interaction, the sense of well-being, independence/autonomy, and overall quality of life [3]. Moreover, walking difficulties can also be a precursor to falls, which are the leading cause of serious injuries in older adults [3]. According to the World Health Organization (WHO) statistics, approximately 28 to 35% of the community-dwelling population aged 65 and older experience at least one fall per year. For people over 70 years, the frequency of falls increases, reaching 32–42% [8].
Considering falls, it should be kept in mind that the fear of falling should not be understated [9]. This fear is a prevalent concern among older adults, prompting gait modifications aimed to enhance stability [8,9]. Although these adaptations can be protective, fear of falling may paradoxically increase fall risk by triggering maladaptive changes in balance control, reduced self-confidence in the ability to prevent or manage falls, and avoidance of activities crucial for maintaining mobility and overall well-being [8,9]. Clinically, Chen et al. [10] define fear of falling as a sense of concern regarding fall-related dangers that impedes one’s participation in daily activities. It has been estimated that the fear of falling prevalence in older individuals approaches 90% among fallers compared to 65% among non-fallers [9]. Moreover, as stated by Gazibara et al. [9], fear of falling may even predict the occurrence of future falls.
Intersegmental coordination, which relies on the integrity of the sensorimotor system has also been shown to deteriorate with age [2]. Research indicates that both intersegmental coordination patterns and variability are influenced by gait speed, with older adults displaying less stability compared to younger individuals [11,12,13].
The concept of intersegmental coordination has been explored extensively in neurophysiological research [14,15,16,17]. These studies support the notion that intersegmental coordination arises from muscle synergies activation rather than isolated muscle actions. As Israeli-Korn et al. [18] suggest, these synergies help explain not only the generation of movement, but also how the several muscles that compose them, along with the nervous system, may be involved in creating several other kinematic synergies as well as well-coordinated movements across various tasks and contexts.
To quantify and characterize intersegmental coordination, numerous studies [11,12,19] have used Continuous Relative Phase (CRP) [2,20]. CRP is a valuable clinical tool for assessing the overall profile of coordination, as it can provide a continuous measurement to clarify the phase difference in two segmental motions explaining gait asymmetry [2]. Calculated through the inverse tangents of the ratio between angle and angular velocity, CRP has been validated as a reliable measure, demonstrating sensitivity to age-related changes and external factors in older adults [2,12,18,21].
A study by Hafer & Boyer [13] used CRP to investigate age-related changes in lower limb coordination during gait, finding significant differences in both segment coordination and its variability between younger and old participants, suggesting the use of different gait strategies. Similarly, Ippersiel et al. [12] found that older adults displayed greater differences in the coordination, even when walking on uneven surfaces. In a study, Salehi et al. [21] examined lower extremity intersegmental coordination during gait among multiple sclerosis patients and healthy controls with and without fall history. As well as showing that fallers and non-fallers had different intersegmental coordination patterns, the coordination variability between proximal segments appeared excessive in multiple sclerosis fallers, possibly indicating an increased risk of falling.
Furthermore, Chiu & Chou [22] explored inter-joint coordination variability in healthy and fall-prone older adults during gait analysis, as well as its correlations with three commonly used clinical balance measures (Berg Balance Test (BBS), Dynamic Gait Index (DGI), and Time Up-and-Go (TUG)). They found that poor performance on clinical balance tests might be indicative of decreased inter-joint coordination during walking. Nevertheless, to the best of our knowledge, no study has yet explored the association between the intra- and intersegmental coordination of the lower limbs during gait, assessed through CRP, and the fear and falling history.
Therefore, the present study aims to examine the relationship between the former and the latter, with the goal of contributing new insights to the understanding of fall risk and the strategies adopt among older adults. We hypothesize that older adults with poorer intra- and intersegmental coordination during gait, as reflected by higher CRP values, will have a significantly greater likelihood of having fallen in the last 12 months.

2. Materials and Methods

2.1. Study Design, Participants, and Study Criteria

This study followed the Strengthening the Reporting of Observational Studies in Epidemiology (STROBE) guidelines [23] and employed an observational, cross-sectional design with a quantitative methodology to explore the relationship between lower limb intra- and intersegmental coordination during gait, and the fear of falling and fall history in older adults.
Sample selection was conducted on a non-probabilistic basis, via convenience and voluntary participation on behalf of the target population. This study took place in the Centre for Rehabilitation Research (CIR) laboratory based at the School of Health. Community-dwelling older adults, aged 60 and older, of both sexes (38 females and 22 males), and capable of performing tasks (gait, sit-to-stand, climb and descend stairs, etc.) independently were eligible. Exclusion criteria included the presence or history of severe clinical conditions affecting the cardiorespiratory, musculoskeletal, or neurological systems, as well as any other severe condition or impairment that could impair task execution or affect gait patterns, including uncorrectable visual impairment, vestibular dysfunction, dementia, or depression.
Approval for this study was obtained from the ethics committees of the School of Health—Polytechnic Institute of Porto (CE0064C). All participants provided written informed consent before data collection, in accordance with the Declaration of Helsinki. Confidentiality and anonymity were ensured, and participants were informed of their right to withdraw from the study at any point without consequence.

2.2. Instruments and Procedures

As part of the participant selection and characterization process, an “Assessment and Characterization Questionnaire (ACQ)” was administered. This included several questions designed to screen participants for eligibility, such as whether they had any serious clinical conditions that could compromise task performance. It also served to categorize participants according to their history and fear of falling through two dichotomous “Yes or No” questions: “Have you fallen in the last 12 months?” followed by “Are you afraid of falling?”. Additional demographic data such as age, gender, weight, and height were also collected.
To further assess eligibility, the Portuguese version of the Mini-Mental State Examination (MMSE) was administered. This brief, quantitative tool assesses seven areas of cognitive functioning and is widely used to detect cognitive impairment and dementia in older adults, showing a strong test-retest reliability (0.80–0.95) [24,25].
Data collection was conducted in a controlled clinical environment at the School of Health’s Centre for Rehabilitation Research (CIR) laboratory. All procedures were carried out by an experienced physiotherapist. Initial assessments included the measurement of vital signs to ensure participants’ safety, followed by the collection of demographic and anthropometric data. Additionally, body composition was assessed using a bioelectrical impedance analysis device [26] (Tanita InnerScan BC-601, Tanita Europe B.V., Hoogoorddreef 56E; 1101 BE; Amsterdam; The Netherlands).
To collect both kinematics and kinetics data simultaneously, the Qualisys Track Manager system (Qualisys AB®, Göteborg, Sweden) was used. Following a full body marker setup previously used in research, a series of markers were placed on anatomical landmarks [27]. Their trajectories were captured by ten optoelectronic cameras (eight Oquos500, two MiqusM3, Göteborg; Sweden) and one Miqus video camera. Two force plates (FP4060-08/10, Bertec®; Columbus, Ohio, USA) provided information to define the gait events.
To determine CRP differences and, simultaneously, the intra- and intersegmental coordination, participants were asked to perform a 10-m overground walk on a straight and flat surface, at a self-selected, comfortable speed, while wearing their usual footwear [28,29]. To ensure a natural gait pattern, participants completed sufficient practice trials before data collection [28,29]. For analysis, five successful trials, where the participants stepped correctly on a force plate, were recorded allowing the previously calibrated optoelectronic system and the markers setup to access kinematics variables [29].

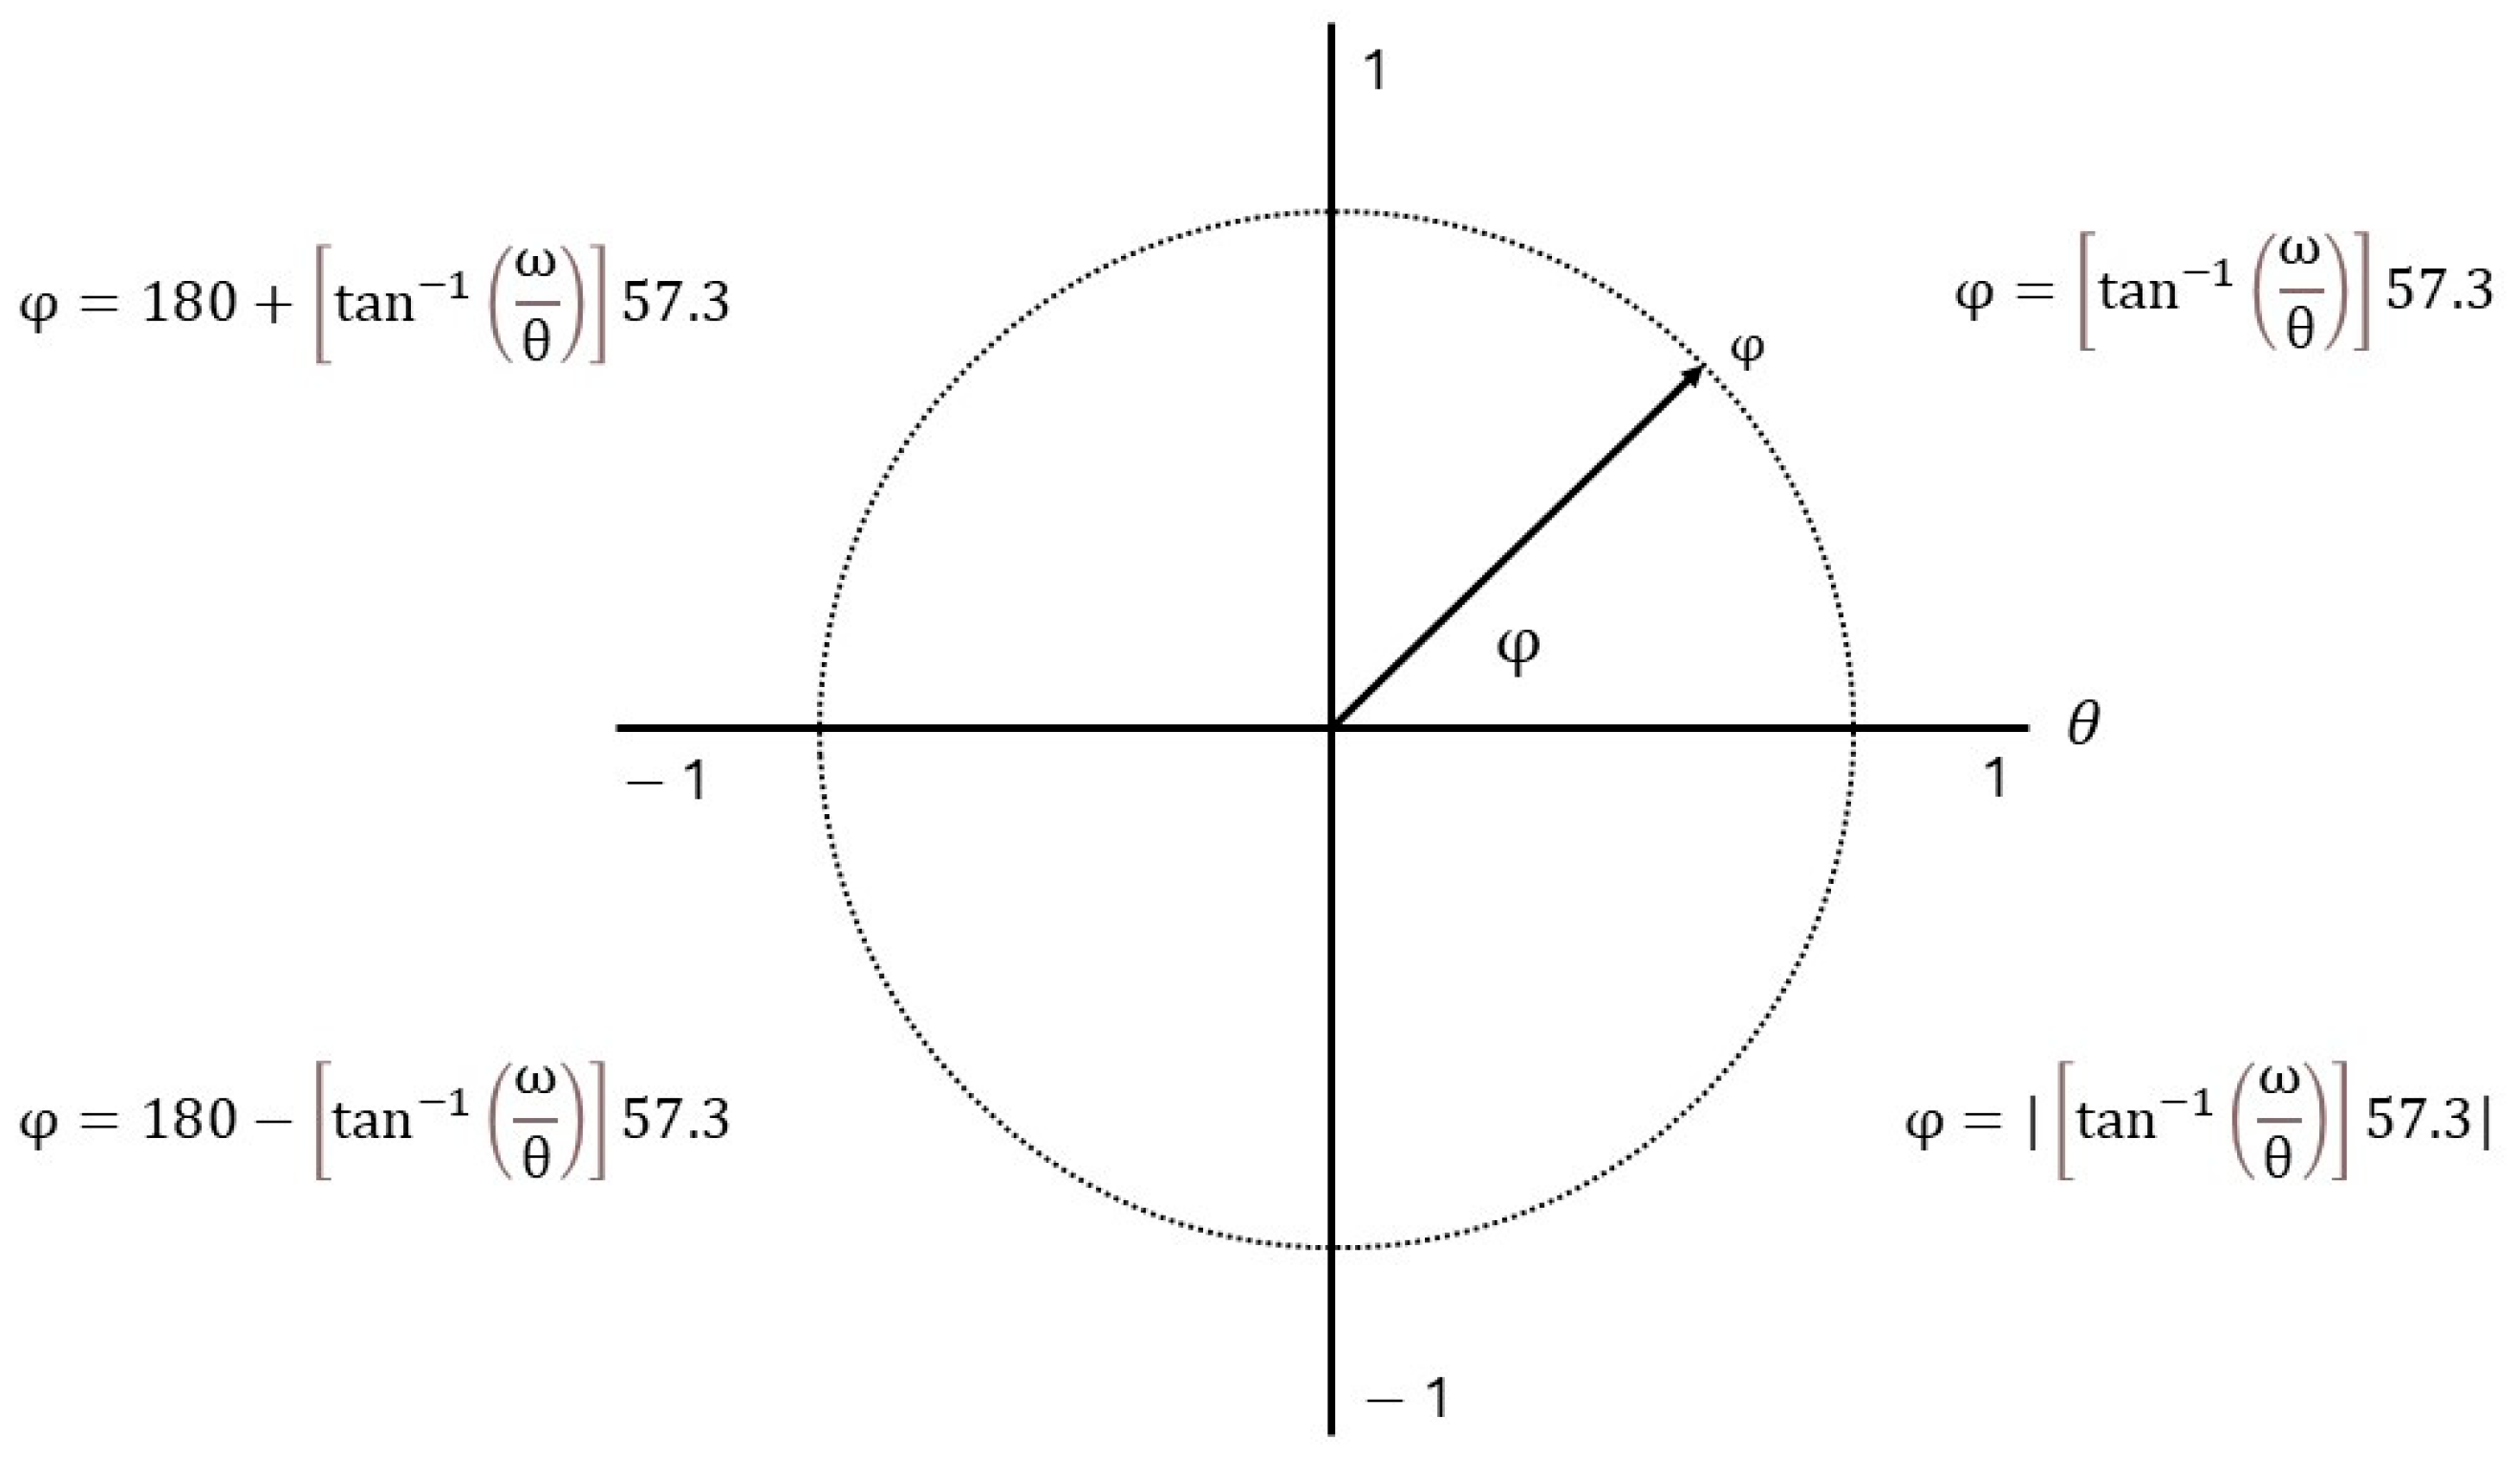
2.3. Data Processing

Kinematic data were processed using the Qualisys Track Manager software version 2020.3 (Qualisys AB®, Sweden) and the Visual3D Professional Software version 6 (Has-Motion, Inc., Kingston, Ontario, Canada). CRP values were accessed using Microsoft Excel (Excel®, USA).
As previously described, the present study used CRP to quantify coordination within and between lower limb segments. This approach allowed for continuous analysis of the coordinative relationships between adjacent segments throughout the gait cycle [21].
Segment angles for the hip, knee, and ankle were calculated in the sagittal, frontal, and transverse planes using the Euler method [30], and interpolated to 100 points per stride. Segments angular velocities were then derived using the Cardan X–Y–Z sequence [30]. To generate a phase portrait for each segment, angular positions and velocities were plotted on the X- and Y-axes, respectively [21]. To minimize the influence of differing movement amplitudes and frequencies, angular position and velocity values were normalized between −1 and 1 using the following equations [31]:
θ i . norm = 2 × θ i min θ i max θ i min θ i 1 , i = 1   100
ω i . norm = ω i max ω i , i = 1   100
where θi and ωi are, respectively, the angular position and velocity for each of 100 interpolated data points during a complete gait cycle.
Afterwards, based on Hamill et al. [31], phase angles were defined as the angle between the right horizontal and a line drawn from the origin to a particular data point (θ, ω). According to the following equation, phase angles were calculated for each data point throughout the gait cycle, noting that the results ranged between 0 and 180° (Figure 1):
φ i = tan 1 ω i . n o r m θ i . n o r m
Lastly, the CRP, which represents how the movements of two interacting segments are coupled while performing a task, was defined as the absolute value of the difference between the proximal and distal segment phase angles at each point throughout the entire gait cycle [2,32]:
C R P i = φ i . P j φ i . D j
where φPj consists in the phase angle of the proximal joint and φDj the phase angle of the distal joint [32]. CRPs were calculated for hip and knee flexion/extension, abduction/adduction, and internal/external rotation, as well as for knee and ankle flexion/extension, abduction/adduction, and internal/external rotation, and for hip and ankle flexion/extension, adduction/abduction, and internal/external rotation.
As described in several studies [2,31,32], a CRP value closer to 0° depicts a more “in-phase” movement, which means that the two segments move in a similar way, corresponding to a simultaneous contraction of bilateral homologous muscle groups [33]. As the CRP value increase, the two segments behave in a less similar way becoming more “out-of-phase” [2,31]. As a result, a value of 180° would indicate an “anti-phase” coupling, which denotes that the two segments move in opposite way where the homologous muscle groups are activated alternatively [2,31,33].
As part of assessing the phasing relationship between the two interacting segments movements, the mean absolute Continuous Relative Phase was determined [21,34]. To achieve this, the mean of absolute values of all data points over the mean ensemble CRP curve was calculated over the gait cycle [21,34]. A low value indicates a more “in-phase” relationship between the two coupling segments whereas a high value depicts a more “out-of-phase” relationship [32]. Additionally, by averaging the standard deviations of the CRP curves, the deviation phase (DP) was calculated to quantify the coordination variability [21,32]. Higher values reflect greater coordination variability, indicating a less consistent relationship between the two oscillating segments, whereas lower values suggest a more stable inter-segment coordination pattern, representing reduced variability and a more consistent interaction among the segments [20,21,32]. Moreover, to access the variability or dispersion degree in our data, the coefficient of variation (CV) was calculated, defined as the ratio of the standard deviation (SD) to the mean [35].

2.4. Statistical Analysis

The sample size was determined using the G*Power 3.1.9.7 software, following the approach outlined in Saheli et al. [21], which reported a statistical power of 0.90, a significance level of 0.05, and an estimated effect size of 0.8396641. This calculation led to a required sample size of 25 participants per group with a total of 50 participants. Considering that the prevalence of falls in individuals aged 65 and over ranges from 28% to 35% (WHO), studies on falls in this population can accommodate groups with unequal sample sizes, provided that approximately 28 to 35% of participants has history of falling (HoF). Notably, the FoF group consisted of only 19 participants, which fell short of the initially calculated sample size, potentially affecting statistical power. While the broader sample aligns with prior research standards, further examination of the power calculation specific to the FoF group is recommended to confirm adequacy.
Statistical analysis was performed using IBM® SPSS Statistics, version 28.0 software (IBM Corporation, Armonk, NY, USA), with the level of significance set at 0.05. Descriptive statistics were used to characterize the sample, with quantitative variables presented as mean ± standard deviation and nominal variables (e.g., gender, health condition) as absolute and relative frequencies.
The Kolmogorov–Smirnov’s test was used to access data normality distribution. Variables that deviated from normality and had severe outliers were computed using the Log transformation (Lg10() function), often used to reduce the skewness of a measurement variable [36].
To assess the main effects of each group (the fear and falling history) and their interactions on lower-limb inter- and intrasegmental coordination, a mixed-design MANOVA was conducted. The HoF and FoF were used as fixed factors, with kinematic parameters as dependent variables. The MANOVA test was carried out in conformity with its assumptions verified through multivariate normality, equal variance, and the absence of multivariate outliers. Additionally, interactions between HoF, FoF, and participant characteristics were analyzed using Pearson’s chi-square and Fisher’s exact tests, as appropriate.

3. Results

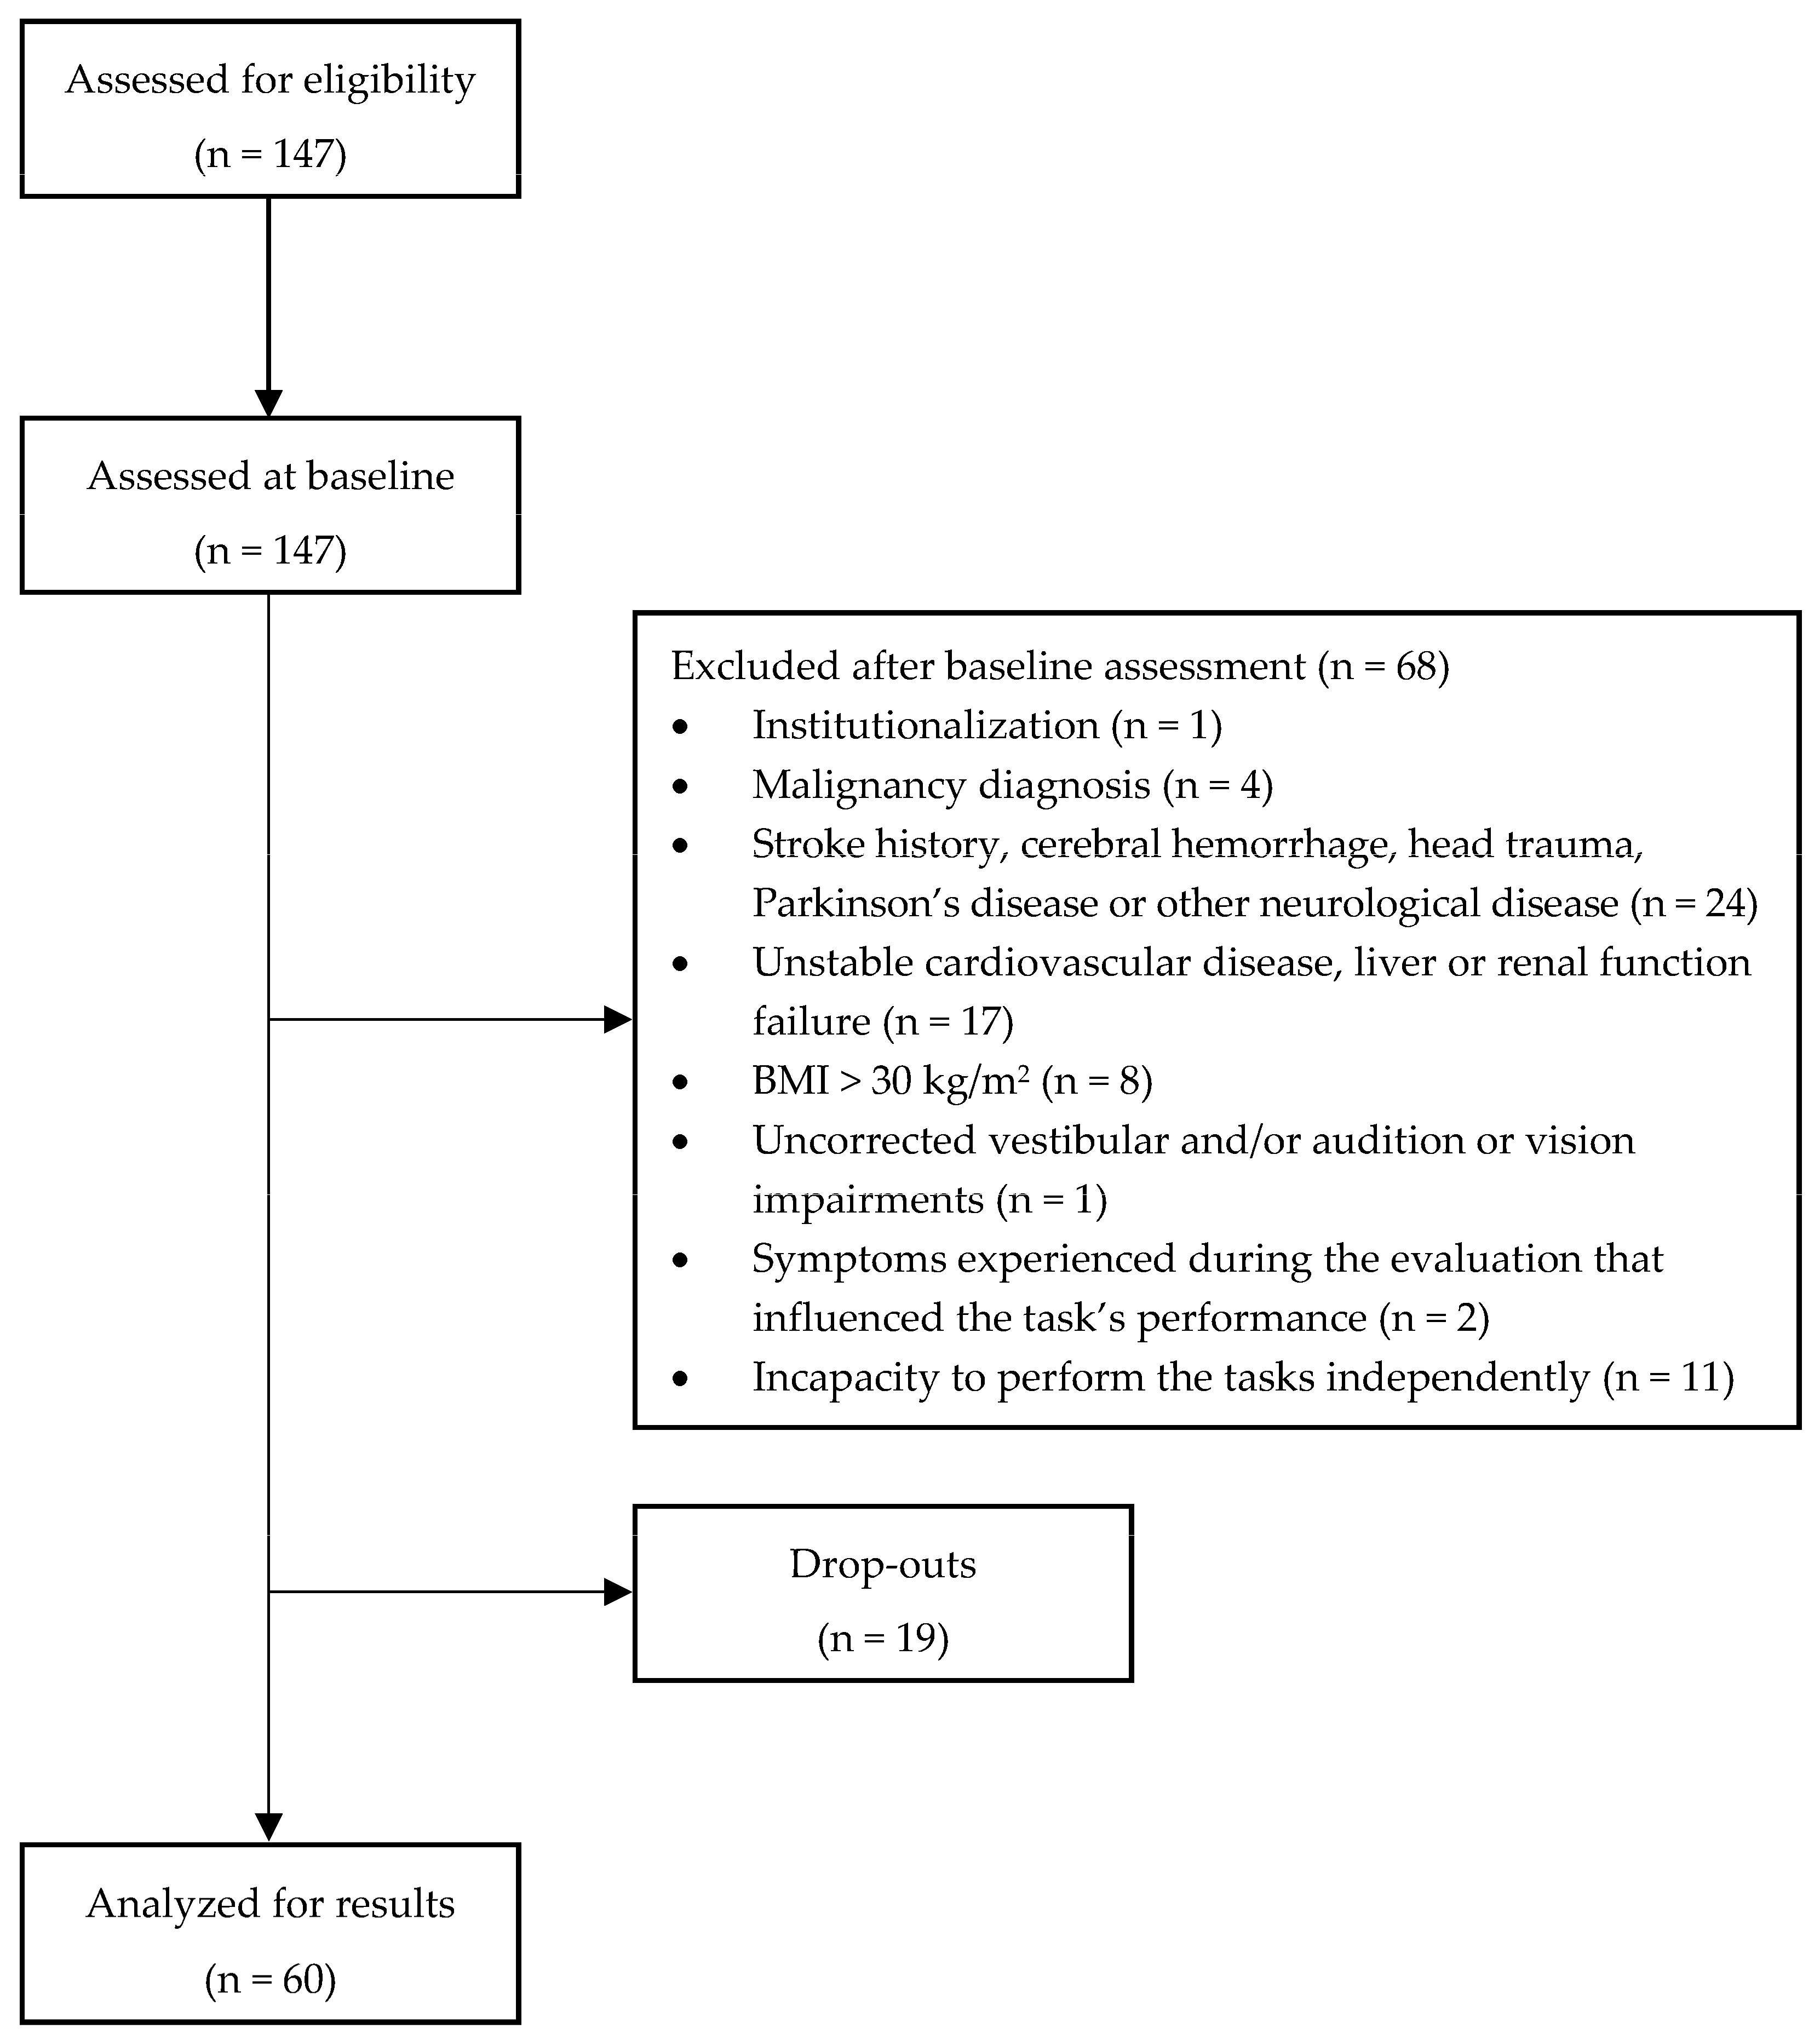
3.1. Sample Selection and Characterization

Initially, a total of one hundred and forty-seven community-dwelling older adults were referred for possible inclusion in the study. Sixty-eight participants were later excluded after the baseline assessment for presenting severe cardiorespiratory, musculoskeletal, and/or neurological clinical conditions and impairments that interfered with their ability to perform the tasks. Additionally, nineteen participants dropped out of the study, leaving 60 elders to take part of the sample (Figure 2).
As summarized in Table 1, there were no statistically significant differences in terms of age, gender, height, and weight distribution, as well as on health conditions and number of health conditions parameters. There was, however, a significantly higher BMI (Body Mass Index) among individuals with FoF (p = 0.037). In addition, a higher number of prescribed medications was also found among older adults with HoF compared to those without HoF (p = 0.018).

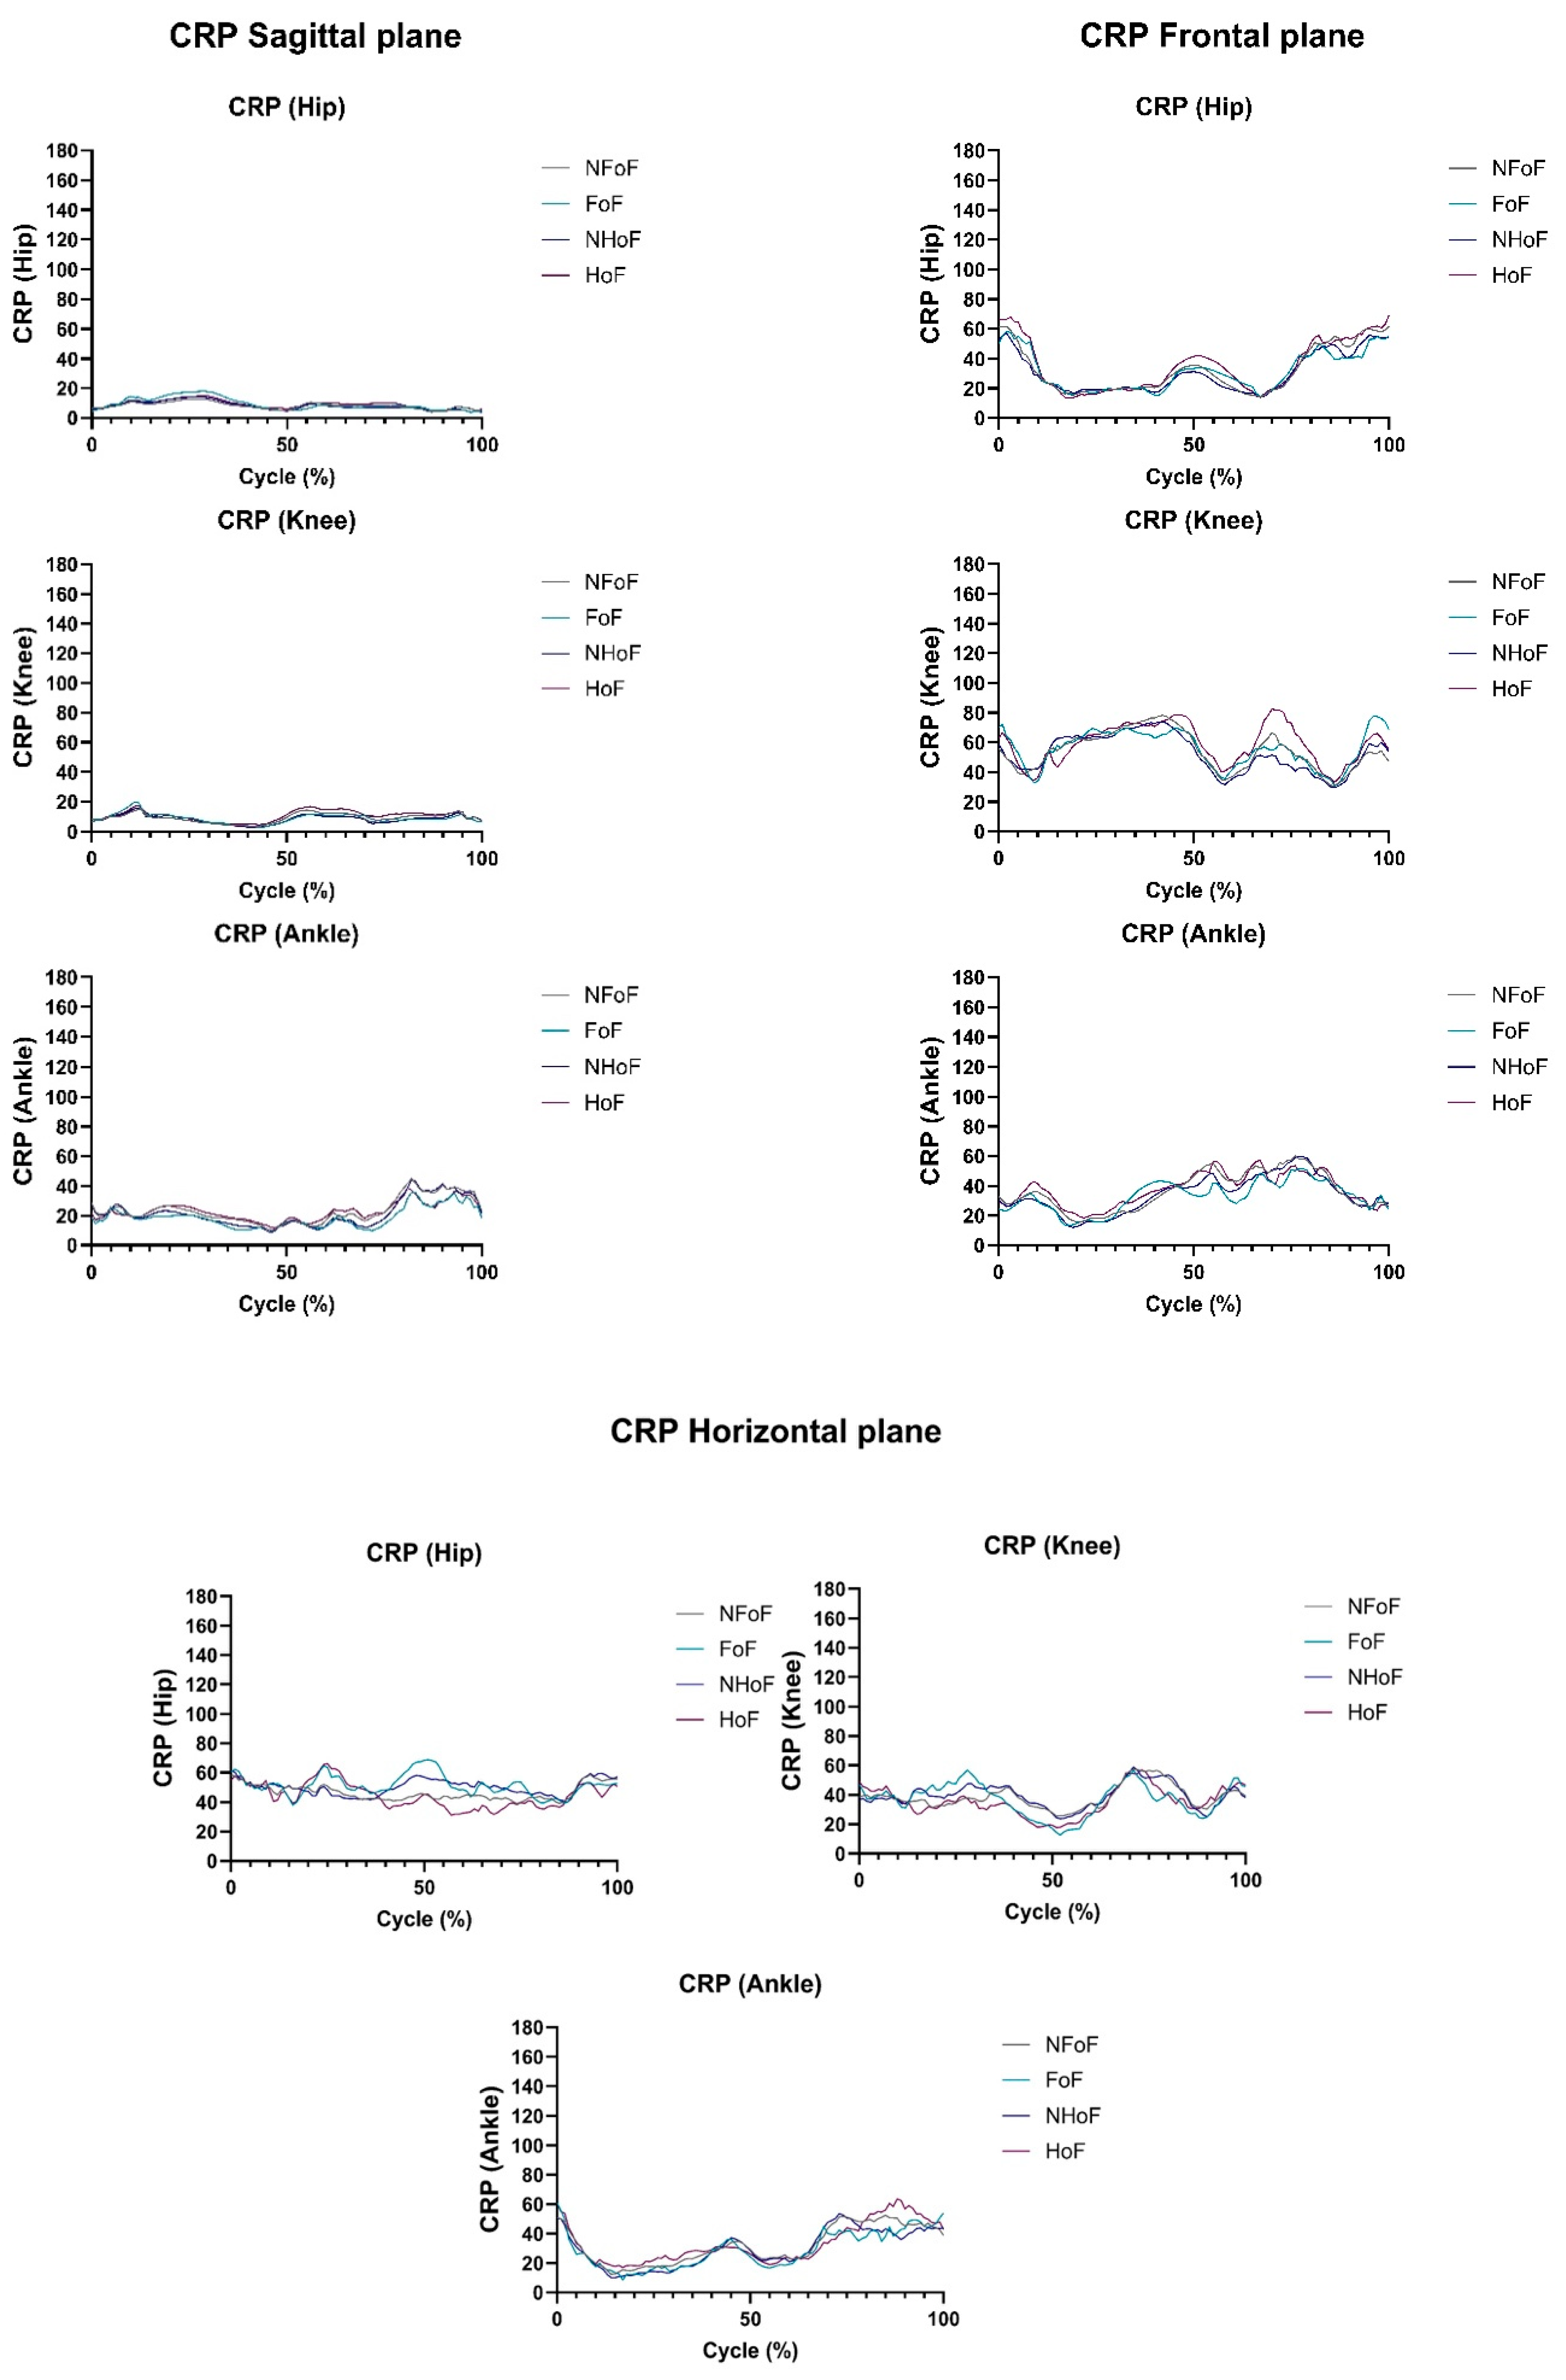
3.2. Intrasegmental Coordination During Gait Measured by CRP

Intrasegmental coordination related values for the right and left limbs of FoF and HoF groups are clearly summarized in Table 2. Statistically significant main effects were found over CRP-related variables in these groups. Specifically, on the sagittal plane, the HoF group exhibited significantly greater CRP mean values for left hip-knee coordination and greater CRP standard deviation values for knee-ankle and hip-ankle on both the left and right limbs. Also, on the same plane, the HoF group was found to have a significantly smaller hip-knee CRP coefficient of variation (CV) than elders without HoF. Similarly, the FoF group displayed significantly higher CRP mean values for left hip-ankle coordination and greater CRP coefficient of variation for left knee-ankle coordination, on the sagittal plane, as well as differences in right knee-ankle CRP values, on the horizontal plane.
In addition, significant interactions were observed between the HoF and FoF groups in in several joint pairings, particularly in the sagittal plane.
Figure 3 illustrates the intrasegmental mean CRP values across the gait cycle for all different groups (NFoF, FoF, NHoF, and HoF) in the various planes, visually confirming the previously stated results, highlighting greater differences between the groups in the frontal and horizontal planes.

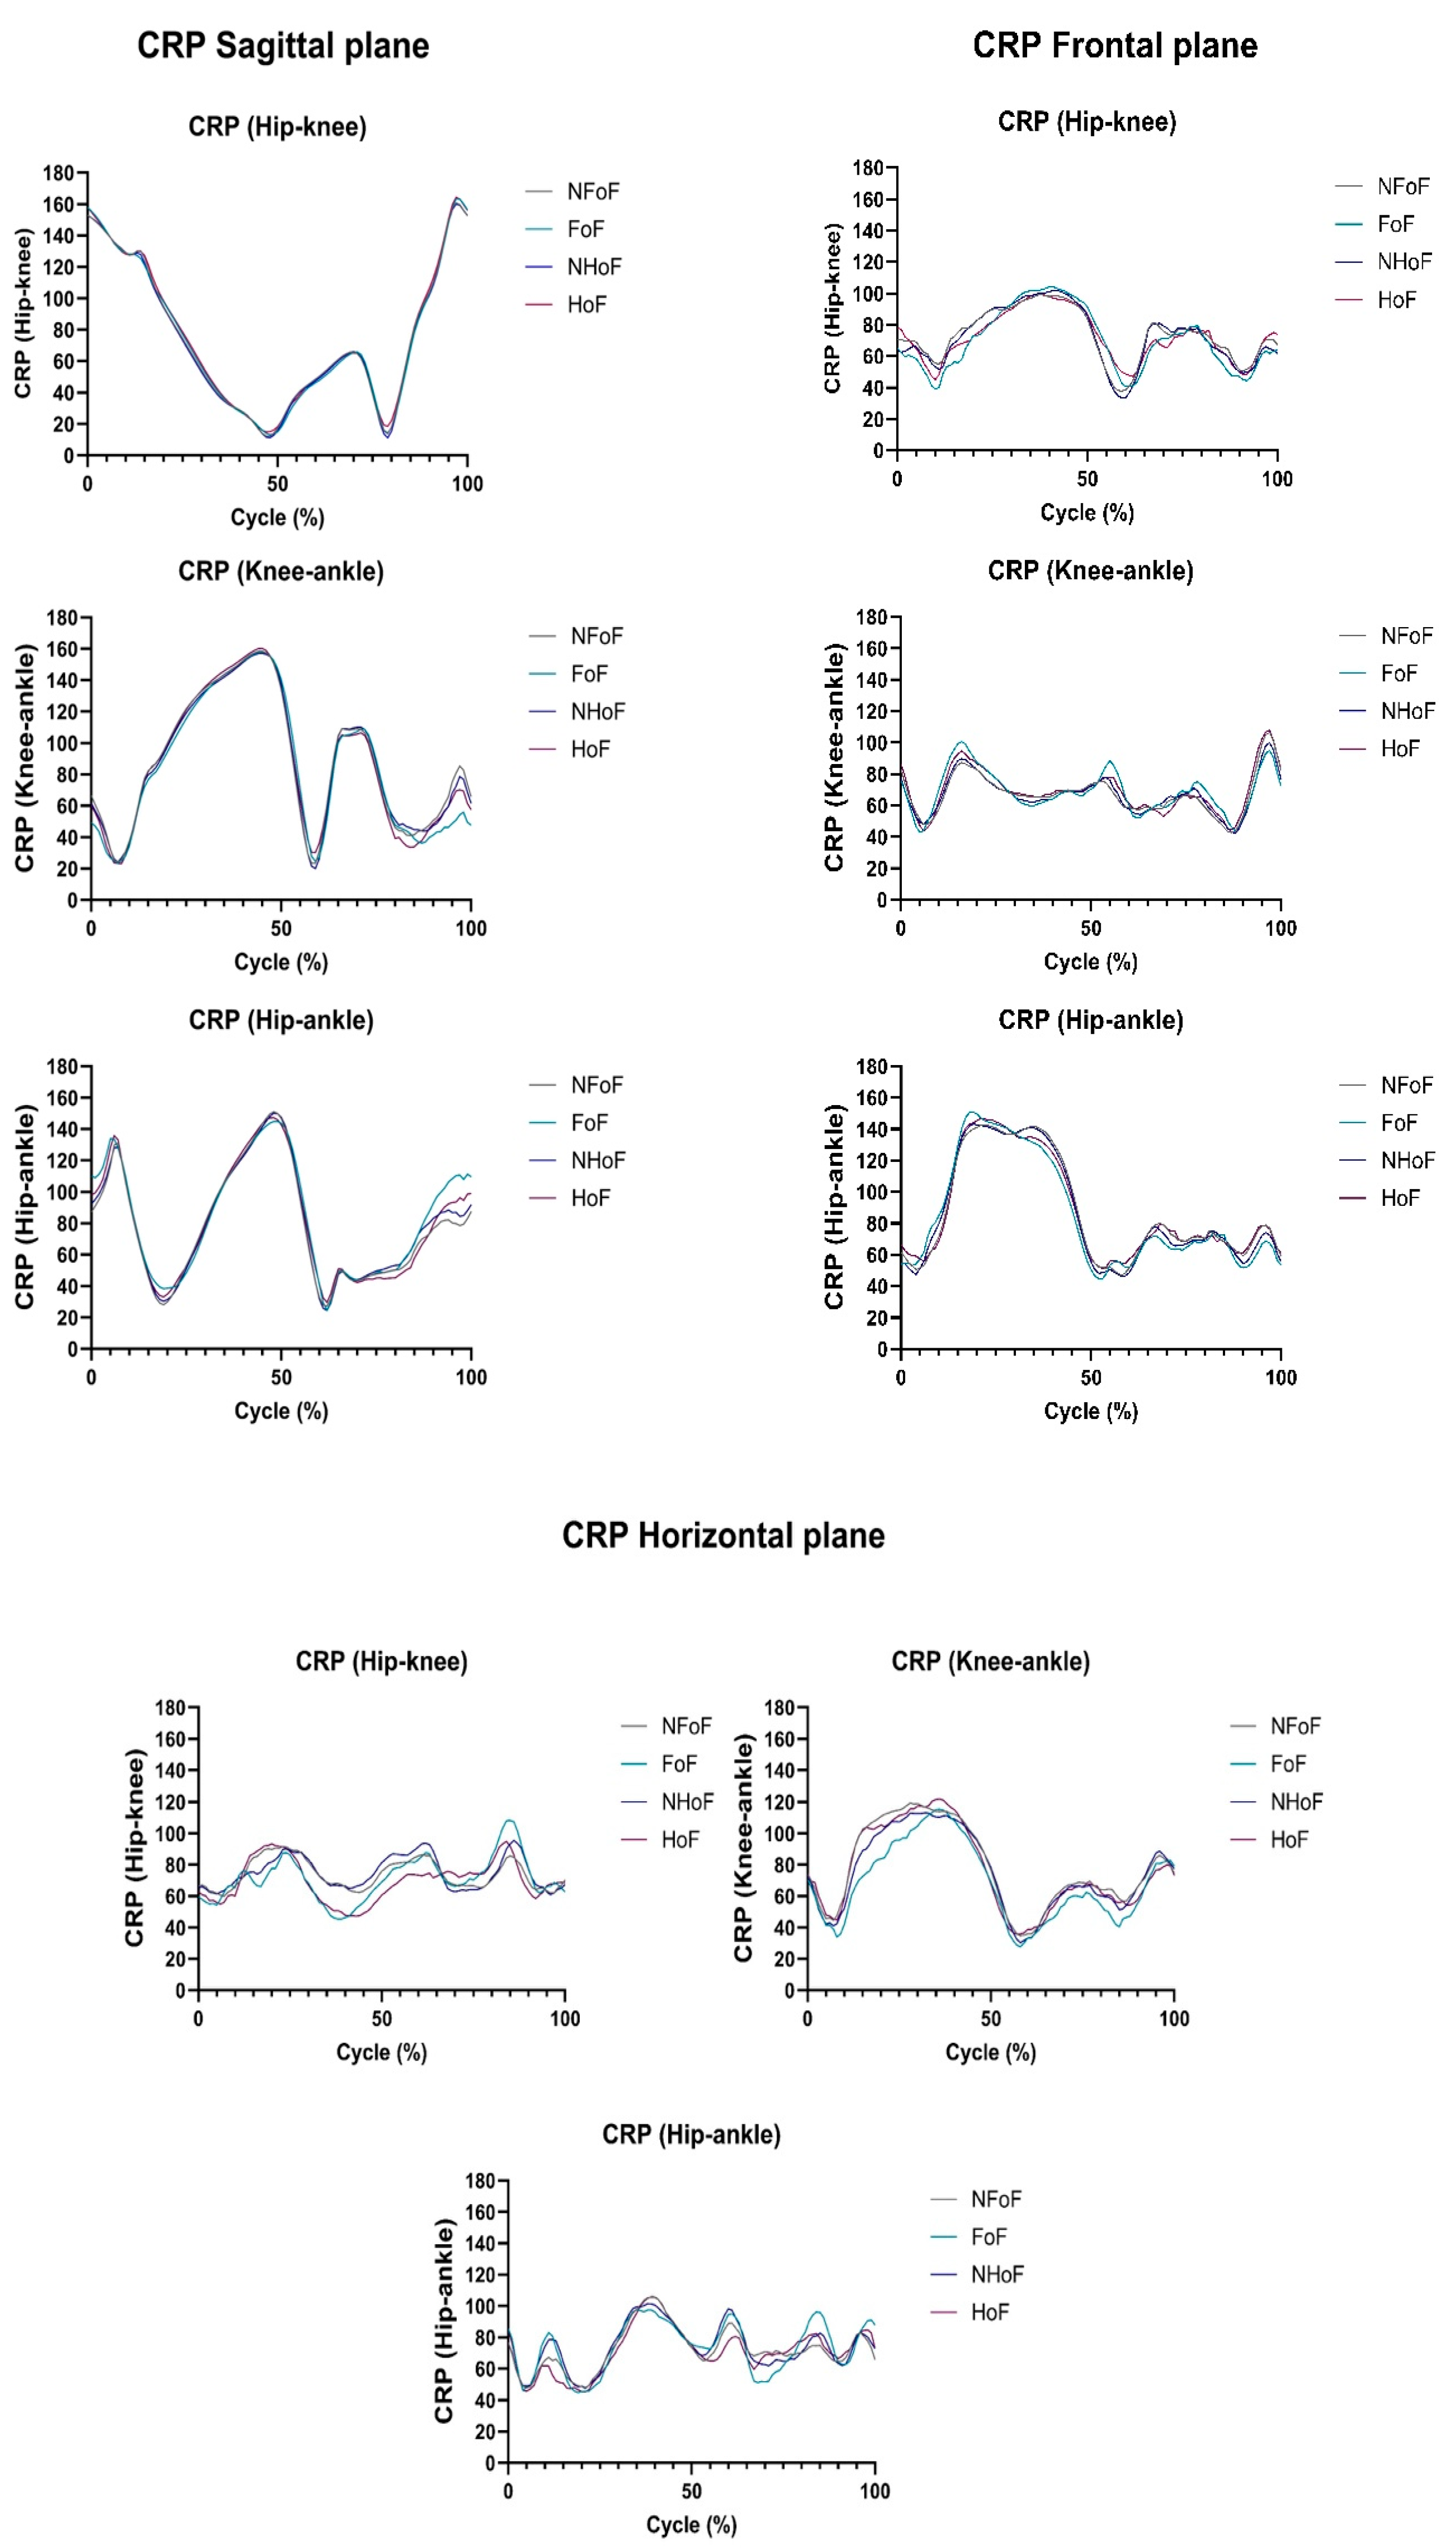
3.3. Intersegmental Coordination During Gait Measured by CRP

The intersegmental coordination between each joint of FoF and HoF groups is presented in Table 3. No significant group differences were detected for the hip joint, nevertheless, the HoF group showed significantly greater CRP mean values between the knee joints for the sagittal plane when compared to elders without HoF (p = 0.046). Further, for the same plane, on the FoF group, the CRP mean values and CRP standard deviation values between the ankle joints were found to be significantly smaller than those without FoF (p = 0.048 and p = 0.038, respectively). Conversely, the Figure 4, that shows the intersegmental mean CRP values for the different groups across the gait cycle in the various planes, demonstrates greater differences among the different groups on the frontal and horizontal planes.

4. Discussion

The present study provided important insights into the relationship between fear of falling (FoF) and fall history (HoF) and lower limb intra- and intersegmental coordination in older individuals. Based on our hypothesis, we anticipated that older adults with impaired coordination and higher CRP would exhibit a greater likelihood of having fallen in the past 12 months. The results partially supported this hypothesis, as the HoF group showed significant differences in intra- and intersegmental coordination compared to non-fallers, particularly in the frontal and horizontal planes. However, while we did find expected differences in coordination and CRP, the associations were not as strong or consistent as initially anticipated, suggesting that factors beyond coordination and CRP might also play a crucial role in fall risk.
Based on our results, participants exhibited no statistically significant differences regarding the age, gender, height and weight, health conditions, and number of health conditions. Nevertheless, as corroborated by the present study, previous literature [37,38] has reported that older adults with a significantly greater BMI experience greater restrictions in performing daily activities due to a higher FoF. These individuals also exhibit lower confidence and reduced functional mobility compared to those with a normal BMI. Furthermore, has stated in Montero-Odasso et al. [39] and Yoshida et al. [40] reports, the use of multiple medications, especially those identified as fall risk–increasing drugs (FRID’s), has been found to be one of the main risk factors for falls in community-dwelling older adults. Accordingly, our study findings also found that older adults with HoF presented a higher number of prescribed medications than those without HoF. These results suggest that both higher BMI and polypharmacy contribute to an increased fall risk, potentially by influencing balance, mobility, and confidence in performing daily tasks.
Concerning the kinematic parameters, specifically intrasegmental coordination, statistically significant main results were found in FoF and HoF groups with respect to CRP related variables. Our results showed that, compared to older individuals without HoF, the HoF group demonstrated, on the sagittal plane, significantly higher left hip-knee mean CRP values throughout the gait cycle, exhibiting a more “out-of-phase” relationship between the two coupling segments [32]. This altered coordination pattern suggests reduced neuromuscular control and synchronization between the hip and knee, which could impair stability during gait [32,41]. According to Ebrahimi et al. [32], such “out-of-phase” coordination reflects compensatory mechanisms aimed at managing joint instability but often results in less efficient movement strategies. Consequently, these altered patterns may contribute to higher fall risk in this group by sacrificing fluidity and adaptability during gait [32,41].
Additionally, the significantly smaller left hip-knee CRP coefficient of variation values suggest that the HoF group exhibited less variability in their coordination patterns, meaning their movements were more predictable or consistent compared to older adults without a history of falling [41,42]. Essentially, despite having a more consistent coordination (smaller coefficient of variation) in their movement patterns, the HoF group’s coordination was altered (“out of phase”), suggesting they had developed a more consistent yet less “normal” way of walking [41,42]. The HoF group also displayed notably higher standard deviation values for the left knee-ankle and the right hip-ankle compared to older adults without HoF, indicating greater coordination variability and a less consistent coordinative relationship between these oscillating segments [20,21,32]. This inconsistency could reflect impaired neuromuscular control, potentially disrupting balance during dynamic tasks [32,41,42].
Likewise, on the sagittal plane, the FoF group demonstrated significantly higher left hip-ankle CRP mean values, indicating a more “out-of-phase” or altered coordination pattern between these segments [32]. This finding suggests that individuals with a fear of falling may adopt conservative gait strategies, characterized by exaggerated segmental decoupling to maintain balance, as seen in previous studies [32,41]. Additionally, this group showed greater left knee-ankle CRP coefficient of variation values, reflecting greater variability and less consistent coordination compared to individuals without FoF [32,41,42]. Greater variability often indicates instability in motor control, potentially linked to impaired proprioceptive feedback or neuromuscular inefficiencies [41,42]. Within the horizontal plane, older adults with FoF presented significantly smaller right knee-ankle CRP mean values and higher CRP coefficient of variation values. This indicates that the right knee-ankle movement in this group shows a more typical, “in-phase” coordination pattern (lower mean CRP), but with less consistency/greater variability in that coordination (higher coefficient of variation) [32,41,42]. According to Sadeghi et al. [41] and Silva et al. [42], this variability may reflect a lack of stability and increased reliance on reactive adjustments to maintain balance, further underscoring the fall risk in this population. This inconsistent coordination in the horizontal plane could result in reduced adaptability during turning or side-stepping, critical movements in avoiding falls [41,42].
Furthermore, our research revealed interactions between the HoF and FoF groups. On the sagittal plane, the FoF group demonstrated increased coefficient of variation in the left hip-knee relationship, reflecting greater variability, whereas, in the right hip-knee, the FoF group showed a lower standard deviation, suggesting a smaller coordination variability and more stable intra-segment coordination pattern as compared to the HoF group [20,21,32,41,42]. Still on the same plane, the FoF group exhibited both higher coefficient of variation and standard deviation in the right knee-ankle, demonstrating greater variability and a less consistent coordinative relationship between the two oscillating segments [32,41,42]. Within the frontal and horizontal planes it was observed that the FoF group showed greater coefficient of variation in the left knee-ankle and a smaller standard deviation in the right knee-ankle, indicating greater variability on the left and smaller variability on the right side compared to the HoF group [20,32,41,42].
In relation to intersegmental coordination between each joint, our findings showed no significant group differences for the hip joint. Regardless, on the sagittal plane, the HoF group showed significantly higher mean values for the knee joints, indicating a more “out-of-phase” coordination pattern when compared to elders without HoF [32]. In contrast, the FoF group exhibited lower mean and standard deviation values between the ankle joints, suggesting a more “in-phase” and smaller variability coordination pattern than those without FoF [20,32].
Considering our findings and as noted by Salehi et al. [21] and Chiu and Chou [22] studies, a certain level of variability is required for adapting to new movement patterns; however, reduced variability may suggest a lack of flexibility, while excessive coordination variability among interacting segments could signal a declined motor control, thereby increasing the risk of falling.
In line with our results, Chiu & Chou [22] also reported differences in hip-knee inter-joint coordination variability between older adults with and without a history of falls, attributing these variations to differences in walking speed. As previously mentioned, several studies have shown that older adults typically experience a decline in gait speed [1,2,4,5,6,7]. Although walking speed was not directly assessed in this study, it is important to recognize that, in accordance with previous research [11,32], slower gait velocity has a significantly impact on coordination. A reduced walking speed presents greater demands for the motor control system, requiring additional neuromuscular effort to maintain dynamic balance during slower ambulation [11]. Additionally, it is important to mention that a reduction in walking speed was linked to a 7% increase in falling risk [3].
Scientific evidence indicates that proximal joints play a key role in maintaining dynamic balance and modulating walking speeds [11,21,22,32]. Moreover, proper coordination among distal segments is equally important for ensuring foot trajectory and safety during walking [11,21,22,32]. Therefore, still in accordance with our outcomes, Chiu & Chou [22] also reported greater variability in the knee-ankle coordination among older adults with HoF when compared to those without HoF. Given that HoF is a significant risk factor for developing FoF [10], our results regarding the FoF group can be similarly explained. As mentioned previously, a more “in-phase” coordination pattern was observed along the FoF group in knee-ankle on the horizontal plane. According to Salehi et al. [21], “in-phase” coordination patterns require less neuromuscular effort than “out-of-phase” coordination, therefore, the “in-phase” coordination observed between the knee and ankle segments may display an adaptive strategy selected by the motor control system to better control gait function.
Chiu & Chou [22] further examined the coordination variability during both the stance and swing phase, highlighting excessive knee-ankle inter-joint coordination variability during the stance phase among elders with HoF. They suggested that this may indicate an inconsistency in neuromuscular control for weight-bearing during gait. Lower extremities have been stated to play distinct roles during gait stance and swing phases [32]. Even though the stance limb provides stable support crucial for maintaining balance and ensuring safe ambulation, most falls have been reported to occur during the swing phase, typically due to tripping of the swing foot [22,32]. In accordance with our findings, older adults with HoF have been reported to walk with diminished ankle joint motion and delayed ankle dorsiflexion during the swing phase [22], aligning with James et al.’s [43] findings that those with impaired gait and ankle coordination are more likely to have experienced falls. In dynamic balance, the swing limb must follow a trajectory that prepares it for a stable stance in the next phase, meaning that the key to prevent falls is to assure the safe placement of the swing foot [32]. In other words, safe ambulation depends on strong balance control of the stance limb and precise trajectory control of the swing limb [22,32].
Overall, as documented by Morfis & Gkaraveli [3], the changes observed in certain walking parameters may be most indicative of gait adaptations selected by the elderly, rather than being solely the result of specific age-related impairments. However, James et al. [43] stated that deterioration in the structure and function of the central nervous system is a key mechanism connecting impaired gait and interlimb coordination with an increased risk of falls. Our outcomes may, therefore, reflect compensatory strategies developed in response to previous falls or as a consequence of instability or impaired neuromuscular control, which can potentially heighten the risk of future falls due to less fluid and less adaptive movement to changes [41,42]. Alternatively, they could be interpreted as defensive mechanisms to avoid falls [8,9]. Such findings align with previous research indicating that fear of falling and falling history influences gait strategies, leading to a more cautious and potentially maladaptive walking pattern [1,2,4,5,6,7,8,9].

Strengths, Limitations, and Practical Application

A key strength of the present study is that, to our knowledge, it is the first to investigate the relationship between lower limb intra- and inter-segmental coordination during gait in older adults and their fear and falling history. Additionally, the analysis of lower limb coordination was conducted across the three different planes: sagittal, frontal, and horizontal. However, a limitation of our study is that the falling history was self-reported retrospectively, which induces the potential for recall bias. Another limitation is that this research utilized a cross-sectional design, preventing us from drawing conclusions about causality between coordination and fear and history of falling.
The practical application of the obtained results extends to clinicians, such as physiotherapists, geriatricians, and rehabilitation specialists, who can use this information to develop targeted interventions that address altered gait patterns and coordination deficits in older adults. Such interventions could play a significant role in reducing the risk of falls and enhancing mobility in individuals with a fear of falling or a history of falls. The study also provides insight into how different planes of movement may be targeted in fall prevention strategies, offering a more nuanced approach to improving balance and reducing fall-related injuries.
To deepen the understanding on our findings and to further clarify the dynamics of fall risk and coordination in this population, future research should incorporate longitudinal designs and analyze coordination patterns throughout the gait phases, as well as examine the differences between limbs.

5. Conclusions

The current study provided valuable insights into the relationship between lower limb intra- and intersegmental coordination and FoF and HoF in older adults during gait. Significant differences in coordination patterns were found among older adults with and without HoF, with the HoF group exhibiting more altered coordination strategies, such as increased hip-knee “out-of-phase” relationships and greater knee-ankle variability. Similarly, those with FoF also displayed increased coordination variability and altered segmental relationships, suggesting a more cautious yet less stable gait pattern. While these adaptations may serve as protective mechanisms to prevent falls, they may also compromise movement flexibility and fluidity, ultimately increasing the risk of future falls. Overall, this research deepens our understanding of how lower limb coordination is influenced by fear and history of falling in older adults. It highlights the clinical significance of developing tailored interventions that target these altered gait patterns. Addressing these coordination deficits could help improve balance, prevent future falls, and ultimately enhance the quality of life for older adults.

Author Contributions

Conceptualization, A.S.P.S. and J.M.; methodology, A.S.P.S. and J.M.; software, J.M.; validation, A.S.P.S. and J.M.; formal analysis, M.C.; investigation, M.C. and J.M.; resources, A.S.P.S. and J.M.; data curation, M.C.; writing—original draft preparation, M.C.; writing—review and editing, A.S.P.S. and J.M.; visualization, A.S.P.S., J.M., and M.C.; supervision, A.S.P.S. and J.M.; project administration, A.S.P.S. and J.M.; funding acquisition, A.S.P.S. and J.M. All authors have read and agreed to the published version of the manuscript.

Funding

This work was supported by the Fundação para a Ciência e Tecnologia (FCT), Portuguese Ministry of Education, Science and Innovation, NORTE 2020, and European Social Fund of European Union, grant number 2020.05356.BD (DOI 10.54499/2020.05356.BD) and through R&D Units funding (UIDB/05210/2020), Fundação para a Ciência e Tecnologia (FCT), Portugal and the European Union.

Informed Consent Statement

All participants were informed about the purpose of this study and its protocol and signed an informed consent form. This study was submitted to the Institutional Ethics Committee and received approval on the 25th of May 2022. The confidentiality was assured through the investigator assigning a code to the participant data that were available on a computer protected by a password only known to the investigator. Ethics Committee Registration Number: CE0064C.

Data Availability Statement

The data presented in this study are available on request from the corresponding author upon reasonable request due to ethical restrictions related to participant confidentiality.

Acknowledgments

The authors would like to acknowledge the Centre for Rehabilitation Research (CIR) laboratory, based at the School of Health, for providing the facilities and technical resources necessary to carry out this study. We also extend our appreciation to the staff and support personnel whose assistance contributed to the successful completion of this research.

Conflicts of Interest

The authors declare no conflicts of interest.

Abbreviations

The following abbreviations are used in this manuscript:
CRPContinuous Relative Phase
HOFHistory of Falling
FOFFear of Falling
NHOFWithout History of Falling
NFOFWithout Fear of Falling
MMean
CVCoefficient of Variation
SDStandard Deviation
BMIBody Mass Index

References

  1. Noble, J.W.; Prentice, S.D. Intersegmental coordination while walking up inclined surfaces: Age and ramp angle effects. Exp. Brain Res. 2008, 189, 249–255. [Google Scholar] [CrossRef]
  2. Ogaya, S.; Iwata, A.; Higuchi, Y.; Fuchioka, S. The association between intersegmental coordination in the lower limb and gait speed in elderly females. Gait Posture 2016, 48, 1–5. [Google Scholar] [CrossRef]
  3. Morfis, P.; Gkaraveli, M. Effects of aging on biomechanical gait parameters in the healthy elderly and the risk of falling. J. Res. Pract. Musculoskelet. Syst. 2021, 5, 59–64. [Google Scholar] [CrossRef]
  4. Aboutorabi, A.; Arazpour, M.; Bahramizadeh, M.; Hutchins, S.W.; Fadayevatan, R. The effect of aging on gait parameters in able-bodied older subjects: A literature review. Aging Clin. Exp. Res. 2016, 28, 393–405. [Google Scholar] [CrossRef]
  5. Herssens, N.; Verbecque, E.; Hallemans, A.; Vereeck, L.; Van Rompaey, V.; Saeys, W. Do spatiotemporal parameters and gait variability differ across the lifespan of healthy adults? A systematic review. Gait Posture 2018, 64, 181–190. [Google Scholar] [CrossRef]
  6. Mian, O.S.; Thom, J.M.; Ardigò, L.P.; Narici, M.V.; Minetti, A.E. Metabolic cost, mechanical work, and efficiency during walking in young and older men. Acta Physiol. (Oxf. Engl.) 2006, 186, 127–139. [Google Scholar] [CrossRef]
  7. Schoene, D.; Kiesswetter, E.; Sieber, C.C.; Freiberger, E. Skelettmuskuläre Faktoren, Sarkopenie und Stürze im Alter [Musculoskeletal factors, sarcopenia and falls in old age]. Z. Gerontol. Geriatr. 2019, 52, 37–44. [Google Scholar] [CrossRef]
  8. World Health Organization. WHO Global Report on Falls Prevention in Older Age. 2007. Available online: https://www.who.int/publications/i/item/9789241563536 (accessed on 9 September 2024).
  9. Gazibara, T.; Kurtagic, I.; Kisic-Tepavcevic, D.; Nurkovic, S.; Kovacevic, N.; Gazibara, T.; Pekmezovic, T. Falls, risk factors and fear of falling among persons older than 65 years of age. Psychogeriatrics 2017, 17, 215–223. [Google Scholar] [CrossRef]
  10. Chen, W.C.; Li, Y.T.; Tung, T.H.; Chen, C.; Tsai, C.Y. The relationship between falling and fear of falling among community-dwelling elderly. Medicine 2021, 100, e26492. [Google Scholar] [CrossRef]
  11. Chiu, S.L.; Chou, L.S. Effect of walking speed on inter-joint coordination differs between young and elderly adults. J. Biomech. 2012, 45, 275–280. [Google Scholar] [CrossRef]
  12. Ippersiel, P.; Robbins, S.M.; Dixon, P.C. Lower-limb coordination and variability during gait: The effects of age and walking surface. Gait Posture 2021, 85, 251–257. [Google Scholar] [CrossRef]
  13. Hafer, J.F.; Boyer, K.A. Age related differences in segment coordination and its variability during gait. Gait Posture 2018, 62, 92–98. [Google Scholar] [CrossRef]
  14. d’Avella, A.; Saltiel, P.; Bizzi, E. Combinations of muscle synergies in the construction of a natural motor behavior. Nat. Neurosci. 2003, 6, 300–308. [Google Scholar] [CrossRef]
  15. Yakovenko, S.; Krouchev, N.; Drew, T. Sequential activation of motor cortical neurons contributes to intralimb coordination during reaching in the cat by modulating muscle synergies. J. Neurophysiol. 2011, 105, 388–409. [Google Scholar] [CrossRef]
  16. Overduin, S.A.; d’Avella, A.; Roh, J.; Carmena, J.M.; Bizzi, E. Representation of Muscle Synergies in the Primate Brain. J. Neurosci. 2015, 35, 12615–12624. [Google Scholar] [CrossRef]
  17. Ivanenko, Y.P.; Poppele, R.E.; Lacquaniti, F. Spinal cord maps of spatiotemporal alpha-motoneuron activation in humans walking at different speeds. J. Neurophysiol. 2006, 95, 602–618. [Google Scholar] [CrossRef]
  18. Israeli-Korn, S.D.; Barliya, A.; Paquette, C.; Franzén, E.; Inzelberg, R.; Horak, F.B.; Flash, T. Intersegmental coordination patterns are differently affected in Parkinson’s disease and cerebellar ataxia. J. Neurophysiol. 2019, 121, 672–689. [Google Scholar] [CrossRef]
  19. Hacmon, R.R.; Krasovsky, T.; Lamontagne, A.; Levin, M.F. Deficits in intersegmental trunk coordination during walking are related to clinical balance and gait function in chronic stroke. J. Neurol. Phys. Ther. 2012, 36, 173–181. [Google Scholar] [CrossRef]
  20. Lukšys, D.; Jatužis, D.; Jonaitis, G.; Griškevičius, J. Application of continuous relative phase analysis for differentiation of gait in neurodegenerative disease. Biomed. Signal Process. Control 2021, 67, 102558. [Google Scholar] [CrossRef]
  21. Salehi, R.; Mofateh, R.; Mehravar, M.; Negahban, H.; Tajali, S.; Monjezi, S. Comparison of the lower limb inter-segmental coordination during walking between healthy controls and people with multiple sclerosis with and without fall history. Mult. Scler. Relat. Disord. 2020, 41, 102053. [Google Scholar] [CrossRef] [PubMed]
  22. Chiu, S.L.; Chou, L.S. Variability in inter-joint coordination during walking of elderly adults and its association with clinical balance measures. Clin. Biomech. 2013, 28, 454–458. [Google Scholar] [CrossRef] [PubMed]
  23. von Elm, E.; Altman, D.G.; Egger, M.; Pocock, S.J.; Gøtzsche, P.C.; Vandenbroucke, J.P. STROBE Initiative The Strengthening the Reporting of Observational Studies in Epidemiology (STROBE) Statement: Guidelines for reporting observational studies. Int. J. Surg. 2014, 12, 1495–1499. [Google Scholar] [CrossRef] [PubMed]
  24. Baek, M.J.; Kim, K.; Park, Y.H.; Kim, S. The Validity and Reliability of the Mini-Mental State Examination-2 for Detecting Mild Cognitive Impairment and Alzheimer’s Disease in a Korean Population. PLoS ONE 2016, 11, e0163792. [Google Scholar] [CrossRef]
  25. Santana, I.; Duro, D.; Lemos, R.; Costa, V.; Pereira, M.; Simões, M.R.; Freitas, S. Mini-Mental State Examination: Screening and Diagnosis of Cognitive Decline, Using New Normative Data. Acta Medica Port. 2016, 29, 240–248. [Google Scholar] [CrossRef]
  26. Lukaski, H.; Johnson, P.; Bolonchuk, W.; Lykken, G. Assessment of fat-free mass using bioelectrical impedance measurements of the human body. Am. J. Clin. Nutr. 1985, 41, 810–817. [Google Scholar] [CrossRef]
  27. Moreira, J.; Cunha, B.; Félix, J.; Santos, R.; Sousa, A.S.P. Kinematic and Kinetic Gait Principal Component Domains in Older Adults With and Without Functional Disability: A Cross-Sectional Study. J. Funct. Morphol. Kinesiol. 2025, 10, 140. [Google Scholar] [CrossRef]
  28. Zhong, Q.; Ali, N.; Gao, Y.; Wu, H.; Wu, X.; Sun, C.; Ma, J.; Thabane, L.; Xiao, M.; Zhou, Q.; et al. Gait Kinematic and Kinetic Characteristics of Older Adults With Mild Cognitive Impairment and Subjective Cognitive Decline: A Cross-Sectional Study. Front. Aging Neurosci. 2021, 13, 664558. [Google Scholar] [CrossRef] [PubMed]
  29. Tsuchida, W.; Kobayashi, Y.; Inoue, K.; Horie, M.; Yoshihara, K.; Ooie, T. Kinematic characteristics during gait in frail older women identified by principal component analysis. Sci. Rep. 2022, 12, 1676. [Google Scholar] [CrossRef]
  30. Sinclair, J.; Hebron, J.; Hurst, H.; Taylor, P. The influence of different Cardan sequences on three-dimensional cycling kinematics. Hum. Mov. 2013, 14, 334–339. [Google Scholar] [CrossRef]
  31. Hamill, J.; van Emmerik, R.E.; Heiderscheit, B.C.; Li, L. A dynamical systems approach to lower extremity running injuries. Clin. Biomech. 1999, 14, 297–308. [Google Scholar] [CrossRef]
  32. Ebrahimi, S.; Kamali, F.; Razeghi, M.; Haghpanah, S.A. Comparison of the trunk-pelvis and lower extremities sagittal plane inter-segmental coordination and variability during walking in persons with and without chronic low back pain. Hum. Mov. Sci. 2017, 52, 55–66. [Google Scholar] [CrossRef] [PubMed]
  33. Shih, P.C.; Steele, C.J.; Nikulin, V.; Villringer, A.; Sehm, B. Kinematic profiles suggest differential control processes involved in bilateral in-phase and anti-phase movements. Sci. Rep. 2019, 9, 3273. [Google Scholar] [CrossRef]
  34. Ghanavati, T.; Salavati, M.; Karimi, N.; Negahban, H.; Ebrahimi Takamjani, I.; Mehravar, M.; Hessam, M. Intra-limb coordination while walking is affected by cognitive load and walking speed. J. Biomech. 2014, 47, 2300–2305. [Google Scholar] [CrossRef] [PubMed]
  35. Shahzad, U.; Ahmad, I.; García-Luengo, A.V.; Zaman, T.; Al-Noor, N.H.; Kumar, A. Estimation of Coefficient of Variation Using Calibrated Estimators in Double Stratified Random Sampling. Mathematics 2023, 11, 252. [Google Scholar] [CrossRef]
  36. West, R.M. Best practice in statistics: The use of log transformation. Ann. Clin. Biochem. 2022, 59, 162–165. [Google Scholar] [CrossRef] [PubMed]
  37. Thiamwong, L.; Xie, R.; Conner, N.E.; Renziehausen, J.M.; Ojo, E.O.; Stout, J.R. Body composition, fear of falling and balance performance in community-dwelling older adults. Transl. Med. Aging 2023, 7, 80–86. [Google Scholar] [CrossRef]
  38. Priya, S.; Samuel, S.E.; Athira, M.V. Correlation between body mass index and fear of fall on functional mobility in elderly. Int. J. Physiother. Res. 2019, 7, 3257–3261. [Google Scholar] [CrossRef]
  39. Montero-Odasso, M.; Sarquis-Adamson, Y.; Song, H.Y.; Bray, N.W.; Pieruccini-Faria, F.; Speechley, M. Polypharmacy, gait performance, and falls in community-dwelling older adults. Results from the gait and brain study. J. Am. Geriatr. Soc. 2019, 67, 1182–1188. [Google Scholar] [CrossRef]
  40. Yoshida, Y.; Ishizaki, T.; Masui, Y.; Hori, N.; Inagaki, H.; Ito, K.; Ogawa, M.; Yasumoto, S.; Arai, Y.; Kamide, K.; et al. Effect of number of medications on the risk of falls among community-dwelling older adults: A 3-year follow-up of the SONIC study. Jpn. Geriatr. Soc. 2024, 24, 306–310. [Google Scholar] [CrossRef]
  41. Sadeghi, H.; Shojaedin, S.S.; Abbasi, A.; Alijanpour, E.; Vieira, M.F.; Svoboda, Z.; Nazarpour, K. Lower-Extremity Intra-Joint Coordination and Its Variability between Fallers and Non-Fallers during Gait. Appl. Sci. 2021, 11, 2840. [Google Scholar] [CrossRef]
  42. Silva, J.; Atalaia, T.; Abrantes, J.; Aleixo, P. Gait Biomechanical Parameters Related to Falls in the Elderly: A Systematic Review. Biomechanics 2024, 4, 165–218. [Google Scholar] [CrossRef]
  43. James, E.G.; Leveille, S.G.; Hausdorff, J.M.; Barton, B.; Cote, S.; Karabulut, M.; Conatser, P.; Kennedy, D.N.; Tucker, K.L.; Snih, S.A.; et al. Coordination Impairments Are Associated With Falling Among Older Adults. Exp. Aging Res. 2017, 43, 430–439. [Google Scholar] [CrossRef] [PubMed]
Figure 1. Phase angle definition based on a phase plot of normalized spatial angle and normalized angular velocity.
Symmetry 17 00818 g001
Figure 2. Sample constitution flow diagram.
Symmetry 17 00818 g002
Figure 3. Intrasegmental coordination across gait cycles: This figure shows mean CRP values between segments of NFoF, FoF, NHoF, and HoF groups across the sagittal, frontal, and horizontal planes. Significant differences were observed, with the HoF group exhibiting greater CRP values in in the sagittal plane, and the FoF group showing higher CRP values in both the sagittal and horizontal planes compared to the NFoF and NHoF groups. Greater group differences were noted in the frontal and horizontal planes.
Symmetry 17 00818 g003
Figure 4. Intersegmental mean CRP values across the gait cycle for the NFoF, FoF, NHoF, and HoF groups in various planes (sagittal, frontal, and horizontal). The figure highlights the differences in CRP values between the left and right limbs, with greater group differences observed in the frontal and horizontal plane.
Symmetry 17 00818 g004
Table 1. Participant characteristics.
CharacteristicsGroups
(Mean ± SD)
Between Groups Comparisons (p Value)
NFoF
(n = 41)
FoF
(n = 19)
NHoF
(n = 38)
HoF
(n = 22)
HoFFoFHoF*FoF
Age (y)66.68 ± 6.4768.58 ± 5.3766.34 ± 5.1168.91 ± 7.510.228 0.421 0.691
Gender (n) 0.104 b0.149 b
   Men18 (43.9%)4 (21.1%)17 (44.7%)5 (22.7%)
   Women23 (56.1%)15 (78.9%)21 (55.3%)17 (77.3%)
Height (m)1.62 ± 0.081.58 ± 0.071.63 ± 0.081.57 ± 0.070.061 0.151 0.347
Weight (kg)65.92 ± 10.5666.54 ± 9.4067.92 ± 10.2063.01 ± 9.450.1140.5570.557
Body Mass Index (kg/m2)25.03 ± 2.8426.67 ± 2.8325.68 ± 3.1125.34 ± 2.590.4960.037 *0.899
Health Condition 0.597 a0.526 a
   Yes31 (75.6%)15 (78.9%)29 (76.3%)17 (77.3%)
   No10 (24.4%)4 (21.1%)9 (23.7%)5 (22.7%)
Number of Health Conditions1.39 ± 1.141.89 ± 1.291.61 ± 1.261.45 ± 1.100.2680.1730.158
Medication 0.246 a0.414 a
   Yes35 (85.4%)18 (94.7%)332 (84.2%)21 (95.5%)
   No6 (14.6%)1 (5.3%)6 (15.8%)1 (4.5%)
Number of Medication2.88 ± 2.423.42 ± 2.362.42 ± 2.064.14 ± 2.590.018 *0.7200.672
Number of Falls0.44 ± 0.740.79 ± 1.1301.50 ± 0.86
History of Falling 0.264 a
   Yes13 (31.7%)9 (47.4%)0100%
   No28 (68.3%)10 (52.6%)100%0
Fear of Falling 0.104 b
   Yes0100%10 (26.3%)9 (40.9%)
   No100%028 (73.7%)13 (59.1%)
Legend: Data are expressed as mean ± standard deviation, unless otherwise stated. * p < 0.05. NFoF, Without Fear of Falling; FoF, Fear of Falling; NHoF, Without History of Falling; HoF, History of Falling. a Pearson’s chi-square Test, b Fisher’s Exact Test.
Table 2. Outcome values for intrasegmental coordination during gait.
CRPPlaneCycle CRP
Variable
Groups (Mean ± SD)Between Groups
Comparisons (p Value)
NFoF (41)FoF (19)NHoF (38)HoF (22)HoFFoFHoF*FoF
Hip-KneeSagittalML73.90 ± 4.6175.04 ± 3.4272.99 ± 4.0176.46 ± 3.870.004 *0.5640.774
R74.33 ± 3.8973.01 ± 4.4773.52 ± 3.7674.59 ± 4.620.2610.2010.937
SDL46.91 ± 2.7747.97 ± 3.2746.92 ± 2.5747.81 ± 3.510.7080.3910.089
R47.13 ± 2.5947.36 ± 2.5646.85 ± 2.2147.81 ± 3.030.4920.8160.036 *
CVL0.64 ± 0.020.64 ± 0.050.64 ± 0.040.62 ± 0.040.017 *0.7100.046 *
R0.64 ± 0.040.65 ± 0.040.64 ± 0.040.64 ± 0.030.6180.3160.063
FrontalML66.51 ± 26.5467.89 ± 27.8868.3928.8264.4423.140.7290.6600.084
R80.21 ± 22.1472.12 ± 24.4276.3124.6079.9819.210.3710.2000.658
SDL44.34 ± 10.2242.73 ± 10.9244.2 ± 11.1243.07 ± 9.170.7460.7960.159
R47.99 ± 6.2847.24 ± 12.0447.09 ± 8.7048.91 ± 8.010.3740.7020.771
CVL0.73 ± 0.190.69 ± 0.180.72 ± 0.190.72 ± 0.180.8020.3310.146
R0.64 ± 0.170.68 ± 0.120.66 ± 0.170.64 ± 0.140.4910.3320.997
HorizontalML76.85 ± 17.3970.38 ± 17.7878.25 ± 18.5968.84 ± 14.330.0520.2520.482
R71.25 ± 18.8871.93 ± 15.5671.80 ± 19.0970.88 ± 15.610.6260.9900.352
SDL47.91 ± 4.7646.17 ± 4.7648.07 ± 3.8346.14 ± 6.010.1640.3020.975
R47.87 ± 5.7647.46 ± 5.6447.04 ± 5.6447.10 ± 5.880.7750.8310.367
CVL0.65 ± 0.130.69 ± 0.140.64 ± 0.140.69 ± 0.110.2160.3250.381
R0.69 ± 0.160.68 ± 0.120.69 ± 0.160.68 ± 0.120.8580.8820.308
Knee-AnkleSagittalML89.54 ± 11.1284.91 ± 10.1688.20 ± 10.9387.86 ± 11.260.9720.1210.638
R86.08 ± 10.6983.85 ± 11.6685.86 ± 9.5684.54 ± 13.240.5380.4190.336
SDL48.90 ± 3.6150.46 ± 4.8848.35 ± 3.7651.20 ± 4.060.006 *0.2150.192
R48.82 ± 3.8350.64 ± 4.9548.91 ± 4.3350.25 ± 4.080.1240.0880.048 *
CVL0.55 ± 0.080.60 ± 0.090.56 ± 0.080.59 ± 0.090.1090.048 *0.246
R0.58 ± 0.080.62 ± 0.110.58 ± 0.080.61 ± 0.110.0940.0830.040 *
FrontalML71.15 ± 19.1771.14 ± 22.0468.69 ± 19.1275.40 ± 21.030.4510.6640.135
R63.61 ± 16.4666.76 ± 15.4165.27 ± 17.7463.47 ± 12.990.4390.5450.361
SDL49.25 ± 7.1846.17 ± 6.6848.32 ± 7.3548.19 ± 6.870.9420.1180.776
R46.04 ± 5.7846.90 ± 5.2845.81 ± 5.6047.19 ± 5.610.4960.7280.724
CVL0.72 ± 0.140.69 ± 0.150.73 ± 0.140.67 ± 0.150.4880.7960.016 *
R0.75 ± 0.140.73 ± 0.140.74 ± 0.140.76 ± 0.130.2670.5630.348
HorizontalML77.85 ± 14.5070.05 ± 13.2975.39 ± 13.6775.36 ± 16.130.4550.0870.129
R78.92 ± 16.6766.31 ± 15.6873.72 ± 18.4277.00 ± 15.270.1240.009 *0.171
SDL48.34 ± 6.6245.67 ± 6.0847.81 ± 6.8546.96 ± 6.020.8920.2350.204
R48.51 ± 6.9445.20 ± 7.7647.01 ± 8.1548.24 ± 5.660.0910.1430.030 *
CVL0.63 ± 0.100.66 ± 0.080.64 ± 0.090.64 ± 0.100.5580.3110.379
R0.63 ± 0.080.70 ± 0.090.65 ± 0.090.64 ± 0.090.2980.004 *0.986
Hip-AnkleSagittalML77.03 ± 11.3783.83 ± 9.2978.77 ± 11.4679.89 ± 10.780.8970.030 *0.776
R79.48 ± 9.8382.80 ± 9.9380.33 ± 10.1680.88 ± 9.660.9600.2620.996
SDL45.97 ± 3.6245.37 ± 3.0845.55 ± 3.8746.18 ± 2.580.4000.5050.735
R44.65 ± 3.3446.36 ± 3.4844.26 ± 3.3546.79 ± 3.060.004 *0.0930.190
CVL0.61 ± 0.120.55 ± 0.090.59 ± 0.130.59 ± 0.100.9120.0560.892
R0.57 ± 0.100.57 ± 0.090.56 ± 0.100.59 ± 0.090.2490.8590.609
FrontalML90.08 ± 15.1785.57 ± 18.1789.85 ± 15.1586.59 ± 17.960.6950.4350.561
R85.56 ± 15.3784.83 ± 14.1683.19 ± 13.9889.02 ± 15.970.0810.8250.278
SDL51.52 ± 5.1449.80 ± 6.1751.48 ± 5.7850.12 ± 4.970.4100.3040.710
R49.77 ± 5.0048.68 ± 3.9949.20 ± 4.3649.82 ± 5.310.4950.4050.747
CVL0.59 ± 0.110.61 ± 0.150.59 ± 0.130.60 ± 0.110.9470.6370.574
R0.60 ± 0.110.59 ± 0.100.61 ± 0.100.58 ± 0.110.2190.7530.331
HorizontalML70.79 ± 14.1674.48 ± 14.3473.16 ± 14.1369.89 ± 14.430.1930.3830.253
R74.42 ± 14.7072.71 ± 11.6474.44 ± 13.4672.92 ± 14.460.7980.7320.828
SDL48.08 ± 4.7448.36 ± 4.2548.80 ± 4.6447.09 ± 4.300.1510.7070.787
R48.52 ± 4.9747.91 ± 4.2748.56 ± 4.1147.93 ± 5.740.7360.7220.851
CVL0.70 ± 0.110.67 ± 0.120.68 ± 0.100.70 ± 0.110.3360.4480.185
R0.67 ± 0.100.67 ± 0.090.67 ± 0.100.67 ± 0.090.8960.9930.976
Legend: Data are expressed as mean ± standard deviation, unless otherwise stated. * p < 0.05. NFoF, Without Fear of Falling; FoF, Fear of Falling; NHoF, Without History of Falling; HoF, History of Falling. M, Mean; SD, Standard Deviation; CV, Coefficient of variation. L, Left; R, Right.
Table 3. Outcome values for intersegmental coordination during gait.
CRPPlaneCycle CRP VariableGroups
(Mean ± SD)
Between Groups
Comparisons (p Value)
NFoF (41)FoF (19)NHoF (38)HoF (22)HoFFoFHoF*FoF
Hip|L and RSagittalM8.32 ± 2.979.37 ± 3.488.40 ± 2.359.08 ± 4.230.898 0.345 0.497
SD6.77 ± 3.178.05 ± 3.457.01 ± 2.907.44 ± 3.930.752 0.1680.611
CV0.80 ± 0.150.86 ± 0.170.82 ± 0.170.81 ± 0.150.6340.1640.919
FrontalM32.35 ± 12.2531.42 ± 14.7330.17 ± 11.1435.32 ± 15.370.1320.6150.635
SD30.14 ± 9.6728.58 ± 9.4128.59 ± 9.2631.47 ± 9.940.2270.5180.735
CV0.96 ± 0.150.95 ± 0.160.97 ± 0.150.93 ± 0.160.3750.9110.855
HorizontalM46.42 ± 15.3751.50 ± 17.7650.03 ± 17.4744.58 ± 13.370.1460.2080.760
SD38.62 ± 7.7641.48 ± 9.4439.91 ± 7.9838.87 ± 9.130.5190.2070.933
CV0.87 ± 0.160.85 ± 0.170.85 ± 0.180.89 ± 0.110.3030.4520.977
Knee|L and RSagittalM9.28 ± 3.769.04 ± 4.418.40 ± 2.8110.59 ± 5.160.046 *0.5930.148
SD7.33 ± 3.497.96 ± 4.496.75 ± 2.088.86 ± 5.490.0790.8210.281
CV0.80 ± 0.120.88 ± 0.170.82 ± 0.130.82 ± 0.160.6390.0640.403
FrontalM54.18 ± 27.0555.84 ± 28.7552.22 ± 29.2258.99 ± 23.850.347 0.865 0.256
SD41.02 ± 12.3942.18 ± 10.5639.30 ± 13.3745.00 ± 7.230.104 0.961 0.308
CV0.85 ± 0.230.87 ± 0.260.86 ± 0.230.85 ± 0.240.864 0.596 0.281
HorizontalM38.52 ± 13.3036.88 ± 14.9439.58 ± 14.3335.27 ± 12.480.2500.7600.718
SD34.96 ± 9.3630.94 ± 9.9434.85 ± 9.6931.68 ± 9.470.2160.1460.364
CV0.93 ± 0.140.87 ± 0.130.91 ± 0.130.92 ± 0.150.6900.0720.596
Ankle|L and RSagittalM23.44 ± 12.1518.79 ± 5.7121.46 ± 6.6622.83 ± 15.590.7210.048 *0.450
SD21.55 ± 8.3517.13 ± 5.8020.63 ± 6.5419.33 ± 9.860.407 0.038 * 0.914
CV0.96 ± 0.220.92 ± 0.160.98 ± 0.230.89 ± 0.140.3620.872 0.198
FrontalM36.43 ± 11.6733.02 ± 11.4034.10 ± 11.9437.52 ± 10.900.241 0.220 0.921
SD32.03 ± 8.7828.12 ± 9.6130.15 ± 9.8331.91 ± 7.940.347 0.107 0.924
CV0.91 ± 0.170.87 ± 0.170.90 ± 0.170.87 ± 0.150.688 0.523 0.648
HorizontalM32.10 ± 13.2729.06 ± 8.0329.88 ± 7.6233.30 ± 16.930.608 0.220 0.229
SD30.25 ± 8.7829.01 ± 7.2029.53 ± 7.4430.43 ± 9.710.869 0.453 0.332
CV0.97 ± 0.181.02 ± 0.161.00 ± 0.150.96 ± 0.200.463 0.239 0.790
Legend: Data are expressed as mean ± standard deviation, unless otherwise stated. * p < 0.05. NFoF, Without Fear of Falling; FoF, Fear of Falling; NHoF, Without History of Falling; HoF, History of Falling. L, Left; R, Right; M, Mean; SD, Standard Deviation; CV, Coefficient of variation.
Disclaimer/Publisher’s Note: The statements, opinions and data contained in all publications are solely those of the individual author(s) and contributor(s) and not of MDPI and/or the editor(s). MDPI and/or the editor(s) disclaim responsibility for any injury to people or property resulting from any ideas, methods, instructions or products referred to in the content.

