Abstract
Photovoltaic (PV) power generation is characterized by high stochasticity, symmetry in daily power generation and low predictive accuracy. Enhancing the precision of power forecasting is crucial for improving symmetrical economic operation of the power grid. Due to Back-Propagation (BP) neural network prediction, there are problems such as difficulty in choosing network structure and high data requirements. A hybrid photovoltaic power forecasting model is introduced, utilizing the black-winged kite optimization algorithm (BKA) method to optimize the number of decompositions and maximum number of iterations in variational mode decomposition (VMD), as well as the critical parameters in the BP neural network. Initially, SHAP (Shapley Additive exPlanations) analysis identifies the primary factors used to serve as inputs for the K-means++ clustering of similar days, with the dataset segmented into samples of analogous days to reduce the asymmetric stochasticity of PV generation. Subsequently, the highly correlated features and PV power across different weather scenarios are decomposed using VMD, and a BKA-BP neural network prediction model is developed for each subcomponent. Ultimately, the predicted values are reconstructed through superimposition to yield the final prediction outcomes. The simulation findings indicate that VMD-BKA-BP neural network ensemble prediction model significantly enhances the short-term prediction accuracy of photovoltaic power relative to alternative models. This prediction model can be used in the future to optimize power dispatch and improve grid stability.
1. Introduction
As existing fossil energy sources become increasingly depleted and irretrievable, renewable energy is destined to play a pivotal role in the future energy framework. Solar power generation, while promising, is constrained by natural environmental conditions, resulting in unstable energy output; the generated electricity is either consumed immediately or stored using battery packs. The elevated expense of power storage technology now hinders the extensive adoption of solar energy [1]. The accurate forecasting of solar power generation is crucial for optimizing power generation planning and ensuring the stability and reliability of renewable energy supply [2,3].
Currently, photovoltaic (PV) power forecast techniques are primarily classified into three categories: physical approaches, statistical methods, and artificial intelligence models [4,5,6,7]. Modeling physical processes is challenging, and acquiring the equipment specifications of PV power plants is not straightforward [8,9]. Statistical methods depend on the formulation of models and assumptions, typically utilizing linear models that can accommodate only straightforward linear relationships, leading to diminished predictive accuracy and unsatisfying outcomes when addressing nonlinear issues [10]. Artificial intelligence models, when provided with adequate training data and subjected to a series of optimization changes, demonstrate exceptional generalization skills [11,12]. This renders them appropriate for various complex scenarios and challenges in the field of power prediction [13]. The “decomposition-prediction-combination” approach demonstrates higher predictive performance across several methodologies for PV power forecasting [14]. Relevant studies presents a short-term photovoltaic power forecasting method employing Multivariate Variational Mode Decomposition (MVMD) and Hybrid Deep Neural Networks (HDNs) [15]. MVMD is utilized to decompose the time series of PV power and multidimensional meteorological variables, subsequently leading to the development of a prediction model based on HDN for each component. In the related research, variational mode decomposition (VMD) and complete ensemble empirical mode decomposition with adaptive noise (CEEMDAN) were employed to decompose the PV power data into multiple sets of low- and high-frequency components and input these components into a least squares support vector machine prediction model for power prediction [16,17,18]. There are also scholars who employed the Sparrow Search Algorithm (SSA) to optimize the number of decomposition layers and penalty factor parameters of VMD, thereafter inputting the Intrinsic Mode Function (IMF) into Bidirectional Long- and Short-term Memory Network (Bi-LSTM) prediction model for prediction [19,20]. Research works have proposed techniques that amalgamate clustering integrated analysis with deep learning, significantly enhancing the accuracy of photovoltaic power prediction by multi-model fusion [21,22]. Research works have also identified the element with the most significant influence on PV power using the Pearson correlation coefficient, which classifies weather based on sunshine hours and employs machine learning to forecast various weather situations [23]. Research worker introduced a Back-Propagation (BP) neural network algorithm prediction model [24]; in the meantime, other scholars presented an enhanced grey BP neural network prediction model, both yielding notable results [25].
This research presents a short-term PV power forecast approach utilizing climatic similar-day clustering and a VMD-BKA-BP neural network model. Initially, the SHAP (Shapley Additive exPlanations) analysis identifies the parameters most strongly correlated with solar power generation, which are then utilized as inputs for the K-means++ method to cluster analogous days in the historical data and generate datasets for various weather conditions [26]. Secondly, the black kite algorithm (BKA) is employed to optimize the decomposition layer and maximize the number of iterations of VMD, in addition to the number of neurone layers, the number of neurones per layer, and the regularization coefficient of the BP neural network [27,28]. Successfully addresses the sensitivity associated with model parameter selection. The model’s accuracy and resilience, as described in this study, are validated by comparisons with several alternative model sets.
2. Related Works
This section will review the fundamental fields pertinent to this study and present their associated principles and execution techniques.
2.1. SHAP Analysis
SHAP is a method grounded in game theory, introduced by Lundberg and Lee in 2017 [29], for elucidating the prediction outcomes of a machine learning model. It assesses the significance of each input parameter by computing the marginal contribution of features as they are incorporated into the model, where the sign denotes a positive or negative effect and the absolute value reflects the extent of influence on the overall prediction. Equation (1) presents the expression related to SHAP analysis:
where is the mean value of the target variable across all samples, and represents the SHAP value of .
2.2. K-Means++ Clustering
K-means++ is a clustering technique proposed by Arthur D et al. It enhances the stability and efficiency of clustering outcomes by judiciously initializing the centroid position [30]. The implementation of K-means++ is as follows:
- A sample is randomly chosen as the initial center of mass in the total radiated power raw data.
- is the data sample, and for each sample , its Euclidean distance from the existing clustering centroid of mass is , while the likelihood of a sample point being chosen as the subsequent clustering centroid of mass is . When selecting a new centroid of mass, a weighted probability selection is conducted based on the distance between the sample and the chosen centroid of mass, and this process is repeated until M centroids of mass have been selected.
- Calculate the distance of each sample in the dataset from the M cluster centroids of mass and assign it to the cluster corresponding to the cluster centroid of mass with the closest distance and update the centroid of mass of each cluster.
- Repeat steps 2 and 3 until the position of the clustered center of mass stabilizes or the maximum number of iterations is attained.
The efficacy of the clustering outcomes is evaluated by computing the contour coefficient of the clustering results. The contour coefficient has the range [−1, 1], and a high contour coefficient indicates superior clustering efficacy, whereas a low value necessitates the adjustment of the M parameter.
2.3. VMD
VMD is an adaptive signal processing technique that converts signal decomposition into a variational decomposition mode, facilitating the adaptive decomposition of many components within the signal’s frequency domain [31]. In comparison to empirical mode decomposition (EMD), VMD more successfully mitigates the modal aliasing issue arising during signal decomposition, while also exhibiting enhanced noise robustness and reduced endpoint effects [32]. Due to the susceptibility of PV power to meteorological influences, the power curve exhibits complexity and volatility. Consequently, this paper employs VMD to decompose the PV power series into K components with distinct center frequencies, thereby offering more effective information for subsequent feature extraction in the model. Equation (2) presents the pertinent expression for the VMD.
Let K represent the number of components, denote the decomposed single-component signal, represent the central frequency of each single-component signal, indicate the bias deviation, denote the Dirac function, “∗” signify the convolution operator, and represent the original input signal.
To find the best solution for this limited variational issue, the Lagrange multiplier λ() and the second-order penalty factor α are employed to convert the problem into an unconstrained variational problem, as illustrated in Equation (3):
Subsequent to the transformation, iteration may be conducted to refine the pertinent parameters of each component in order to identify the ideal solution, as outlined below:
- Initialize and .
- Initiate the loop, .
- For everyonewhere is the number of cycles , is the Fourier transform of ,.
- Update and repeat steps 3–4 to refresh all the parameters pertaining to the components of :
- Update :where is the noise tolerance limit; when the signal contains strong noise, can be set to achieve a better denoising effect.
- Repeat steps 2–5 until the accuracy criterion is met:
Ultimately, the condition has been met, the iteration is terminated and signal components are acquired.
2.4. BKA
BKA is a meta-heuristic optimization method derived from the migratory and predatory behaviors of the black kite [33]. BKA integrates the Cauchy mutation approach with the leader method, enhancing the algorithm’s global search efficacy and convergence rate. This innovative combination effectively balances the exploration of global solutions with the utilization of local knowledge. The algorithm comprises three phases: the population initialization phase, the attack phase and the migration phase. This study employs this algorithm to optimize the pertinent parameters.
2.4.1. Population Initialization Phase
Similar to previous intelligent optimization methods, a random initialization strategy is employed during the initialization phase, with the position of the black-winged kite representing the answer as follows:
Let i be an integer within the range of 1 to N, where N denotes the total number of potential solutions, i.e., the number of black-winged kite populations. rand is a randomly selected value in the range [0, 1], refers to the position of the ith black-winged kite, and BKlb and BKub are the lower and upper bounds of the position of the ith black-winged kite, respectively.
2.4.2. Attack Phase
Black-winged kites modify their wing and tail angles in response to wind velocity while in flight, hover silently to survey potential prey and subsequently dive to execute a swift assault. The plan encompasses many offensive tactics for worldwide exploration and search:
where the first equation of Equation (9) simulates the scenario in which the black-winged kite hovers, spreads its wings and maintains equilibrium in the air, alongside the moment when the black-winged kite accelerates towards its victim at a high velocity; the second equation models the predatory behavior of the black-winged kite while it remains airborne. , denotes the position of the ith black-winged kite in the jth dimension during the t + 1 th and t th iterations, respectively; r is a random number within the range [0, 1]; is a constant valued at 0.9; and n is specified by Equation (10), where represents the maximum number of iterations, and t denotes the current iteration count.
2.4.3. Migration Phase
The BKA algorithm posits a hypothesis derived from flock migration: If the fitness value of the current population is inferior to that of a random population, the leader relinquishes leadership and integrates into the migrating population, signifying that it is unsuitable to guide the population onwards. If the fitness value of the current population exceeds that of the random population, the population is directed until it attains its objective. This technique dynamically identifies an effective leader and guarantees the success of the move.
where represents the leading scorer (current optimal solution) of the jth dimensional black-winged kite for the tth iteration, and denotes the fitness value of the current individual.
denotes the fitness value of the jth dimensional random position obtained by any black-winged kite during the tth iteration, while C(0,1) signifies the Cauchy mutation, with its probability density function expressed by Equation (13), and when δ = 1 and μ = 0, its probability density function changes to the standard form, as delineated by Equation (14):
2.5. BP Neural Network
BP neural network is a feed-forward architecture characterized by a basic structure, robust generalization capability, nonlinear mapping proficiency and error backpropagation [34]. The structure primarily consists of input, hidden and output layers, with its architecture illustrated in Figure 1.The fully connected layer of traditional BP networks lacks explicit symmetry and needs to rely on the amount of data available to learn indirectly. In this paper, the BP network needs to enhance symmetry through data enhancement and algorithmic optimization.
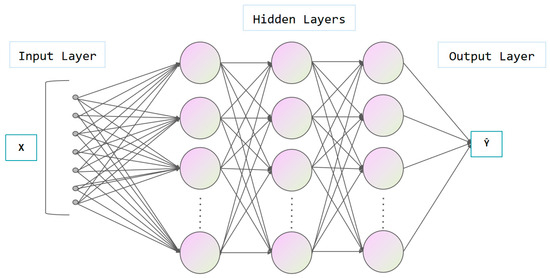
Figure 1.
BP neural network topology.
This model utilizes inputs including ambient temperature, light intensity and historical electricity generation to provide forecasts.
2.6. Assessment Metrics
The normalized mean absolute error NMAE, the normalized root mean square error NRMSE and the coefficient of determination R2 were selected as metrics for assessing the predictive model [35].
where n represents the quantity of PV power test samples, denotes the actual value of the jth point, signifies the expected value of the jth point and indicates the mean value of the samples under examination.
3. Methods
The procedure for prediction utilizing similar-day clustering and the VMD-BKA-BP neural network is outlined as follows:
- We sanitize and replenish the raw data of PV power generation, then partition the data into training, validation and test sets. Next, employ SHAP analysis to identify the most significant correlating factor with PV output power among the climatic variables, using it as the input criterion for K-means++ clustering.
- Similar-day clustering using K-means++ divides days into categories of sunny, cloudy, and rainy.
- Pearson feature selection is employed to identify the five weather features exhibiting the strongest link with PV power across various weather circumstances.
- BKA is employed to optimize the core parameters of VMD [K,α], and the VMD decomposition of historical PV output power is conducted for three weather conditions, sunny, cloudy, and rainy, utilizing the optimum parameter combinations.
- We input each sub-sequence into the BKA-BP neural network model, train it using the sample training set and overlay the prediction results of each sub-sequence upon the completion of the training.
- We compare the mean absolute error NMAE, root mean square error NRMSE and coefficient of determination R2 as evaluation metrics to assess the prediction efficacy of various models.
This paper’s experimental data encompass total radiation, direct radiation, scattered radiation, module temperature, ambient temperature and PV power generation data for June, July and August of the second quarter of 2019, sourced from a 50 MW PV power station located in southern China. Power generation data from this PV power plant were gathered for 92 consecutive days in the second quarter, with a sampling frequency of 15 min and 96 samples per day, resulting in a total of 8832 data values [36]. All experiments were developed using MATLAB 2023a software. The workstation configuration used was Intel Core i7-12700H, with 4400 MHz CPU and 32 GB RAM. The manufacturer of the computer used for the simulation was Shenzhou Computer Co. The city of origin of the equipment was Shenzhen, China.
3.1. Shap Analysis
The output power of PV systems was influenced by total radiation, direct radiation, diffuse radiation, humidity, atmospheric pressure, temperature and module temperature. SHAP analysis identified characteristics with a strong association with PV power, which were then utilized as input features for subsequent clustering techniques to minimize repetition in model inputs. Figure 2 illustrates the SHAP analysis chart and the correlation coefficient between meteorological conditions and photovoltaic power generation.
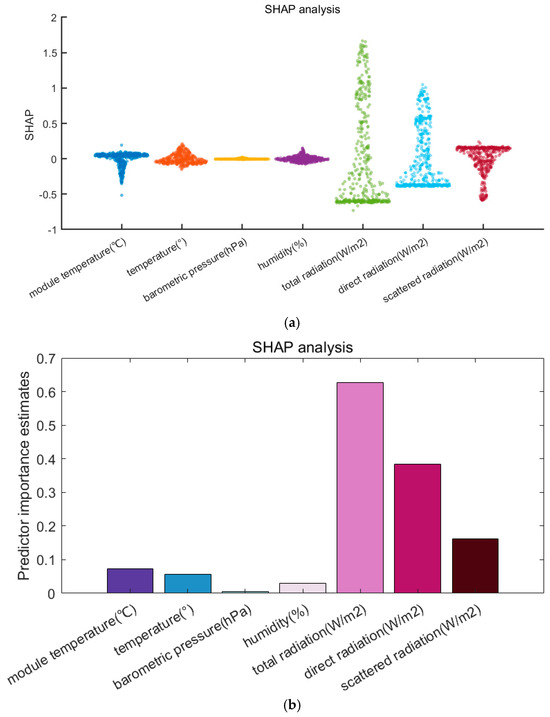
Figure 2.
(a) An analysis of the association between photovoltaic power generation and many variables. (b) A correlation coefficient between photovoltaic power generation and other parameters.
Referencing Figure 2, it is evident that PV power has a strong association with total radiation, direct radiation and diffuse radiation. The PV power exhibits the most significant link with total radiation; hence, total radiation was utilized as the input characteristic for weather clustering in this study.
3.2. Clustering Based on Day Similarity
The clustering steps for similar days, based on the features of total radiation variables, were as follows.
- The time series of total daily daylight radiation from 6:30 to 21:00 for June, July and August were compiled into a 92 × 59 matrix, with each row denoting a 1-day PV power series.
- For each M value, we executed the following procedures: we applied the K-means++ algorithm to partition the data into M clusters; we computed the profile coefficient for each clustering outcome and documented the average profile coefficient associated with that M value, subsequently identifying the M at which the profile coefficient reached its maximum.
- We employed conclusive K-means++ clustering of the radiometric data utilizing the established optimal M value.
With three clusters, the average profile coefficient reached its maximum at 0.640, indicating optimal clustering. Specifically, June, July and August in the second quarter were categorized into 28 sunny days, 53 cloudy days and 11 wet days. The clustering outcomes were depicted and examined as illustrated in Figure 3.
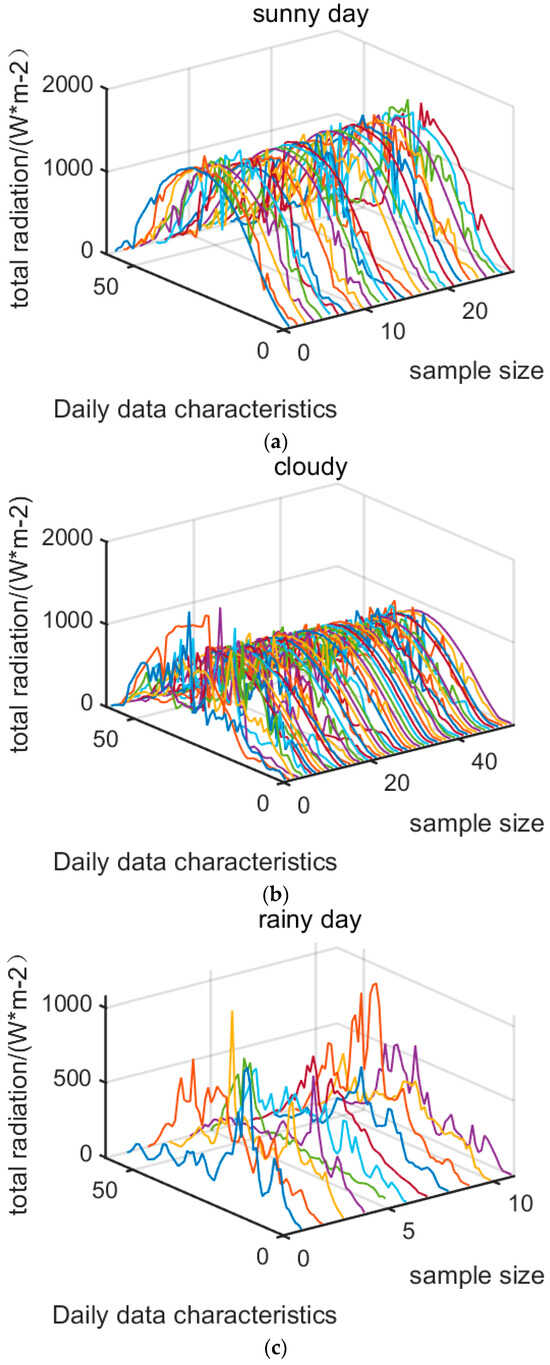
Figure 3.
(a) Results of clustering for sunny days. (b) Results of clustering for cloudy days. (c) Results of clustering for rainy days.
3.3. Pearson Feature Selection
The excessive selection of meteorological variables contributes redundant information, hence prolonging training time and adversely impacting the accuracy of the predictive model. Consequently, Pearson feature selection was employed to identify meteorological factors that exhibited a strong association with photovoltaic output for inclusion in the prediction model.
Pearson feature selection identified the five meteorological factors most strongly correlated with PV power to serve as inputs for the prediction model, including unclustered weather and sunny, cloudy and rainy days. Figure 4 illustrates the Pearson feature selection plot under several weather conditions.
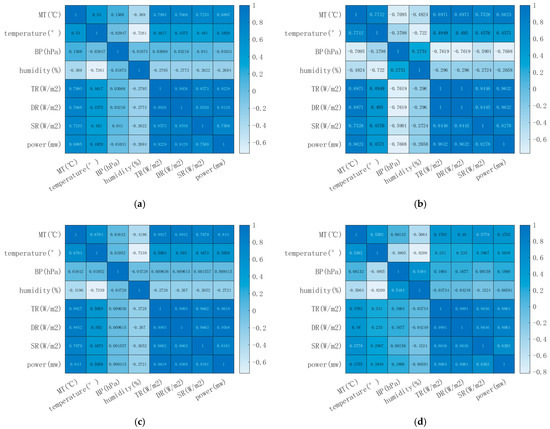
Figure 4.
(a) Pearson’s feature selection without clustering. (b) Pearson’s feature selection in sunny weather. (c) Pearson’s feature selection in cloudy weather. (d) Pearson’s feature selection in case of rain.
In summary, total radiation, direct radiation, scattered radiation, component temperature and temperature were chosen as meteorological feature inputs for the prediction model in the unclustered scenario. Total radiation, direct radiation, component temperature, scattered radiation and barometric pressure were designated as the meteorological input variables for the prediction model under sunny weather conditions. The inputs for the forecast model under cloudy weather circumstances included total radiation, direct radiation, component temperature, scattered radiation and temperature. Total radiation, direct radiation, scattered radiation, component temperature and ambient temperature were designated as inputs for the meteorological aspects of the prediction model under rainy weather conditions.
3.4. VMD Decomposition
The VMD parameters improved by BKA were the VMD decomposition number K and the maximum iteration number α, utilizing the minimal entropy of the decomposed sequence as the fitness function. The parameter combinations derived from optimization on unclustered, sunny, cloudy and rainy days were consistently K = 7 and α = 56. The decomposition results are shown in Figure 5.
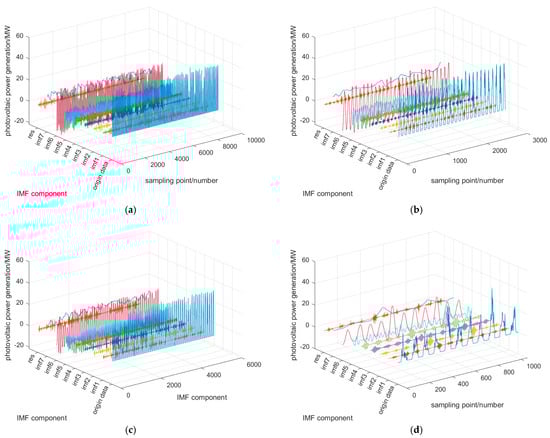
Figure 5.
(a) VMD decomposition result without clustering. (b) VMD decomposition result for sunny weather. (c) VMD decomposition result for cloudy weather. (d) VMD decomposition result for rainy weather.
Figure 5 illustrates that the first column comprises the original photovoltaic power data, columns 2–8 represent the decomposition sequence from high frequency to low frequency and the final column represents the residual. Sequence decomposition can efficiently identify the elements in the original data that influence power fluctuations. IMF1 is the primary component and accurately reflects the trend of photovoltaic power variations.
3.5. VMD-BKA-BP Neural Network Prediction
To verify the effectiveness of the VMD-BKA-BP neural network prediction model, comparison trials were designed for unclustered treatment weather, sunny, cloudy and rainy days, respectively. This included the BP neural network, VMD-BP, LSTM, VMD-LSTM, VMD-BKA-LSTM, EMD-BKA-BP, VMD-PSO-BP and VMD-BKA-BP models. Dyas were randomly selected to be measured from the unclustered weather, sunny, cloudy and rainy samples. The BKA optimization populations were established at 30, with a maximum of 500 optimization iterations permitted. The optimization of the number of neurone layers, the number of neurones per layer and the regularization coefficient hyper-parameters in the BP neural network was conducted with an upper bound of [3, 50, 50, 0.3] and a lower bound of [1, 2, 2, 0.001]. In the BP neural network stage, the main considerations were the regularization coefficients, the number of neuron layers and the number of neurons, using the loss function and the penalty term coefficients. The combination of the loss function and the penalty term coefficients achieved the dual goals of error minimization and complexity control with the dual goal of achieving a balance between model performance and generalization ability.
4. Results
Figure 6 displays the predictive outcomes of several models. Figure 6a illustrates the predictions of each model without weather clustering. Although there are discrepancies among the predictions of many models, the predicted value of the model presented in this paper remains the closest to the actual value. Figure 6b illustrates the prognosis on a sunny day, in contrast to Figure 6c, The average daylight duration in Figure 6b is greater, resulting in a broader parabolic graph of photovoltaic (PV) power prediction. In Figure 6c, the solar radiation incident on the PV panels is less due to cloud cover obstructing sunlight, leading to a reduction in power output at the same time of day compared to a clear day. In Figure 6d, during rainy days, the photovoltaic output exhibits greater fluctuations and a reduced power generation magnitude. The forecast graph illustrates that the model presented in this research closely approximates the true value on the forecast curve in both scenarios. This further illustrates the strong robustness of the predicted accuracy of the model presented in this research.
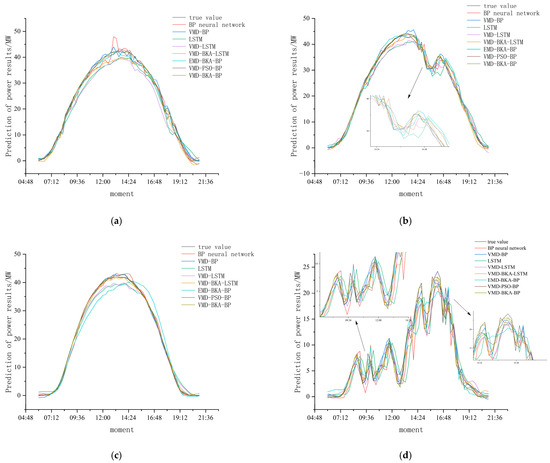
Figure 6.
(a) Predicted PV power output without clustering. (b) Predicted PV power output on a sunny day. (c) Predicted PV power output on a cloudy day. (d) Predicted PV power output on a rainy day.
As can be seen from the prediction curve graphs, the prediction curves under sunny, cloudy and unclassified conditions all deviate from the normal value the most at midday, and the prediction is easy to make with little error in the morning and afternoon when the PV power varies more regularly. This is a result of the combined effect of the amplification of the difference in module performance during high-irradiation hours and the deviation of the solar incidence angle. On the rainy day, the prediction is more difficult due to the increased fluctuation of the PV power, so the error is higher. However, regardless of the weather conditions, the deviation of the prediction model proposed in this paper from the true value is minimal, reflecting the superior performance of the prediction model. The inherent limitations of the model, the lack of data adaptability and the defects in the training methodology are the core reasons for the errors when BP neural networks are used for PV power prediction. Therefore, in this paper, similar-day classification, VMD decomposition and the black-winged kite optimization algorithm are used to overcome these defects and achieve good results.
This research further compares and analyses its model with other models, with results presented in Table 1 and Table 2. Table 1 and Table 2 demonstrate that the prediction accuracy of the clustered model surpasses that of the unclustered model, and the prediction accuracy of the model refined through sequence decomposition and algorithmic optimization exceeds that of the untreated model. In comparison to the unclustered VMD-BKA-BP model, the NMAE of the clustered VMD-BKA-BP model decreases by 4.70%, 34.24% and 35.44% under sunny, cloudy and rainy weather conditions, respectively. Additionally, the NRMSE is reduced by 14.03%, 19.59% and 44.66%, respectively. The R2 accuracy is not compared further, as it is already significantly high. Similar-day clustering enhances the model’s ability to tune pertinent parameters for more effective training through weather classification. The BKA-BP neural network model demonstrates superior performance with VMD decomposition compared to EMD, achieving NMAE reductions of 65.19%, 72.91% and 72.73%; NRMSE reductions of 65.07%, 67.01% and 69.78%; and increases in R2 of 2.04%, 2.09% and 6.53% for sunny, cloudy and rainy weather conditions, respectively. In comparison to the VMD-PSO-BP model, the VMD-BKA-BP model exhibited 49.47%, 39.38% and 56.56% reductions in NMAE; 55.17%, 43.69% and 56.60% reductions in NRMSE; and increases of 1.12%, 0.54% and 2.73% in R2, demonstrating that the BKA possesses higher optimization capabilities and robustness. Subsequent to the aforementioned investigation, the VMD-BKA-BP neural network prediction model surpasses the other seven prediction model groupings for accuracy and stability.

Table 1.
Model prediction metrics for unclustered days and sunny days.
Table 2.
Mode predicted metrics for cloudy and rainy days.
5. Conclusions
This research proposes a short-term photovoltaic power prediction model utilizing similar-day clustering and a VMD-BKA-BP neural network. The model’s performance is validated using the power generation dataset from a photovoltaic power station located in southern China, leading to the following conclusions:
- The additional categorization of weather types by K-means++ clustering allows the model to refine the pertinent parameters for sunny, cloudy and rainy days, resulting in enhanced training efficiency and increased predictive accuracy.
- The optimization of the decomposition count K and the maximum iteration limit α in the VMD are achieved using the BKA optimization technique. This methodology enables the forecasting model to more effectively comprehend the elements of the time series, hence enhancing the precision and clarity of the predictions.
- To address the issue of diminished prediction accuracy resulting from challenges in identifying important parameters in BP neural networks, the optimization of these parameters by BKA can enhance both the prediction accuracy and stability of the model. Comparative analysis with alternative prediction models demonstrates that the model suggested in this research exhibits enhanced predictive accuracy and robustness.
6. Discussion
The heavy computational burden and long time required for prediction are some of the drawbacks of decomposition prediction methods and neural networks. With the continuous development of PV spot trading, the method defined in this paper will need to further reduce the computational burden in order to meet the demand of high-frequency acquisition. Therefore, reducing the prediction time of the model and finding a better Deep Neural Network structure will be the focus of future research.
Author Contributions
Conceptualization, Y.S. and Z.W.; methodology, Y.S.; validation, Y.S., Z.W. and J.W.; formal analysis, Q.L.; investigation, Y.S.; resources, Z.W.; data curation, Y.S.; writing—original draft preparation, Y.S.; writing—review and editing, Z.W.; supervision, Z.W.; project administration, Z.W. All authors have read and agreed to the published version of the manuscript.
Funding
This research received no external funding.
Data Availability Statement
The data presented in this study are available on request from the corresponding author due to data privacy involving power plants.
Acknowledgments
We thank the School of Electrical and Information Engineering, Beihua University, for providing the test site and the computers used for simulation.
Conflicts of Interest
The authors declare no competing interests.
Abbreviations
The following abbreviations are used in this manuscript:
| Bi-LSTM | Bidirectional Long- and Short-term Memory Network |
| BKA | black-winged kite optimization Algorithm |
| BP | Back Propagation |
| CEEMDAN | Complete ensemble empirical mode decomposition with adaptive noise |
| EMD | Empirical mode decomposition |
| HDN | Hybrid Deep Neural Networks |
| IMF | Intrinsic Mode Function |
| MVMD | Multivariate Variational Mode Decomposition |
| PV | Photovoltaic |
| SHAP | Shapley Additive exPlanations |
| SSA | Sparrow Search Algorithm |
| VMD | Variational mode decomposition |
References
- Yufei, W.; Lu, S.; Hua, X. Photovoltaic output power chaotic characteristic and trend prediction based on the actual measurement data. In Proceedings of the IEEE 11th Conference on Industrial Electronics and Applications (ICIEA), Hefei, China, 5–7 June 2016. [Google Scholar]
- Xuan, J.; Hu, L.; Niu, G.; Fu, X.; Zheng, Q.; Jin, C.; Wu, M. Rooftop Photovoltaic Power Prediction Method Considering the Characteristics of Photovoltaic Blocks. In Proceedings of the 2024 6th International Conference on Energy Systems and Electrical Power (ICESEP), Wuhan, China, 21–23 June 2024. [Google Scholar]
- Scott, C.; Ahsan, M.; Albarbar, A. Machine learning for forecasting a photovoltaic (PV) generation system. Energy 2023, 278, 127807. [Google Scholar] [CrossRef]
- Wang, C.; Yang, B.; Ying, X.; Song, X.; Gao, M. A short-term power prediction method for photovoltaic power generation under non-clear sky conditions. Sol. Energy J. 2022, 43, 188–196. [Google Scholar]
- Gupta, M.; Arya, A.; Varshney, U.; Mittal, J.; Tomar, A. A review of PV power forecasting using machine learning techniques. Prog. Eng. Sci. 2025, 2, 100058. [Google Scholar] [CrossRef]
- Hategan, S.-M.; Stefu, N.; Petreus, D.; Szilagyi, E.; Patarau, T.; Paulescu, M. Short-term forecasting of PV power based on aggregated machine learning and sky imagery approaches. Energy 2025, 316, 134595. [Google Scholar] [CrossRef]
- Dai, H.; Zhen, Z.; Wang, F.; Lin, Y.; Xu, F.; Duić, N. A short-term PV power forecasting method based on weather type credibility prediction and multi-model dynamic combination. Energy Convers. Manag. 2025, 326, 119501. [Google Scholar] [CrossRef]
- Di Leo, P.; Ciocia, A.; Malgaroli, G.; Spertino, F. Advancements and Challenges in Photovoltaic Power Forecasting: A Comprehensive Review. Energies 2025, 18, 2108. [Google Scholar] [CrossRef]
- Santos Ld, O.; AlSkaif, T.; Barroso, G.C.; Carvalho, P.C.M.d. Photovoltaic power estimation and forecast models integrating physics and machine learning: A review on hybrid techniques. Sol. Energy 2024, 284, 113044. [Google Scholar] [CrossRef]
- Fan, S.; Geng, H.; Zhang, H.; Yang, J.; Hiroichi, K. Photovoltaic power forecasting model employing epoch-dependent adaptive loss weighting and data assimilation. Sol. Energy 2025, 290, 113351. [Google Scholar] [CrossRef]
- Deng, R.; Wang, Y.; Xu, P.; Luo, F.; Chen, Q.; Zhang, H.; Chen, Y.; Zhang, D. A high-precision photovoltaic power forecasting model leveraging low-fidelity data through decoupled informer with multi-moment guidance. Renew. Energy 2025, 250, 123391. [Google Scholar] [CrossRef]
- Khouili, O.; Hanine, M.; Louzazni, M.; Flores, M.A.L.; Villena, E.G.; Ashraf, I. Evaluating the impact of deep learning approaches on solar and photovoltaic power forecasting: A systematic review. Energy Strategy Rev. 2025, 59, 101735. [Google Scholar] [CrossRef]
- Liu, H.; Cai, C.; Li, P.; Tang, C.; Zhao, M.; Zheng, X.; Li, Y.; Zhao, Y.; Liu, C. Hybrid prediction method for solar photovoltaic power generation using normal cloud parrot optimization algorithm integrated with extreme learning machine. Sci. Rep. 2025, 15, 6491. [Google Scholar] [CrossRef] [PubMed]
- Kumar, A.; Kashyap, Y.; Rai, A. An integrated frequency domain decomposition and deep neural network approach for short-term PV power forecast. Electr. Eng. 2024, 24, 282–303. [Google Scholar] [CrossRef]
- Guo, W.; Sun, S.; Tao, P.; Xu, J.; Bai, X. Short-term photovoltaic power prediction based on multi-variational mode decomposition and hybrid deep neural network. Sol. Energy J. 2024, 45, 489–499. [Google Scholar]
- Qu, Z.; Qin, S.; Xiong, G.; Zhu, X.; Ling, F.; Wang, Y.; Kong, J. Short-Term Power Prediction of a Photovoltaic Power Station Based on the SSA-CEEMDAN-FCN Model. Comput. Intell. Neurosci. 2022, 2022, 6486876. [Google Scholar] [CrossRef]
- Kang, Y.; Lanqing, L.; Yifeng, L.; Dongkuo, S.; Bolun, W.; Jin, C.; Xia, Z.; Yu, S. A novel distributed photovoltaic power output interval prediction method. Power Gener. Technol. 2024, 45, 684–695. [Google Scholar]
- Liu, L.; Zhang, J.; Xue, S. Photovoltaic power forecasting: Using wavelet threshold denoising combined with VMD. Renew. Energy 2025, 249, 123152. [Google Scholar] [CrossRef]
- Wang, Z.; Ying, Y.; Kou, L.; Ke, W.; Wan, J.; Yu, Z.; Liu, H.; Zhang, F. Ultra-Short-Term Offshore Wind Power Prediction Based on PCA-SSA-VMD and BiLSTM. Sensors 2024, 24, 444. [Google Scholar] [CrossRef]
- Ait Mansour, A.; Tilioua, A.; Touzani, M. Bi-LSTM, GRU and 1D-CNN models for short-term photovoltaic panel efficiency forecasting case amorphous silicon grid-connected PV system. Results Eng. 2024, 21, 101886. [Google Scholar] [CrossRef]
- Yang, R. Short-Term Photovoltaic Power Forecasting Based on Cluster Ensemble Analysis and Deep Learning Algorithms. Master’s Thesis, Xi’an University of Technology, Xi’an, China, 30 June 2023. [Google Scholar]
- Chen, Y.; Chen, X. Short-term photovoltaic power generation prediction based on adaptive K-means and LSTM. Electr. Meas. Instrum. 2023, 60, 94–99. [Google Scholar]
- Shen, M.; An, Z.; Zhao, L. Research on a Short term Power Prediction Method for Photovoltaic Power Generation. In Proceedings of the 2024 4th Power System and Green Energy Conference (PSGEC), Shanghai, China, 22–24 August 2024. [Google Scholar]
- Liu, J.; Wang, H.; Hao, T. Short-Term Photovoltaic Power Prediction Based on Bayesian Regularized BP Neural Networks. In Proceedings of the 2023 6th International Conference on Electrical Engineering and Green Energy (CEEGE), Grimstad, Norway, 6–9 June 2023. [Google Scholar]
- Huang, Y.; Chen, S.; Tan, X.; Hu, M.; Zhang, C. Power Prediction Method of Distributed Photovoltaic Digital Twin System Based on GA-BP. In Proceedings of the 2022 4th International Conference on Electrical Engineering and Control Technologies (CEECT), Shanghai, China, 16–18 December 2022. [Google Scholar]
- Wang, Z.; Liu, H.; Wu, S.; Liu, N.; Liu, X.; Hu, Y.; Fu, Y. Explainable time-varying directional representations for photovoltaic power generation forecasting. J. Clean. Prod. 2024, 468, 143056. [Google Scholar] [CrossRef]
- Fu, J.; Sun, Y.; Li, Y.; Wang, W.; Wei, W.; Ren, J.; Han, S.; Di, H. An investigation of photovoltaic power forecasting in buildings considering shadow effects: Modeling approach and SHAP analysis. Renew. Energy 2025, 245, 122821. [Google Scholar] [CrossRef]
- Zhai, C.; He, X.; Cao, Z.; Abdou-Tankari, M.; Wang, Y.; Zhang, M. Photovoltaic power forecasting based on VMD-SSA-Transformer: Multidimensional analysis of dataset length, weather mutation and forecast accuracy. Energy 2025, 324, 135971. [Google Scholar] [CrossRef]
- Wang, K.; Tian, J.; Zheng, C.; Yang, H.; Ren, J.; Liu, Y.; Han, Q.; Zhang, Y. Interpretable prediction of 3-year all-cause mortality in patients with heart failure caused by coronary heart disease based on machine learning and SHAP. Comput. Biol. Med. 2021, 137, 104813. [Google Scholar] [CrossRef] [PubMed]
- Liu, H.; Chen, J.; Dy, J.; Fu, Y. Transforming Complex Problems Into K-Means Solutions. IEEE Trans. Pattern Anal. Mach. Intell. 2023, 45, 9149–9168. [Google Scholar] [CrossRef] [PubMed]
- Qin, H.; Huang, L.; Li, K.; Cheng, G. Short-Term Offshore Wind Power Prediction based on VMD-SE-BP Neural Network Model. In Proceedings of the 2024 IEEE 2nd International Conference on Power Science and Technology (ICPST), Yunnan, China, 9–11 May 2024. [Google Scholar]
- Zhang, X.; Wang, X.; Li, H.; Sun, S.; Liu, F. Monthly runoff prediction based on a coupled VMD-SSA-BiLSTM model. Sci. Rep. 2023, 13, 13149. [Google Scholar] [CrossRef]
- Li, Y.; Shi, B.; Qiao, W.; Du, Z. A black-winged kite optimization algorithm enhanced by osprey optimization and vertical and horizontal crossover improvement. Sci. Rep. 2025, 15, 6737. [Google Scholar] [CrossRef]
- Wang, Z.; Wu, J.; Wang, H.; Wang, H.; Hao, Y. Optimal Underwater Acoustic Warfare Strategy Based on a Three-Layer GA-BP Neural Network. Sensors 2022, 22, 9701. [Google Scholar] [CrossRef]
- Zhang, Y.; Kong, L. Photovoltaic power prediction based on hybrid modeling of neural network and stochastic differential equation. ISA Trans. 2022, 128 Pt B, 181–206. [Google Scholar] [CrossRef]
- Tahir, M.F.; Tzes, A.; Yousaf, M.Z. Enhancing PV power forecasting with deep learning and optimizing solar PV project performance with economic viability: A multi-case analysis of 10 MW Masdar project in UAE. Energy Convers. Manag. 2024, 311, 118549. [Google Scholar] [CrossRef]
Disclaimer/Publisher’s Note: The statements, opinions and data contained in all publications are solely those of the individual author(s) and contributor(s) and not of MDPI and/or the editor(s). MDPI and/or the editor(s) disclaim responsibility for any injury to people or property resulting from any ideas, methods, instructions or products referred to in the content. |
© 2025 by the authors. Licensee MDPI, Basel, Switzerland. This article is an open access article distributed under the terms and conditions of the Creative Commons Attribution (CC BY) license (https://creativecommons.org/licenses/by/4.0/).