Abstract
The field of remote sensing target detection has experienced rapid development in recent years, demonstrating significant value in various applications. However, general detection algorithms still face many key challenges when dealing with directional target detection: firstly, conventional networks struggle to accurately represent features of rotated targets, particularly in modeling the slender shape characteristics of high-aspect-ratio targets; secondly, the mismatch between the static label allocation strategy and the feature space of dynamic rotating targets leads to bias in training sample selection under extreme-aspect-ratio scenarios. To address these issues, this paper proposes a single-stage Shape-Aware Dynamic Alignment Network (SADA-Net) that collaboratively enhances detection accuracy through feature representation optimization and adaptive label matching. The network’s design philosophy demonstrates greater flexibility and complementarity than that of previous models. Specifically, a Dynamic Refined Rotated Convolution Module (DRRCM) is designed to achieve rotation-adaptive feature alignment. An Anchor-Refined Feature Alignment Module (ARFAM) is further constructed to correct feature-to-spatial misalignment. In addition, a Shape-Aware Quality Assessment (SAQA) strategy is proposed to optimize sample matching quality based on target shape information. Experiment results demonstrate that SADA-Net achieves excellent performance comparable to state-of-the-art methods on three widely used remote sensing datasets (i.e., HRSC2016, DOTA, and UCAS-AOD).
1. Introduction
With the swift progress of deep learning, the enhanced feature extraction ability of convolutional neural networks has further facilitated advancements in remote sensing object detection [1,2,3,4,5]. As one of the core research directions in the field of computer vision, this field plays a crucial role in real-world applications such as disaster monitoring, urban planning, and military reconnaissance. The primary objective is to accurately identify, classify, and localize targets of interest within remote sensing imagery [6,7,8], enabling timely decision-making and situational awareness across various domains. In remote sensing images, targets are mostly oriented differently and arranged closely [9,10], which makes the adaptability of general object detection frameworks poor. The horizontal anchor boxes often contain a lot of background interference and result in the problem of multiple targets being selected simultaneously, leading to a significant decline in detection performance. Therefore, how to effectively detect oriented objects in remote sensing images has become a current research hotspot. Recently, several works have aimed to enhance the representation of oriented bounding boxes in remote sensing object detection. This is mainly achieved by developing specialized detection frameworks, such as R3Det [11], Rotated RetinaNet [12], and RoI Transformer [13], as well as oriented box encoding techniques, such as sliding vertex offset [14], short side offset [15], and midpoint offset box encoding [16]. In addition, to further improve the performance of these methods, researchers have also proposed a variety of loss functions, including CSL [17], KLD [18], and KFIoU [19].
Although the above methods exhibit high precision in detecting most targets, the detection accuracy for certain specific types of targets (e.g., bridges, ports, ships, etc.) is still unsatisfactory. We believe that the root of the problem lies in the fact that existing methods overlook the differences in shape information between different types of targets, especially the distinction between high-aspect-ratio targets and regularly shaped targets. Here, the shape information we mentioned refers to the ratio of the long side to the short side of the ground-truth bounding box of the target object, which can be intuitively represented by a mathematical formula: , where w and h represent the width and height of the ground-truth bounding box, respectively, and the value range of SI is (0,1]. We classify all objects into two categories, with 1 > SI > for regularly shaped targets and SI ≤ for high-aspect-ratio targets, as shown in Figure 1.
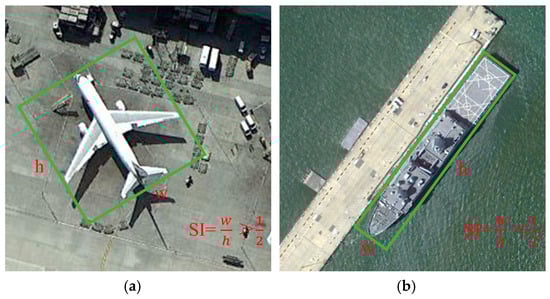
Figure 1.
Shape information distinction. The green box represents the ground-truth bounding box. w, h denote the width and height of the ground-truth bounding box, SI represents the shape information, SI greater than one-half indicates a regularly shaped target, and SI less than one-half is expressed as a high-aspect-ratio target. (a) Regularly shaped target (b) High-aspect-ratio target.
Existing methods perform well in detecting regularly shaped targets, but when faced with rotated targets with large aspect ratio variations, the detection accuracy significantly decreases. There are two main reasons for this:
(1) Feature misalignment: The convolutional features of traditional backbone networks are usually aligned based on fixed receptive field orientations, making it difficult to adapt to directionally oriented targets with high aspect ratio differences, resulting in poor feature extraction effects. Even if convolutional alignment or anchor box alignment operations are introduced in subsequent steps, they cannot compensate for the loss of local edge information of the target caused by the initial fixed convolution method, thereby affecting the overall quality of feature extraction. This is because all subsequent operations, such as feature fusion and resampling, are based on the feature maps extracted by the initial backbone network. Therefore, in the object detection framework, the backbone network that initially extracts target features is crucial for improving model accuracy.
(2) Static label allocation: In the process of anchor box regression, high-aspect-ratio rotated targets are extremely sensitive to angle regression. Even a slight angular deviation can cause a significant increase in the deviation between the predicted and ground truth boxes, especially when the shape information value is small, as shown in Figure 2. This situation leads to an increase in false negatives during sample selection. Even with high classification scores, due to poor regression performance, Intersection over Union (IoU) between the predicted and ground truth boxes is below the preset threshold, causing targets that should be positive samples to be misclassified as negative samples. This misclassification results in an imbalance between positive and negative samples, which in turn negatively affects the overall detection performance.
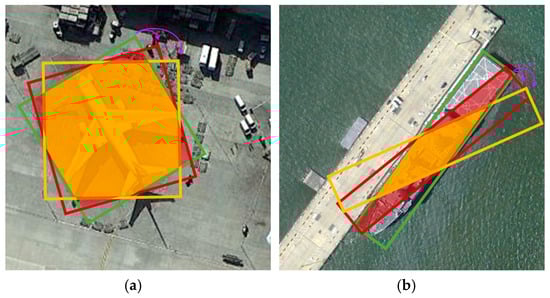
Figure 2.
In (a,b), the green boxes represent the ground-truth bounding boxes, while the burgundy and yellow boxes represent the predicted boxes rotated by 15° and 30°, respectively. The overlapping areas of the burgundy and yellow boxes indicate IoU with the ground-truth bounding boxes. It is evident that the impact of the rotation angle on ships with a high aspect ratio is much greater than that on planes with regular shapes.
To address this challenge, we approach from two aspects: high-quality feature extraction and rational label allocation. We believe that high-quality feature extraction is the foundation of oriented object detection, while rational label allocation can further enhance the detection performance. We propose a single-stage Shape-Aware Dynamic Alignment Network (SADA-Net), which consists of two modules and one matching strategy: Dynamic Refined Rotation Convolution Module (DRRCM), Anchor Refinement Feature Alignment Module (ARFAM), and Shape-Aware Quality Assessment (SAQA) matching strategy. Specifically, the DRRCM in the backbone network can accurately predict the weight and angle of the rotational convolution kernel using the Data-Enhanced Spatial Attention Module (DESAM). Subsequently, the predicted parameters are combined to generate a convolution kernel that adaptively adjusts according to the pose information of the oriented target, achieving accurate alignment with the target features and producing direction-sensitive feature maps. The ARFAM in the detection head quickly generates high-quality modified prediction anchor boxes on the direction-sensitive feature map through the regression branch, serving as guidance to dynamically adjust the position of the feature sampling points, thus further achieving precise feature alignment. High-quality directionally adaptive features are extracted through the collaborative work of the double alignment convolution module. In the label allocation process, based on the high-quality feature maps and modified prediction anchor boxes generated above, the SAQA method dynamically adjusts the IoU threshold based on the target’s shape information for training sample selection and calculates the centroid-adaptive distance to add quality information to the selected positive samples, thereby optimizing the training sample selection. Experiments conducted on commonly used public datasets such as HRSC2016, DOTA, and UCAS-AOD demonstrate that our method can maintain good detection performance.
The main contributions of this paper can be summarized as follows:
1. We propose a novel object detection framework, SADA-Net, to generate high-quality directionally adaptive features and regression prediction anchor boxes and couple efficient sample selection strategies to obtain excellent detection performance.
2. A flexible dynamic rotation convolution module is proposed, which can be easily embedded into the backbone networks of many detectors to extract high-quality basic features for oriented targets.
3. A reasonable sample matching strategy, using sample shape information and potential sample quality to optimize training samples, thus solving the inconsistency between classification and regression.
2. Related Work
2.1. Remote Sensing Object Detection
Objects in natural scenes mostly exhibit characteristics such as arbitrary orientations, significant scale variations, and dense distributions [10,20]. General object detection methods using horizontal anchors face the same issue, as their horizontal bounding box localization fails to accurately describe the pose diversity of remote sensing targets. To enable detectors to precisely detect oriented objects, researchers have proposed methods like angle prediction and preset rotated anchor boxes to improve regression, albeit with increased computational complexity. Ma et al. [21] proposed the Rotated Region Proposal Network (RRPN), which introduces rotated candidate boxes into the Region Proposal Network (RPN) architecture to detect tilted or non-axis-aligned targets. They adopt (x, y, w, h, θ) as positional parameters for rotated bounding boxes, generating anchor boxes with varying scales, aspect ratios, and rotation angles. Fine-tuning these parameters yields angle-aware candidate regions. Ding et al. [13] designed the RoI Transformer, which uses a lightweight fully connected layer to learn geometric parameters of Rotated Regions of Interest (RRoI) from Horizontal Regions of Interest (HRoI), effectively avoiding the need to design numerous RRoIs for oriented object detection. Xu et al. [14] generated rotated anchor boxes by sliding the four vertices of horizontal anchor boxes. Xie et al. [16] proposed the midpoint offset method, displacing the midpoints of the upper and right edges of horizontal anchor boxes and refining them to obtain more accurate rotated anchor boxes. Compared to these methods, the proposed SADA-Net improves the feature representation of the entire network. First, the DRRCM in the backbone network generates direction-sensitive features, significantly reducing the complexity of modeling oriented targets. Second, the ARFAM in the detection head further refines features to efficiently extract discriminative and semantic features of target boundaries. Finally, the high-quality feature maps are dynamically assigned labels through the SAQA matching strategy, effectively alleviating the inconsistency between regression and classification.
2.2. Feature Extraction for Object Detection
Feature extraction is a crucial component of object detection, as the effectiveness of feature extraction by the network directly impacts the quality of model training. Azimi et al. [22] designed an image cascade network that generates four input images of different scales through bilinear interpolation, enabling the model to extract multi-scale features. Liu et al. [23] added convolutional modules after each stage of Swin-Transformer [24], combining the local properties of CNNs with the global properties of Transformers to extract richer foundational features. Sun et al. [25] introduced a feedback connection into the feature fusion network to enhance the model’s ability to represent multi-scale features. Chalavadi et al. [26] proposed a multi-scale object detection network (mSODANet) that uses parallel dilated convolutions to construct a hierarchical structure, extracting contextual features of different objects at multiple scales and fields of view. LMO-YOLO [27] proposed a multi-linear scaling method and introduced dilated convolutions to maintain a large receptive field, combined with multi-scale feature fusion to enhance feature learning capability. To extract refined features, Zheng et al. [28] proposed a Feature Pyramid Transformer (FPT), which transforms, rearranges, concatenates, and convolves features within the feature pyramid. However, these methods still struggle to achieve satisfactory detection performance when handling complex and diverse oriented targets. Unlike the aforementioned approaches, we propose a dual-layer feature alignment technique. First, the DRRCM adaptively adjusts convolutional kernels based on the pose information of oriented targets to achieve preliminary alignment of target features. Second, the ARFAM dynamically adjusts the positions of feature sampling points guided by refined predicted anchor boxes, further enhancing convolutional alignment. These two convolution techniques work collaboratively at different stages, effectively addressing the spatial inconsistency between axial convolution features and objects in arbitrary orientations, thereby extracting high-quality directionally adaptive features.
2.3. Sample Selection for Object Detection
In detection networks, high-quality feature extraction is undoubtedly crucial as it provides a solid foundation for subsequent model training. However, the sample selection process is equally critical, exerting a decisive influence on both training efficacy and final detection performance. Most object detectors conventionally adopt fixed IoU threshold-based matching strategies to select positive and negative samples during training [29]. However, this fixed metric approach often demonstrates poor adaptability when confronted with significant inter-sample variations—such as target scale diversity, shape variability, and background complexity—leading to suboptimal detection outcomes [30]. Consequently, dynamic sample selection strategies have gained increasing attention. Li et al. [31] proposed an Adaptive Points Assessment and Assignment (APAA) scheme, which dynamically selects the top-k samples with the highest quality scores as positive training samples by evaluating point sets across four dimensions: classification quality, localization accuracy, orientation consistency, and point correlation. Ming et al. [32] introduced Dynamic Anchor Learning (DAL), which comprehensively evaluates the localization potential of anchors through dynamic assignments based on predefined matching scores. AR-BCL [33] employs aspect ratio-based bidirectional encoded labels to address the detection problem of near-square objects. Zeng et al. [34] proposed an angle classification method, AR-CSL, which introduces the SkewIoU values of objects with different aspect ratios under angular deviations for label smoothing, thereby achieving more reasonable angle label modeling. This paper employs the SAQA method for label assignment, which comprehensively integrates the target’s shape information and center-point information to enable more flexible sample selection.
3. Methodology
The overall architecture of SADA-Net is illustrated in Figure 3. First, it adopts the DRRCM as the backbone network to dynamically adjust convolutional kernels for aligning arbitrarily oriented objects, thereby extracting preliminary aligned features. Subsequently, the ARFAM performs anchor refinement to guide convolutions in acquiring more precise aligned features. Finally, leveraging the high-quality feature maps and refined anchor boxes generated through the above stages, the SAQA strategy dynamically assigns labels and evaluates sample quality, ensuring optimal matching between candidate boxes and their corresponding ground-truth labels. This approach effectively avoids the inconsistency between regression and classification, thereby enhancing detection performance. The detailed implementation of SADA-Net is elaborated below.
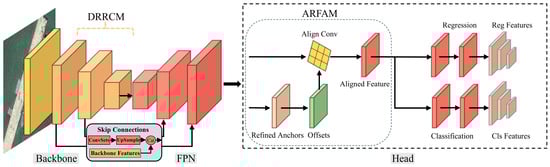
Figure 3.
Proposed SADA-Net architecture.
3.1. Dynamic Refined Rotation Convolution Module
In most existing remote sensing object detectors, the convolutional structures used in the backbone network adopt axis-aligned or preset fixed rotation angles for feature extraction of targets. However, objects in natural scenes are often placed at arbitrary angles. Therefore, standard convolutional kernels struggle to precisely match the contours of non-axis-aligned targets, making it difficult to effectively extract high-quality features from these arbitrarily oriented objects.
In order to avoid the fixed convolution mode of standard convolution and enhance the representation ability of the target, thus achieving accurate object detection. We propose a Dynamic Refined Rotation Convolution Module (DRRCM). The overall structure of DRRCM is shown in Figure 4 below.
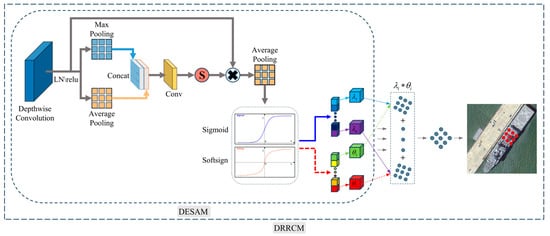
Figure 4.
Illustration for the DRRCM module.
We designed a Data-Enhanced Spatial Attention Module (DESAM) to generate a spatial mask through pooling, concatenation, convolution transformation, and sigmoid activation function to weight the fused features and highlight the important spatial regions. Then, the weighted fused features are average pooled and input into the kernel angle prediction branch and the kernel weight prediction branch. This module can make the network more accurately focus on the key feature positions in rotating object detection and then accurately generate the predicted weights and angles of the rotating kernels.
Specifically, we first efficiently capture spatial relationships by applying channel-wise average pooling and max pooling (denoted as and , respectively) to the feature map F obtained from depthwise convolution:
where Savg and Smax are the spatial feature descriptors obtained through average pooling and max pooling, respectively. To facilitate the information interaction between different spatial descriptors, the concatenated pooled features (with 2 channels) are transformed into Cin spatial attention maps using a convolutional layer .
where Cin represents the number of input channels. For each spatial attention map , a sigmoid activation function is applied to obtain an individual spatial mask for each convolutional kernel.
Then, the spatial masks are used to weight the features after depthwise convolution, which are subsequently compressed into a C-dimensional feature vector through global average pooling .
Then, the pooled feature vectors are sent into two branches, respectively.
The first branch predicts the rotation kernel angle, where the feature vector is input into this branch and processed through Dropout, a linear layer, Softsign activation, and multiplication by a scale factor to obtain a set of angles :
where is the linear layer without a bias term, ensuring that angle prediction depends solely on variations in the input features and avoids learning biased angles. is a scaling factor used to expand the rotation range, and the parameter is used to adjust the angle range, with a default value of 40.
The second branch is for rotating kernel weight prediction. By inputting the feature vectors into this branch and through Dropout, a linear layer, and Sigmoid activation, a set of weights are obtained.
where is a bias set for the linear layer to improve the flexibility of the model.
DESAM is initialized from a truncated normal distribution with a mean of zero and a standard deviation of 0.2 in order to assist the model in converging more rapidly and to reduce instability at the beginning of training. The implementation of the rotational convolution function is elaborated on below.
The rotation angle parameter generated by the above DESAM prediction reparameterizes the weights inside the convolution kernel, allowing the convolution kernel to dynamically adjust according to different input feature maps, achieving adaptive rotation:
which represents the coordinates of the original sampling points. represents the new sampling point coordinates after the original sampling point is rotated counterclockwise by an angle to achieve the convolution kernel and feature alignment. represents the reparameterized convolution kernel. represents the bilinear interpolation, which is used to calculate the weight value of the new position after the rotation of the convolution kernel.
The reparameterized convolution kernel is then multiplied by the corresponding λi weight and summed, and then convolved with the input feature map to finally generate high-quality direction-aware features Y:
Through the DRRCM, the convolution kernel can adaptively adjust according to the different orientations of objects in the input feature map, thereby efficiently capturing the features of multi-directional objects in the image. Especially when detecting objects in aerial images that are densely arranged and have large scale differences, high-quality feature extraction is crucial for accurate classification and precise localization.
3.2. Anchor Refinement Feature Alignment Module
Based on the high-quality feature maps generated by DRRCM in the backbone network, Anchor Refinement Feature Alignment Module (ARFAM) is employed to further refine anchor points through a regression operation. The refined anchor parameters are then used to compute an offset field, enabling the dynamic adjustment of aligned convolution sampling points. This process generates feature representations that are more precisely aligned with the target object, as shown in Figure 5.
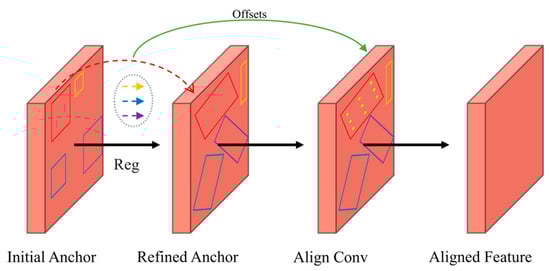
Figure 5.
Illustration of the ARFAM module.
First, unlike most dense anchor sampling methods, we only preset a single initial square anchor at each position on the feature map. This anchor is then refined into a high-quality oriented anchor through the regression branch, thus reducing the need to preset a large number of anchors on the feature map, which helps to reduce computational complexity. The offset for predicting the anchor box regression target is as follows:
where (x,y,w,h,θ) represent the center coordinates, width, height, and angle parameters of the initial anchor. (xg,yg,wg,hg,θg) represent the parameters (same as above) of the ground-truth bounding box. (Δxg,Δyg,Δwg,Δhg,Δθg) represent the offsets between the ground-truth bounding box and the initial anchor. By regressing these offsets, the model can adjust the initial anchor to a corrected predicted anchor box that is closer to the ground-truth bounding box. R(θ) represents the rotation transformation matrix used to convert the center coordinates of the ground-truth bounding box to the coordinate system relative to the initial anchor. K is the scaling factor used to adjust the angle value, ensuring that the rotation angle remains within a reasonable range.
Secondly, in order to achieve feature extraction for the oriented target, we adjust the feature sampling point position to realize dynamic convolution alignment guided by the modified prediction anchor box. This method adds an offset calculated from the modified prediction anchor box to the original sampling points of the standard convolution:
Here, S denotes the stride, and c, w, and h represent the corrected predicted anchor box’s center coordinates (cx,cy), width, and height. denotes the position of the conventional sampling point for standard convolution, with and representing the two-dimensional coordinates and relative offset of this sampling point, respectively. R signifies the regular grid of standard convolution; for instance, would indicate a 3 × 3 convolution kernel with a dilation rate of 1.
Then, the dynamic alignment convolution combines the offset and input features x such that the sampled point location can be adjusted based on the shape and orientation of the predicted anchor box to better match the geometry of the actual target.
where represents the value of the output feature map at position . is the weight of the convolutional kernel at position . represents the input feature map.
The model is able to extract high-quality feature representations from the input image through a dual-layer feature alignment technique. Its backbone network dynamically refines the preliminary feature extraction of rotational convolution, and the anchor point refinement feature alignment convolution in the detection head further refines the features. These features not only contain the basic information of the target but are also enhanced at the detail level, providing an effective feature basis for subsequent positioning.
3.3. Shape-Aware Quality Assessment
In previous sections, we introduced the extraction of sensitive features with coding direction information in SADA-Net and its further alignment feature refinement process after anchor box correction, but in the actual training process of the model, it was found that there are still problems of inconsistency between regression and classification tasks, that is, high classification scores cannot guarantee the accurate positioning of detection. This problem has been widely studied in many articles [35,36,37], and some discussions are traced back to the uncertainty of bounding box regression and localization [37]. We believe that the bias between classification and regression primarily stems from the unreasonable selection of training samples, and we further solve this problem from the perspective of utilizing target shape information and evaluating sample quality.
Most of the existing detectors usually select positive anchors for training according to a fixed IoU threshold between the anchor and the ground-truth bounding box [29]. However, such sample selection methods often ignores the shape information of the target and fails to make potential distinctions in the quality of the selected positive samples.
To address the above issue, we employ the shape-aware quality assessment (SAQA) method in the training stage. The implementation of this method is introduced in detail in the following parts of this section.
Specifically, firstly, the IoU threshold is adaptively adjusted according to the shape information of the target, and dynamic sample selection is realized. The formula is as follows:
where represents the IoU threshold for dynamically selecting samples. represents the mean IoU value of the candidate samples. represents the standard deviation of the IoU values of the candidate samples. is the weighting parameter used to control the influence of aspect ratio on the weight factor. SI represents the shape information of the target.
Then, the selected positive samples are refined by introducing centroid-adaptive distance to evaluate the location and add the quality information. In detail, the centroid-adaptive distance value is calculated using Euclidean distance from sample point to object center and the side length information of the object.
where (xi,yi) represents the center coordinates of the ground-truth bounding box, (xj,yj) represents the coordinates of the sample point, and hi and wi represent the height and width of the ground-truth bounding box, respectively.
Next, after obtaining the centroid-adaptive distance value, the quality score Qij of the positive sample is calculated.
In this way, the quality of samples is distinguished by introducing centroid-adaptive distance. The smaller the distance value, the closer the sample point is to the target center, and the higher its quality score. Therefore, using this distance value allows for a more accurate evaluation of each positive sample’s quality, thereby optimizing the sample selection process.
The SAQA method fully utilizes the geometric properties of the target and the potential quality of the samples, ensuring the reasonable selection of positive samples during the training process. This improves the consistency between regression and classification, thereby enhancing the overall performance of the detector.
4. Experiments and Analysis
4.1. Datasets
The experiments were conducted on three publicly available high-resolution remote sensing datasets: HRSC2016, DOTA, and UCAS-AOD.
The HRSC2016 dataset, released by Liu et al. [38] in 2016, is a dataset for optical remote sensing image ship detection. It consists of images collected from Google Earth of six iconic harbor locations, containing only two types of scenes: offshore and nearshore ships. The dataset comprises 1061 images with a total of 2976 object instances. The spatial resolution of the images ranges from 0.4 to 2 m, with pixel dimensions varying from 300 × 300 to 1500 × 900. In our experiments, all images are resized to 512 × 800 pixels. A total of 617 images are utilized for model training, with 436 and 181 images allocated to the training and validation sets, respectively, while the remaining 444 images are used for testing.
The DOTA dataset, proposed by Xia et al. [39] in 2018, is a large-scale benchmark dataset for aerial image object detection tasks. The dataset includes 2806 high-resolution aerial images with original image resolutions ranging from 800 × 800 to 4000 × 4000 pixels, containing 188,282 finely annotated instances. It covers 15 object categories: airplane (PL), baseball field (BD), bridge (BR), ground track field (GTF), small vehicle (SV), large vehicle (LV), ship (SH), tennis court (TC), basketball court (BC), tank (ST), soccer field (SBF), roundabout (RA), harbor (HA), swimming pool (SP), and helicopter (HC). To evaluate the model’s adaptability to different scales, we conducted both single-scale and multi-scale training. In the single-scale training, images were cropped with a stride of 824 pixels. For multi-scale training, images were first rescaled using three scaling factors (0.5, 1.0, and 1.5), followed by cropping at each scale with a consistent stride of 512 pixels. Ultimately, all original images were segmented into 1024 × 1024 pixel patches.
The UCAS-AOD dataset, released by Zhu et al. [40] in 2015, is an remote sensing dataset for oriented aircraft and vehicle detection, containing 1510 images collected from Google Earth. It includes a total of 1000 images of airplanes and 510 images of vehicles, with an approximate resolution of 659 × 1280 pixels and 14,596 instances. The dataset has not been officially divided by the authors. We randomly divided it into a test set with 453 images, a validation set with 302 images, and a training set with 755 images.
4.2. Implementation Details
In the proposed SADA-Net, the backbone network adopts ResNet-50 [41], and we introduce our designed DRRCM to extract features within its structure. We use feature pyramids from P3 to P7 for detecting multi-scale targets. For each feature point on the feature map, only one regression anchor is set, and the scale is four times the total stride size. Data augmentation includes random flipping and random rotation. Our weight decay and momentum are set to 0.0001 and 0.9, respectively. The model is trained using the SGD optimizer with an initial learning rate of 0.0025. The model is trained for 36 epochs on the HRSC2016 dataset, 12 epochs on the DOTA dataset, and 72 epochs on the UCAS-AOD dataset. Ablation studies are conducted on the HRSC2016 dataset, as it mainly focuses on detecting ships in remote sensing images, which have significant aspect ratio and scale variations, making it more suitable for testing the detection performance of our model. In the ablation study, all images are resized to 512 × 800 for training. To ensure a fair comparison with other methods, the mAP metric defined in the PASCAL VOC 2007 challenge [42] is used across all three datasets. We use the MMDetection [43] toolbox to train the model on an RTX 2080Ti GPU, with a total batch size of 2. Each experiment is conducted multiple times, and the stable value is taken as the final result.
4.3. Ablation Studies
4.3.1. Evaluation of Different Components
To analyze the impact of different components designed in SADA-Net, we conducted experiments on the HRSC2016 dataset using a controlled variable approach. All experiments were performed with the same settings to ensure the rigor of the experiments. The experimental results for each component are shown in Table 1. Using only the DRRCM, the detection performance improved by 1.79% compared to the baseline, indicating that DRRCM can more effectively extract high-quality feature representations for accurate detection performance. When both DRRCM and ARFAM were used, the detection performance reached 84.89% mAP, an improvement of 9.67%, which demonstrates that even with just one preset anchor point, guiding the convolutional feature alignment using high-quality corrected anchors can further efficiently extract high-quality feature representations while optimizing the anchor points. This indicates that these two methods not only do not conflict but also progressively extract higher-quality feature representations in a more effective manner, significantly improving detection performance. When all three components—DRRCM, ARFAM, and SAQA—were used, the detection performance improved by an additional 4.69%. It is clear that in the label assignment process, SAQA made reasonable sample selections based on the high-quality feature map and optimized anchor boxes, ultimately achieving 89.58% mAP, an improvement of 17.94% over the baseline, proving the effectiveness of our framework. Some heatmap visualization results, as shown in Figure 6, intuitively demonstrate that our network can respond more accurately to the target object region compared to the baseline model.

Table 1.
Influence of each component of SADA-Net.
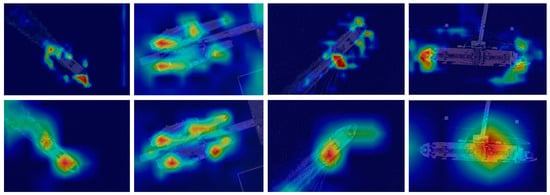
Figure 6.
Heatmap visualization. The first row represents RetinaNet, while the second row corresponds to our SADA-Net.
4.3.2. Effectiveness Evaluation of DRRCM
To evaluate the effectiveness of our designed DRRCM, we conducted comparative experiments on the HRSC2016 dataset for the backbone integrated with different DRRCMs. In the experiment, we compared the performance of the standard convolution module based on ResNet-50 backbone with several different versions of the backbone integrated with DRRCM. The experimental results are shown in Table 2. We replaced all 3 × 3 standard convolution modules in 3 residual blocks of Stage4 of ResNet-50 with DRRCM, and it can be seen that the detection effect was improved by 0.29%, which indicates that the DRRCM we proposed can better extract object features. Further, by replacing all 3 × 3 standard convolution modules in 3 and 6 residual blocks corresponding to Stage4 and Stage3 of ResNet-50 with DRRCM, the detection effect was further improved to 72.66%. This fully demonstrates the continuous improvement of detection performance brought by the multi-level optimization capture of target features with the expansion of the DRRCM integration range. Finally, when we replaced all 3 × 3 standard convolution modules in 3, 6 and 4 residual blocks corresponding to the last three stages of ResNet-50 with DRRCM, the final detection effect reached 73.43% mAP, which is a 1.79% improvement over the baseline backbone without replacement. These experimental results fully verify the advantages of DRRCM in improving object detection performance.
Table 2.
Ablation study on the proposed DRRCM.
4.3.3. Evaluation of the Effect of ARFAM
We explored the effects of using different numbers of ARFAM on the network design. The experimental results are shown in Table 3. Through experiments, we conclude that ARFAM can improve the detection performance of SADA-Net, but more modules are not better. The number of ARFAMs is set to 2, and the detection effect is the best, reaching an mAP of 89.58%. When the number of ARFAMs continues to increase from 2 to 3–4, the detection effects decrease by 0.15% and 0.64%, respectively, and it can be seen that the performance of the model shows a trend of slow decline. We speculate that a deeper network structure does not bring the expected improvement for small object detection that requires a small receptive field. On the contrary, a deeper network may lead to an excessively large receptive field, so that the spatial information of small targets is over-fused, and important local details are lost, thereby affecting the detection effect of small targets.
Table 3.
Ablation study for ARFAM.
4.3.4. Effectiveness Evaluation of SAQA
We compare the detection performance of different label matching strategies on the SADA-Net structure. The results in Table 4 show that our proposed SAQA label matching method achieves the best performance in the object detection task. Compared with the traditional MaxIoU method, SAQA improves the mAP by 8.53% and also improves the mAP by 1.79% compared to the ATSS method. SADA-Net has strong feature expression ability and can efficiently extract high-quality rotation invariant features. The built-in SAQA method combines the shape information of the target on this basis, adaptively adjusts the IoU threshold and evaluates the sample quality information, and effectively improves the matching quality of positive samples, thus optimizing the consistency of classification and localization, further improving the overall detection performance. The experimental results verify the key role of SAQA in the SADA-Net structure, which significantly improves the accuracy of object detection.
Table 4.
Effect of different label assignment strategies.
4.3.5. Multi-Scale Performance Evaluation
To evaluate the performance of the model under different input resolutions, we conducted a comprehensive comparative experiment on the HRSC2016 dataset, assessing the detection performance of the classical detector RetinaNet and our proposed SADA-Net, as shown in Table 5. When using RetinaNet (with ResNet-50 as the backbone) and setting the input resolution to 512 × 800, the model achieved only 71.64% mAP. Although it offered a relatively fast inference speed (16.7 FPS), its detection accuracy was limited. In contrast, SADA-Net achieved a significantly higher mAP of 89.58% at the same input resolution (512 × 800), outperforming RetinaNet by 17.94%, which demonstrates the superior representational capability of our model in extracting features of rotated objects. Furthermore, SADA-Net achieved mAPs of 88.43%, 89.39%, and 88.06% at input resolutions of 512 × 512, 800 × 800, and 1024 × 1024, respectively, verifying its stability and robustness under multi-scale input conditions. Although SADA-Net has a larger number of parameters and computational cost (72.58 M parameters and up to 281.46 G FLOPs), it consistently maintains an inference speed above 9.0 FPS across different resolutions, thereby balancing high accuracy with reasonable efficiency. These results suggest that SADA-Net can consistently deliver high-precision outputs even under significant resolution variation, demonstrating strong practical applicability in scenarios requiring high-accuracy detection, such as remote sensing imagery.
Table 5.
Comparison of different input resolutions on the HRSC2016 dataset.
5. Results and Analysis
Results on HRSC2016: The HRSC2016 dataset contains a large number of rotated ship images with high aspect ratio, multi-scale, and arbitrary orientation, which can fully verify the detection performance of our model for high-aspect-ratio oriented targets. Our method achieves competitive performance on the HRSC2016 dataset. As shown in Table 6, using R-101-DRRCM as the backbone network and adjusting the input image to 512 × 800 pixels, our method achieves the highest mean average precision (mAP) of 90.05%. Even when using the lighter R-50-DRRCM, our method still achieves an mAP of 89.58%. It is worth noting that our method uses only one square anchor at each position of the feature map, but it still outperforms frameworks that preset a large number of rotated anchors at each point of the feature map. For example, R2CNN presets 21 anchors and R3Det presets 126 anchors. Compared with their best detection results, we use only one anchor and do not use data augmentation strategies for training and testing, which achieve increases of 16.51% and 0.32%, respectively. These results show that it is not necessary to preset a large number of rotated anchor boxes of different scales for oriented object detection. More importantly, it is essential to extract high-quality basic features and optimize high-quality prediction anchor boxes, and on this basis, select reasonable sample training for target recognition. Some qualitative results are shown in Figure 7.
Table 6.
Comparison experiments of HRSC2016.
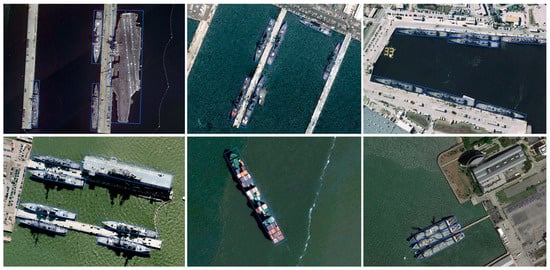
Figure 7.
Some of the visualized detection results obtained using our proposed SADA-Net on the HRSC2016 dataset.
(2) Results on UCAS-AOD: To further validate the effectiveness of the proposed SADA-Net, a series of experiments were conducted on the UCAS-AOD dataset. The results presented in Table 7 demonstrate that our method outperforms the other detectors in terms of performance, achieving an mAP of 90.00%. Specifically, the detection results for the categories of cars and airplanes are 89.42% and 90.57%, respectively, both reaching the highest detection accuracy for these categories. This demonstrates that the proposed method exhibits strong robustness for densely arranged small objects, further validating its superior performance. Some qualitative results are shown in Figure 8.
Table 7.
Comparative detection results on the UCAS-AOD dataset.
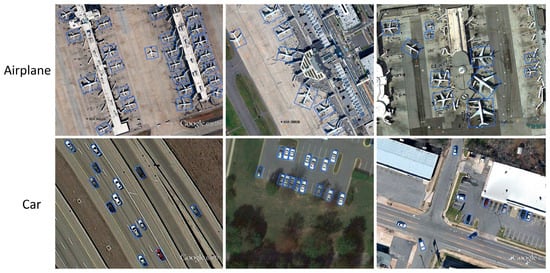
Figure 8.
Some of the visualized detection results obtained using our proposed SADA-Net on the UCAS-AOD dataset.
(3) Results on DOTA: As shown in Table 8, our proposed method demonstrates superior detection performance compared to other advanced methods, achieving an mAP of 79.60%. Through our proposed SI criterion, we divide the 15 target categories in the dataset into two typical categories: high-aspect-ratio targets (BR, GTF, LV, SH, and HA) and regularly shaped targets (PL, BD, SV, TC, BC, ST, SBF, RA, SP, and HC). The data from the experiments show that this method excels in the detection of high-aspect-ratio targets, achieving the best detection accuracy in all five subcategories; meanwhile, in the detection of regularly shaped targets, seven out of ten subcategories reached the best comparison level, which fully validates the robustness of our method in dealing with the diversity of target orientation and shape variability. It should be emphasized that the improvement of detection accuracy for remote sensing targets with extreme aspect ratio features such as BR and LV is particularly significant, with increases of 4.64% and 4.59%, respectively, compared to the second best method. The qualitative visualization results shown in Figure 9 further demonstrate that this method has a significant advantage in detection effects under different scales, dense arrangement, and complex background conditions.
Table 8.
Comparative experiments on the DOTA dataset.
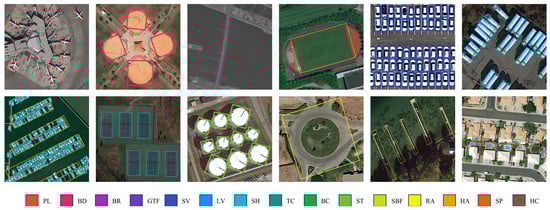
Figure 9.
Some of the visualized detection results obtained using our proposed SADA-Net on the DOTA dataset.
6. Conclusions
This paper proposes a single-stage Shape-Aware Dynamic Alignment Network (SADA-Net) for the problem of directional object detection in remote sensing images. The framework optimizes feature representation, anchor point refinement, and training sample selection, significantly improving detection performance. Specifically, SADA-Net extracts high-quality orientation-sensitive features by adaptively adjusting convolution kernel parameters, effectively capturing the rotation characteristics of the target; secondly, by optimizing the anchor point generation mechanism, it ensures the spatial accuracy of the prediction box, significantly improving the feature alignment accuracy. Finally, in the sample selection strategy, combining target shape information and sample quality evaluation, it realizes the dynamic selection of positive samples, thereby enhancing the consistency between regression tasks and classification tasks. Experimental results show that SADA-Net achieves excellent detection performance on three benchmark datasets: HRSC2016, DOTA, and UCAS-AOD, with mAP reaching 90.05%, 79.60%, and 90.00%, respectively, fully verifying the effectiveness and advancement of this method in the task of directional object detection in remote sensing images.
Author Contributions
Conceptualization, L.Z.; methodology, L.Z.; software, L.Z.; validation, L.Z.; formal analysis, L.Z.; investigation, L.Z., B.L. and D.Z.; resources, Z.C.; data curation, L.Z., B.L. and S.R.; writing—original draft preparation, L.Z.; writing—review and editing, L.Z., Z.C. and D.J.; visualization, L.Z.; supervision, Z.C. and D.J.; project administration, Z.C.; funding acquisition, Z.C. All authors have read and agreed to the published version of the manuscript.
Funding
This research was funded by the Guangxi Key Technologies R&D Program (GrantAB25069093) and the Natural Science Foundation of China General Project (NO. 21976043).
Data Availability Statement
The datasets used in this study are publicly available and can be accessed at https://universe.roboflow.com/thesis-ev7v6/hrsc2016-boys9 (accessed on 27 March 2025) (HRSC2016: High-Resolution Ship Collections 2016), https://captain-whu.github.io/DOTA/dataset.html (accessed on 27 March 2025) (DOTA: A Large-Scale Dataset for Object Detection in Aerial Images), and https://drive.google.com/file/d/1-1MnjZZ26EDfEqVeAi69TMJQUH9_Z0Q2 (accessed on 27 March 2025) (UCAS: High-Resolution Aerial Object Detection Dataset).
Acknowledgments
We would like to thank Guilin University of Technology, the School of Environmental Science and Engineering, and the Guangxi Engineering Research Center for Non-Point Source Pollution Control in Agriculture for providing the research environment and computing resources. Additionally, we appreciate the open-source datasets used in this study, which have made a significant contribution to our research.
Conflicts of Interest
The authors declare no conflicts of interest.
References
- Cheng, G.; Zhou, P.; Han, J. Learning Rotation-Invariant Convolutional Neural Networks for Object Detection in Vhr Optical Remote Sensing Images. IEEE Trans. Geosci. Remote Sens. 2016, 54, 7405–7415. [Google Scholar] [CrossRef]
- Zaidi, S.S.A.; Ansari, M.S.; Aslam, A.; Kanwal, N.; Asghar, M.; Lee, B. A Survey of Modern Deep Learning Based Object Detection Models. Digit. Signal Process. 2022, 126, 103514. [Google Scholar] [CrossRef]
- Zou, Z.; Chen, K.; Shi, Z.; Guo, Y.; Ye, J. Object Detection in 20 Years: A Survey. Proc. IEEE 2023, 111, 257–276. [Google Scholar] [CrossRef]
- Zheng, Z.; Lei, L.; Sun, H.; Kuang, G. A Review of Remote Sensing Image Object Detection Algorithms Based on Deep Learning. In Proceedings of the 2020 IEEE 5th International Conference on Image, Vision and Computing (ICIVC) 2020, Beijing, China, 10–12 July 2020. [Google Scholar]
- Yao, Q.; Hu, X.; Lei, H. Geospatial Object Detection in Remote Sensing Images Based on Multi-Scale Convolutional Neural Networks. In Proceedings of the IGARSS 2019—2019 IEEE International Geoscience and Remote Sensing Symposium 2019, Yokohama, Japan, 28 July–2 August 2019. [Google Scholar]
- Bai, P.; Xia, Y.; Feng, J. Composite Perception and Multi-Scale Fusion Network for Arbitrary-Oriented Object Detection in Remote Sensing Imagery. IEEE Trans. Geosci. Remote Sens. 2024, 62, 5645916. [Google Scholar] [CrossRef]
- Deng, Z.; Sun, H.; Zhou, S.; Zhao, J.; Lei, L.; Zou, H. Multi-Scale Object Detection in Remote Sensing Imagery with Convolutional Neural Networks. ISPRS J. Photogramm. Remote Sens. 2018, 145, 3–22. [Google Scholar] [CrossRef]
- Agarwal, S.; Terrail, J.O.; Jurie, F. Recent Advances in Object Detection in the Age of Deep Convolutional Neural Networks. arXiv 2018, arXiv:1809.03193. [Google Scholar]
- Wang, G.; Zhuang, Y.; Chen, H.; Liu, X.; Zhang, T.; Li, L.; Dong, S.; Sang, Q. Fsod-Net: Full-Scale Object Detection from Optical Remote Sensing Imagery. IEEE Trans. Geosci. Remote Sens. 2021, 60, 5602918. [Google Scholar] [CrossRef]
- Zhou, Y.; Li, H. A Survey of Dense Object Detection Methods Based on Deep Learning. IEEE Access 2024, 12, 179944–179961. [Google Scholar] [CrossRef]
- Yang, X.; Yan, J.; Feng, Z.; He, T. R3det: Refined Single-Stage Detector with Feature Refinement for Rotating Object. In Proceedings of the AAAI Conference on Artificial Intelligence, Online, 2–9 February 2021. [Google Scholar]
- Lin, T.-Y.; Goyal, P.; Girshick, R.; He, K.; Dollar, P. Focal Loss for Dense Object Detection. IEEE Trans. Pattern Anal. Mach. Intell. 2020, 42, 318–327. [Google Scholar] [CrossRef]
- Ding, J.; Xue, N.; Long, Y.; Xia, G.S.; Lu, Q. Learning Roi Transformer for Oriented Object Detection in Aerial Images. In Proceedings of the IEEE/CVF Conference on Computer Vision and Pattern Recognition 2019, Long Beach, CA, USA, 15–20 June 2019. [Google Scholar]
- Xu, Y.; Fu, M.; Wang, Q.; Wang, Y.; Chen, K.; Xia, G.-S.; Bai, X. Gliding Vertex on the Horizontal Bounding Box for Multi-Oriented Object Detection. IEEE Trans. Pattern Anal. Mach. Intell. 2020, 43, 1452–1459. [Google Scholar] [CrossRef]
- Cheng, Y.; Xu, C.; Kong, Y.; Wang, X. Short-Side Excursion for Oriented Object Detection. IEEE Geosci. Remote Sens. Lett. 2022, 19, 6515205. [Google Scholar] [CrossRef]
- Xie, X.; Cheng, G.; Wang, J.; Yao, X.; Han, J. Oriented R-Cnn for Object Detection In Proceedings of the IEEE/CVF International Conference on Computer Vision 2021, Montreal, BC, Canada, 10–17 October 2021.
- Yang, X.; Yan, J. Arbitrary-Oriented Object Detection with Circular Smooth Label. In Computer Vision–ECCV 2020, Proceedings of the 16th European Conference, Glasgow, UK, 23–28 August 2020, Proceedings, Part VIII 16; Springer: Cham, Switzerland, 2020. [Google Scholar]
- Yang, X.; Yang, X.; Yang, J.; Ming, Q.; Wang, W.; Tian, Q.; Yan, J. Learning High-Precision Bounding Box for Rotated Object Detection Via Kullback-Leibler Divergence. Adv. Neural Inf. Process. Syst. 2021, 34, 18381–18394. [Google Scholar]
- Yang, X.; Zhou, Y.; Zhang, G.; Yang, J.; Wang, W.; Yan, J.; Zhang, X.; Tian, Q. The Kfiou Loss for Rotated Object Detection. arXiv 2022, arXiv:2201.12558. [Google Scholar]
- Shen, C.; Qian, J.; Wang, C.; Yan, D.; Zhong, C. Dynamic Sensing and Correlation Loss Detector for Small Object Detection in Remote Sensing Images. IEEE Trans. Geosci. Remote Sens. 2024, 62, 5627212. [Google Scholar] [CrossRef]
- Ma, J.; Shao, W.; Ye, H.; Wang, L.; Wang, H.; Zheng, Y.; Xue, X. Arbitrary-Oriented Scene Text Detection Via Rotation Proposals. IEEE Trans. Multimed. 2018, 20, 3111–3122. [Google Scholar] [CrossRef]
- Azimi, S.M.; Vig, E.; Bahmanyar, R.; Körner, M.; Reinartz, P. Towards Multi-Class Object Detection in Unconstrained Remote Sensing Imagery. In Computer Vision—ACCV 2018, Proceedings of the 14th Asian Conference on Computer Vision, Perth, Australia, 2–6 December 2018, Revised Selected Papers, Part III; Springer: Cham, Switzerland, 2018. [Google Scholar]
- Liu, X.; Ma, S.; He, L.; Wang, C.; Chen, Z. Hybrid Network Model: Transconvnet for Oriented Object Detection in Remote Sensing Images. Remote Sens. 2022, 14, 2090. [Google Scholar] [CrossRef]
- Liu, Z.; Lin, Y.; Cao, Y.; Hu, H.; Wei, Y.; Zhang, Z.; Lin, S.; Guo, B. Swin Transformer: Hierarchical Vision Transformer Using Shifted Windows. In Proceedings of the IEEE/CVF International Conference on Computer Vision 2021, Montreal, BC, Canada, 10–17 October 2021. [Google Scholar]
- Sun, P.; Zheng, Y.; Zhou, Z.; Xu, W.; Ren, Q. R4 Det: Refined Single-Stage Detector with Feature Recursion and Refinement for Rotating Object Detection in Aerial Images. Image Vis. Comput. 2020, 103, 104036. [Google Scholar] [CrossRef]
- Chalavadi, V.; Jeripothula, P.; Datla, R.; Ch, S.B.; C, K.M. Msodanet: A Network for Multi-Scale Object Detection in Aerial Images Using Hierarchical Dilated Convolutions. Pattern Recognit. 2022, 126, 108548. [Google Scholar] [CrossRef]
- Xu, Q.; Li, Y.; Shi, Z. Lmo-Yolo: A Ship Detection Model for Low-Resolution Optical Satellite Imagery. IEEE J. Sel. Top. Appl. Earth Obs. Remote Sens. 2022, 15, 4117–4131. [Google Scholar] [CrossRef]
- Zheng, Y.; Sun, P.; Zhou, Z.; Xu, W.; Ren, Q. Adt-Det: Adaptive Dynamic Refined Single-Stage Transformer Detector for Arbitrary-Oriented Object Detection in Satellite Optical Imagery. Remote Sens. 2021, 13, 2623. [Google Scholar] [CrossRef]
- Zhang, S.; Chi, C.; Yao, Y.; Lei, Z.; Li, S.Z. Bridging the Gap between Anchor-Based and Anchor-Free Detection Via Adaptive Training Sample Selection. In Proceedings of the IEEE/CVF Conference on Computer Vision and Pattern Recognition 2020, Seattle, WA, USA, 14–19 June 2020. [Google Scholar]
- Ma, W.; Wang, X.; Zhu, H.; Yang, X.; Yi, X.; Jiao, L. Significant Feature Elimination and Sample Assessment for Remote Sensing Small Objects’ Detection. IEEE Trans. Geosci. Remote Sens. 2024, 62, 5615115. [Google Scholar] [CrossRef]
- Li, W.; Chen, Y.; Hu, K.; Zhu, J. Oriented Reppoints for Aerial Object Detection. In Proceedings of the IEEE/CVF Conference on Computer Vision and Pattern Recognition 2022, New Orleans, LA, USA, 18–24 June 2022. [Google Scholar]
- Ming, Q.; Zhou, Z.; Miao, L.; Zhang, H.; Li, L. Dynamic Anchor Learning for Arbitrary-Oriented Object Detection. In Proceedings of the AAAI Conference on Artificial Intelligence, Online, 2–9 February 2021. [Google Scholar]
- Xiao, Z.; Xu, B.; Zhang, Y.; Wang, K.; Wan, Q.; Tan, X. Aspect Ratio-Based Bidirectional Label Encoding for Square-Like Rotation Detection. IEEE Geosci. Remote Sens. Lett. 2023, 20, 6005105. [Google Scholar] [CrossRef]
- Zeng, Y.; Chen, Y.; Yang, X.; Li, Q.; Yan, J. Ars-Detr: Aspect Ratio-Sensitive Detection Transformer for Aerial Oriented Object Detection. IEEE Trans. Geosci. Remote Sens. 2024, 62, 5610315. [Google Scholar] [CrossRef]
- He, Y.; Zhu, C.; Wang, J.; Savvides, M.; Zhang, X. Bounding Box Regression with Uncertainty for Accurate Object Detection. In Proceedings of the IEEE/CVF Conference on Computer Vision and Pattern Recognition 2019, Long Beach, CA, USA, 15–20 June 2019. [Google Scholar]
- Jiang, B.; Luo, R.; Mao, J.; Xiao, T.; Jiang, Y. Acquisition of Localization Confidence for Accurate Object Detection. In Proceedings of the European Conference on Computer Vision (ECCV) 2018, Munich, Germany, 8–14 September 2018. [Google Scholar]
- Feng, D.; Rosenbaum, L.; Dietmayer, K. Towards Safe Autonomous Driving: Capture Uncertainty in the Deep Neural Network for Lidar 3d Vehicle Detection. In Proceedings of the 2018 21st International Conference on Intelligent Transportation Systems (ITSC), Maui, HI, USA, 4–7 November 2018. [Google Scholar]
- Liu, Z.; Yuan, L.; Weng, L.; Yang, Y. A High Resolution Optical Satellite Image Dataset for Ship Recognition and Some New Baselines. In Proceedings of the International Conference on Pattern Recognition Applications and Methods 2017, Porto, Portugal, 24–26 February 2017. [Google Scholar]
- Xia, G.S.; Bai, X.; Ding, J.; Zhu, Z.; Belongie, S.; Luo, J.; Datcu, M.; Pelillo, M.; Zhang, L. Dota: A Large-Scale Dataset for Object Detection in Aerial Images. In Proceedings of the IEEE Conference on Computer Vision and Pattern Recognition 2018, Salt Lake City, UT, USA, 18–22 June 2018. [Google Scholar]
- Zhu, H.; Chen, X.; Dai, W.; Fu, K.; Ye, Q.; Jiao, J. Orientation Robust Object Detection in Aerial Images Using Deep Convolutional Neural Network. In Proceedings of the 2015 IEEE International Conference on Image Processing (ICIP) 2015, Quebec City, QC, Canada, 27–30 September 2015. [Google Scholar]
- He, K.; Zhang, X.; Ren, S.; Sun, J. Deep Residual Learning for Image Recognition. In Proceedings of the IEEE Conference on Computer Vision and Pattern Recognition 2016, Las Vegas, NV, USA, 27–30 June 2016. [Google Scholar]
- Everingham, M.; Van Gool, L.; Williams, C.K.I.; Winn, J.; Zisserman, A. The Pascal Visual Object Classes (Voc) Challenge. Int. J. Comput. Vis. 2009, 88, 303–338. [Google Scholar] [CrossRef]
- Chen, K.; Wang, J.; Pang, J.; Cao, Y.; Xiong, Y.; Li, X.; Sun, S.; Feng, W.; Liu, Z.; Xu, J. Mmdetection: Open Mmlab Detection Toolbox and Benchmark. arXiv 2019, arXiv:1906.07155. [Google Scholar]
- Jiang, Y.; Zhu, X.; Wang, X.; Yang, S.; Li, W.; Wang, H.; Fu, P.; Luo, Z. R2cnn: Rotational Region Cnn for Orientation Robust Scene Text Detection. arXiv 2017, arXiv:1706.09579. [Google Scholar]
- Liao, M.; Zhu, Z.; Shi, B.; Xia, G.S.; Bai, X. Rotation-Sensitive Regression for Oriented Scene Text Detection. In Proceedings of the IEEE Conference on Computer Vision and Pattern Recognition 2018, Salt Lake City, UT, USA, 18–22 June 2018. [Google Scholar]
- Ming, Q.; Miao, L.; Zhou, Z.; Dong, Y. Cfc-Net: A Critical Feature Capturing Network for Arbitrary-Oriented Object Detection in Remote-Sensing Images. IEEE Trans. Geosci. Remote Sens. 2021, 60, 5605814. [Google Scholar] [CrossRef]
- Farhadi, A.; Redmon, J. Yolov3: An Incremental Improvement. In Computer Vision and Pattern Recognition; Springer: Berlin/Heidelberg, Germany, 2018. [Google Scholar]
- Ren, S.; He, K.; Girshick, R.; Sun, J. Faster R-Cnn: Towards Real-Time Object Detection with Region Proposal Networks. IEEE Trans. Pattern Anal. Mach. Intell. 2017, 39, 1137–1149. [Google Scholar] [CrossRef]
- Ming, Q.; Miao, L.; Zhou, Z.; Yang, X.; Dong, Y. Optimization for Arbitrary-Oriented Object Detection Via Representation Invariance Loss. IEEE Geosci. Remote Sens. Lett. 2021, 19, 8021505. [Google Scholar] [CrossRef]
- Zhang, G.; Lu, S.; Zhang, W. Cad-Net: A Context-Aware Detection Network for Objects in Remote Sensing Imagery. IEEE Trans. Geosci. Remote Sens. 2019, 57, 10015–10024. [Google Scholar] [CrossRef]
- Pan, X.; Ren, Y.; Sheng, K.; Dong, W.; Yuan, H.; Guo, X.; Ma, C.; Xu, C. Dynamic Refinement Network for Oriented and Densely Packed Object Detection. In Proceedings of the IEEE/CVF Conference on Computer Vision and Pattern Recognition 2020, Seattle, WA, USA, 14–19 June 2020. [Google Scholar]
- Wei, H.; Zhang, Y.; Chang, Z.; Li, H.; Wang, H.; Sun, X. Oriented Objects as Pairs of Middle Lines. ISPRS J. Photogramm. Remote Sens. 2020, 169, 268–279. [Google Scholar] [CrossRef]
- Shi, L.; Li, Y.; Zhu, X. Anchor Free Remote Sensing Detector Based on Solving Discrete Polar Coordinate Equation. Appl. Intell. 2023, 53, 27704–27724. [Google Scholar] [CrossRef]
- Yang, X.; Yang, J.; Yan, J.; Zhang, Y.; Zhang, T.; Guo, Z.; Sun, X.; Fu, K. Scrdet: Towards More Robust Detection for Small, Cluttered and Rotated Objects. In Proceedings of the IEEE/CVF International Conference on Computer Vision 2019, Seoul, Republic of Korea, 27 October–2 November 2019. [Google Scholar]
- Li, C.; Xu, C.; Cui, Z.; Wang, D.; Zhang, T.; Yang, J. Feature-Attentioned Object Detection in Remote Sensing Imagery. In Proceedings of the 2019 IEEE International Conference on Image Processing (ICIP), Taipei, Taiwan, 22–25 September 2019. [Google Scholar]
- Han, J.; Ding, J.; Li, J.; Xia, G.-S. Align Deep Features for Oriented Object Detection. IEEE Trans. Geosci. Remote Sens. 2021, 60, 5602511. [Google Scholar] [CrossRef]
Disclaimer/Publisher’s Note: The statements, opinions and data contained in all publications are solely those of the individual author(s) and contributor(s) and not of MDPI and/or the editor(s). MDPI and/or the editor(s) disclaim responsibility for any injury to people or property resulting from any ideas, methods, instructions or products referred to in the content. |
© 2025 by the authors. Licensee MDPI, Basel, Switzerland. This article is an open access article distributed under the terms and conditions of the Creative Commons Attribution (CC BY) license (https://creativecommons.org/licenses/by/4.0/).