1. Introduction
As an environmental protection transportation operation mode under the background of “Internet Plus” and dual carbon [
1], bike-sharing not only meets the short-distance travel needs of residents but also has important significance in promoting the sustainable development of urban public transportation. Since the launch of the Ofo bike-sharing service in 2015, the shared bike industry has gone through four phases: the exploration phase, the boom phase, the adjustment phase, and the steady phase [
2]. In China, large enterprises such as Hello Bike and Meituan Bike have now emerged as the dominant forces in the bike-sharing market [
3].
Currently, there are often two shared bicycle operators around bus stops, subway stations, residential areas, leisure areas, and office areas. They inevitably start an oligopoly competition for market share [
4,
5]. Game theory models such as the Cournot model, Bertrand model, or Stackelberg model are commonly employed to study pricing strategies, market share dynamics, and profitability outcomes [
6,
7,
8,
9,
10]. For example, Wang et al. [
11] studied different competitive modes between high-speed rail and air transport, including quantity competition and price competition. Bian et al. [
12] studied the competitive and collusive behaviors of two operators in a competitive market. Dai et al. [
5] analyzed the competitive behaviors among shared bicycle enterprises at different development stages and found that during the rapid growth phase of shared bicycles, and as the market becomes saturated, the marginal effect of increasing the volume of delivery decreases. In the quantity competition, the equilibrium delivery volume gradually reduces, significantly narrowing the profit margins for later entrants. These research findings provide a theoretical foundation for the study of competitive behavior in the shared bicycle oligopoly market. However, the above literature did not consider discount incentives as a method for attracting riders in their analysis of shared bicycle pricing strategies. By reducing the cost of using shared bikes, discounts can attract more users, especially in low-income communities or areas with limited transportation options.
Comfort is also one of the important factors affecting the passenger flow of shared bicycles [
13,
14]. It is directly related to the user’s riding experience and satisfaction, which in turn affects their choice and loyalty to the shared bicycle service. There has been a lot of research on shared bicycles and riding comfort [
15,
16]. However, most studies on the comfort of shared bicycles have not addressed the competition between two operators, nor have they taken it into account in the generalized travel costs of travelers. Therefore, in this paper, we will follow the approach of the aforementioned studies to investigate scenarios of quantity competition, fare competition, and collusion among shared bicycle operators. Our research will also focus on how pricing decisions and discounts impact market equilibrium, consumer behavior choices, and overall profit. We will specifically consider the comfort loss cost in the cost of passenger travel when the operators engage in price wars, quantity competition, and tacit collusion to maximize their profits, which has not been mentioned in previous studies.
The main contributions of this paper can be summarized as follows:
(1) In describing the general travel cost of passengers, comfort loss is considered as an important factor affecting passenger choices;
(2) Using discounts as incentive measures, we study their impact on the market equilibrium of shared bicycle operators and conduct numerical simulations;
(3) The interdependence between cycling distance and bike-sharing fares under three competitive scenarios was analyzed.
The rest of this paper is organized as follows. In
Section 2, previous studies on pricing models and discount incentives for shared bicycles are reviewed.
Section 3 presents the model and accounts for the central assumptions.
Section 4 provides the analysis of equilibrium fares, demand, and profits and how fares develop with respect to the parameters under different types of competition.
Section 5 describes the impact of changes in discounts and substitution levels on demand, fare, and profit. Finally, discussions and conclusions are presented in
Section 6 and
Section 7.
2. Literature Review
With the rise of the sharing economy, there has been extensive research on the topic in the literature. As an emerging economic phenomenon, shared bicycles have attracted widespread attention. Research on shared bicycles mainly focuses on areas such as urban transportation planning [
17], safety [
18,
19,
20], demand forecasting [
21], and governance [
22,
23]. Most studies on the competitive behavior of shared bicycles are based on qualitative or case studies to analyze the competitive models of shared bicycle companies.
The pricing strategy of shared bicycle operators’ transportation service has been a popular research topic in the field of transportation and urban planning [
5,
24,
25,
26]. Researchers have explored various aspects of this topic, with the most common being pricing models. For example, Ma et al. [
26] established a bi-level programming model for shared bicycles and adopted a global pricing model solution algorithm to minimize the travel cost for commuters and achieve the maximization of economic benefits for shared bicycle enterprises. Tan et al. used Bertrand game theory to construct a model of joint decision-making of rental pricing and launching between shared bicycle enterprises [
25]. Chen established a complete information static game model for the fixed amount subsidy strategy and the fixed proportion subsidy strategy [
27]. These models consider factors such as distance, demand, competition, and operating costs. Some studies analyzed user behavior in using shared bicycles for the last kilometre of transportation. For example, Dong et al. analyzed the effects of the inconvenience cost on different pricing strategies [
28]. Chen et al. investigated how a bike-sharing firm should develop its pricing strategy when its customers are concerned about the convenience of the trip [
29]. This includes factors such as willingness to pay, frequency of use, choice of transportation mode, and user satisfaction with pricing strategies. Research has also looked into the competitive landscape of shared bicycle operators in the last kilometer service and how pricing strategies affect market dynamics [
24,
25,
30,
31]. This includes the impact of price wars, pricing collusion, and differentiation strategies on operator performance.
Discounts play a crucial role in promoting the use of shared bicycles, reducing carbon emissions, alleviating traffic congestion, and providing affordable transportation options to a wide range of users. Studies have shown that discounts can significantly impact ridership levels of shared bicycles [
27,
32,
33]. Wang et al. [
34] presented an optimal model for adaptive relocation costs of shared electric vehicles based on user incentives and found that the enterprise’s relocation costs were reduced by more than
through these incentives. Chen et al. [
35] found that the Taipei City government promotes green transportation by providing discounts to users who transfer from the MRT or bus to You Bike within a particular period. However, there is limited research on discount incentives for shared bicycles under different competitive modes.
Numerous studies have been conducted on shared bicycles and riding comfort. For instance, some research has assessed the surface quality of bicycle lanes by analyzing data collected from smartphone sensors [
16,
36,
37]. Additionally, methods for selecting green recycling suppliers for shared bicycles have been explored [
38], as well as developed enhanced fuzzy logic power-assisted control systems based on user adaptation [
39]. In summary, these studies mainly focus on the technological competition of shared bicycles and have not been directly linked to pricing strategies for shared bicycles in competitive markets. Although price is not a direct factor affecting comfort, a reasonable pricing strategy can increase user satisfaction, especially when the price matches the comfort provided. Therefore, in this paper, the competition in the oligopoly market of shared bicycles considers both discount incentives and comfort levels.
Table 1 highlights the innovation points of this study compared to other related research.
3. The Model
This section provides a detailed analysis of the model, defines the travel cost of passengers for the last mile of travel, and derives the inverse demand function for passenger travel based on the assumption of maximizing consumer surplus. Finally, provide the cost and profit composition of two shared bicycle operators.
3.1. Problem Description
Taking a certain community in Nanjing, China, and its nearest subway station exit as an example, only Meituan and Hellobike provide services in this area, inevitably leading to competition between the two platforms. Due to differences in technology and design, the comfort levels of shared bicycles vary. For instance, Hellobike once introduced a heat-insulating cushion (also known as a cool cushion) during the summer, significantly enhancing the user riding experience.
This paper defines “comfort” as the overall experience users have when utilizing bike-sharing services. This encompasses multiple dimensions, including but not limited to the condition of the vehicle, riding stability, seat comfort, and the convenience of picking up and returning bikes. Consequently, users make choices between the two bike-sharing brands (referred to as
and
) based on past experiences and personal preferences. Meanwhile, the operator
seeks to attract more potential customers by offering discounts (
Figure 1).
Given the abovementioned setting, the following assumptions are made to facilitate our analysis:
Assumption 1. The travel demand is elastic [42,43,44] and depends on the generalized travel cost that contains travel times, transit fare, and travel distance. Assumption 2. The travel distance and the time cost for passengers adopting two types of shared bicycles are the same [12]. Assumption 3. There are only two bike-sharing companies and their decisions are rational [5]. Assumption 4. This paper only considers the fare revenue of shared bicycle operators and does not involve advertising revenue or deposit income.
Assumption 5. Passengers will assess the comfort level of shared bicycles based on their existing experience [45]. 3.2. Travel Cost and Travel Demand
Assuming that the generalized travel cost of passengers choosing bike-sharing operator
, denoted as
, consists of travel time cost
k, comfort loss cost
, and fare
. Specifically, the generalized travel cost for passengers choosing
will remove the discounts
S provided by operator
to attract more passengers. Then the
can be expressed as follows:
The generalized cost of passengers studied in this paper is not only differentiated by fare, but also by the loss cost of passenger comfort. The measurement of the loss cost of passenger comfort follows the method proposed by Tan et al. [
46]. In line with the literature [
47], we adopt the utility function as shown in Equation (
3):
where
is the potential user demand for
,
is used to measure the degree of substitution between services provided by two shared bicycle operators. If
then the services are perfect substitutes and
is the case of independent markets; Hence, parameter
g can be considered as indicating the degree of substitution between operators in a particular market sector [
48]. For a detailed explanation of all parameters, please refer to
Appendix A. The quadratic utility function is widely used in industrial organization models due to its suitability for mathematical derivation and model optimization. In this paper, we adopt the utility function shown in Equation (
3), which not only intuitively captures the substitution relationship between two types of shared bicycles but also effectively illustrates the phenomenon of diminishing marginal utility for passengers.
We assume that the representative traveler consumer surplus to be maximized is given by Equation (
4)
By maximizing the consumption surplus defined in Equation (
4), we can obtain the inverse demands from the first-order condition as follows:
Then, from Equations (
5) and (
6), the direct demand for the services of the two shared bicycle operators can, respectively, be obtained by
In view of , , , we can obtain .
Therefore, we can conclude that, for shared bicycle operators, the marginal increase in their price always has a higher influence, in absolute terms, on their demand than on the competitor’s demand. The difference between and can be decreased when g increases, which means the two shared bicycle operators compete more fiercely.
In accordance with the model established in [
12,
48], the costs
in Equation (
9) for two bike-sharing operators are assumed to have a symmetric structure and linearly increase with the number of passengers per km (
) and with a fixed cost term
f:
where
, and
are cost conversion coefficients.
D refers to the distance between subway stations or bus stops and residential complexes. This paper defines the linear cost function for operators, primarily based on the following two aspects:
(1) Maintenance Costs: The routine maintenance of bicycles (e.g., tire replacement, brake adjustment) is typically proportional to the distance traveled. The longer the riding distance, the more frequently the bicycles require maintenance, leading to a linear increase in maintenance costs.
(2) Operational Costs: For shared bicycle systems, activities such as vehicle redistribution and inspection are often planned based on usage data, which are usually directly related to riding distance. For instance, longer riding distances may result in more frequent redistribution needs.
According to Equation (
9), the marginal costs function for two operators can be obtained as shown in Equation (
10):
From Equation (
10), we assert that the marginal costs increase linearly with cycling distance. Then, parameter
can be interpreted as the cycling distance-independent marginal costs, while
is the shared bicycle operators’ cost caused by the user per kilometer of riding.
Then the profit function for each bike-sharing operator
can be obtained in Equation (
11) using the demand functions in Equations (
5)–(
8) and the cost functions in (
9).
Equation (
11) indicates that the profit of a bike-sharing operator is derived from its ticket revenue minus its operating costs. The aforementioned inverse demand function, direct demand function (Equations (
5) and (
6)), and the profit function of bike-sharing operators provide the theoretical foundation for deriving the market equilibrium under different competition models in the next section.
4. Market Equilibria for Different Competitive Modes
In this section, the focus will be on three different modes of competition (three scenarios): joint profit maximization (collusion), price competition (Bertrand), and potential user demand competition (Cournot), and will be driven and denoted by superscripts
,
B, and
C, respectively. The competition among these three models is discussed in the literature [
11,
12,
48].
4.1. Scenario I: Total Profit-Maximizing of Two Shared Bicycle Operators
In scenario I, two bike-sharing operators will reach an agreement through some form of cooperation or arrangement to jointly determine their respective market shares, thereby maximizing the total profit within the region. Then the profit maximization problem for the two operators can be formulated as follows:
where
is the total profits of operators
and
in scenario I;
is the profits of operator in scenario I;
is the profits of operator in scenario I.
The profit function of bike-sharing operator
in scenario I is shown in Equation (
13):
The profit function of bike-sharing operator
in scenario I is shown in Equation (
14):
From Equations (
13) and (
14), we can calculate the first-order optimal condition for Equation (
14) with respect to
, thereby obtaining the potential user demand for the two shared bicycle operators as presented in Equations (
15) and (
16):
Furthermore, by substituting Equations (
15) and (
16) into Equations (
5) and (
6), the equilibrium of the fare in Equations (
18) and (
19) can be obtained:
According to Equation (
18), the equilibrium fare of the bike-sharing operator
in scenario I is independent of the discount offered by the bike-sharing operator
.
4.2. Scenario II: Simultaneous Competition on Price (Bertrand)
When two bike-sharing operators maximize their profits through price competition, their objective functions can be modeled as follows:
where
is the profit of operator
in scenario II as shown in Equation (
22):
is the profit of operator
in scenario II as shown in Equation (
23):
Based on Equations (
22) and (
23), we can calculate the first-order optimal condition with respect to of Equations (
20) and (
21), then the equilibrium of the fare for two bike-sharing operators in Equations (
24) and (
25) can be obtained:
Additionally, by substituting Equations (
24) and (
25) into Equations (
7) and (
8), the potential user demand for two bike-sharing operators in scenario II can be obtained:
Then the total potential user demand for two bike-sharing operators in scenario II is as follows:
Based on the potential user demand for two bike-sharing operators, the profit function of the shared bicycle operators in scenario II can be deduced, as shown in Equation (
29):
Equation (
29) indicates that in the scenario of price competition, the profit of a bike-sharing operator depends not only on its potential user demand but also on the degree of sustainability between the services provided by the two types of bike-sharing operators in the market.
4.3. Simultaneous Competition on Potential User Demand (Cournot)
When two bike-sharing operators maximize their profits through potential user demand competition, their objective functions can be modeled as follows:
where
is the profit of the operator
in scenario III, as shown in Equation (
32):
is the profit of the operator
in scenario III, as shown in Equation (
33):
From the first-order optimal conditions of Equations (
32) and (
33), the potential user demand for two bike-sharing operators in Equations (
34) and (
35) can be obtained.
According to Equations (
34) and (
35), the total potential user demand for two bike-sharing operators in scenario III is as follows:
Moreover, by substituting Equations (
34) and (
35) into Equations (
5) and (
6), the equilibrium of fare for two operators in scenario II can be obtained:
Based on the potential user demand for two bike-sharing operators, the profit function of the shared bicycle operators in scenario III can be deduced, as shown in Equation (
39):
Section 3 analyzes the market equilibrium in a duopoly bike-sharing market, encompassing both equilibrium pricing and demand. Based on the equilibrium under each scenario, further comparative analysis is conducted to examine the total demand and demand differences under the three equilibria. The impact of various parameters such as cycling distance, discounts, and comfort levels on these equilibria is explored.
4.4. Influence on Fares of Parameters k, , , and S
It can be determined that all equilibrium fares are increasing in the bike-sharing operators’ costs (
) and decreasing when the passengers’ time costs (
k) and comfort loss cost (
) increase. Consequently, higher demands from the passengers regarding the quality of the bike-sharing, causing lower values of (
), will increase fares. The effects of discount strategies, passengers’ travel time costs, and comfort loss costs on equilibrium fares under three competitive scenarios are presented in
Table 2.
From
Table 2, we see that an increase in the operating costs for shared-bike operators will directly lead to higher profit revenues to sustain operations, resulting in a tendency for fares to rise. A decrease in passengers’ travel time costs (
k) indicates an elevated demand for travel efficiency, making them more willing to pay higher fees for fast and convenient travel services. Although this change in demand cannot directly translate into fare increases, in the long term, as passengers’ travel time cost budgets continue to decline, shared-bike operators may attract users by improving service quality (such as increasing vehicle deployment and optimizing scheduling systems), which often requires additional cost investments, thereby indirectly leading to fare hikes. The decrease in the cost of comfort loss (
) usually results in higher fares. This is because an improved riding experience can boost user satisfaction and loyalty, enabling shared-bike operators to maintain their appeal in market competition. Consequently, shared-bike operators can offset these costs by increasing fares. However, due to limitations such as market competition, user demand elasticity, and government regulation, fares cannot be raised indefinitely.
In
Table 2, / indicates that the parameter has no effect on the fare, ↑ indicates that the parameter has a positive effect on the fare, and ↓ indicates that the parameter has a negative effect on the fare, meaning that an increase in the parameter will lead to a decrease in the fare.
4.5. Cycling Distance and Fares
As a new mode of short-distance travel, bike-sharing typically bases its pricing strategies on riding time or riding distance. However, in actual operations, due to various factors such as maintenance costs, market competition, and user demand, shared bicycle operators often need to continuously adjust their pricing strategies to balance profitability and market share. Riding distance, as a key indicator of the cost for users to use shared bicycles, has a close relationship with the fare.
It is evident that fares increase with distance in the cases of collusion, Bertrand, and Cournot, as demonstrated by Equations (
18), (
19), (
24), (
25), (
37) and (
38) respectively. We can deduce the following conditions in Scenarios I, II, and III:
Furthermore, the ranking of the equilibrium fares regarding their dependence on trip length can be obtained:
Therefore, in potential user demand competition, the impact of riding distance on fare is the least significant. In the collusion model, due to potential cooperation or collusion among market participants, the dependence of equilibrium ticket prices on riding distance is relatively low, and the trend of ticket price increase is relatively gentle. This may be because in this model, operators are more inclined to pursue long-term benefits by jointly maintaining market order and stabilizing prices, rather than competing for market share through price wars. In contrast, in the more realistic competition models of Bertrand and Cournot, the dependence of equilibrium ticket prices on riding distance is more pronounced. In the Bertrand competition model, operators compete for market share through price competition, leading to higher ticket prices for users with longer riding distances. In the Cournot competition model, operators respond to market competition by adjusting production volumes (i.e., the number of bicycles deployed), which also affects the setting of equilibrium ticket prices. In both models, an increase in riding distance is often accompanied by a significant increase in ticket prices, reflecting the profound impact of market competition on ticket pricing.
As shown in
Figure 2, the equilibrium fare increases with riding distance under any scenario. Meanwhile, the fare grows the fastest in the context of potential user demand competition and the slowest under the mode of maximizing total profit. This indicates that the dependence of equilibrium fare on riding distance is the highest in the context of potential user demand competition, while it is relatively lower under the mode of maximizing total profit.
5. Discounts and Market Equilibrium
In this subsection, we will study the potential user demand, equilibrium fares, and profits for the two types of bike-sharing under Scenarios I, II, and III. Discounts and substitution relationships will be given special attention for each scenario mentioned in the third section, and we provide numerical examples for further analysis of the derived equilibrium. The data selection adopts a random sampling The data selection adopts a random sampling method and follows the principle of ( < ) to ensure the reliability of the simulation results. The following two principles are applied to ensure the randomness and validity of data selection:
(1) Random Selection: During the simulation, parameter values are randomly generated within the reasonable ranges specified in the parameter settings of the reference model construction, simulating competitive performance under different scenarios.
(2) Repeated Experiments: To verify the stability of the simulation results, multiple independent simulation experiments were conducted, each using different random data.
The simulation results presented in this section are based on the following parameter selection: , , , , , .
5.1. The Difference in Potential User Demand
Based on the expressions for market equilibrium quantities derived under different competition models in
Section 4, the differences in potential user demand under three scenarios can be calculated.
The difference in potential user demand between bike-sharing operators
and
in scenario I:
The difference in potential user demand between bike-sharing operators
and
in scenario II:
The difference in potential user demand between bike-sharing operators
and
in scenario III:
Since all aforementioned expressions are negative, it indicates that the potential user demand for
exceed those of
. This is consistent with the research in the literature that discount can attract more passengers [
12,
48]. Furthermore, the differences in potential user demand between the two bike-sharing operators under different competitive scenarios can be obtained.
The difference in potential user demand of the two bike-sharing operators between scenarios 1 and 2 is shown in Equation (
45):
The difference in potential user demand of the two bike-sharing operators between scenarios 1 and 3 is shown in Equation (
46):
The difference in potential user demand of the two bike-sharing operators between scenarios 2 and 3 is shown in Equation (
47):
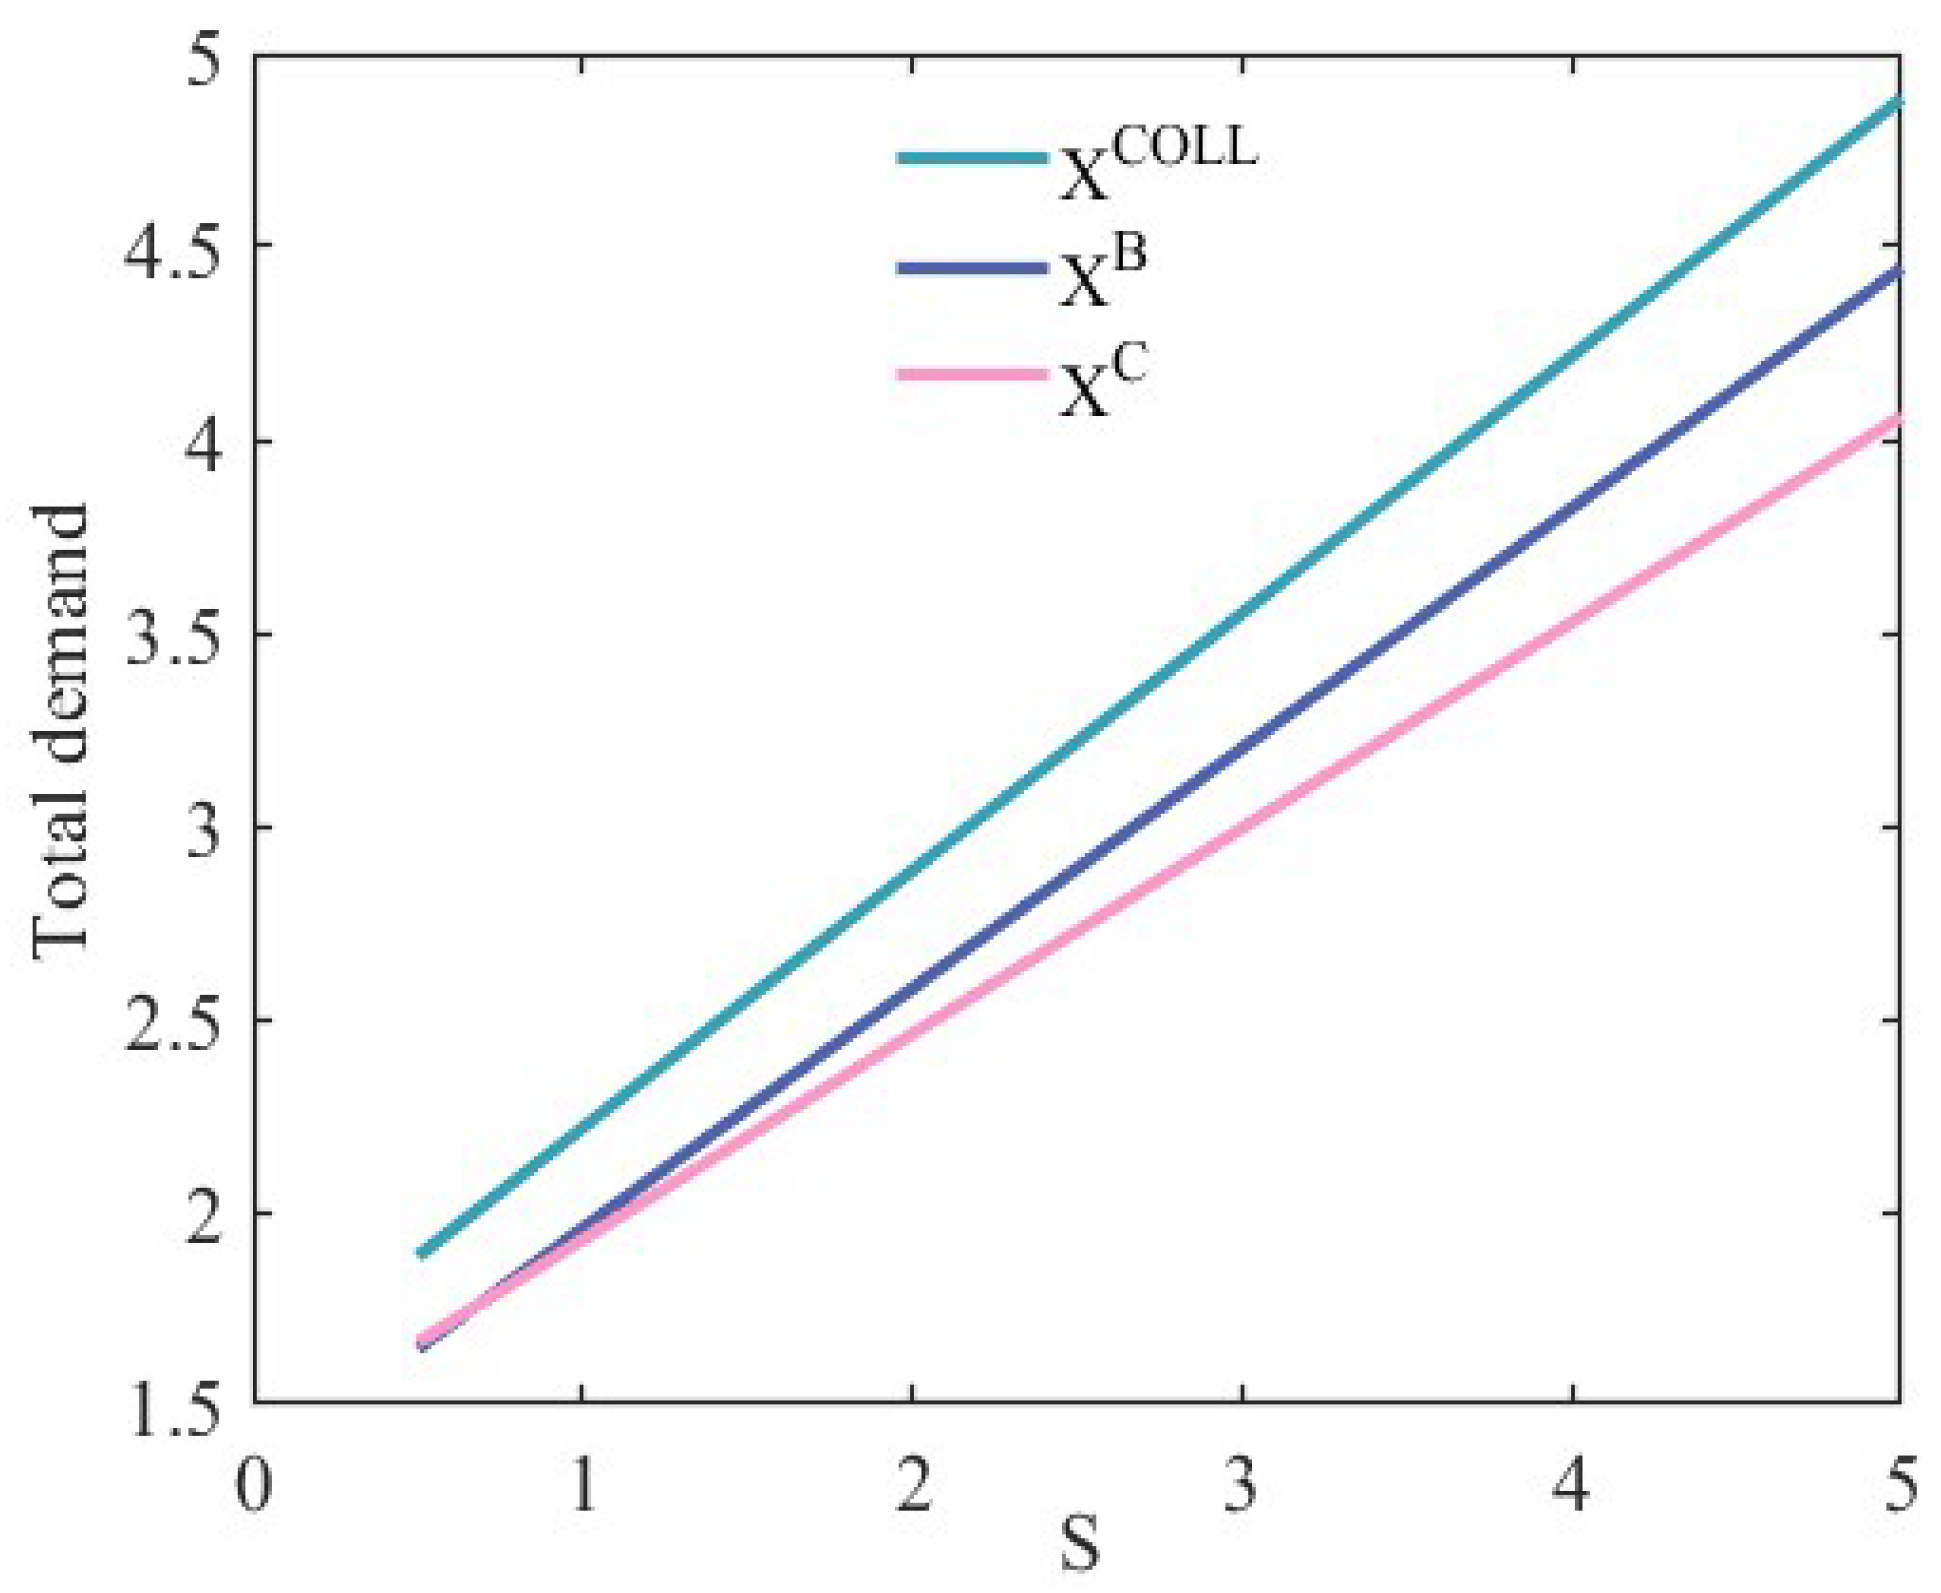
Consequently, under potential user demand competition, the difference in demand for two bike-sharing operators is the most significant, whereas under collusion, it is minimal. In addition, the total demand ranking for the two bike-sharing operators is
. Hence, the total demand for two bike-sharing operators will be highest when they collude and lowest when they compete in quantities, which is in line with the results from earlier studies. An example can be seen in
Figure 3, where
X in
Figure 3 refers to the total demand for two types of bike-sharing.
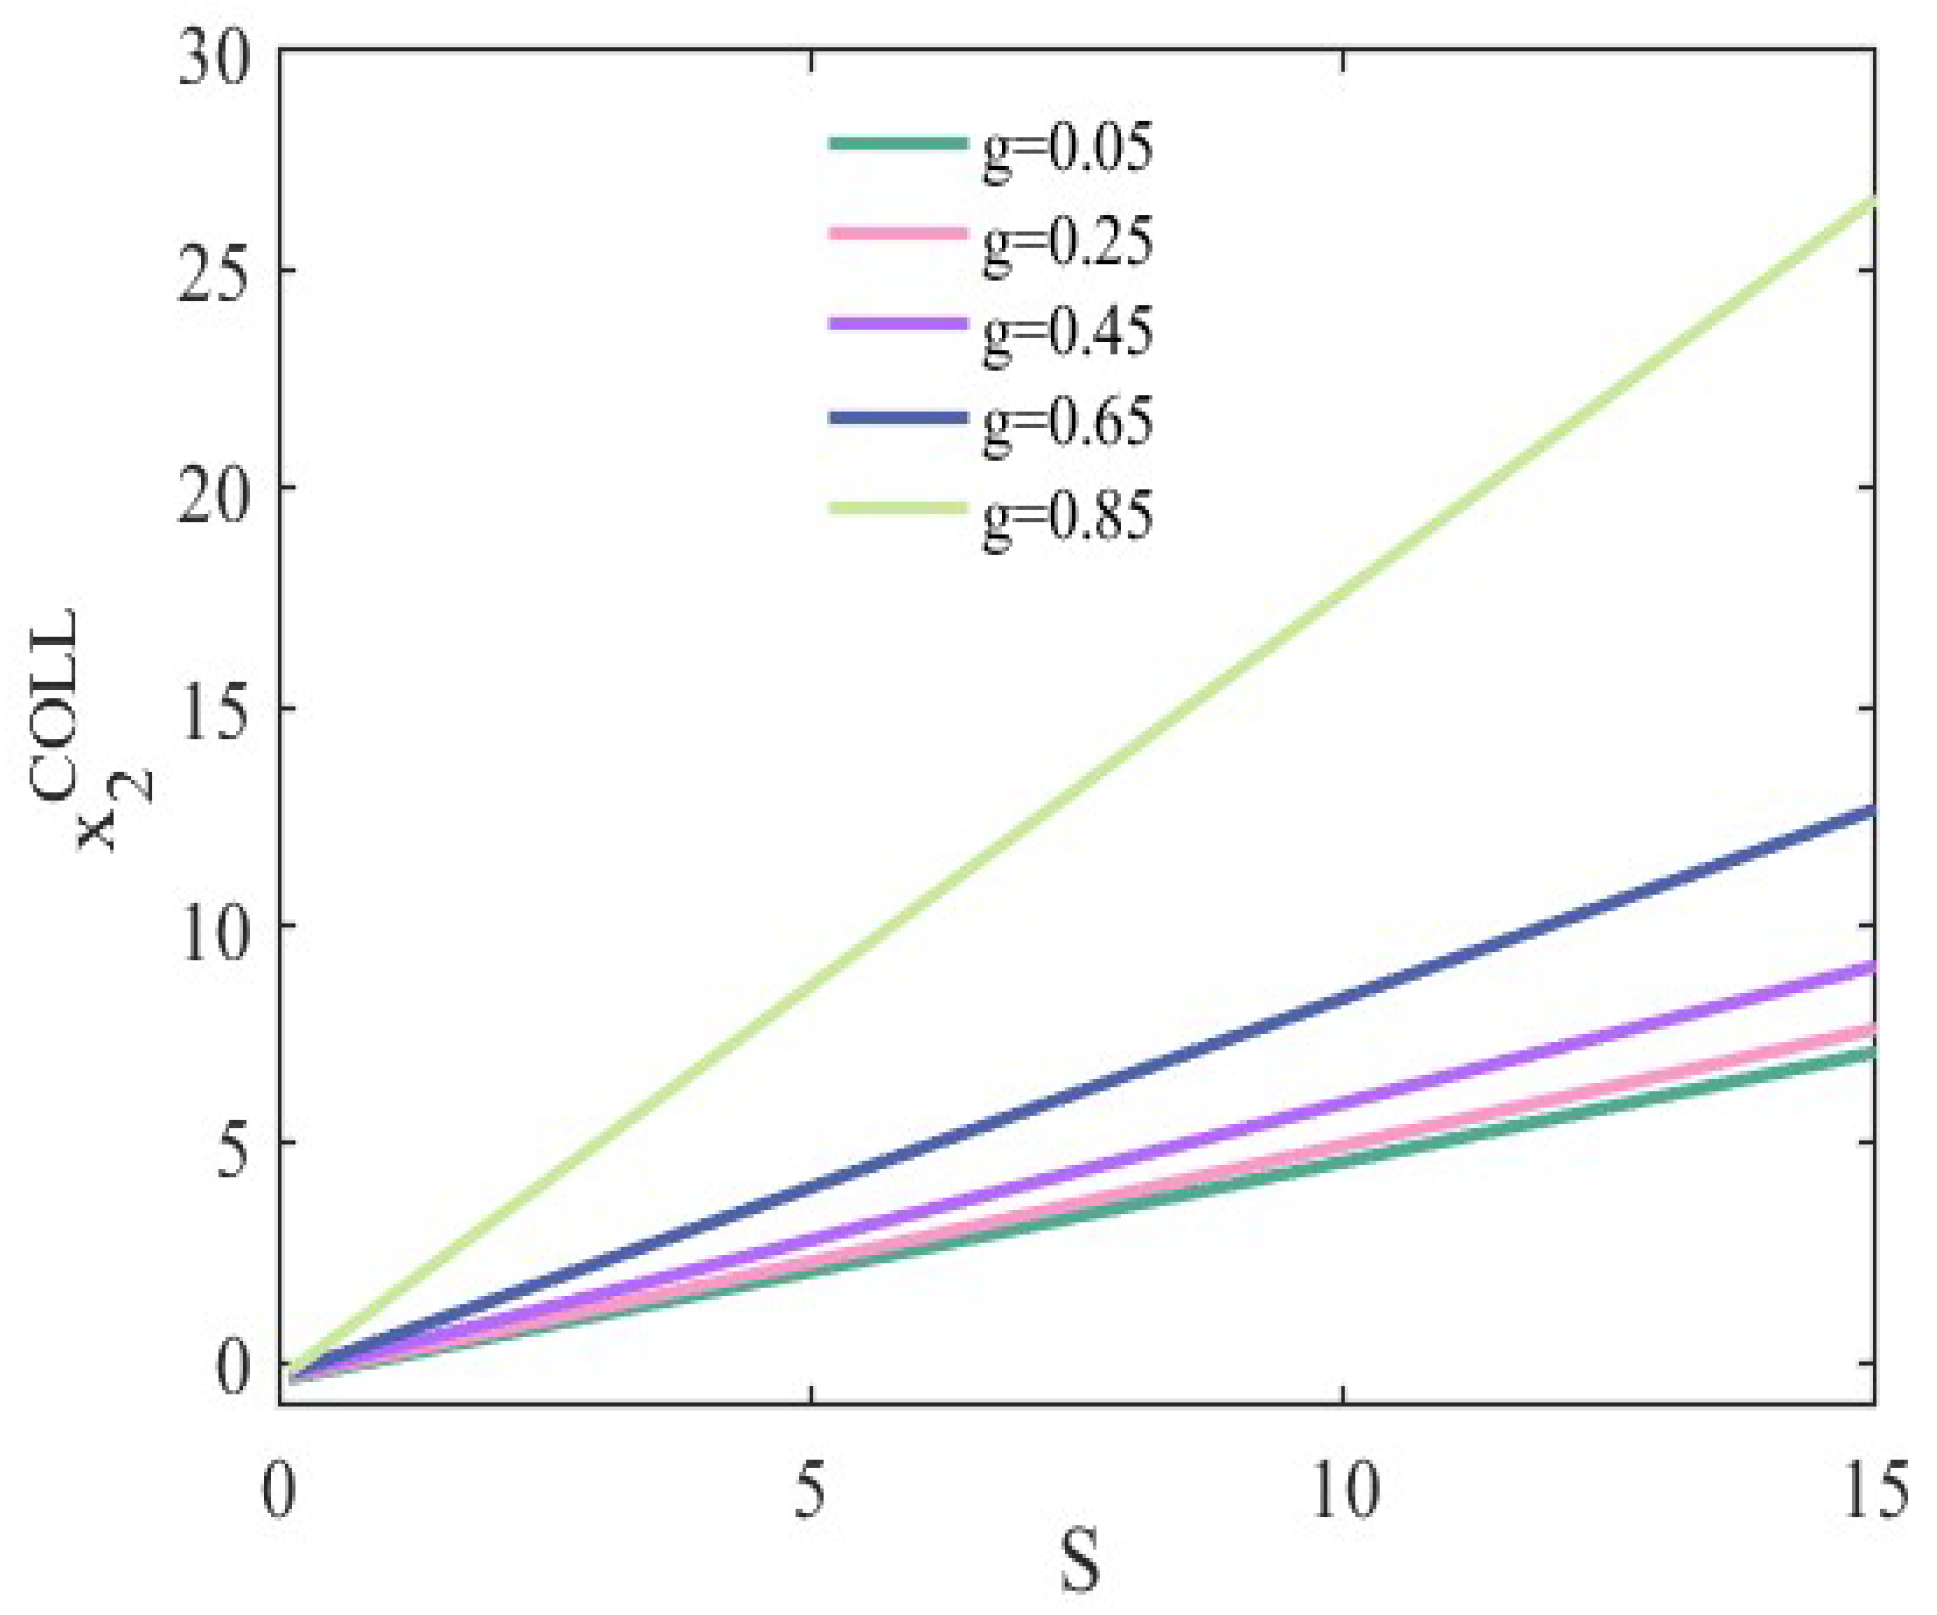
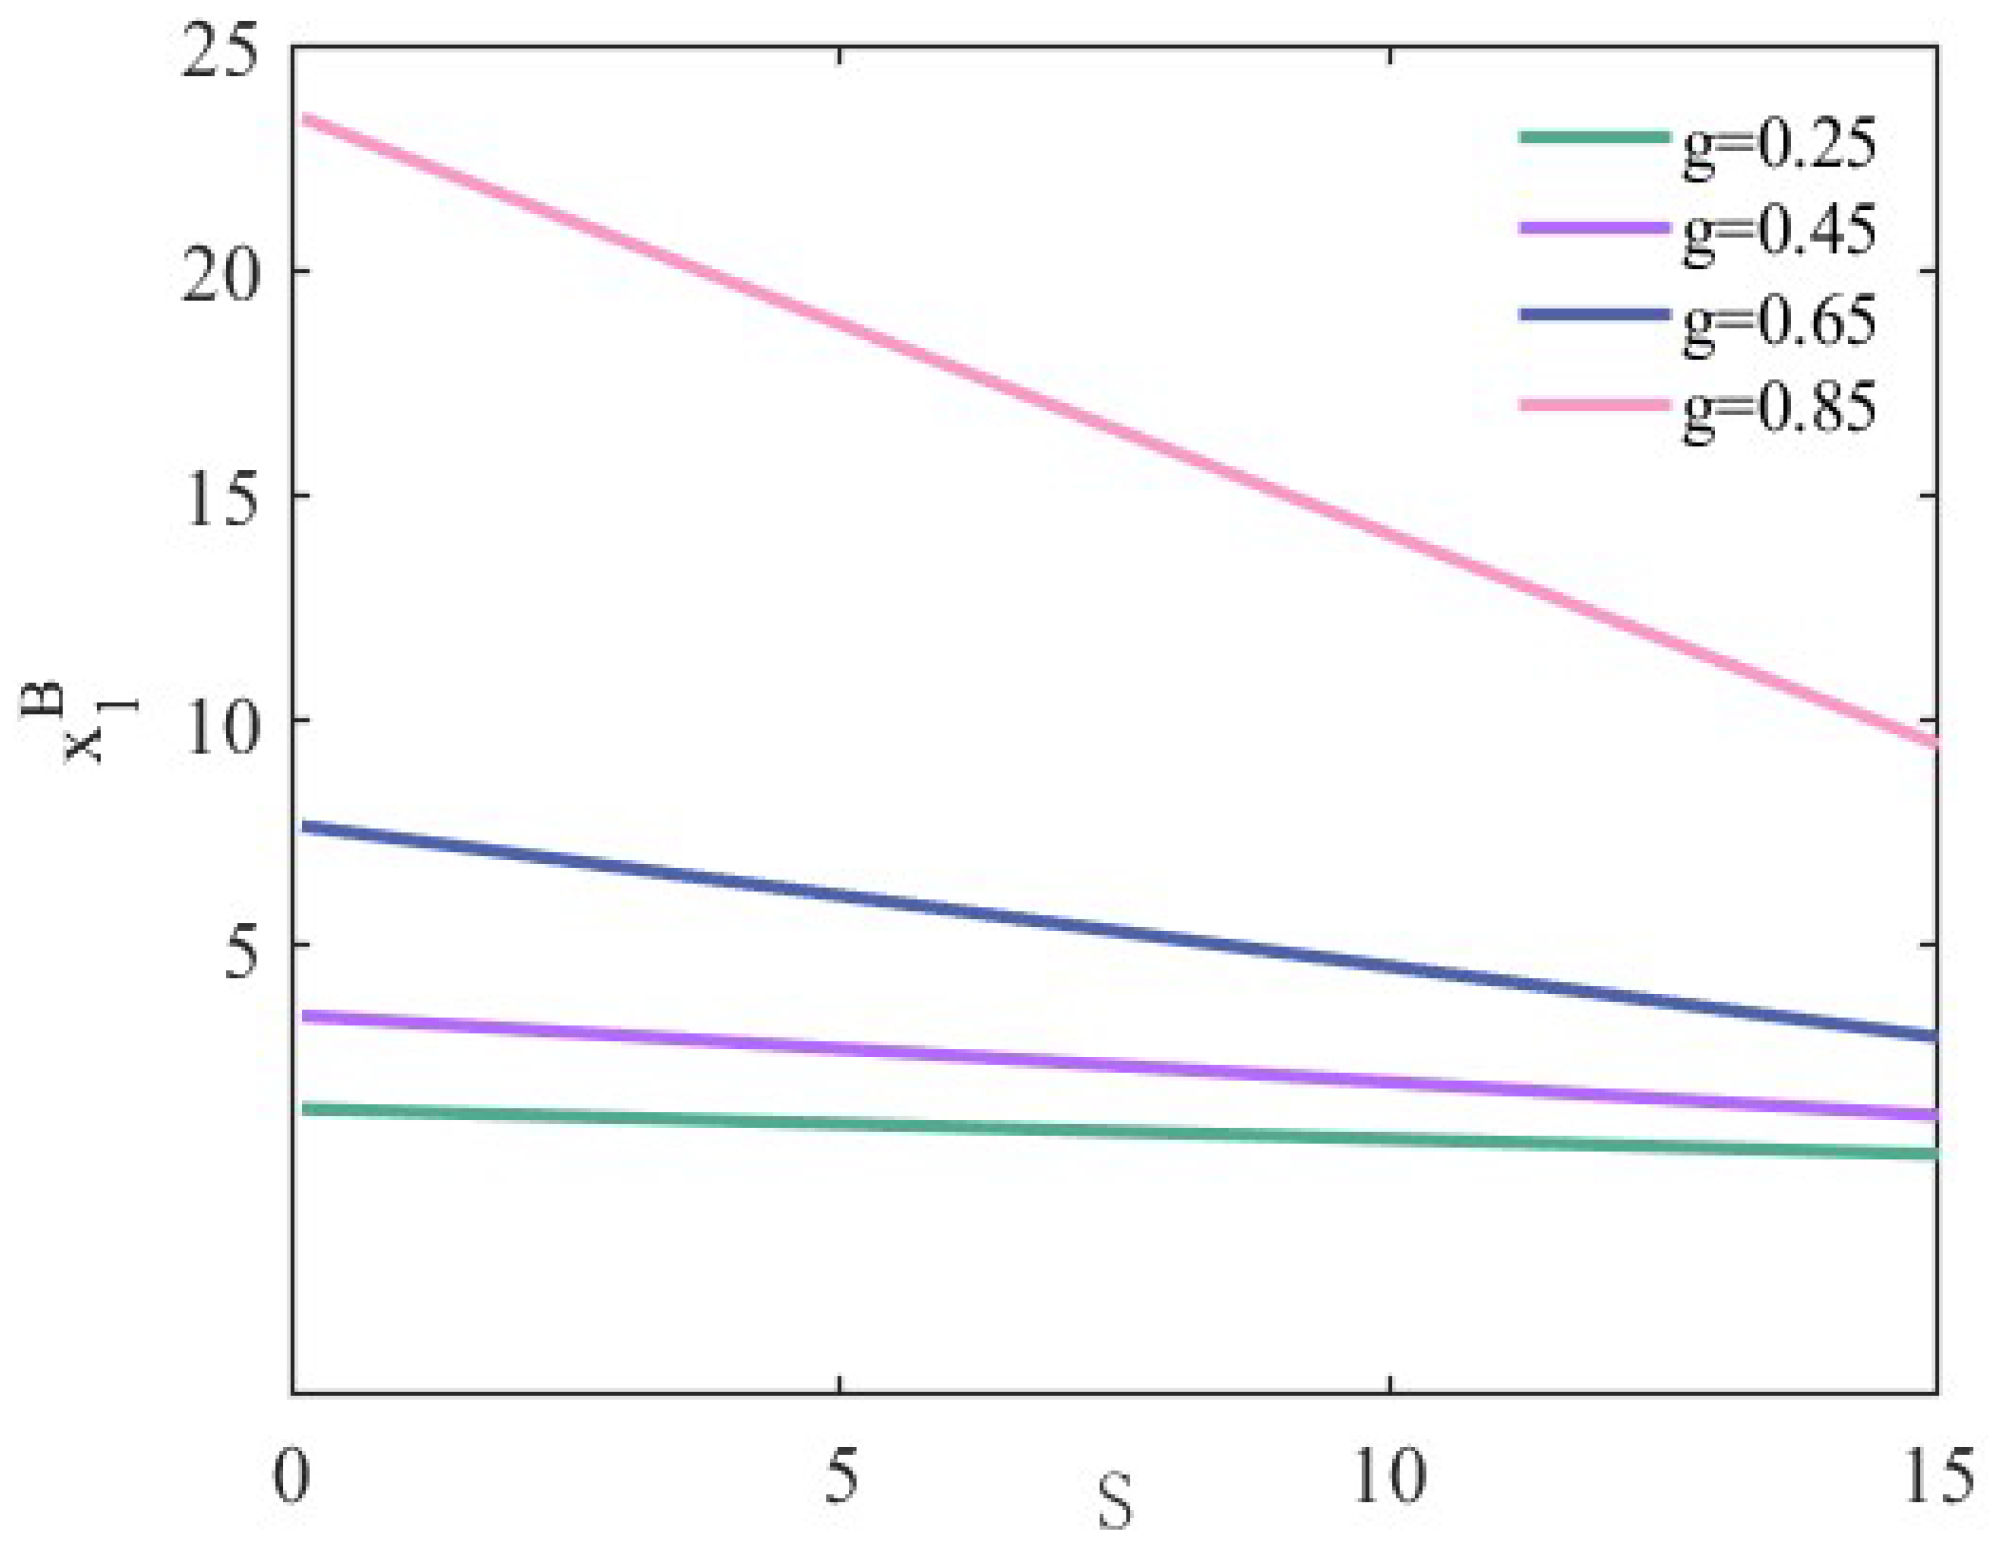
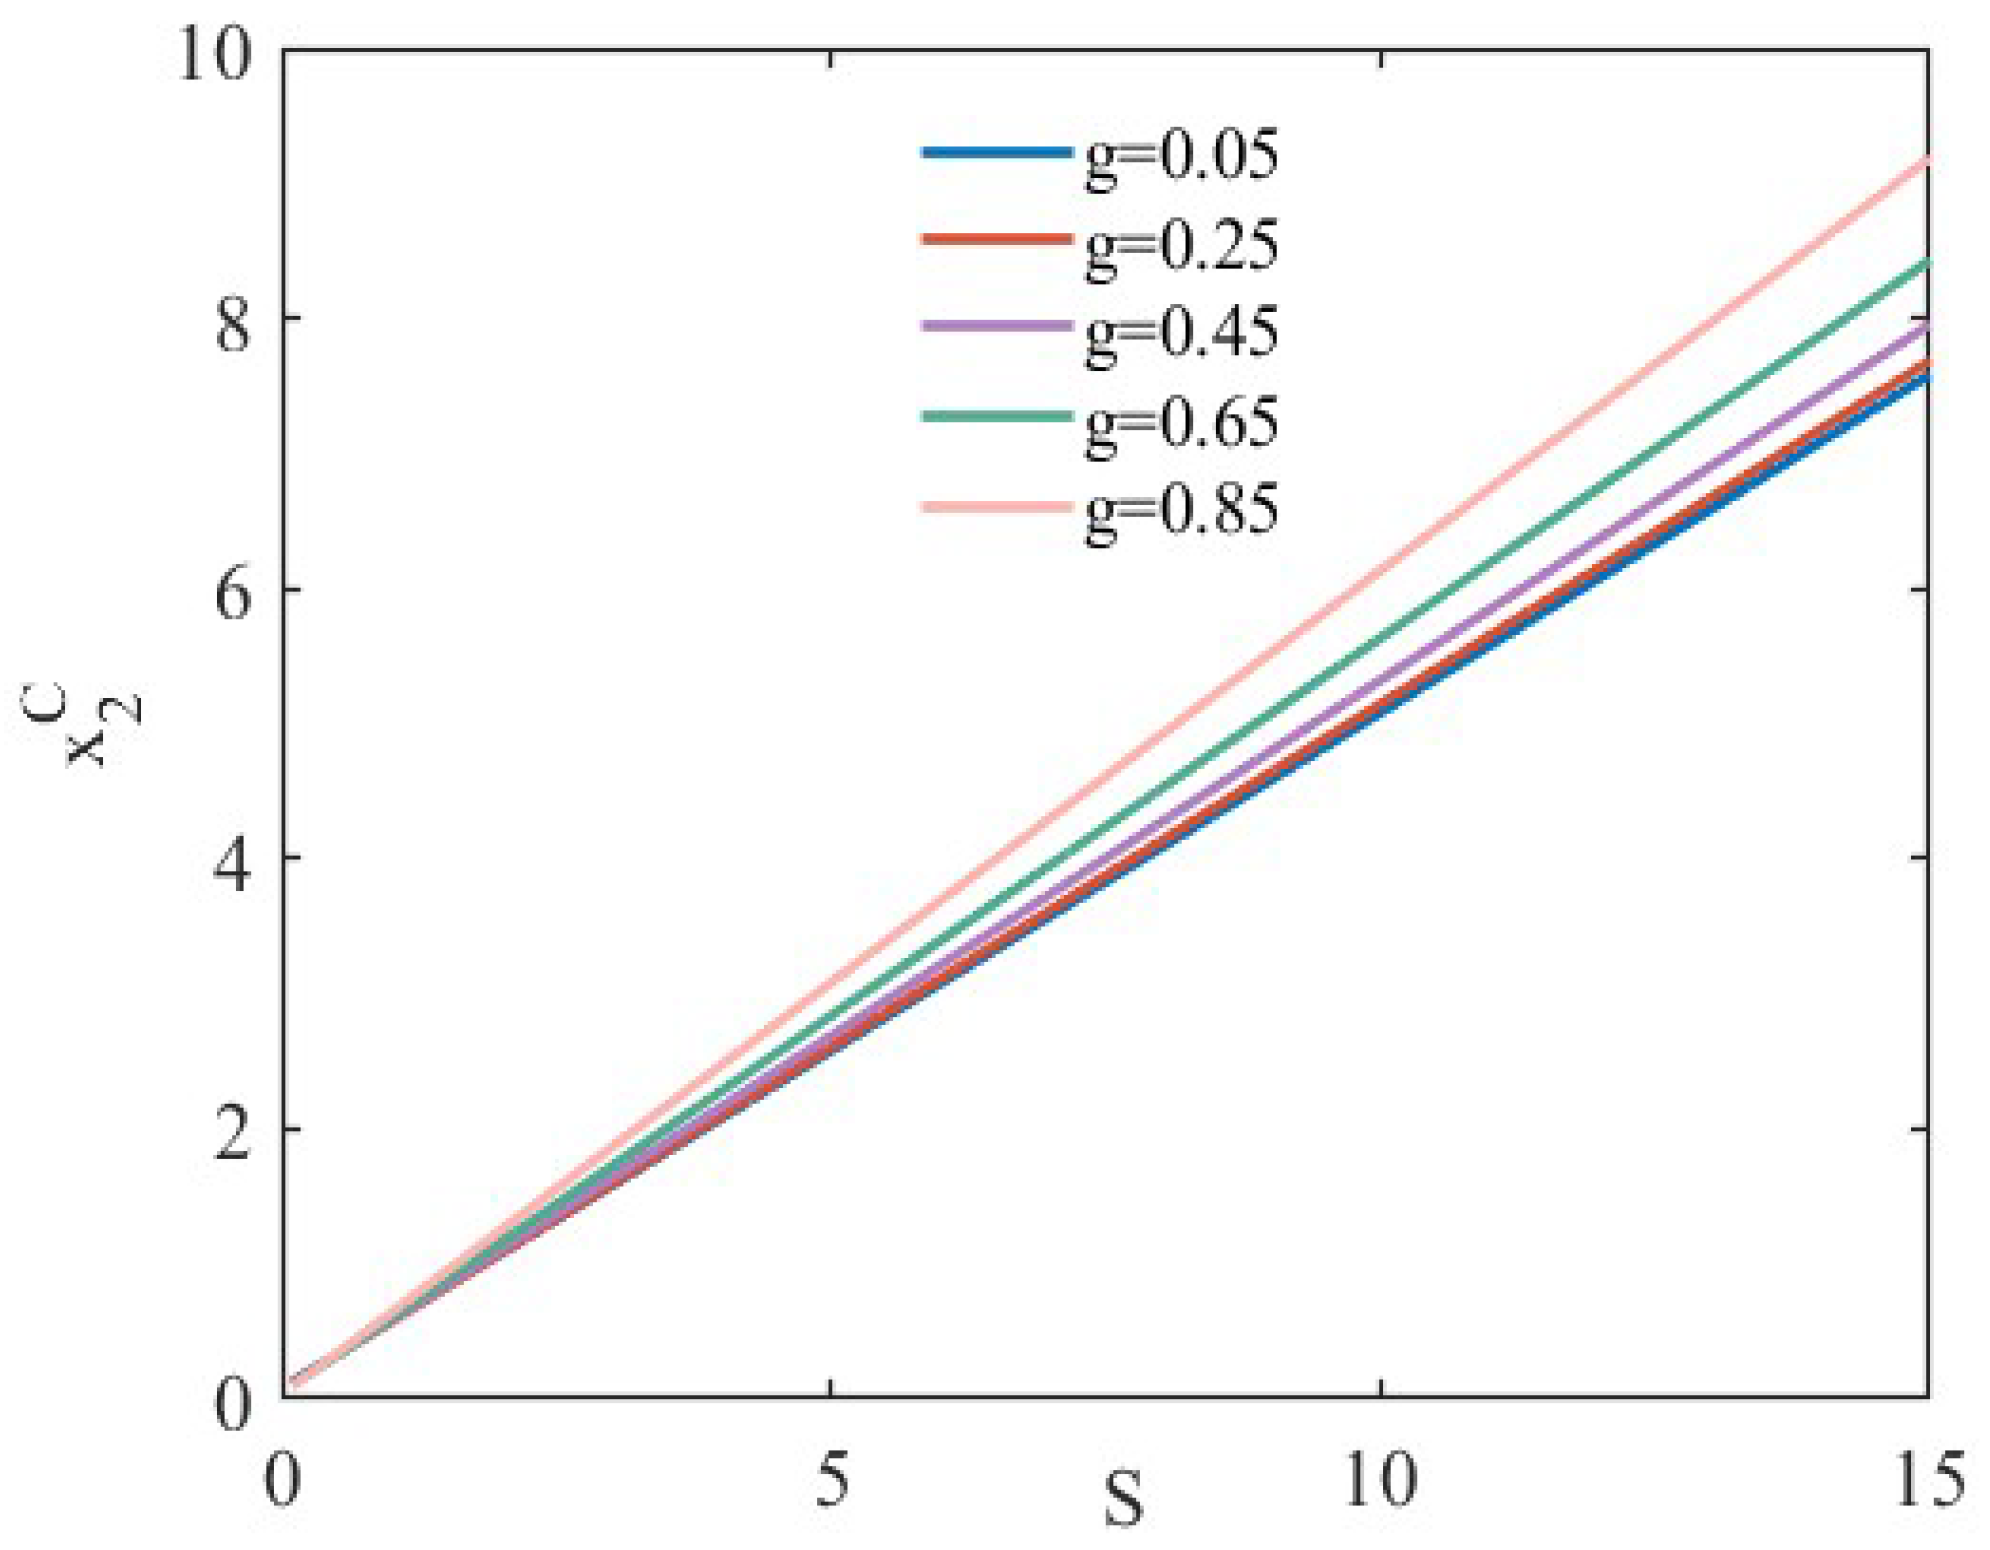
This paper also focuses on the impact of discounts on the potential user demand for two types of bike-sharing. Under three different scenarios, by differentiating the potential user demand for each type of bike-sharing with respect to discounts, we can derive the following results:
Therefore, when two bike-sharing operators compete, if one operator adopts discounts as a strategic approach, it will attract more users, thereby reducing the demand for its competitor.
Figure 4,
Figure 5 and
Figure 6 depict the variation in demand for two types of bike-sharing with discounts across different competitive scenarios. It can be seen that discounts do help operators attract more passengers, which is consistent with the above theoretical analysis and more in line with the facts. Additionally, our analysis reveals that the degree of substitution positively influences demand. For operators
and
, the higher the degree of substitution, the faster the demand increases (decreases) with discounts.
5.2. Fare and Discounts
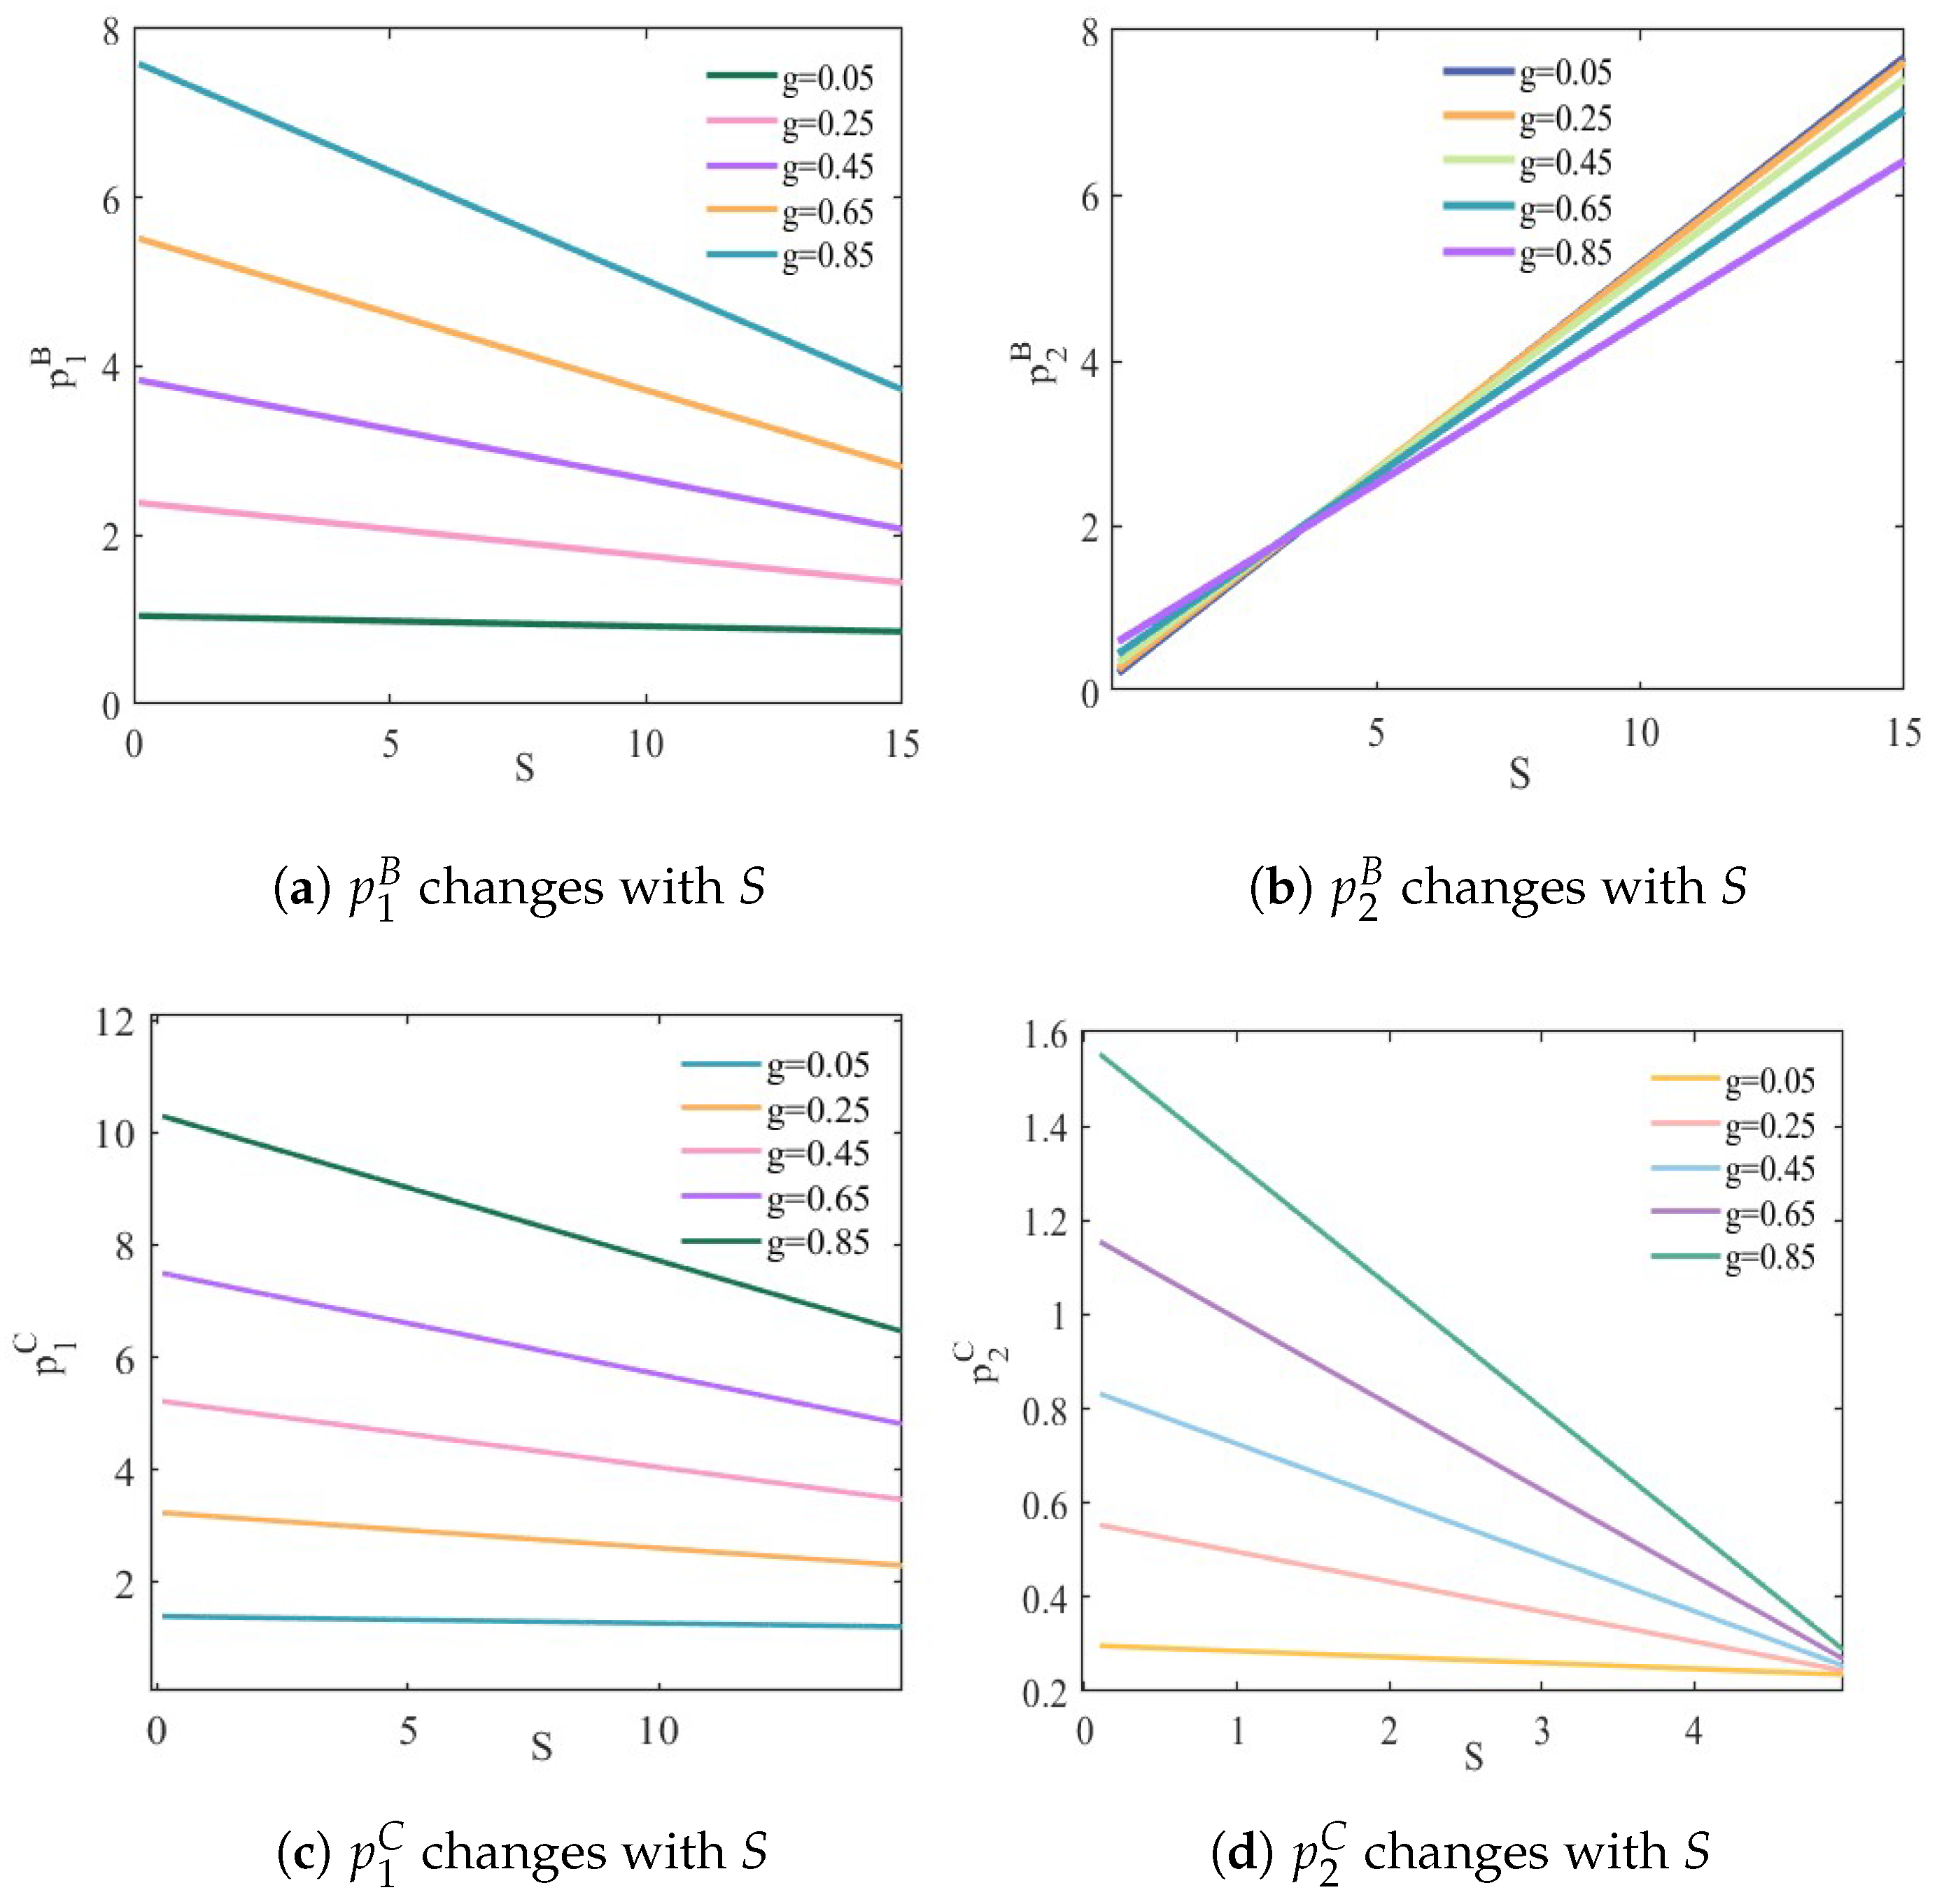
This section focuses on the fare changes of two bike-sharing operators under discounts. Numerical simulations will be employed to analyze the equilibrium pricing under three competitive scenarios, thereby comparing the differences in operators and pricing strategies of bike-sharing under varying competitive contexts.
According to
Figure 7a,b, as operator
increases its discounts, the fare of operator
shows a decreasing trend, while the fare of operator
exhibits an upward trend. This may be bike-sharing operator
, in response to the discount competition from operator
, reduces its fare to attract or retain users. On the other hand, operator
uses discounts as a market strategy to increase revenue by raising its fare while simultaneously attracting users through the discounts. Furthermore, the higher the degree of substitution
g between operators
and
, the more significant the fare decrease (increase) for
(
). According to
Figure 7c,d, the fares of
and
both show a decreasing trend. The higher degree of substitution
g, the greater decrease in fares for both
and
.
This section does not analyze the pricing of bike-sharing operators in scenario I, the discounts offered by operator
do not affect the equilibrium pricing of operator
(see Equation (
18)), and the equilibrium pricing of operator 2 is independent of the substitution level
g (see Equation (
19)).
5.3. Profits and Discounts
Based on the market equilibrium derived under different scenarios in
Section 4 and combining Equations (
29) and (
39), this section examines the relationship between the discounts offered by bike-sharing operator
and the profits of both bike-sharing operators. Furthermore, numerical simulations are conducted to analyze the profits of bike-sharing operators under the three competitive models.
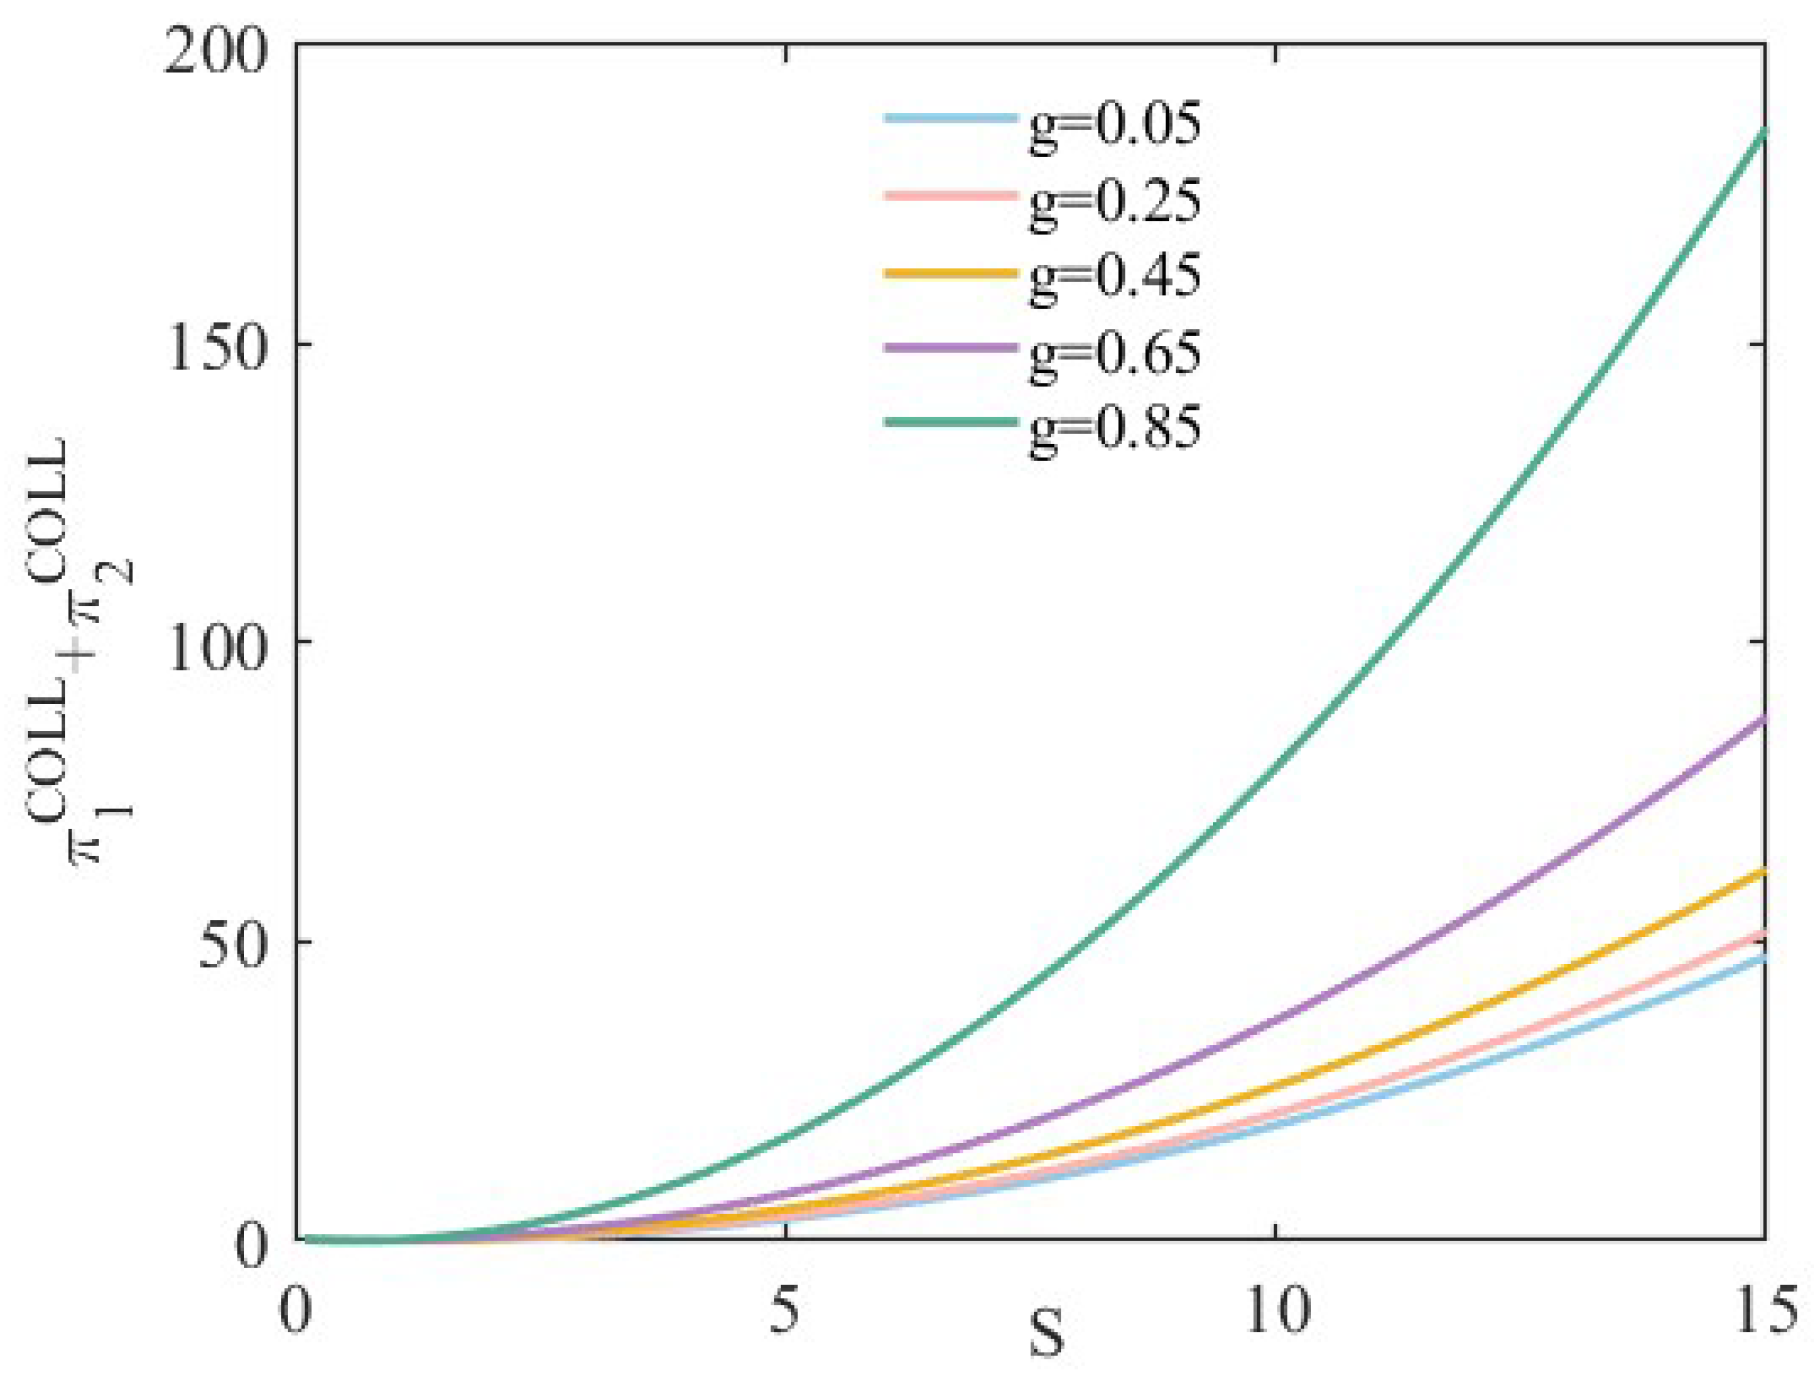
For scenario I, two bike-sharing operators focus on total profit. Therefore,
Figure 8 shows the total profit changes with discounts under collusion. It can be seen that the total profit is a convex function that will achieve an extreme.
With the discounts offered by bike-sharing operator
increasing, the total profits show an upward trend, as shown in
Figure 8. This indicates that, in scenario I, operator
attracts users by offering discounts, thereby increasing the total profit. The impact of different substitution levels
g on total profits is also evident—the higher the substitution level, the more significant growth in total profit.
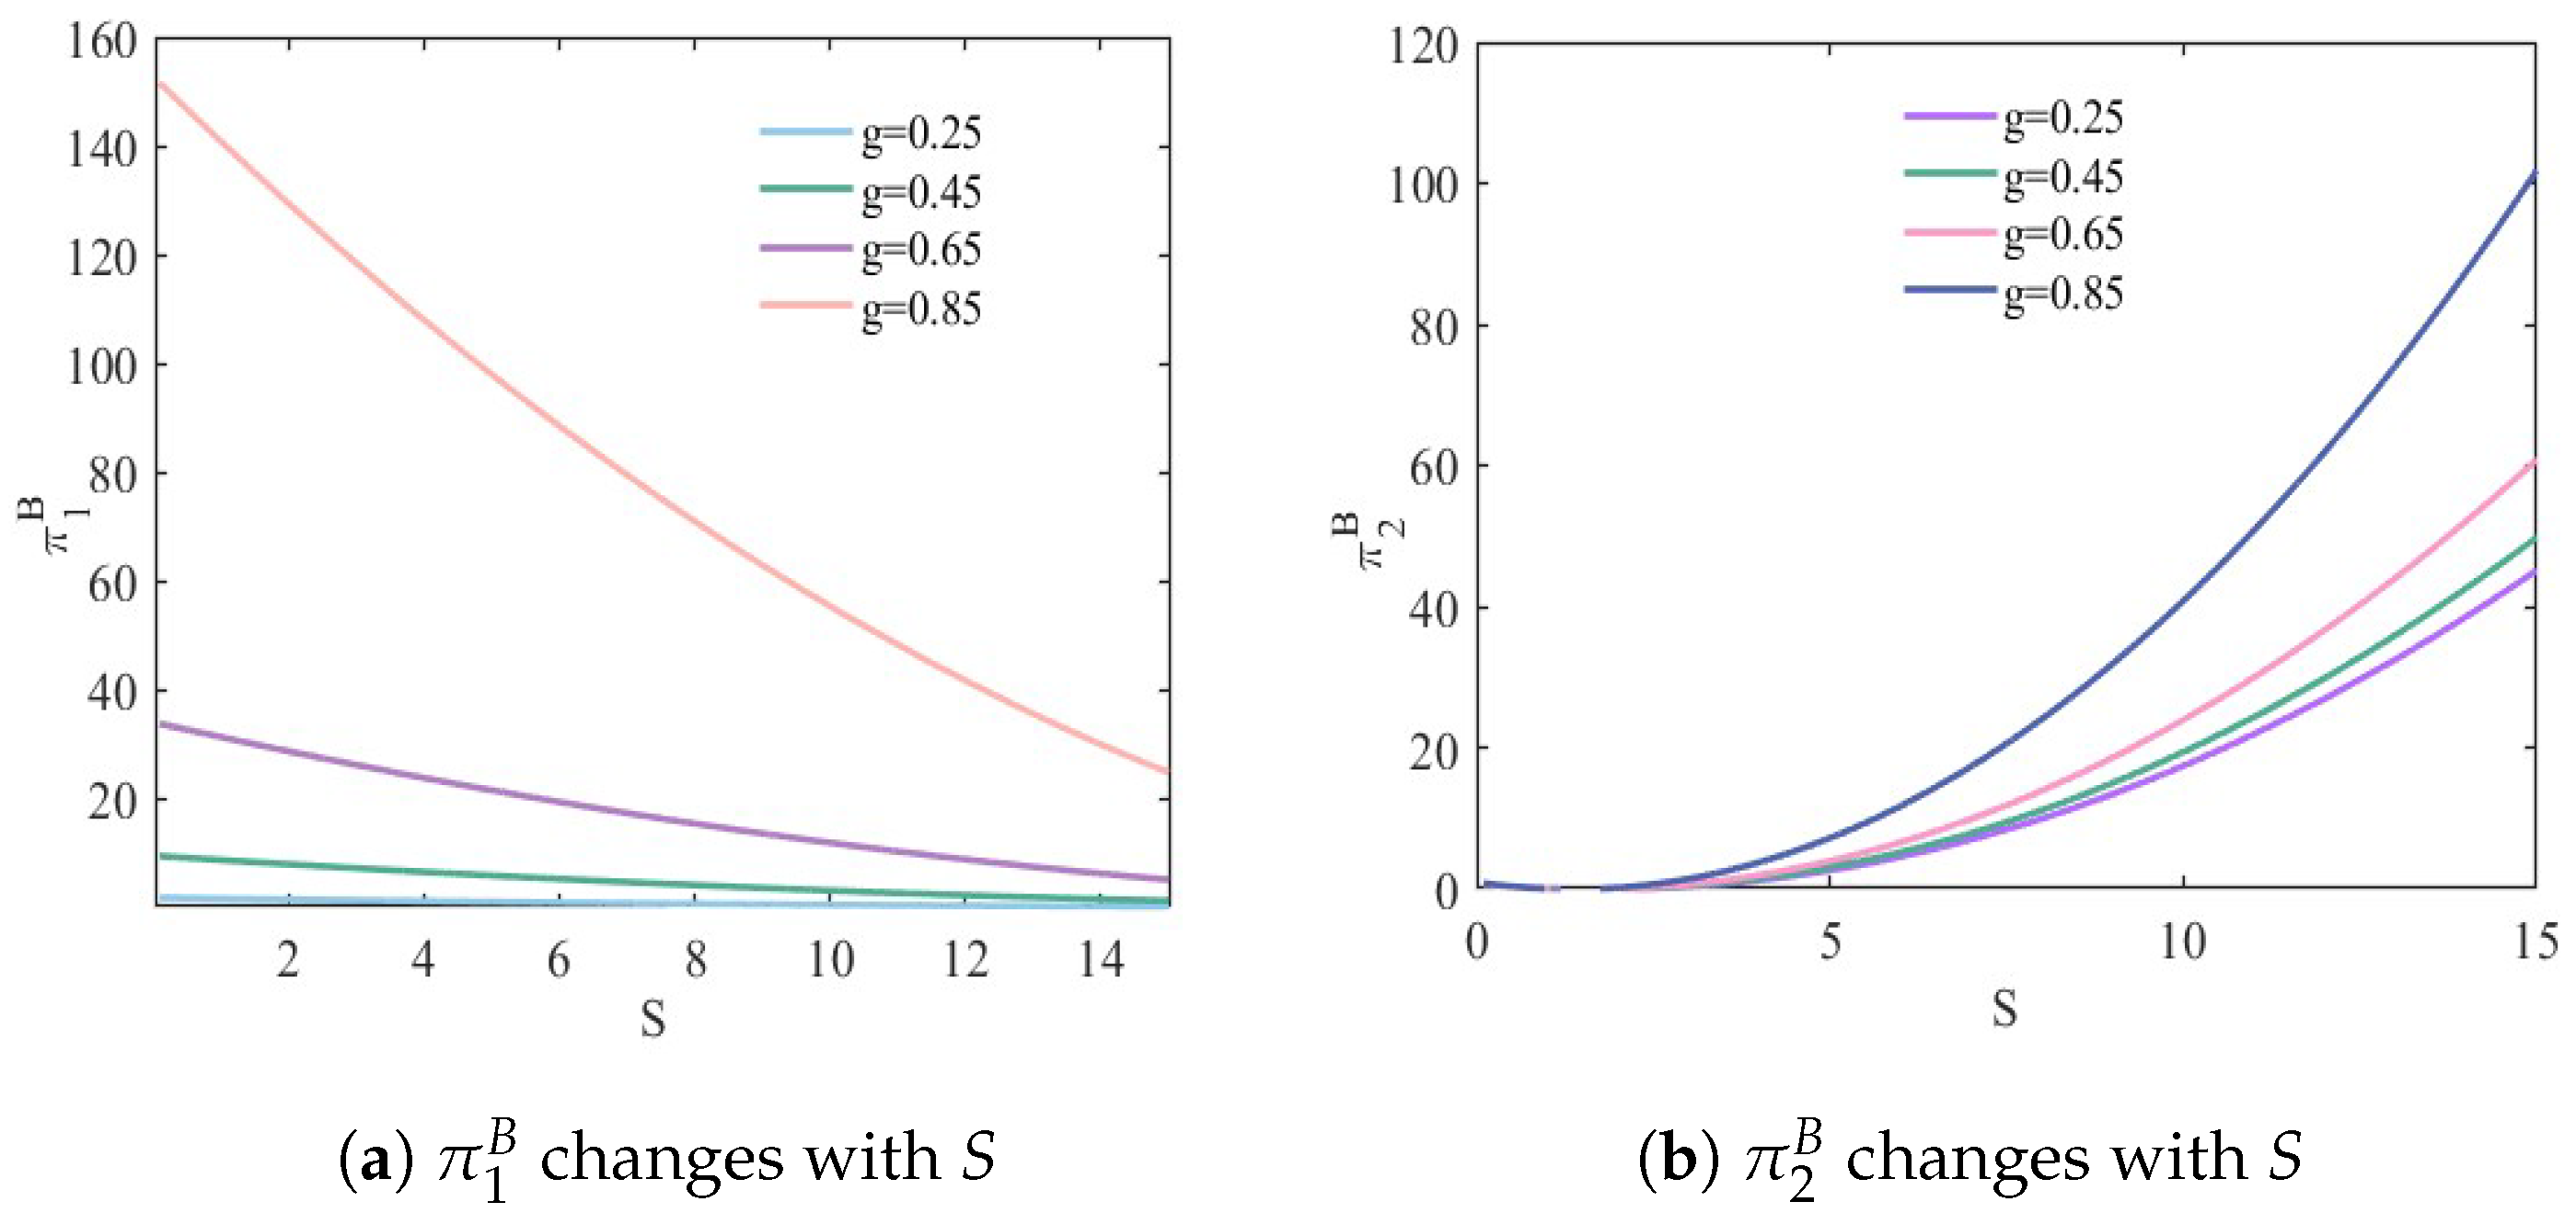
In
Figure 9, profits of bike-sharing operator
(
) under different substitution levels all show a decreasing (increasing) trend as the discounts increase. When operator
offers larger discounts, the market share for operator
may decrease, leading to a decline in its profits. Among them, the decline is most significant at a high substitution level
, indicating that under high substitution, discounts have the greatest impact on the profits of operator
.
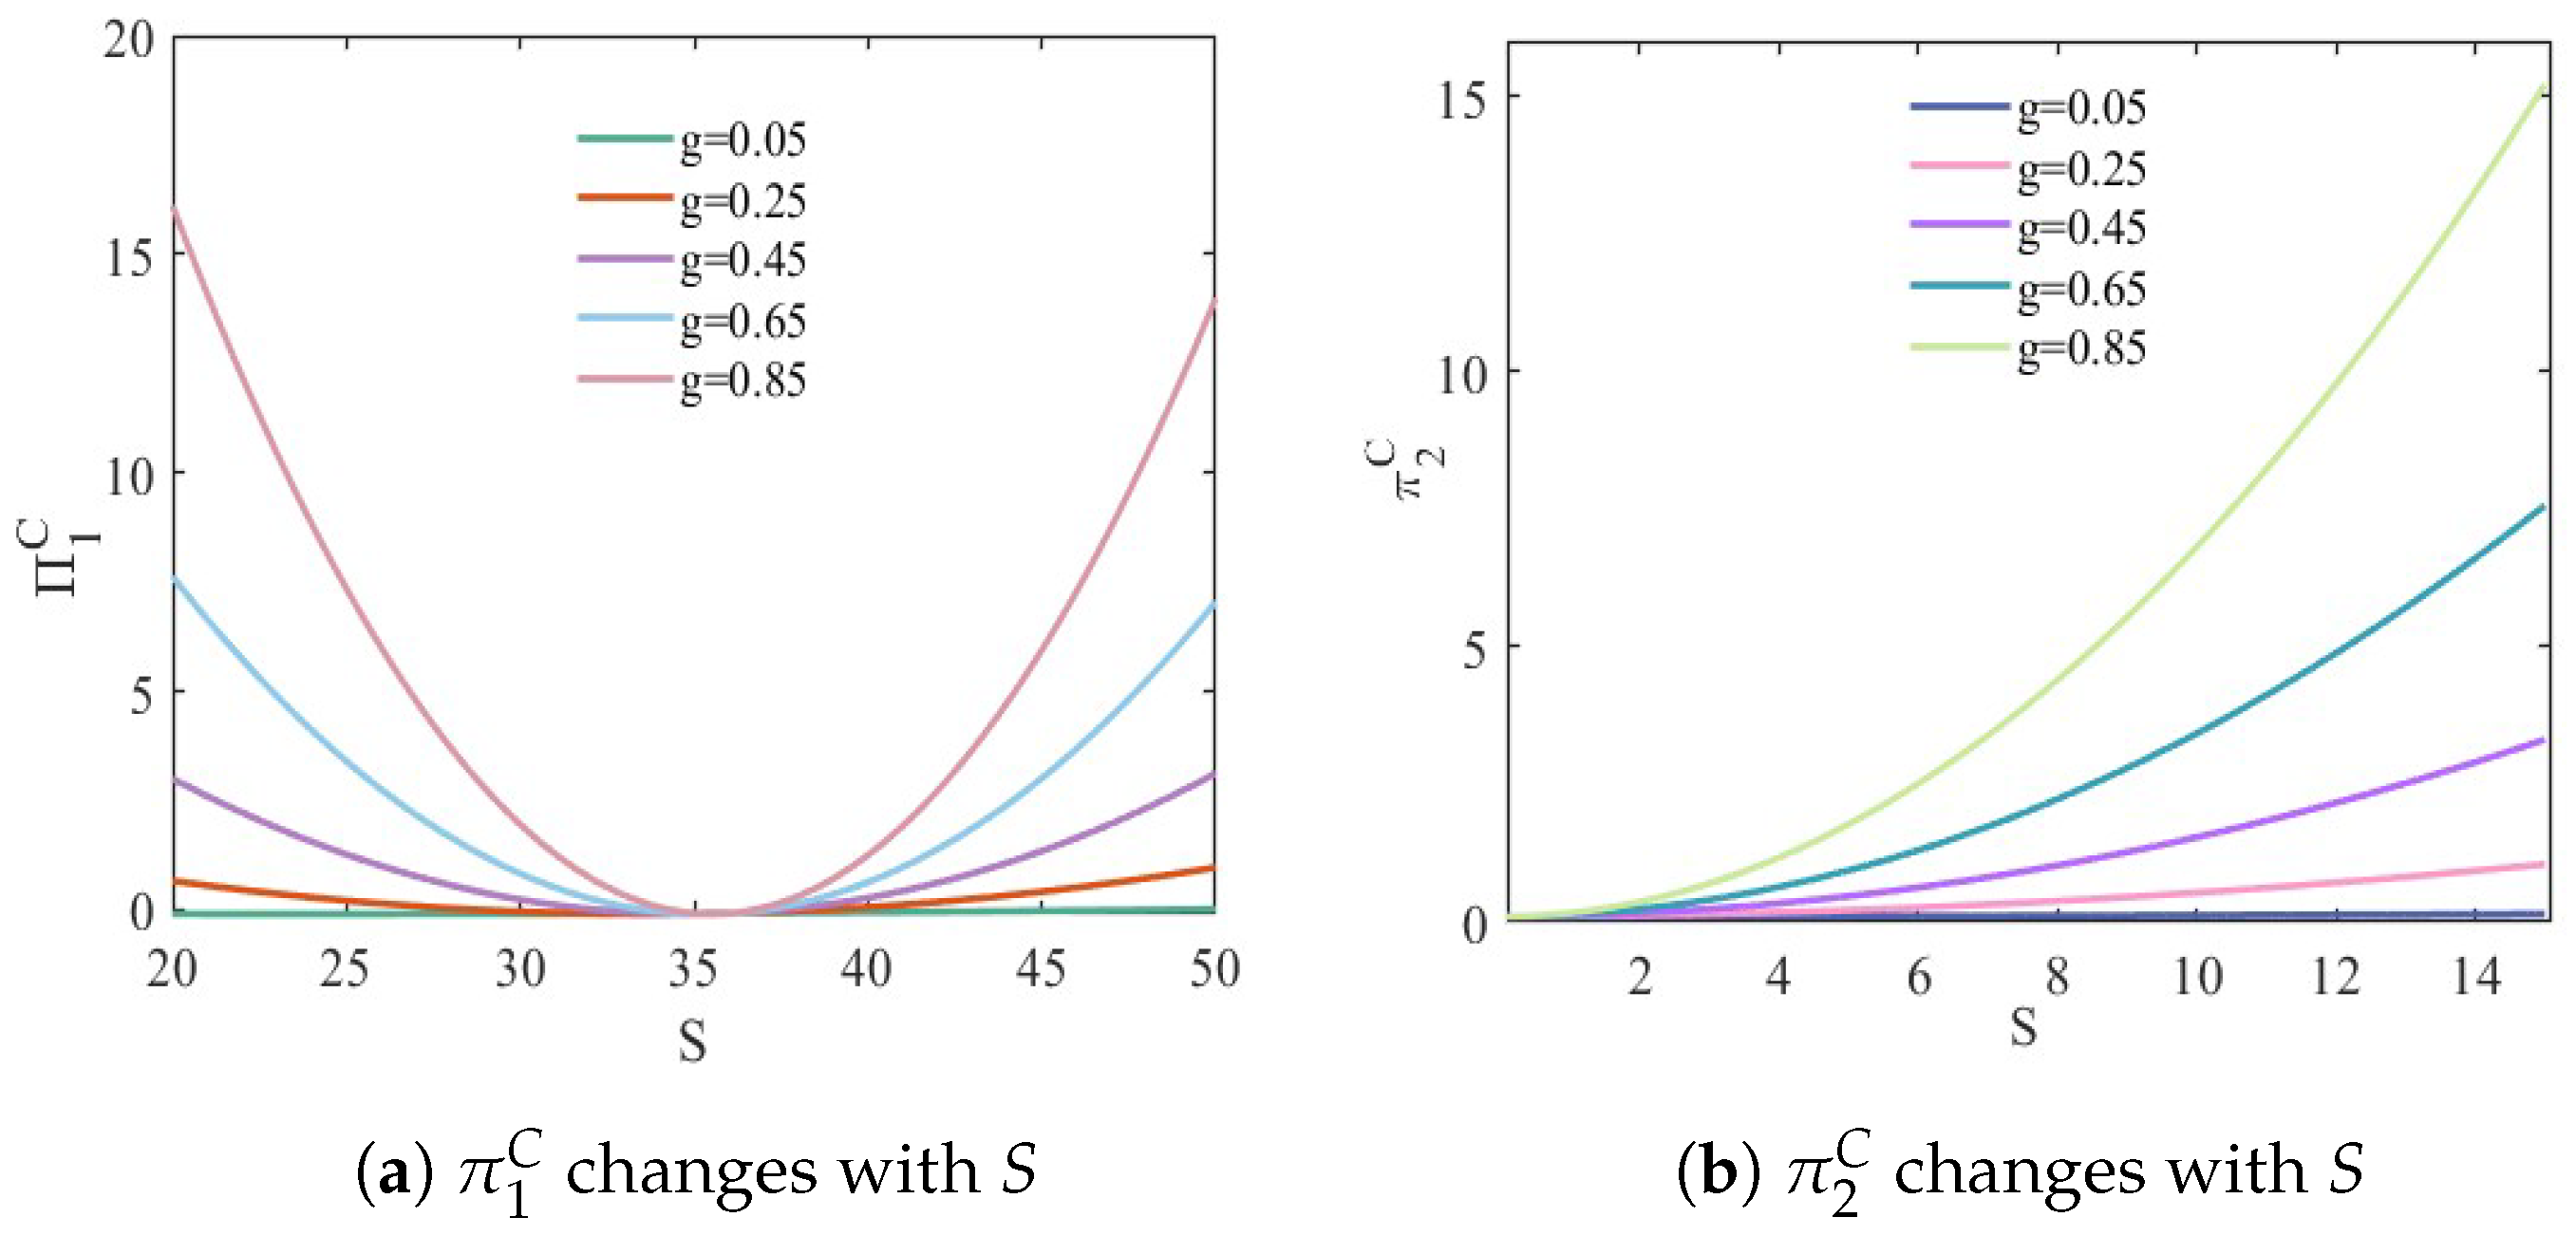
Figure 10 shows the change in profits for shared-bike operators at different levels of substitution (
g). In scenario III, the change in profits for the two operators is consistent. Operator
can significantly increase its profit by offering discounts, while Operator
must address the reduced profit caused by the discount strategy. The effect of the discounts offered to operator
becomes more pronounced when the degree of substitution is high.
6. Discussions
This study presents a systematic analysis of bike-sharing competition under three classical scenarios: total profit maximization (collusion), simultaneous competition based on potential user demand (Cournot), and simultaneous competition on pricing strategies (Bertrand). By examining pricing incentives and their impact on market equilibrium, this research highlights the economic interactions between bike-sharing operators. Notably, in constructing the generalized travel cost for passengers, special attention is given to comfort costs and discount incentives, aspects that are rarely addressed in existing literature. Nonetheless, certain limitations and potential areas for enhancement remain to be acknowledged.
(1) This study builds upon existing models to explore the impact of discount incentives and comfort loss costs on market equilibrium, which may limit its innovativeness. Although the modeling approach employed has yielded some intriguing results, our study serves as an extension of previous research rather than a groundbreaking contribution. Future research could adopt novel modeling approaches, such as incorporating advertising revenue, establishing partnerships with public transportation systems, or considering environmental sustainability factors, to provide a more comprehensive understanding of bike-sharing economics.
(2) To investigate the impact of discount incentives on market equilibrium among bike-sharing operators under different competitive scenarios, the discount schemes were simplified during the modeling process. Specific discount details, such as seasonal variations and targeted promotions, which play a critical role in shaping user behavior, were not considered. While these simplifications allowed us to focus on the influence of discount incentives on market equilibrium, they may have reduced the practical applicability of the findings. Future research could incorporate dynamic pricing, targeted incentives, and other real-world discount strategies to better capture the complexities of the bike-sharing market.
(3) To study the impact of discount incentives and comfort levels on competition in the bike-sharing market, this paper does not take into account the effects of external factors such as government policies, weather conditions, and competition with public transportation systems when constructing the model. In future research, the model can be extended to include these key factors in bike-sharing trip choice models to more comprehensively reflect the complex dynamics of the real bike-sharing market.
Despite certain limitations, this study provides valuable insights for bike-sharing operators in designing pricing and discount strategies. The findings suggest that discount incentives can be an effective approach to attracting riders and enhancing profitability. However, their specific impact depends on factors such as competitive dynamics, the level of substitution between different types of bike-sharing services, and various other considerations. Operators should take these elements into account when formulating discount schemes. Addressing the identified limitations in future studies will further enhance the practical significance and theoretical contributions of research in this field.
7. Conclusions
With the rapid development of bike-sharing, research on this topic has become increasingly abundant, particularly studies addressing the competition between bike-sharing services. The modeling approaches and game theory frameworks presented in the literature have provided valuable methodological insights for this study. However, existing research rarely integrates the effects of discount incentives and comfort on the bike-sharing market. To address the issue of competition between two types of bike-sharing services commonly observed around bus stops, subway stations, and residential areas, this paper develops two travel choice models for bike-sharing. The travel models connect bus stops, subway stations, and residential areas, considering only two types of bike-sharing as viable options. We focused primarily on analyzing the impact of pricing incentives offered by bike-sharing operators on equilibrium pricing, demand, and profits. When defining the generalized travel cost for passengers, we gave particular attention to the cost of comfort loss and the discounts available to cyclists. Additionally, we examined the relationship of fares and cycling distance between two bike-sharing operators under different competitive modes. Our findings indicate that cycling distance has the least influence on fares under Bertrand competition and the most under Cournot competition. Furthermore, our study revealed that discounts offered by bike-sharing operators effectively attract more cyclists, thereby increasing the operators’ profitability, which aligns with real-world observations. In addition, the substitution level between the two types of bike-sharing has a positive effect on fares and the number of riders. The higher the substitution level, the stronger the ability of operators to attract passengers through discounts.
This study considered both “discount incentives” and “comfort levels” in the bike-sharing trip choice model. While it builds upon existing models, it is far from a simple extension and represents a contribution of significant academic value. Previous research has primarily focused on price competition and quantity competition. By introducing the two key variables of “discount incentives” and “comfort levels”, this study offers a novel perspective for understanding the dynamic mechanisms of the bike-sharing market.
On the one hand, discount incentives, as an important factor influencing users’ short-term choices, can effectively attract new users or prompt users to switch between different brands. However, solely relying on discount strategies may lead to intense market competition and even provoke “price wars”. In this context, the variable “comfort level” becomes particularly critical. Comfort level encompasses various aspects, including riding experience, convenience of returning bikes, and bike availability, directly affecting users’ long-term satisfaction and loyalty. If bike-sharing operators can provide moderate discounts to attract users while maintaining a high level of comfort, they are more likely to stand out in the competitive market, achieving sustainable user growth and stable market share.
On the other hand, this paper is not only of significant academic value but also provides valuable insights for practice and policymaking. For operators, the study clarifies the distinct roles and interrelations of discount incentives and comfort levels in market competition, offering a basis for developing more precise market strategies and helping operators strike an optimal balance between attracting new users and retaining existing ones. From a policy perspective, understanding the competitive mechanisms of the bike-sharing market is crucial for formulating reasonable regulatory policies. Government bodies can guide enterprises in setting appropriate discount incentives to avoid excessive competition that may lead to market disorder while also encouraging bike-sharing companies to enhance service comfort. This approach can improve the overall service quality of the industry, promote the healthy development of the bike-sharing sector, and ultimately achieve a win-win situation for users, businesses, and society.
Therefore, this study not only deepens the understanding of the competitive mechanisms in the bike-sharing market but also provides strong theoretical support for strategic decision-making and policymaking by enterprises, making a significant contribution to the development of the bike-sharing industry.


