Article

Fusion YOLOv8s and Dynamic Convolution Algorithm for Steel Surface Defect Detection

School of Mathematics and Statistics, North China University of Water Resources and Electric Power, Zhengzhou 450046, China
*
Authors to whom correspondence should be addressed.
Symmetry 2025, 17(5), 701; https://doi.org/10.3390/sym17050701
Submission received: 1 April 2025 / Revised: 28 April 2025 / Accepted: 30 April 2025 / Published: 4 May 2025
(This article belongs to the Section Engineering and Materials)

Abstract

:
The detection of surface defects in steel is a prerequisite for improving steel quality. When detecting surface defects in steel, the texture features of defective areas often show significant differences from the symmetry patterns of normal areas. To address the issues of low accuracy and slow recognition speed in existing steel surface defect detection methods, this study proposes an improved defect detection method based on YOLOv8s. To focus on the information of asymmetric areas in images and amplify the model’s capacity to learn target defects, we integrate the ODConv (Omni-Dimensional Dynamic Convolution) module into the backbone feature extraction network. This module infuses attention within the convolution process, augmenting the feature extraction capacity of the backbone network. Furthermore, to refine the regression speed of target boxes and enhance positioning accuracy, we adopt the WIoU (Wise Intersection over Union) bounding box loss function, featuring a dynamic non-monotonic focusing mechanism. Experimental results on the NEU-DET dataset reveal that the improved YOLOv8s-OD model achieves a 4.5% accuracy improvement compared to the original YOLOv8s, with an mAP of 78.9%. The model demonstrates robust performance in steel surface defect detection. With a modest size of only 21.5 MB, the model sustains a high detection speed of 89FPS, elevating detection accuracy while preserving real-time performance. This renders the model highly applicable in real-world industrial scenarios.

1. Introduction

Steel is commonly used in the construction of various infrastructures, particularly in industries such as automotive, aerospace, and machinery, where there are strict requirements for surface precision. From the perspective of materials science, the essence of surface defects lies in local symmetry breaking. However, traditional detection methods such as manual inspection, non-destructive testing, and laser scanning detection suffer from limitations including inefficiency, inadequate precision, and difficulties in defect classification for such symmetry-breaking anomalies. Machine vision methods, due to their high computational complexity and limited adaptability to different scenarios, also present certain constraints in this field. With the introduction of the AlexNet [1] network in 2012, Convolutional Neural Networks (CNN) have significantly excelled in the area of computer vision, fostering rapid advancements in deep learning-based object detection. CNNs offer benefits such as high speed, robustness, accuracy, and strong adaptability.
Currently, common target detection algorithms fall into two categories. The first category comprises two-step algorithms such as Region-based Convolutional Neural Network (R-CNN) [2], Fast R-CNN [3], Faster R-CNN [4], and Mask R-CNN [5]. These algorithms follow a two-step process of feature extraction and candidate box selection, resulting in lower error rates and missed detection rates. Zhao et al. [6] reconstructed the Faster R-CNN feature extraction network using deformable convolution to improve the network’s feature extraction capacities. They introduced a feature pyramid network to fuse multi-scale feature maps, thereby improving the network’s ability to detect surface defects in steel. Another approach by Junting and Xiaoyang [7] proposed an R-CNN defect detection algorithm based on a cascaded attention mechanism, effectively enhancing feature extraction capabilities by inserting lightweight attention modules into the convolutional neural network. This method achieved high-quality classification and localization of defects on metal surfaces. Xia et al. [8] displayed an improved Faster R-CNN detection algorithm that incorporates the Convolutional Block Attention Module (CBAM) [9] into the Region Proposal Network (RPN) structure. They adopted the Path Augmented Feature Pyramid Network (PAFPN) structure to fuse multi-layer features, enhancing the model’s capability to distinguish defects from the background. Li et al. [10] integrated the PAFPN into the backbone feature extraction network and employed soft non-maximum suppression to further improve the detection performance of Faster R-CNN.
Another category includes single-stage algorithms such as the Sum of Squared Differences (SSD) algorithm and the YOLO (You Only Look Once) series, which directly predict classification and localization after feature extraction. Lin et al. [11] improved the SSD algorithm to learn steel defects, employing the Residual Network (ResNet) for defect classification and optimizing steel surface defect detection. Zhang et al. [12] based on YOLOv5, introduced a micro scale detection layer and incorporated the CBAM into the feature fusion layer, so as to decrease the loss of feature information for small target defects. Wang et al. [13] proposed an enhanced YOLOv7 algorithm, constructing an image-enhanced feature extraction branch and introducing the context transfer module. This module fuses features from the original and enhanced images. Additionally, Focal EIOU serves as the bounding box regression loss of the model to mitigate performance degradation resulting from overlapping underwater objects. Bhookya Nageswararao Naik et al. [14] put forward an enhanced single-stage object detection model, which utilizes the exponential linear unit activation function in the convolution layers and the sigmoid activation function at the output layer, thus enhancing detection accuracy. As reported in the relevant literature, researchers have improved the feature extraction capabilities of detection models by modifying the network architectures and introducing attention mechanism modules. Moreover, the use of more rational and comprehensive loss functions has significantly enhanced the precision of bounding box localization.
In defect detection tasks, the primary challenge is to ensure both rapid detection speed and high accuracy. The two-stage R-CNN algorithms provide high detection accuracy but suffer from slower processing speeds. In contrast, the one-stage YOLO and SSD algorithms improve detection speed at the expense of some accuracy. Typically, a processing speed of 30 FPS is required for real-time detection, and an accuracy exceeding 80% is considered adequate for practical applications.
The two-stage R-CNN series algorithms exhibit high detection accuracy but slower detection speeds. In contrast, single-stage algorithms like YOLO and SSD enhance detection speed at the expense of some accuracy. How to maintain the efficient inference speed of a single-stage algorithm, while optimizing the feature extraction mechanism and bounding box regression strategy to achieve high-precision detection of multiple types and scales of surface defects in steel, is a key challenge in current research.
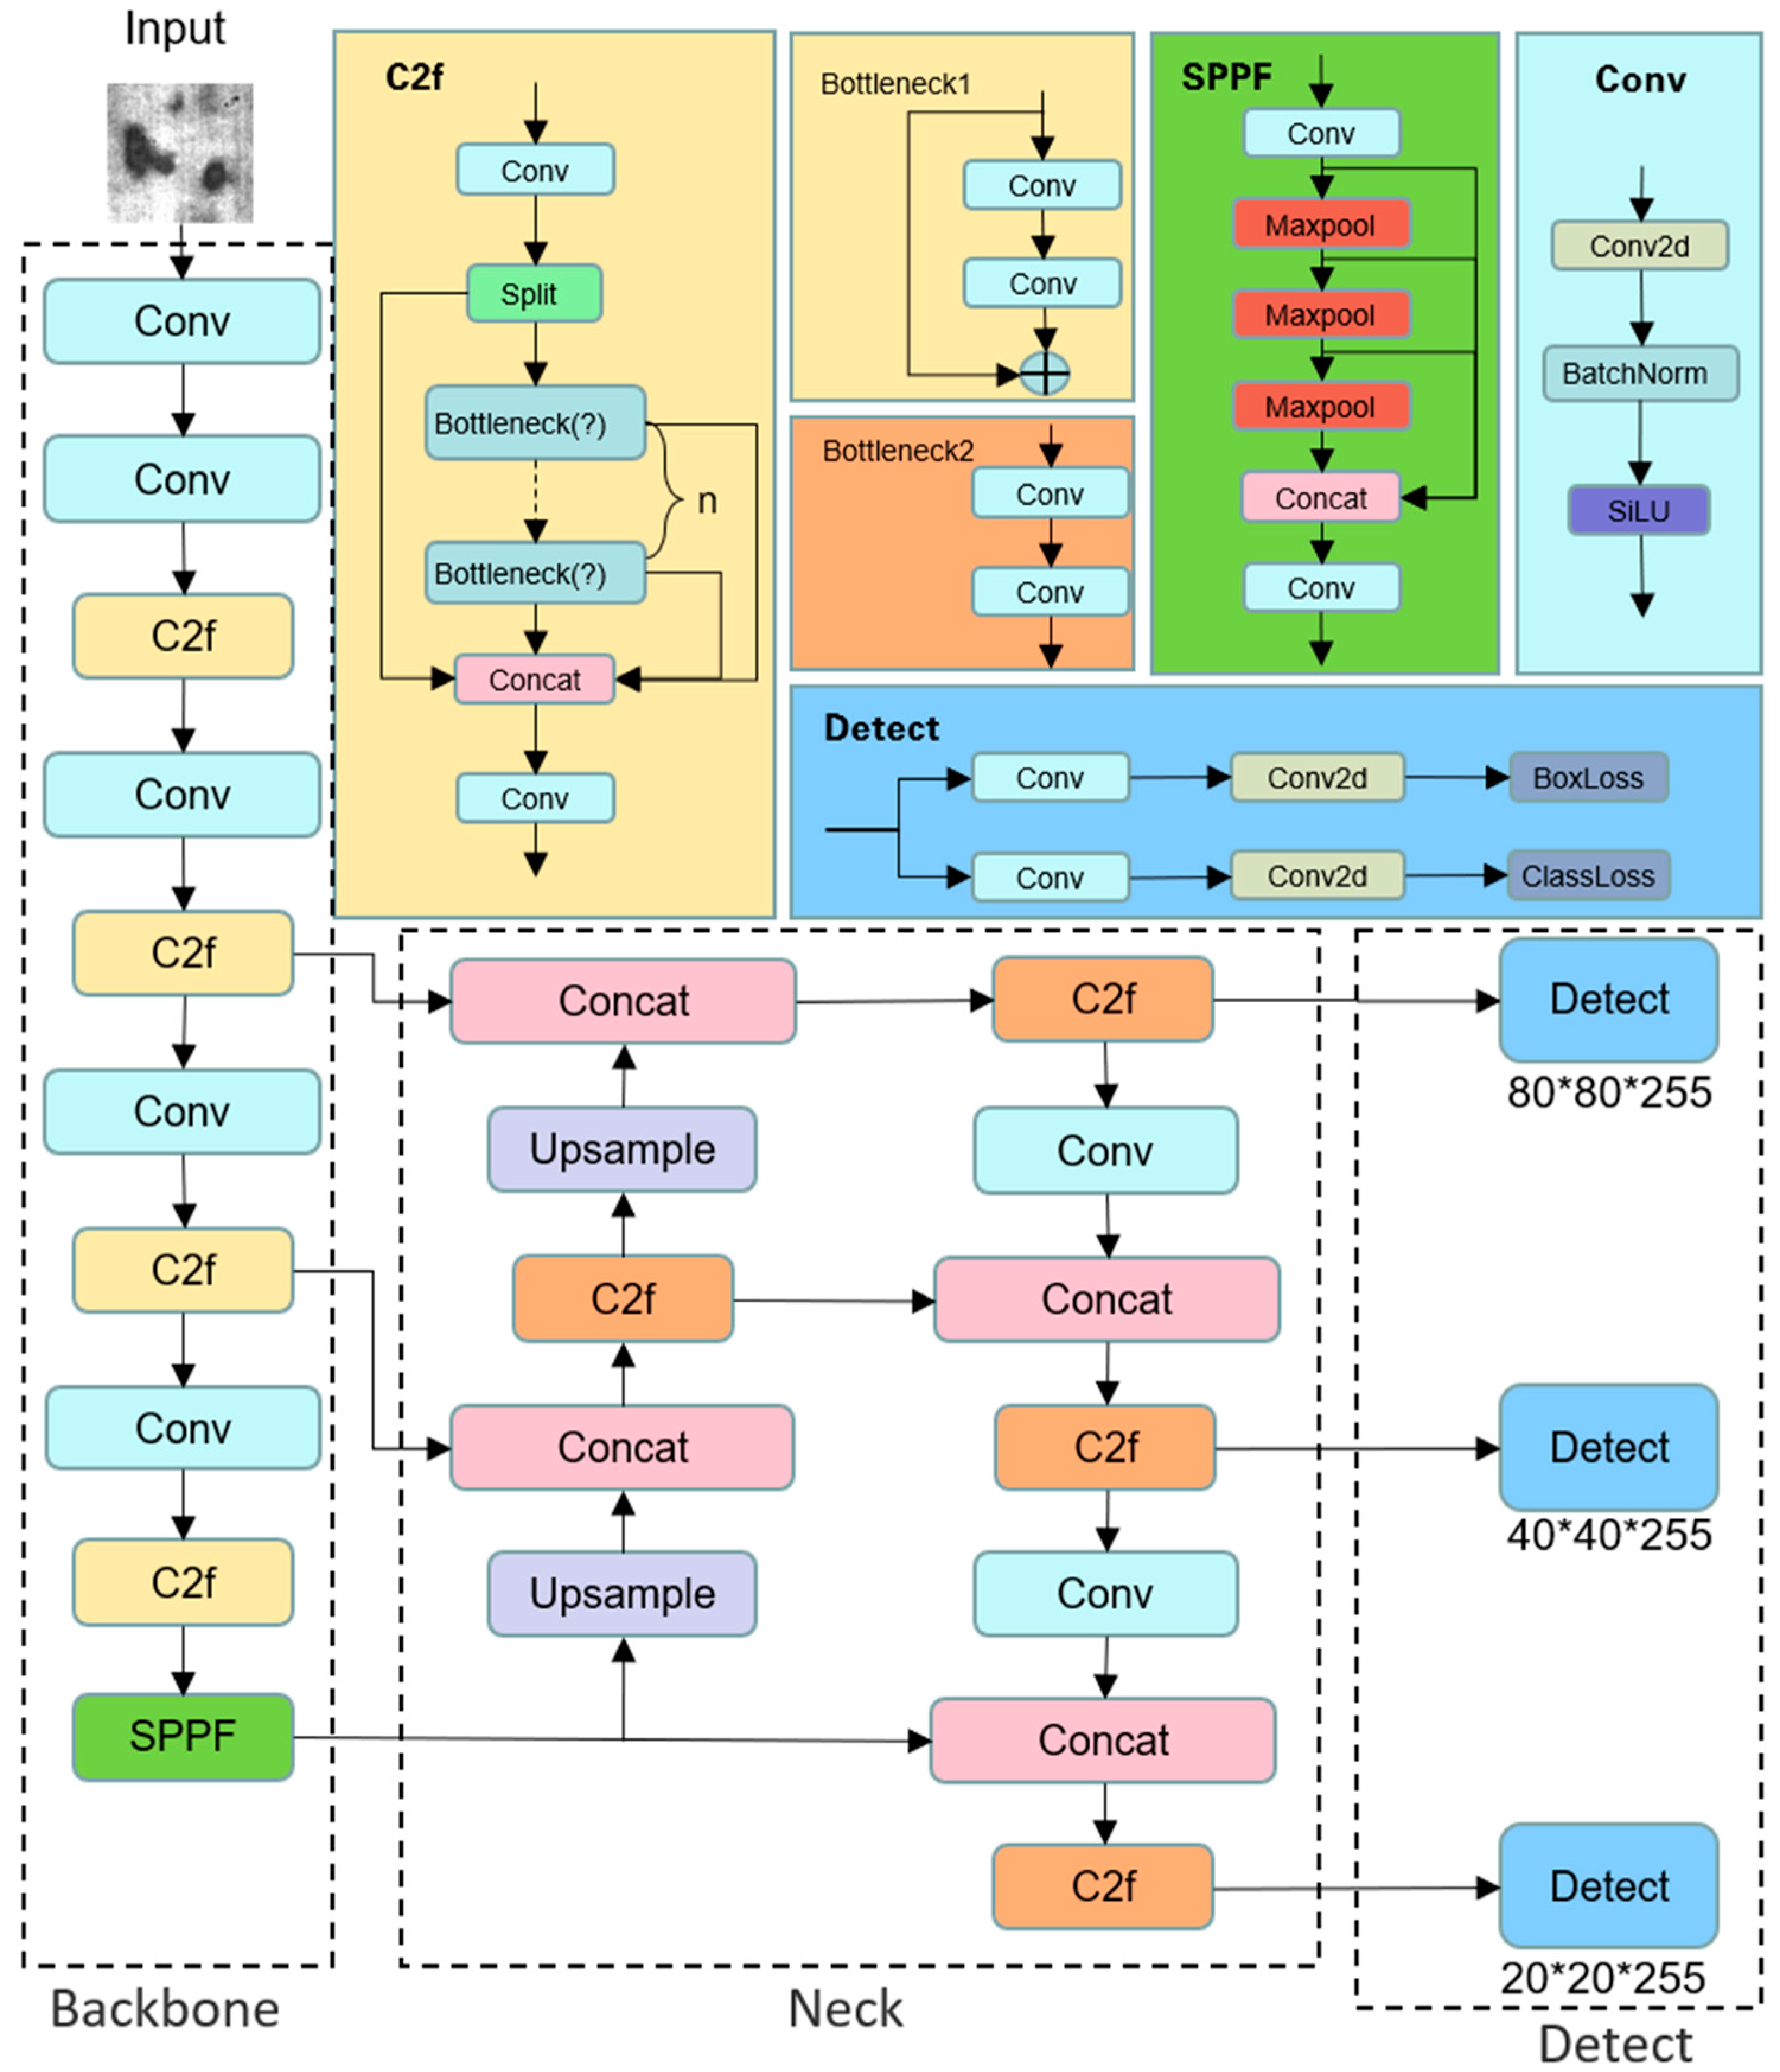
To further improve the performance of single-stage object detection algorithms, this paper, based on the YOLOv8s network architecture, integrates the ODConv dynamic convolution with an attention mechanism into the feature extraction network. This integration elevates the weight of effective information in the feature maps, enabling the model to accurately identify various defect targets. Simultaneously, to enhance model convergence speed, the WIoU bounding box loss function is employed for loss value computation, achieving a rapid and accurate detection of defects.
The paper is organized as follows: Section 2 briefly introduces the research dataset and outlines the key methods, focusing on improving feature extraction and the loss function to enhance detection performance. Section 3 evaluates the model performance, validating the effectiveness of the improved methods through comparative and ablation experiments, and compares the performance with other algorithms. The conclusion is presented in Section 4, along with future research directions.

2. Materials and Methods

2.1. Experimental Dataset

NEU-DET, the dataset utilized in this experiment, is a publicly accessible steel surface defect detection dataset developed by Professor Ke Chen Song and his team at Northeastern University [15]. This dataset encompasses six typical defects found in hot-rolled steel strips: The defects include irregular linear cracks (crazing, Cr); various non-metallic inclusions within the steel, appearing as dots, blocks, or strips (inclusion, In); surface oxidation of the steel, manifested as dark, irregularly shaped patches (patches, Pa); small pits or pitted surface defects (pitted surface, Ps); rolled-in scale, appearing as black or dark gray flake-like or block-like formations (rolled-in scale, Rs); and linear or curved scratches (scratches, Sc). Each type of surface defect consists of 300 samples, totaling 1800 images. The dataset is split into training and testing sets with a ratio of 8:2, and the distribution of each defect type within the dataset is presented in Figure 1.

2.2. Experimental Models and Methods of Enhancement

The YOLO algorithm ingeniously combines the two stages of candidate region proposal and target recognition into a single step. In 2016, Joseph Redmon et al. [16] introduced the YOLOv1 object detection algorithm, significantly improving real-time detection. Subsequently, they proposed YOLOv2 [17] and YOLOv3 [18], focusing on improving the detection capacities and accuracy for small objects. In 2020, Alexey Bochkovskiy et al. [19] made improvements in feature fusion, bounding boxes, and activation functions, presenting the YOLOv4 algorithm, which exhibited an improved accuracy compared to YOLOv3. YOLO algorithm continues to evolve through the efforts of many researchers.YOLOv5 [20], classified into N/S/M/L versions according to network depth, comprises four modules in its network architecture: Input, Backbone, Neck, and Head. In comparison to YOLOv4, the overall basic structure remains similar. It prescribes anchor boxes before input and automatically calculates the most suitable anchor boxes based on the dataset, leading to an enhancement in detection accuracy. Improvements are introduced in the feature extraction network with C3 and SPPF modules, enhancing training speed. YOLOv5 has the advantages of a small sized model, rapid speed, and adaptable application, but its detection accuracy is still capable of being enhanced. In 2022, Wang et al. [21] proposed the YOLOv7 network model, incorporating the E-ELAN module in the Backbone and Neck network structures. Additionally, the Head section introduces the Reparameterized Convolution (RepConv), surpassing the detection accuracy and precision of previous YOLO series models.
YOLOv8, developed by Ultralytics in January 2023 as an evolution of YOLOv5 [22], demonstrates better performance than existing YOLO detection models, as shown in Figure 2. Its network characteristics and improvement strategies are summarized as follows:
  • YOLOv8 provides a brand-new SOTA model (state-of-the-art model), including object detection networks with resolutions of 640 × 640 and 1280 × 1280, as well as an instance segmentation model based on YOLACT. Similar to YOLOv5, it provides models of varying sizes (N/S/M/L/X) based on scaling factors to meet diverse scene requirements.
  • The design philosophy of YOLOv7 was incorporated into the Backbone and Neck sections. The C3 module in YOLOv5 was replaced with the C2f module, which provides richer gradient flow. Additionally, the number of channels was adjusted differently for models at various scales, enabling the network to autonomously learn and detect target features through dataset training.
  • The Detect section underwent substantial modifications compared to YOLOv5. It now has the prevalently used decoupled head structure, efficiently distinguishing classification and detection processes.
  • YOLOv8 employs the TaskAlignedAssigner positive sample assignment strategy and integrates Distribution Focal Loss for loss calculation.
  • The training phase introduces a strategy from YOLOX, which involves disabling the Mosaic augmentation during the last 10 epochs, effectively improving the accuracy.

2.2.1. Omni-Dimensional Dynamic Convolution

Currently, using a single static convolutional kernel in convolutional layers has become a common training approach for CNN. With the ongoing advancement of deep learning and research on dynamic convolutions, it has been demonstrated that learning the linear combination of multiple convolutional kernels and applying attention weighting to the model input can significantly improve the accuracy of lightweight CNN while maintaining efficient inference. Notable examples include Google’s CondConv [23] and Microsoft’s DyConv [24], but they only address the dynamic nature of the convolutional kernel count. Yao et al. [25] introduced ODConv (Omni Dimensional Dynamic Convolution), a method that simultaneously takes into account spatial dimensions, input channels, output channels, and the number of convolutional kernels, as shown in Figure 3.
The process initiates with global average pooling (GAP), followed by fully connected (FC) and ReLU processing on the input. Subsequently, it undergoes a four-headed branch structure, employing a multi-dimensional attention mechanism to compute four types of attention (denoted as a s i , a c i , a f i , and a w i ) in parallel along the spatial dimension Wi of the convolutional kernel. This convolutional operation can be defined by Formula (1).
y = α w 1 α f 1 α c 1 α s 1 W 1 + + α w n α f n α c n α s n W n x
In this equation, a s i , a c i , a f i , and a w i represent attentional scalars calculated for the spatial aspect W i , input channel aspect, output channel aspect, and convolutional kernel aspect, respectively. denotes element-wise multiplication and * represents the convolution operation. The operations of the four types of attention with the convolutional kernel are illustrated in Figure 4.
In theory, the four distinct attention mechanisms synergistically interact. By adaptively integrating multi-dimensional attentional cues across spatial, channel-wise, and kernel-specific dimensions, convolutional operations exhibit enhanced adaptability to heterogeneous input variations. This multi-dimensional interaction strengthens the network’s capacity to encode comprehensive contextual patterns, thereby enabling ODConv to optimize the representational power of convolutional features and advance the accuracy of object localization within the model.

2.2.2. Wise Intersection over Union

The objective function of the YOLOv8s architecture comprises category prediction loss and localization loss. In object detection tasks, the bounding box represents the size and position of the target object, making the bounding box loss calculation crucial for detection performance. The Intersection over Union (IoU) is used to calculate the ratio of the intersection to the union of the predicted box and the ground truth box, ideally yielding a ratio of 1.
However, when the boxes do not overlap, IoU can be 0, leading to a slowdown in convergence speed and even gradient disappearance. To address this, various improvements to IoU have been proposed, including Generalized-IoU [26] (GIoU), Distance-IoU [27] (DIoU), Complete-IoU [28] (CIoU), and Efficient-IoU [29] (EIoU). Building upon these, Tong et al. [30] introduced the Wise Intersection over Union (WIoU) loss function. WIoU leverages this idea of the focal-loss focusing mechanism (FM) from EIoU and designs a bounding box loss function founded on a dynamic non-monotonic focusing mechanism (Dynamic non-monotonic FM). This mechanism effectively reduces the contribution of inferior samples in the training dataset to the loss value, allowing the model to focus on premium samples, thereby achieving performance improvement. See Formula (2) and (3) for details.
L W I oU 1 = R W I o U L I o U = R W I o U 1 I o U
R W I o U = exp x x g t 2 + y y g t 2 W g 2 + H g 2
In the formula, W g and H g represent the height and width of the minimum bounding box, respectively. x , y is the center point of the predicted box, and x g t , y g t is the center point of the target box. Additionally, to prevent R W I o U from generating gradient values that impede convergence during training, the separation of W g and H g from the computation graph is performed (denoted by * superscript), ensuring that they do not participate in gradient updates.
β = L I o U L I o U ¯ 0 , +
L W I o U = r L W I o U 1 ,   r = β δ α β δ
In Formulas (4) and (5), β represents the outlierness of the anchor box. A smaller outlierness implies a premium anchor box. The ratio of L I o U to L I o U ¯ (the momentum’s average during training) is used to express this. This approach resolves the problems of slow convergence in the late stages of training as L I o U decreases. r is a non-monotonic focusing factor constructed from β , with δ and α as adjustable hyperparameters. It assigns smaller gradient gains to anchor boxes with larger outlierness, effectively preventing significant harmful gradients from low-quality samples.

2.2.3. Proposed YOLOv8s Model

This specific architecture of the proposed YOLOv8s-OD model is demonstrated in Figure 5, with improvements made to the backbone network and the Detect section. To improve the model’s capacity to extract defect features and better distinguish targets from the background, the ODConv, as described above, is employed in the backbone network, replacing traditional convolutional operations (as shown in Figure 5a). In the Detect section, optimization of the bounding box loss is achieved through WIoU. This optimization helps alleviate the impact of inferior detection boxes on the loss function during model training, thereby accelerating model convergence (as depicted in Figure 5b).

3. Results and Discussion

This study utilized a self-built experimental environment with the PyCharm IDE, and the details of the environment are displayed in Table 1. During this model training stage, Mosaic data augmentation was applied at the input end to scale and concatenate four images. This method aims to enhance the detection of small targets, ultimately improving the performance and robustness of the model. The network training parameters are outlined in Table 2.
The YOLOv8s training weights provided by the official source were used for weight initialization. To ensure a fair comparison, the baseline YOLOv8s and its improved variant were trained with identical configurations, thereby objectively quantifying the performance gains and validating the refinement strategy.
This section is structured into subsections to present a succinct yet comprehensive overview of the experimental outcomes, their contextual interpretation, and the resulting implications derived from the study.
The YOLOv8s training weights provided by the official source were used for weight initialization. All experiments used the identical parameters for training the original and improved models, facilitating a comparison of the model performances and validating the effectiveness of the model improvements.

3.1. Evaluation Criteria

To objectively evaluate the effectiveness of the model, precision (P), recall (R), and mean average precision (mAP) [31] were employed as metrics to assess the accuracy of the model’s detections, calculated as per Formulas (6)–(8).
P = T P T P + F P
R = T P T P + F N
A P = 0 1 P R d R
m A P = 1 n i = 1 n A P i
In these formulas, TP (true positive) denotes the count of correctly detected defects, FP (false positive) represents the count of defects erroneously detected, and FN represents the count of defects not detected. AP (Average Precision) denotes the average detection accuracy for each defect type, while mAP is the average of AP values across all defect categories, where n is the number of defect types.

3.2. Experimental Results

3.2.1. Performance Analysis of the Model
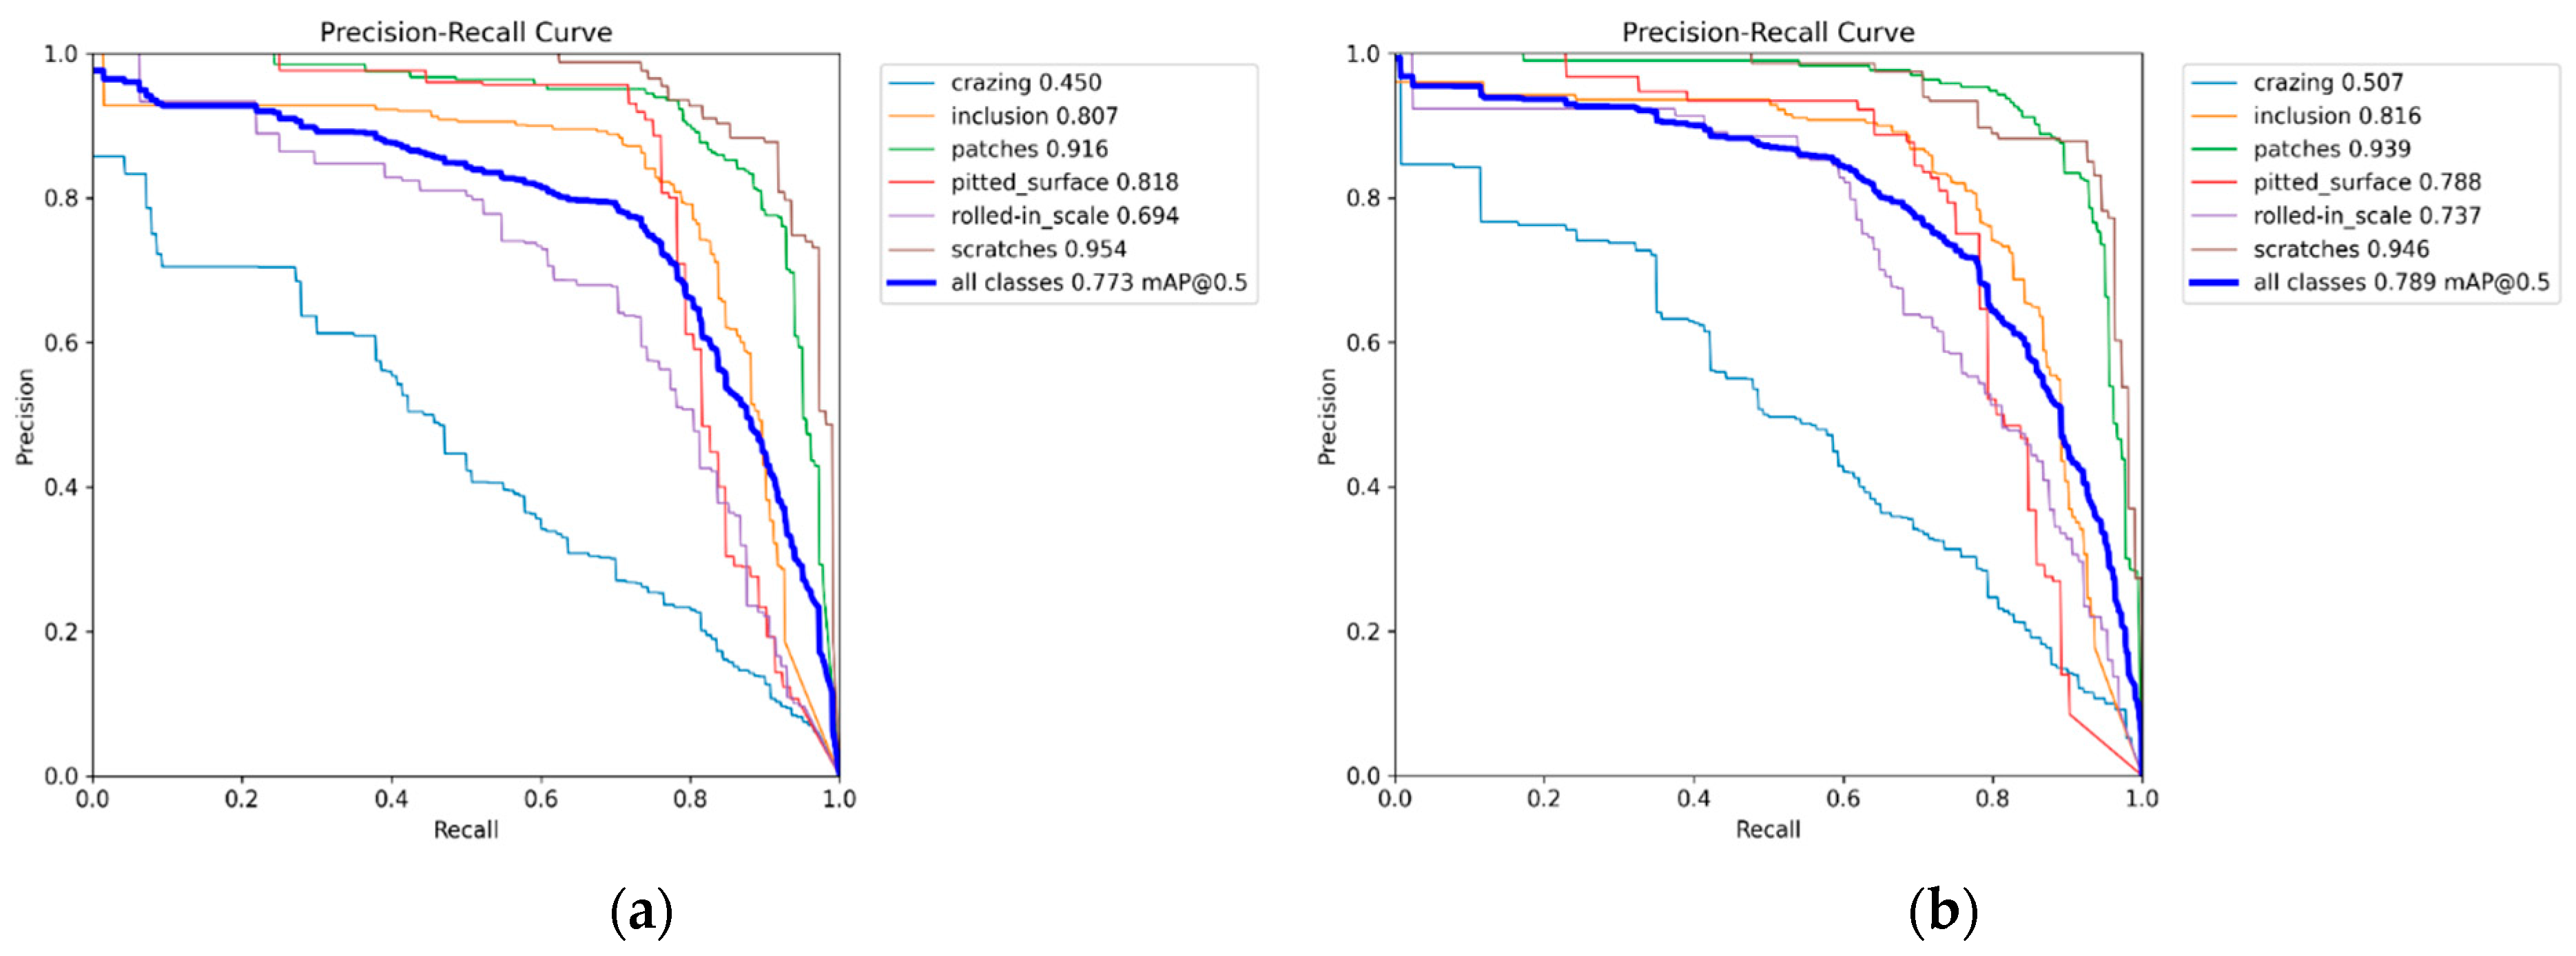
As displayed in Figure 6, to analyze the effectiveness of the enhanced model in steel defect detection and visually compare the performance, PR curves before and after the model improvement are contrasted. A larger area under the curve suggests better detection performance. 
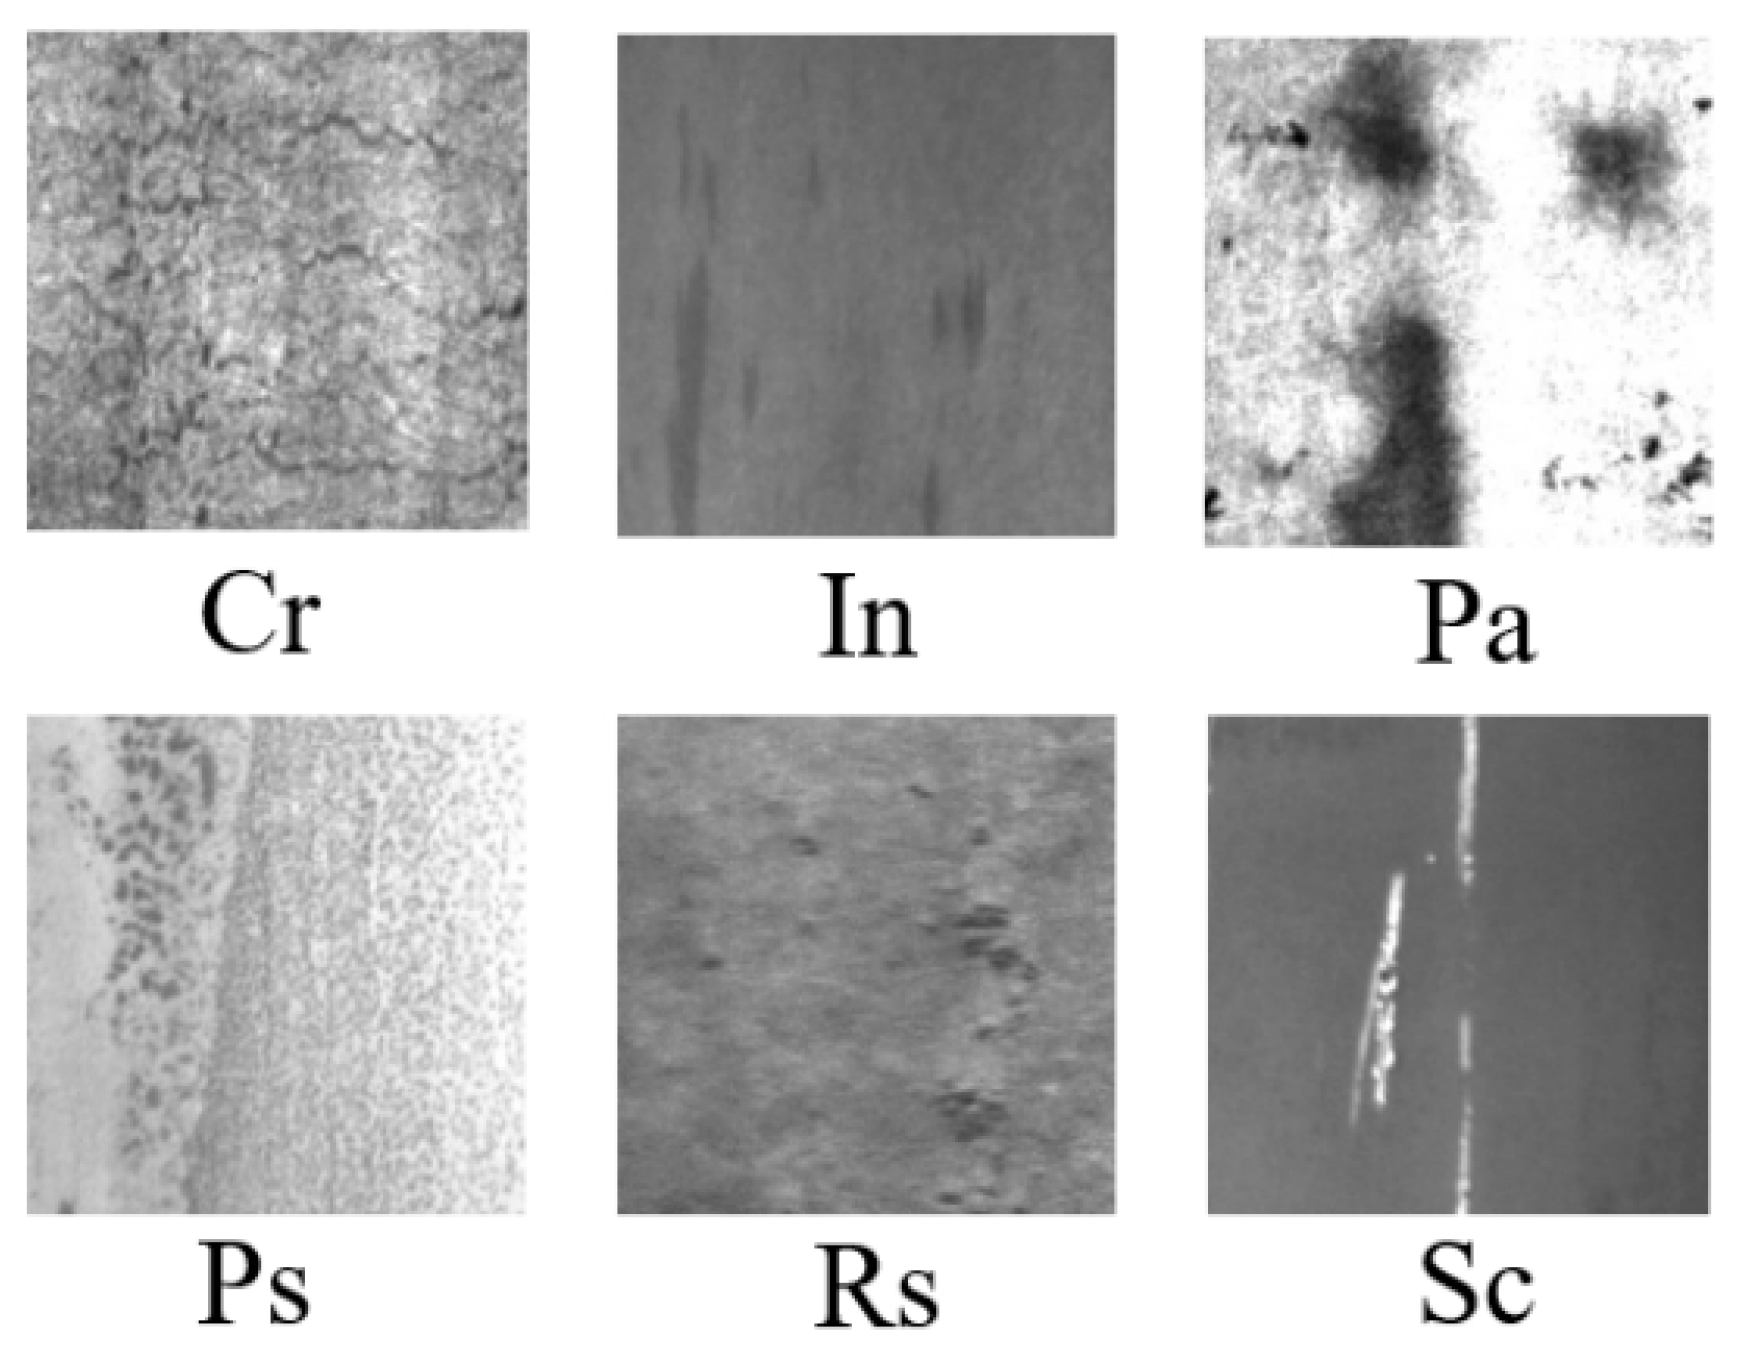
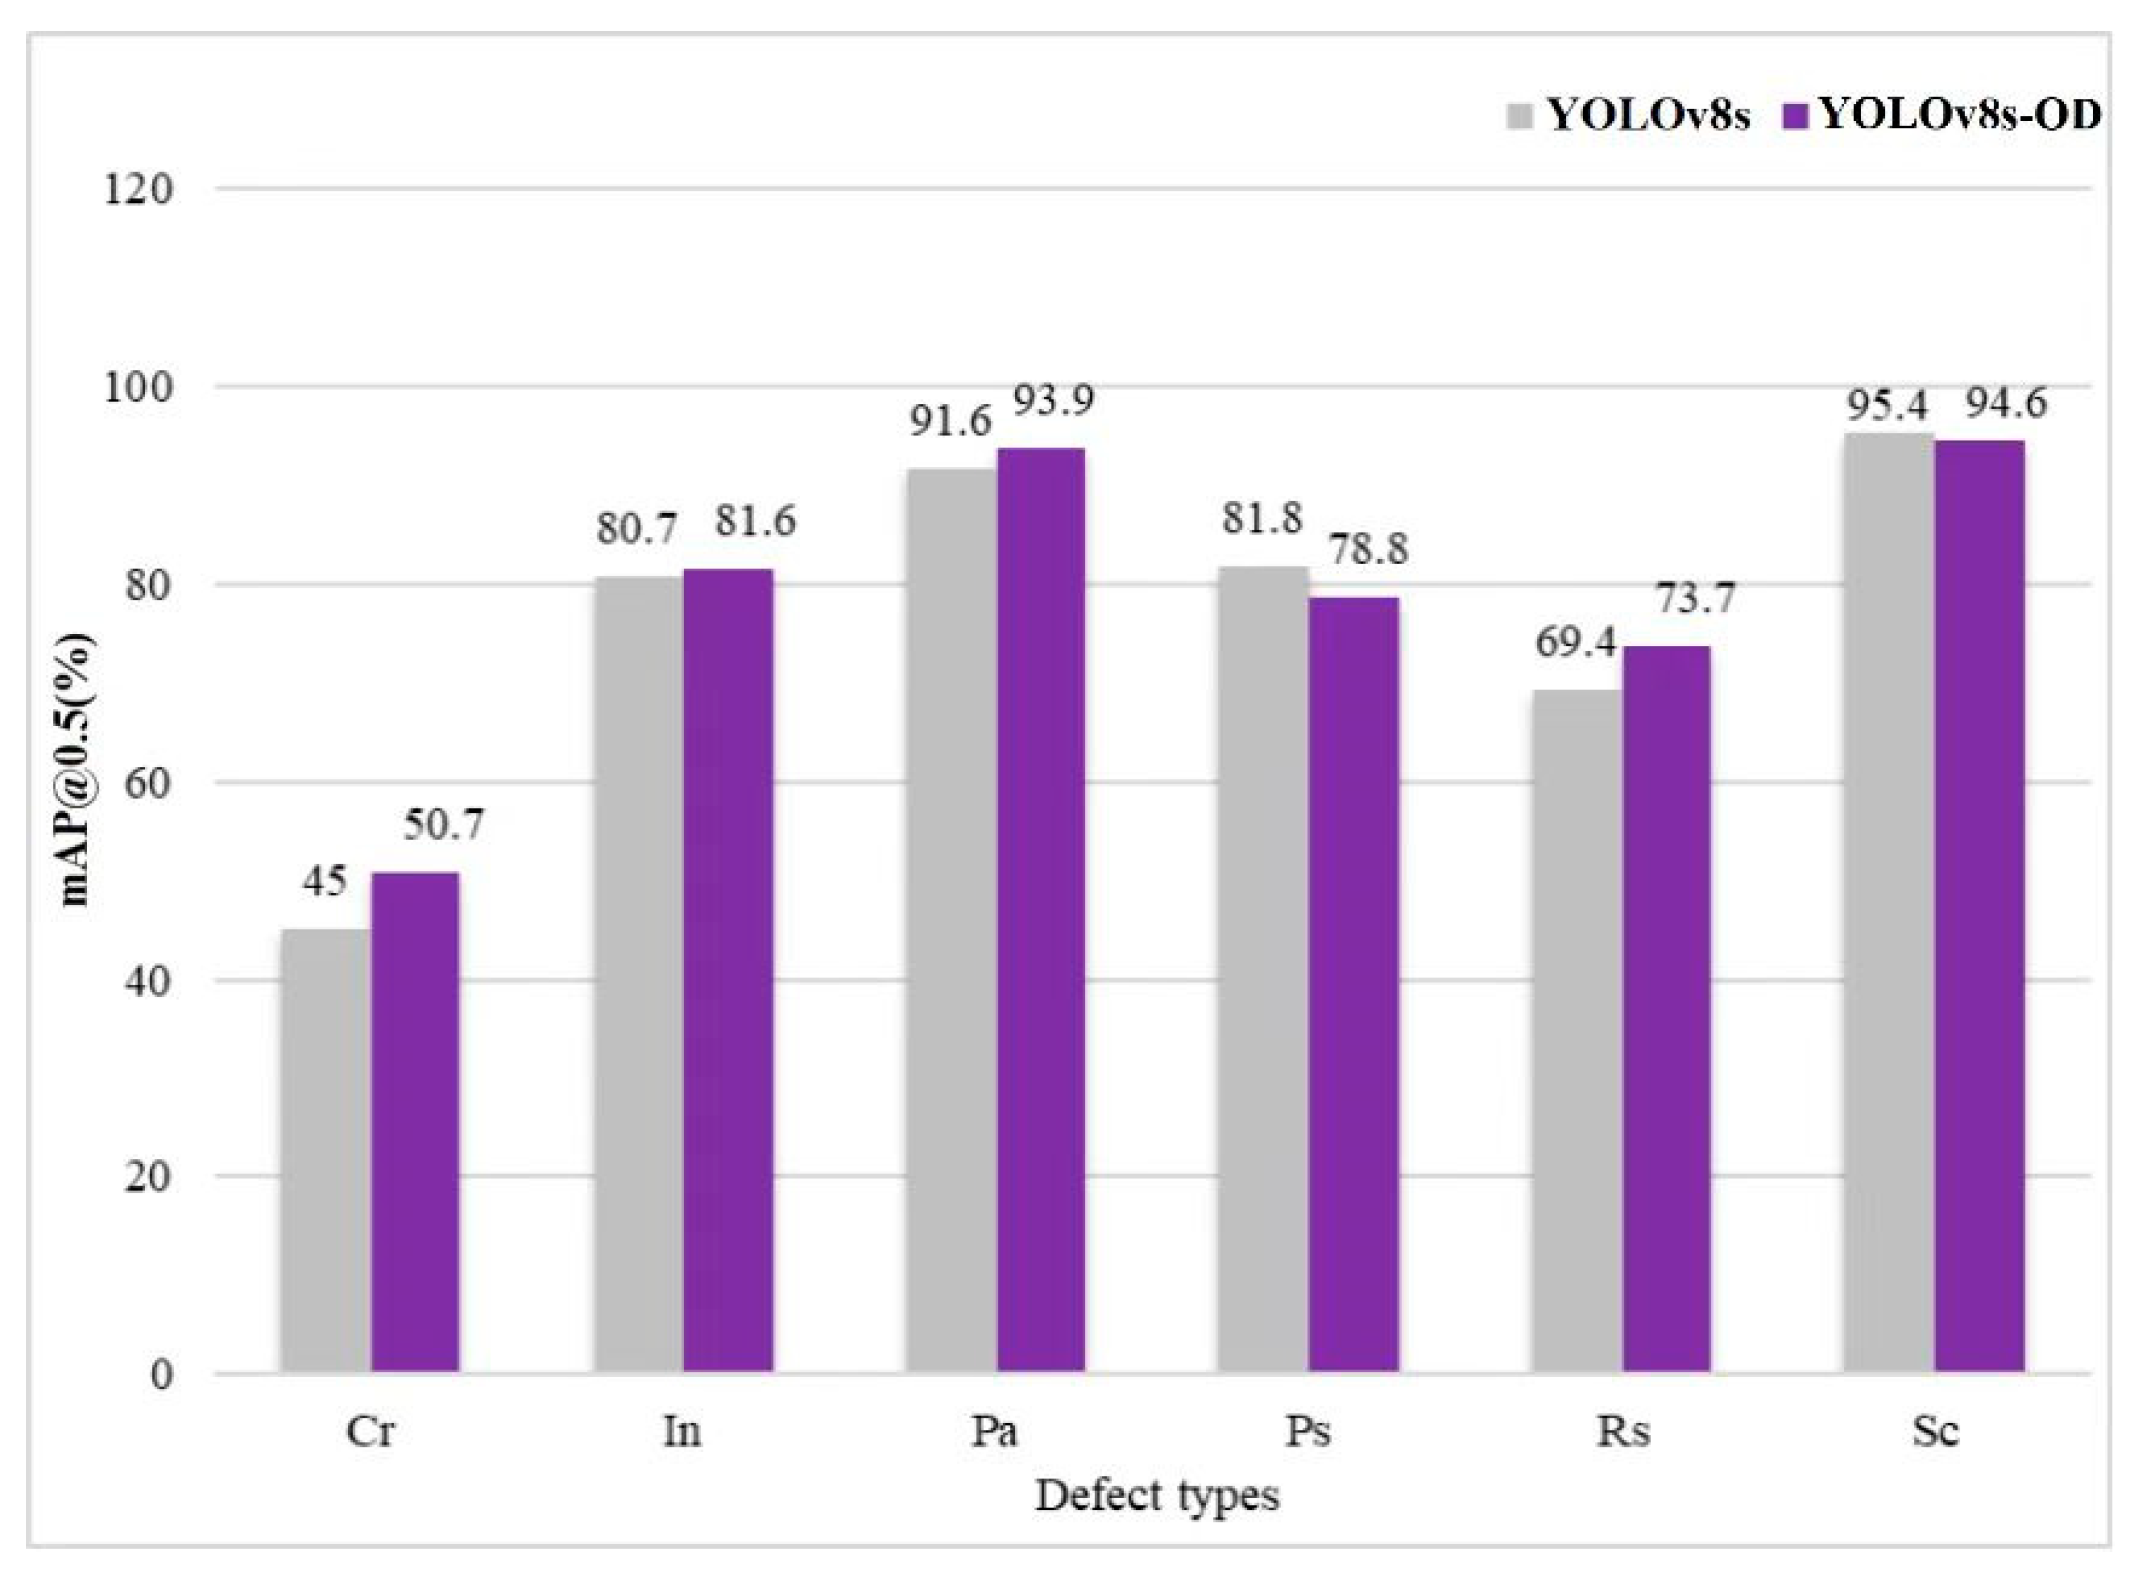
Figure 7 illustrates a comparative analysis between the original YOLOv8s and the proposed YOLOv8s-OD algorithm in the detection of various defect types. Owing to the relatively less distinctive characteristics of Cr (crazing) and Rs (rolled-in scale) compared to the other five defect categories, the corresponding mAP values are comparatively lower. The improved YOLOv8s-OD model demonstrates an AP enhancement in most defect types, except for Ps (pitted surface) and Sc (scratches), where there is a slight decrease. Particularly, noticeable improvements are observed in the identification of Cr (crazing) and Rs (rolled-in scale), with increases of 5.7% and 4.3%, respectively. As shown in the analysis of Figure 6, the integration of ODConv into the backbone network and the substitution of the bounding box regression loss function with WIoU have significantly enhanced the model’s feature extraction capabilities, thereby effectively improving the precision of defect detection.

3.2.2. Comparative Experiment

To evaluate the efficacy of the proposed enhancements, a controlled ablation study is implemented with YOLOv8s as the reference architecture. The selection of the objective function critically influences the model’s detection robustness, particularly in steel surface defect analysis where the alignment precision between predicted regions and annotated defects is governed by the overlap-based error metric. Consequently, a systematic benchmarking of prevalent IoU variants is performed, with empirical outcomes quantitatively summarized in Table 3. To ensure a more stable regression process for the model, WIoU is selected as the bounding box loss function, which significantly improved in the accuracy of defect detection.
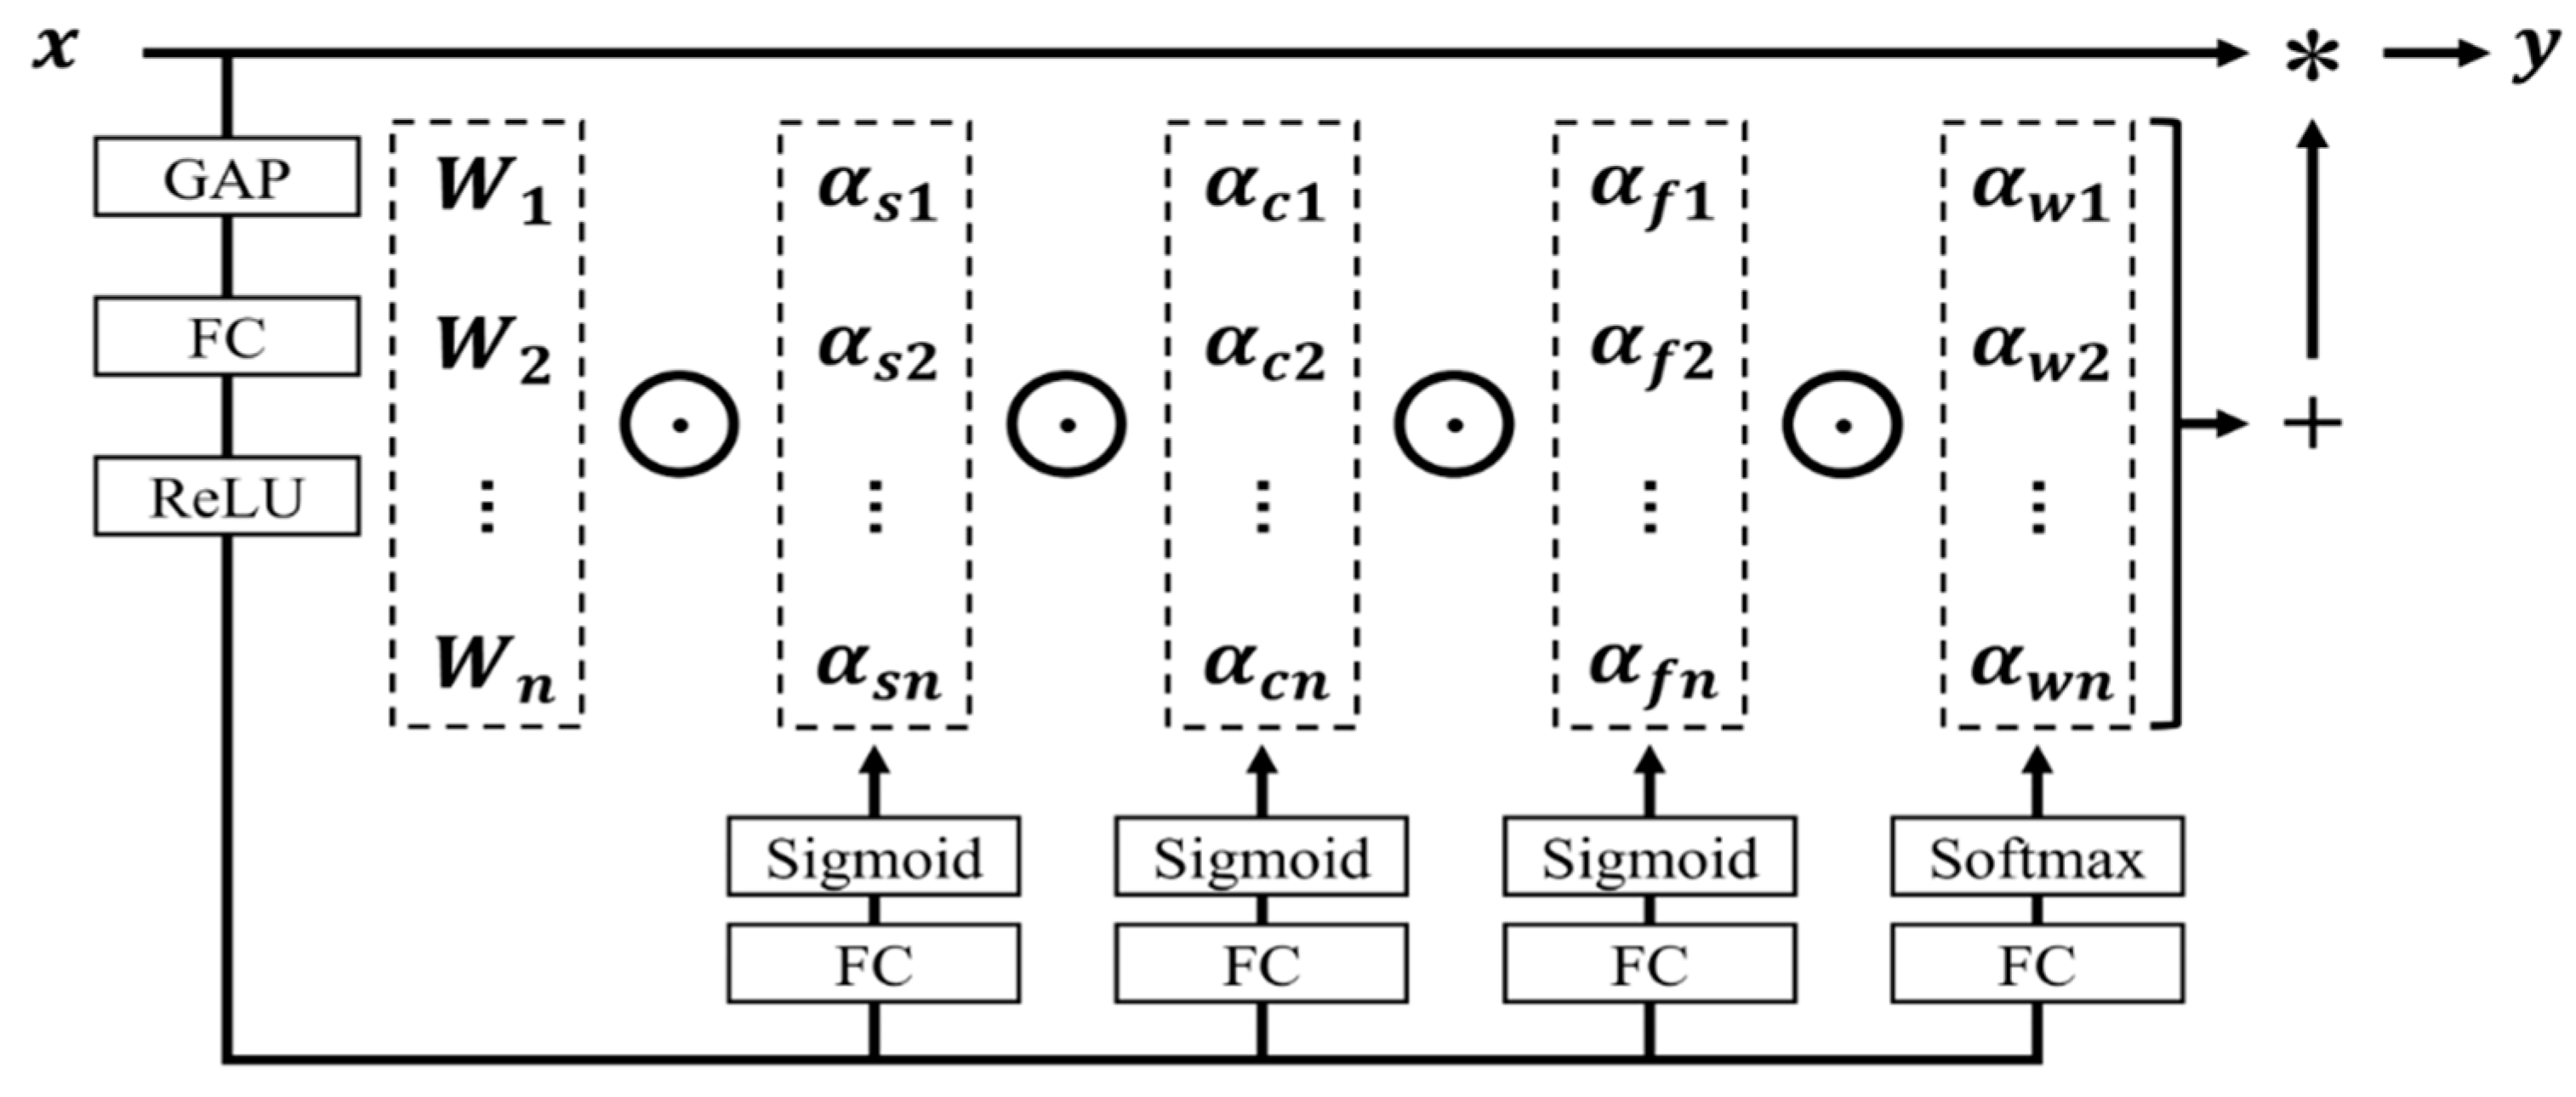
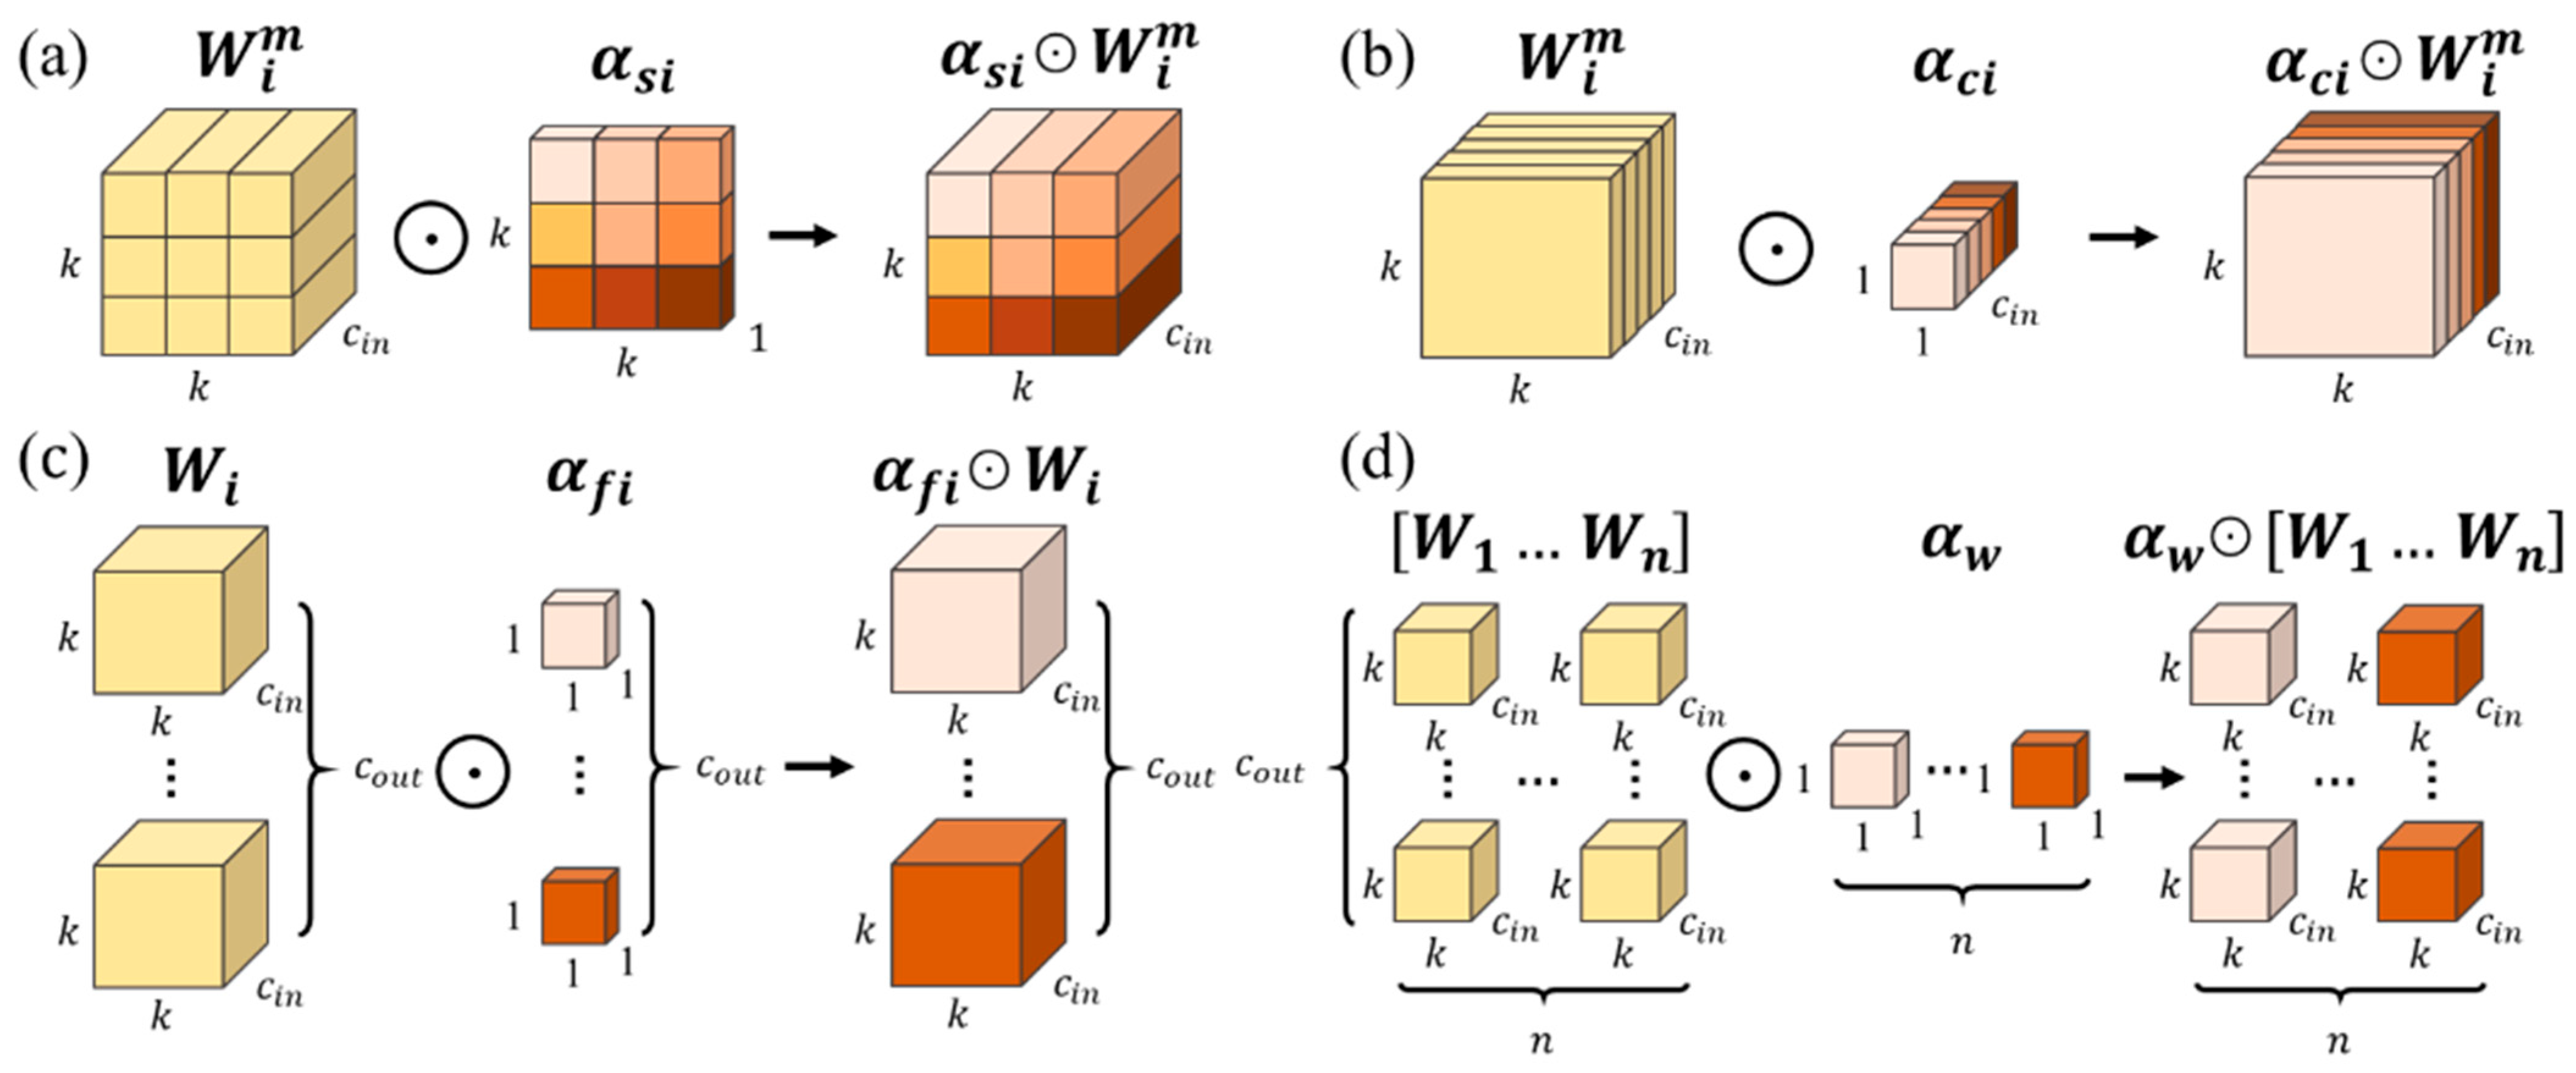
As the Omni-Dimensional Dynamic Convolution (ODConv) introduces attention across all four dimensions of convolution, a set of comparative experiments with current mainstream attention mechanisms was designed, and the results are displayed in Table 4. Compared to the baseline model, including the popular SE [32], CA [33], and CBAM, ODConv shows a significant enhancement in model performance, with a 1.3% marginal increments in accuracy. Notably, the computational complexity of the model is reduced to 24.7 GFLOPs, and the increase in the number of model parameters is minimal. These experimental results validate the effectiveness of the introduced ODConv in enhancing the detection performance of this model.

3.2.3. Ablation Experiment

In conclusion, to quantify the efficacy of different improvement methods on the model, four sets of comparative ablation experiments were constructed in this study. Each experiment used the same dataset and training parameters, and the results are shown in Table 5. The checkmark (√) shows if WIoU and ODConv are used in the experiment. Analysis reveals that the YOLOv8s experiment represents the original network model. The YOLOv8s1 experiment introduces the WIoU bounding box loss based on the original network, enhancing the precision of bounding box regression and subsequently enhancing the model’s accuracy in defect detection, leading to a 1.8% enhance in accuracy. The YOLOv8s2 experiment incorporates ODConv into the original network, integrating attention within the convolution, thereby improving the feature extraction capability of the backbone network, and both accuracy and mAP values show improvement. The YOLOv8s-OD experiment combines the above two methods, and compared to the original YOLOv8s network, it significantly improves accuracy and mAP values but with a slight decrease in recall—a common issue in tasks related to object detection.
In summary, relative to the original YOLOv8s network model, the improved YOLOv8s-OD network model in this study achieved a 4.5% increase in detection accuracy, reaching an mAP of 78.9%. Additionally, the reduction in computational complexity reflects an enhancement in model performance, highlighting its practical application value.

3.2.4. Comparison of Different Algorithms

To assess the efficacy and comparative advantages of the YOLOv8s-OD model in localizing defects on steel surface datasets, we benchmarked it against state-of-the-art detection frameworks, with empirical outcomes quantitatively summarized in Table 6. From the detection results, the improved YOLOv8s-OD algorithm in this study exhibits better defect detection performance relative to other mainstream algorithms. Faster R-CNN, belonging to the two-stage detection category, demonstrates good detection performance, but its larger model size results in slower detection speed. The YOLO algorithm, while having an advantage in speed, shows poorer performance in detecting complex textures and weak features. In comparison to the original YOLOv5, the improved YOLOv8s-OD not only achieves faster detection speed but also significantly improves accuracy for all defect types except for pitted surface (Ps). Compared to the latest YOLOv8s, it shows a 0.9% and 4.3% improvement in AP values for inclusion and rolled-in scale, respectively, highlighting that the use of ODConv improves the model’s feature extraction capacity, especially for defects with weak characteristics. In terms of detection accuracy, the mAP value of the model in this study attains 78.9%. Additionally, the model maintains a high detection speed of 89 FPS while having a compact size of 21.5 Mb.

3.3. Comparison of Detection Results

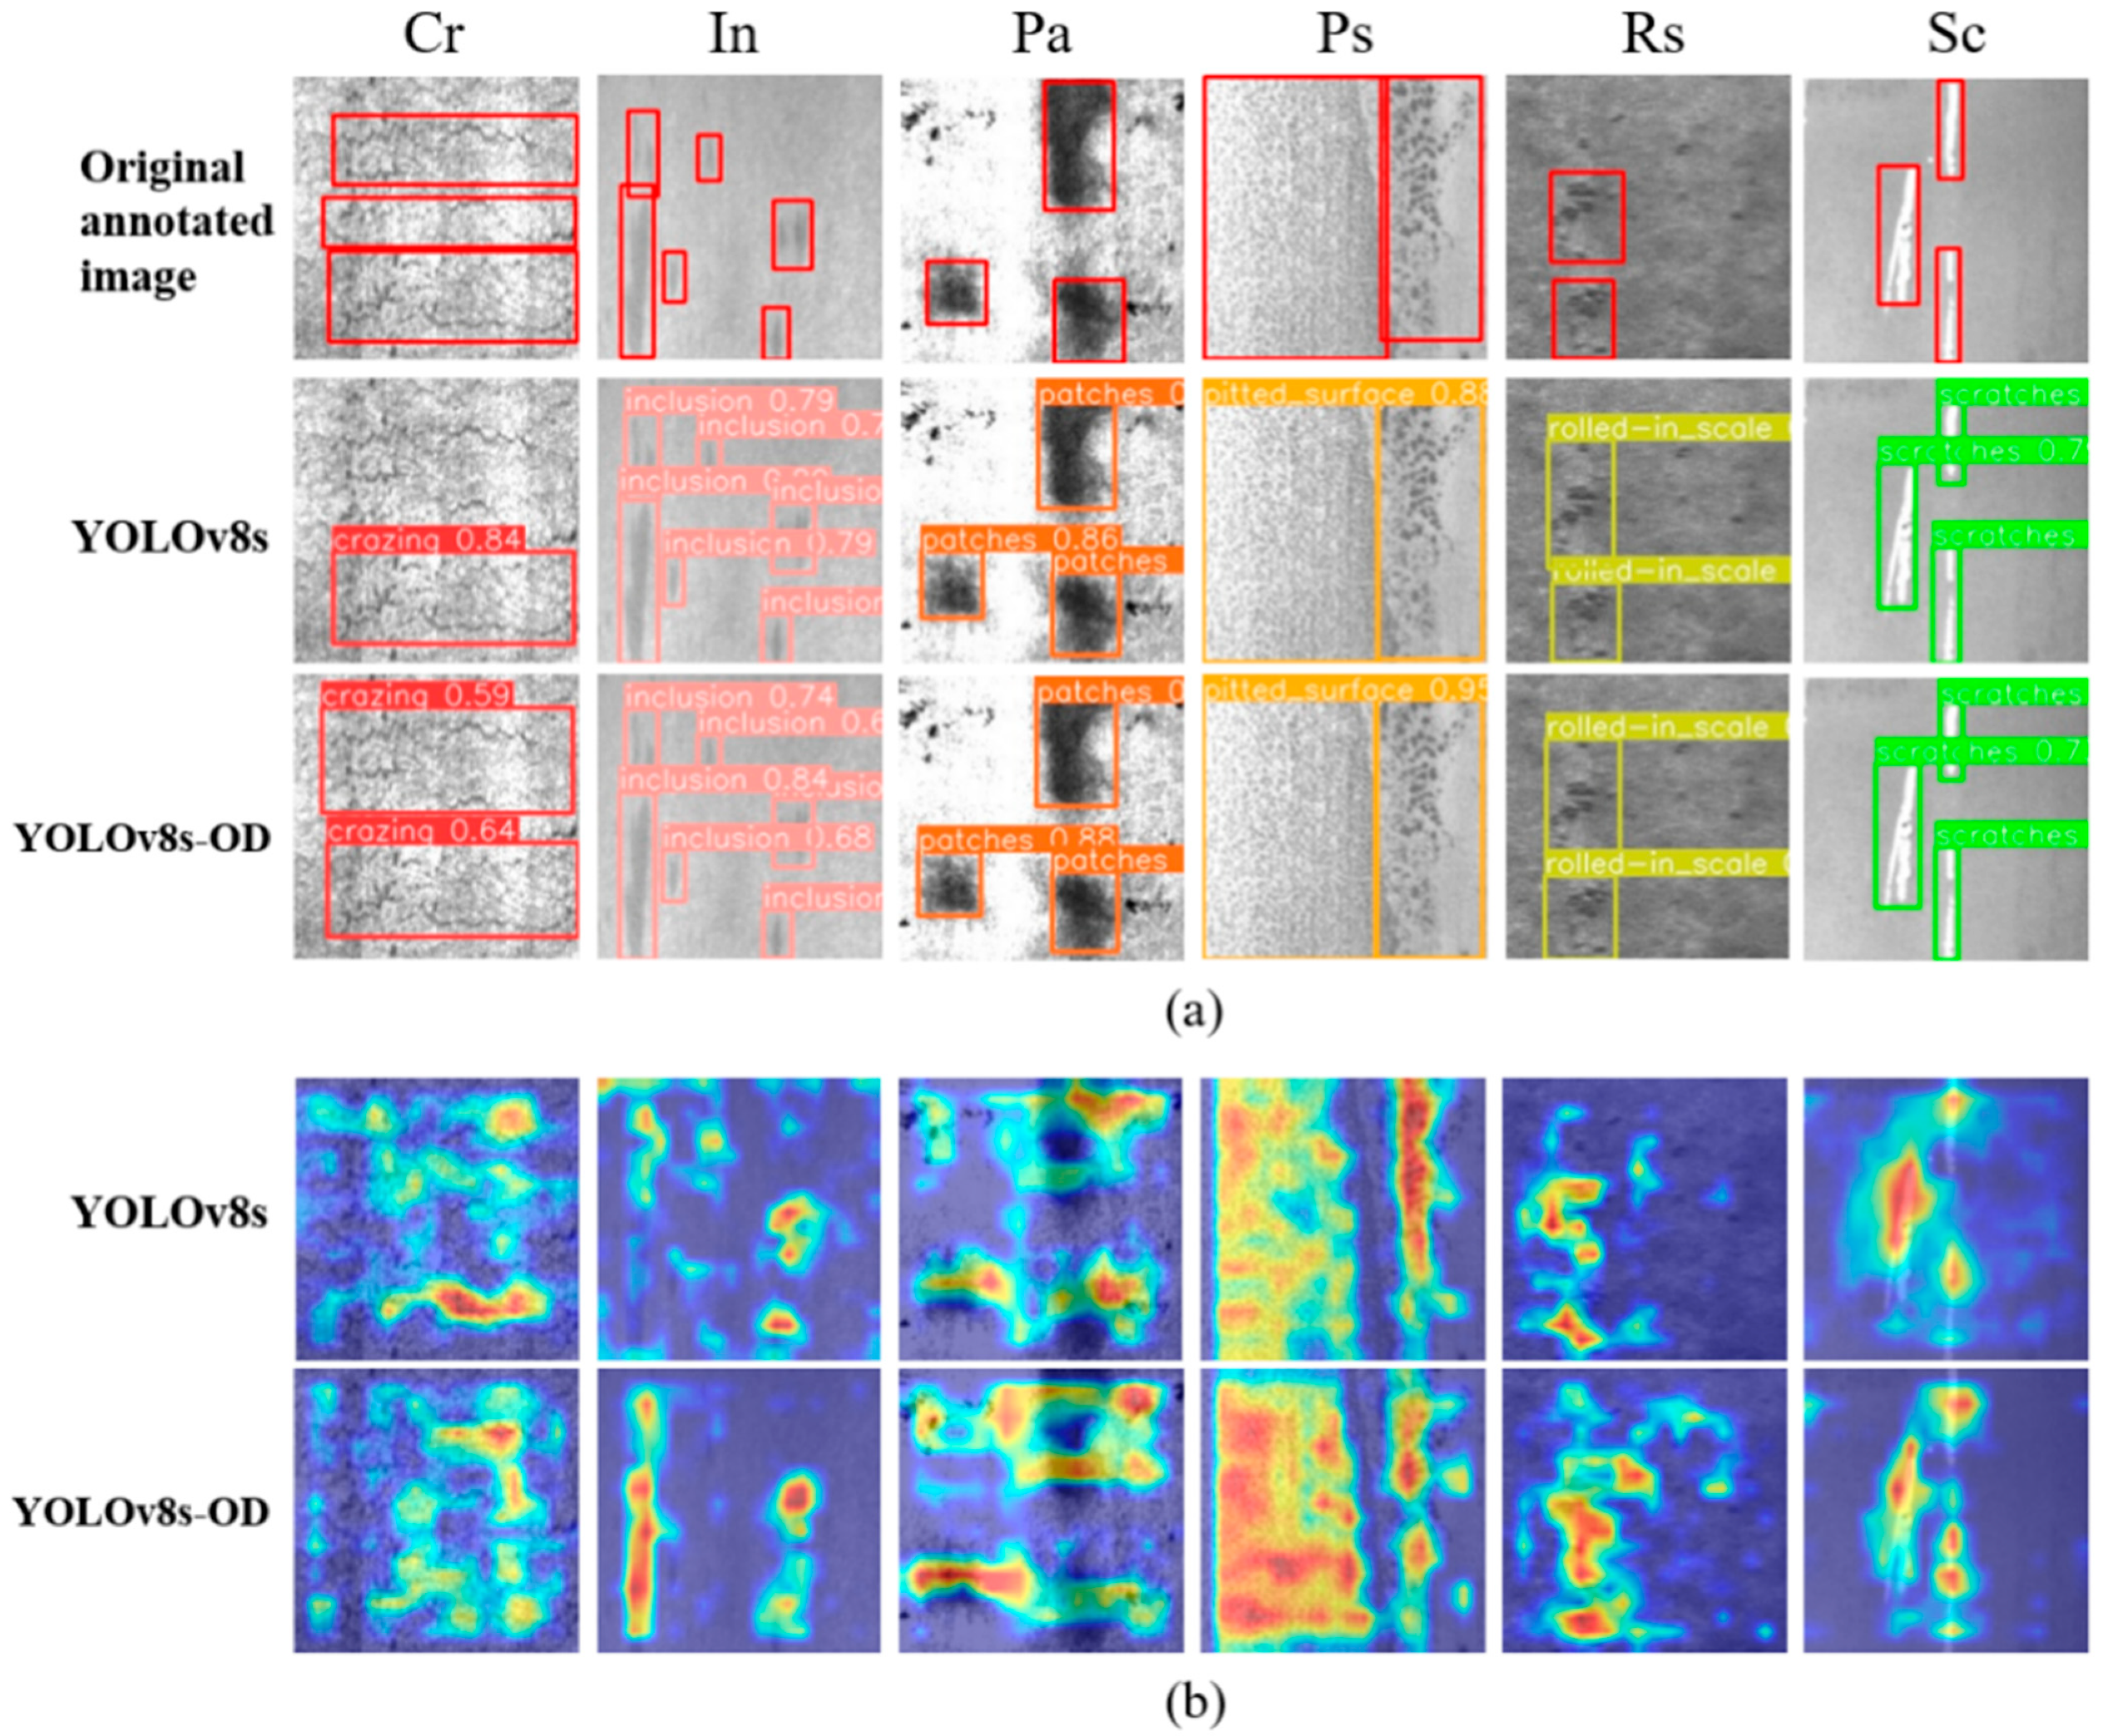
To offer a more visual comparison of the defect detection capabilities of the models, some detection results are presented in Figure 8. Contrasting with the original annotated images, it can be observed that the YOLOv8s model has instances of missed detection for the Cr (crazing) defect, while the proposed YOLOv8s-OD model demonstrates better detection performance (as shown in Figure 8a). Furthermore, comparing the heatmaps of features obtained from the original YOLOv8s and the YOLOv8s-OD backbone networks, where deeper red indicates a stronger focus of the model on that region. The optimized model demonstrates a more precise concentration on the defect features of the steel, allowing for better differentiation between the target and background, thus enhancing the model’s feature extraction capability (as illustrated in Figure 8b). It can be seen that the improved model provides more comprehensive and accurate identification of surface defects on the steel, with detection results nearly matching the annotations.

4. Conclusions

In resolving the issue of steel surface defect detection, this paper proposes an enhanced detection algorithm based on the YOLOv8s network model. Considering the complex and diverse characteristics of steel surface defect features, a Dynamic Convolutional operation, ODConv, is introduced into the backbone feature extraction network. By applying attention weighting to the four dimensions of the convolutional kernel space, it reinforces target features, thereby improving the detection effectiveness for target defects. Simultaneously, this approach reduces the computational complexity of the model. The algorithm utilizes the WIoU bounding box loss function, incorporating a dynamic non-monotonic focusing mechanism. By employing outlier deviation instead of IoU for anchor box quality assessment, this strategy not only diminishes the competitiveness of high-quality anchor boxes but also mitigates harmful gradients produced by low-quality examples. This allows WIoU to focus on anchor boxes of ordinary quality, enhancing the overall performance of the detector.
The experimental results confirm the effectiveness of the proposed model enhancements. The improved model demonstrates a 4.5% increase in accuracy over the original YOLOv8s, achieving a mAP of 78.9%, with an average inference time of 11.2 milliseconds per image. Leveraging Mosaic image augmentation during model training and the inherent multi-class object recognition capabilities of the YOLO model, the proposed system is able to simultaneously detect multiple defects within a single image. Therefore, the proposed model exhibits commendable detection performance and practical value.
The model has not yet been deployed in an automated system. In future work, it will be integrated with real-world applications, with further optimization of the network model and improvements to the detection recall rate. Furthermore, the experimental dataset was captured under controlled, uniform conditions, which may affect the model’s accuracy in practical applications. To mitigate this, additional data will be collected from real production environments to expand the dataset and improve the model’s generalization performance.
This study has certain limitations, namely that the model’s recognition stability is insufficient for sporadically occurring special-shaped defects in actual production. This study has direct application value for metallurgical enterprises to enhance their steel quality control level. It can help enterprises quickly and accurately identify defects in the production process, thereby reducing the costs associated with manual inspection and the rate of misjudgment.

Author Contributions

Conceptualization, C.H.; methodology, C.H. and Y.L. (Yanling Li); software, J.C.; validation, J.C.; formal analysis, J.C.; investigation, J.C.; resources, C.H. and J.C.; data curation, J.C.; writing—original draft preparation, J.C.; writing—review and editing, Y.L. (Yao Lu) and C.Y.; visualization, J.C.; supervision, Y.L. (Yao Lu) and C.Y.; project administration, C.H.; funding acquisition, C.H. All authors have read and agreed to the published version of the manuscript.

Funding

This research received no external funding.

Data Availability Statement

The datasets used and analyzed during the current study available from the corresponding author on reasonable request.

Acknowledgments

We sincerely thank Huang Chunyan for her dedicated guidance, invaluable insights, and continuous support throughout this research. Her expertise and encouragement greatly contributed to the success of this work. We deeply appreciate her time and effort.

Conflicts of Interest

The authors declared no potential conflicts of interests with respect to the research, authorship, and publication of this article.

Abbreviations

APaverage precision
CBAMConvolutional Block Attention Module
CNNConvolutional Neural Networks
FCconnected
FMfocusing mechanism
GAPglobal average pooling
IoUIntersection over Union
mAPmean average precision
ODConvOmni-Dimensional Dynamic Convolution
Pprecision
PAFPNPath Augmented Feature Pyramid Network
Rrecall
RepConvReparameterized Convolution
ResNetResidual Network
RPNRegion Proposal Network
SSDSum of Squared Differences
WIoUWise Intersection over Union

References

  1. Krizhevsky, A.; Sutskever, I.; Hinton, G.E. ImageNet Classification with Deep Convolutional Neural Networks. Adv. Neural Inf. Process. Syst. 2012, 25, 2012. [Google Scholar] [CrossRef]
  2. Girshick, R.; Donahue, J.; Darrell, T.; Malik, J. Rich feature hierarchies for accurate object detectionand semantic segmentation. In Proceedings of the IEEE Conference on Computer Vision and Pattern Recognition, Columbus, OH, USA, 23–28 June 2014; pp. 580–587. [Google Scholar] [CrossRef]
  3. Girshick, R. Fast r-cnn. In Proceedings of the IEEE International Conference on Computer Vision, Santiago, Chile, 7–13 December 2015; pp. 1440–1448. [Google Scholar] [CrossRef]
  4. Ren, S.; He, K.; Girshick, R.; Sun, J. Faster r-cnn: Towards real-time object detection with region proposal networks. Adv. Neural Inf. Process. Syst. 2015, 28, 1137–1149. [Google Scholar] [CrossRef] [PubMed]
  5. He, K.; Gkioxari, G.; Dollár, P.; Girshick, R. Mask r-cnn. In Proceedings of the IEEE International Conference on Computer Vision, Venice, Italy, 22–29 October 2017; pp. 2961–2969. [Google Scholar] [CrossRef]
  6. Zhao, W.; Chen, F.; Huang, H.; Li, D.; Cheng, W.J.H.L. A New Steel Defect Detection Algorithm Based on Deep Learning. Comput. Intell. Neurosci. 2021, 2021, 5592878. [Google Scholar] [CrossRef] [PubMed]
  7. Junting, F.; Xiaoyang, T.A.N. Defect detection of metal surface based on attention cascade R-CNN. J. Front. Comput. Sci. Technol. 2021, 15, 1245. [Google Scholar] [CrossRef]
  8. Xia, B.; Luo, H.; Shi, S. Improved faster R-CNN based surface defect detection algorithm for plates. Comput. Intell. Neurosci. 2022, 2022, 3248722. [Google Scholar] [CrossRef]
  9. Woo, S.; Park, J.; Lee, J.-Y.; Kweon, I.S. Cbam: Convolutional block attention module. In Proceedings of the European Conference on Computer Vision (ECCV), Munich, Germany, 8–14 September 2018; pp. 3–19. [Google Scholar] [CrossRef]
  10. Li, L.; Jiang, Z.; Li, Y. Surface Defect Detection Algorithm of Aluminum Based on Improved Faster RCNN. In Proceedings of the 2021 IEEE 9th International Conference on Information, Communication and Networks (ICICN), Xi’an, China, 25–28 November 2021; pp. 527–531. [Google Scholar] [CrossRef]
  11. Lin, C.Y.; Chen, C.H.; Yang, C.Y.; Akhyar, F.; Hsu, C.Y.; Ng, H.F. (Eds.) Cascading Convolutional Neural Network for Steel Surface Defect Detection; Springer: Berlin/Heidelberg, Germany, 2019. [Google Scholar] [CrossRef]
  12. Zhang, R.; Wen, C. SOD-YOLO: A Small Target Defect Detection Algorithm for Wind Turbine Blades Based on Improved YOLOv5. Adv. Theory Simul. 2022, 5, 7. [Google Scholar] [CrossRef]
  13. Wang, Z.; Zhang, G.; Luan, K.; Yi, C.; Li, M. Image-Fused-Guided Underwater Object Detection Model Based on Improved YOLOv7. Electronics 2023, 12, 4064. [Google Scholar] [CrossRef]
  14. Bhookya, N.N.; Ramanathan, M.; Ponnusamy, P. Refined single-stage object detection deep-learning technique for chilli leaf disease detection. J. Electron. Imag. 2023, 32, 033039. [Google Scholar] [CrossRef]
  15. He, Y.; Song, K.; Meng, Q.; Yan, Y. An End-to-End Steel Surface Defect Detection Approach via Fusing Multiple Hierarchical Features. IEEE Trans. Instrum. Meas. 2020, 69, 1493–1504. [Google Scholar] [CrossRef]
  16. Redmon, J.; Divvala, S.; Girshick, R.; Farhadi, A. You only look once: Unified, real-time object detection. In Proceedings of the IEEE Conference on Computer Vision and Pattern Recognition, Las Vegas, NV, USA, 27–30 June 2016; pp. 779–788. [Google Scholar] [CrossRef]
  17. Redmon, J.; Farhadi, A. YOLO9000:better, faster, stronger. In Proceedings of the 2017 Conference on Computer Vision and Pattern Recognition, Honolulu, HI, USA, 21–26 July 2017; pp. 6517–6525. [Google Scholar] [CrossRef]
  18. Redmon, J. Farhadi A. Yolov3: An incremental improvement. arXiv 2018, arXiv:1804.02767. [Google Scholar] [CrossRef]
  19. Bochkovskiy, A.; Wang, Y.; Liao, M. Yolov4:Optimal speed and accuracy of object detection. arXiv 2020, arXiv:2004.10934. [Google Scholar] [CrossRef]
  20. Khanam, R.; Hussain, M. What is YOLOv5: A deep look into the internal features of the popular object detector. arXiv 2024, arXiv:2407.20892. [Google Scholar] [CrossRef]
  21. Wang, C.-Y.; Bochkovskiy, A.; Liao, H.-Y.M. YOLOv7: Trainable bag-of-freebies sets new state-of-the-art for real-time object detectors. In Proceedings of the IEEE/CVF Conference on Computer Visionand Pattern Recognition, Vancouver, BC, Canada, 18–22 June 2023; pp. 7464–7475. [Google Scholar] [CrossRef]
  22. Terven, J.; Cordova-Esparza, D. A comprehensive review of YOLO: From YOLOv1 to YOLOv8 and beyond. arXiv 2023, arXiv:2304.00501. [Google Scholar] [CrossRef]
  23. Yang, B.; Bender, G.; Le, Q.V.; Ngiam, J. Condconv:Conditionally parameterized convolutions for efficient inference. Adv. Neural Inf. Process. Syst. 2019, 32, 1307–1318. [Google Scholar] [CrossRef]
  24. Chen, Y.; Dai, X.; Liu, M.; Chen, D.; Yuan, L.; Liu, Z. Dynamic convolution: Attention over convolution kernels. In Proceedings of the IEEE/CVF Conference on Computer Vision and Pattern Recognition, Seattle, WA, USA, 19 June 2020; pp. 11030–11039. [Google Scholar] [CrossRef]
  25. Li, C.; Zhou, A.; Yao, A. Omni-dimensional dynamic convolution. arXiv 2022, arXiv:2209.07947. [Google Scholar] [CrossRef]
  26. Rezatofighi, H.; Tsoi, N.; Gwak, J.; Sadeghian, A.; Reid, I.; Savarese, S. Generalized Intersection Over Union:A Metric and a Loss for Bounding Box Regression. In Proceedings of the 2019 IEEE/CVF Conference on Computer Vision and Pattern Recognition(CVPR), Long Beach, CA, USA, 15–20 June 2019; pp. 658–666. [Google Scholar] [CrossRef]
  27. Zheng, Z.; Wang, P.; Liu, W.; Li, J.; Ye, R.; Ren, D. Distance-IoU Loss: Faster and Better Learning for Bounding Box Regression. arXiv 2019, arXiv:1911.08287. [Google Scholar] [CrossRef]
  28. Zheng, Z.; Wang, P.; Ren, D.; Liu, W.; Ye, R.; Hu, Q.; Zuo, W. Enhancing geometric factors in model learning and inference for object detection and instance segmentation. IEEE Trans. Cybern. 2021, 52, 8574–8586. [Google Scholar] [CrossRef]
  29. Zhang, Y.-F.; Ren, W.; Zhang, Z.; Jia, Z.; Wang, L.; Tan, T. Focal and efficient IOU loss for accurate bounding box regression. Neurocomputing 2022, 506, 146–157. [Google Scholar] [CrossRef]
  30. Tong, Z.; Chen, Y.; Xu, Z.; Yu, R. Wise-IoU: Bounding Box Regression Loss with Dynamic Focusing Mechanism. arXiv 2023, arXiv:2301.10051. [Google Scholar] [CrossRef]
  31. Neha, F.; Bhati, D.; Shukla, D.K.; Amiruzzaman, M. From classical techniques to convolution-based models: A review of object detection algorithms. In Proceedings of the 2025 IEEE 6th International Conference on Image Processing, Applications and Systems (IPAS), Lyon, France, 9–11 January 2025. [Google Scholar] [CrossRef]
  32. Hu, J.; Shen, L.; Sun, G. Squeeze-and-excitation networks. In Proceedings of the IEEE Conference on Computer Vision and Pattern Recognition, Salt Lake City, UT, USA, 23 June 2018; pp. 7132–7141. [Google Scholar] [CrossRef]
  33. Hou, Q.; Zhou, D.; Feng, J. Coordinate attention for efficient mobile network design. In Proceedings of the IEEE/CVF Conference on Computer Vision and Pattern Recognition, Nashville, TN, USA, 19–25 June 2021; pp. 13713–13722. [Google Scholar] [CrossRef]
  34. Xia, K.; Lv, Z.; Zhou, C.; Gu, G.; Zhao, Z.; Liu, K.; Li, Z. Mixed Receptive Fields Augmented YOLO with Multi-Path Spatial Pyramid Pooling for Steel Surface Defect Detection. Sensors 2023, 23, 5114. [Google Scholar] [CrossRef]
  35. Guo, Z.; Wang, C.; Yang, G.; Huang, Z.; Li, G. MSFT-YOLO: Improved YOLOv5 based on transformer for detecting defects of steel surface. Sensors 2022, 22, 3467. [Google Scholar] [CrossRef]
Figure 1. Six defect types.
Symmetry 17 00701 g001
Figure 2. YOLOv8s network structure. The ‘Bottleneck(?)’ in C2f denotes a configurable number of bottleneck blocks, adjusted based on model size.
Symmetry 17 00701 g002
Figure 3. ODConv implementation.
Symmetry 17 00701 g003
Figure 4. Four attentional operations. (a) represents position—wise multiplication along the spatial dimension, (b) channel-wise multiplication along the input channel dimension, (c) filter—wise multiplication along the output channel dimension, and (d) kernel—wise multiplication along the convolutional kernel dimension. The calculation of attention utilizes the SE (Squeeze-and-Excitation) model based on the attention mechanism.
Symmetry 17 00701 g004
Figure 5. YOLOv8s-OD model structure: (a) backbone structure; (b) detection head.
Symmetry 17 00701 g005
Figure 6. Comparison of model PR curves (a) YOLOv8s PR curve; (b) YOLOv8s-OD PR curve.
Symmetry 17 00701 g006
Figure 7. Comparison of algorithm detection results.
Symmetry 17 00701 g007
Figure 8. Six results of defect detection: (a) defect detection. The Original annotated image annotates the real defects on the steel surface, while YOLOv8s and YOLOv8s-OD respectively annotate the defects detected by their corresponding models. (b) feature visualization. The deeper the red, the higher the model’s attention to the region; the deeper the blue, the lower the attention.
Symmetry 17 00701 g008
Table 1. Experimental environment and configuration.
NameConfiguration
Operating systemWindows 11
CPUAMD Ryzen 7 5800H with Radeon Graphics
GPUNVIDIA GeForce RTX 3060 Laptop GPU (6G)
deep learning framePyTorch 1.10.2
Development environmentCUDA 11.3
Table 2. Experimental parameter settings (SGD optimizer).
ParameterValue
learning rate0.01
momentum0.937
weight_decay0.0005
batch size16
epochs200
Table 3. Comparison of IOU-loss experimental results.
IOU-LossCIOU (Base Line)DIOUEIOUWIOU
Accuracy (%)74.372.169.976.1
Table 4. Comparison of attention mechanism experimental results.
ModelComputational Complexity/GFLOPsParams (106)Accuracy (%)
Base line28.411.1374.3
+CA28.511.1473.3
+SE28.511.1473.8
+CBAM31.211.6773.5
+ODConv24.711.1775.8
Table 5. Model ablation experiment results.
ExperimentWIoUODConvAccuracy (%)Recall (%)mAP@0.5 (%)
YOLOv8s 74.375.477.3
YOLOv8s1 76.172.577.8
YOLOv8s2 75.874.777.8
YOLOv8s-OD78.871.378.9
Table 6. Comparison results of different algorithms.
MethodFPS(f/s)mAP(%)AP(%)
CrInPaPsRsSc
Faster-RCNN [34]2375.054.581.189.379.862.582.6
RetinaNet [34]6369.550.877.889.580.462.855.3
MSFT-YOLO [35]3175.256.980.893.582.152.783.5
YOLOV57876.742.177.59282.468.593.4
YOLOV8s9377.345.080.791.681.869.495.4
YOLOV8s-OD8978.950.781.693.978.873.794.6
Disclaimer/Publisher’s Note: The statements, opinions and data contained in all publications are solely those of the individual author(s) and contributor(s) and not of MDPI and/or the editor(s). MDPI and/or the editor(s) disclaim responsibility for any injury to people or property resulting from any ideas, methods, instructions or products referred to in the content.

