Abstract
The citrus industry plays a pivotal role in modern agriculture. With the expansion of citrus plantations, the intelligent detection and prevention of diseases and pests have become essential for advancing smart agriculture. Traditional citrus leaf disease identification methods primarily rely on manual observation, which is often time-consuming, labor-intensive, and prone to inaccuracies due to inherent asymmetries in disease manifestations. This work introduces CBACA-YOLOv5, an enhanced YOLOv5s-based detection algorithm designed to effectively capture the symmetric and asymmetric features of common citrus leaf diseases. Specifically, the model integrates the convolutional block attention module (CBAM), which symmetrically enhances feature extraction across spatial and channel dimensions, significantly improving the detection of small and occluded targets. Additionally, we incorporate coordinate attention (CA) mechanisms into the YOLOv5s C3 module, explicitly addressing asymmetrical spatial distributions of disease features. The CARAFE upsampling module further optimizes feature fusion symmetry, enhancing the extraction efficiency and accelerating the network convergence. Experimental findings demonstrate that CBACA-YOLOv5 achieves an accuracy of 96.1% and a mean average precision (mAP) of 92.1%, and improvements of 0.6% and 2.3%, respectively, over the baseline model. The proposed CBACA-YOLOv5 model exhibits considerable robustness and reliability in detecting citrus leaf diseases under diverse and asymmetrical field conditions, thus holding substantial promise for practical integration into intelligent agricultural systems.
1. Introduction
The citrus industry is crucial to modern agriculture, exhibiting consistent growth to meet rising living standards. Citrus cultivation areas and production have expanded continuously. Planting areas have also increased with demand [1]. As a perennial crop, citrus is highly susceptible to viral diseases due to agricultural practices and vectors. These infections impede growth, reduce yield, degrade fruit quality, and may cause plant death, resulting in significant economic losses [1,2]. Disease identification in large-scale citrus plantations remains manual, time-consuming, labor-intensive, and inaccurate. Diseased leaves exhibit variations in morphology, color, and distribution. Therefore, the rapid and accurate detection of disease areas and identification of disease types are crucial for effective disease management. This constitutes a key challenge in modern smart agriculture [3].
Identifying crop diseases faces multiple challenges that significantly impact agricultural productivity and sustainability. There is a notable scarcity of qualified agricultural professionals in large-scale agricultural operations [4]. Currently used manual classification and identification techniques are time-consuming, often requiring farmers to spend several hours each week inspecting fields, which consumes considerable labor and becomes more difficult under adverse weather conditions [5]. Additionally, manual detection relies heavily on the experience and expertise of farmers, which can be influenced by personal judgment, leading to biases and inaccuracies. Delays in early diagnosis and rapid management due to manual detection methods can result in significant crop losses and reduced yields [6,7,8].
Recently, deep learning computer vision has achieved significant progress in image classification and object detection. Thus, it provides a strong foundation for plant disease recognition models. Conventional agricultural image processing employs machine learning algorithms, such as support vector machines, decision trees, and perceptrons [9]. However, citrus leaf diseases exhibit varying morphological, color, and distributional characteristics depending on the disease stage and type. Manual disease identification is time-consuming, labor-intensive, and subject to individual variability and limited accuracy. Conventional machine vision struggles with complex lighting, varying image scales, and shadow interference, limiting achievable recognition accuracy.
The availability of large datasets has spurred the development of deep learning technologies, including convolutional neural networks (CNNs), recurrent neural networks (RNNs), and ensemble learning, within agriculture. Deep learning facilitates the advancement of intelligent agricultural machinery compared to conventional machine learning, which enables automatic feature extraction from raw data and combines low-level features into high-level representations.
Common deep learning object detection models, such as Faster R-CNN [10], RetinaNet [11], and the YOLO series [12], have been widely adopted for agricultural disease detection. For example, Wang et al. [13] improved Faster R-CNN by using ResNet with split attention and feature pyramid networks (FPNs) for multi-scale feature fusion, achieving an 86.2% mean average precision (mAP) for apple leaf disease detection in complex environments. Yao et al. [14] employed ResNeXt101 and group normalization (GN) to achieve automatic rice canopy pest detection with a 93.76% mAP. Chen et al. [15] incorporated transformer and coordinate attention (CA) mechanisms into YOLOv5s and a weighted bi-directional feature pyramid network (BiFPN) to achieve a 97.3% mAP for tea leaf disease detection. Zhang et al. [16] used an optimized YOLOv4 for detection and EfficientNet for classification to identify citrus fruit diseases. However, Faster R-CNN typically uses a region proposal network (RPN), and RetinaNet often employs a feature pyramid network (FPN) [17,18,19]. These methods encounter limitations with complex backgrounds, indistinct edges, and targets exhibiting similar symptoms, thus affecting target extraction, efficiency, and detection accuracy.
Numerous researchers have proposed their own methods and models to enhance the accuracy of detecting various leaf diseases and pests. Common deep learning models for leaf disease detection include convolutional neural networks (CNNs), visual geometry group (VGG), ResNet (RNet), GoogLeNet, deep convolutional neural networks (DCNNs), back propagation neural networks (BPNNs), DenseNet (DNet), LeafNet (LN), and LeNet [20]. Variants of these models have also demonstrated promising performance. In leaf disease and pest detection, the base model of YOLOv5 exhibits both lightweight characteristics and high accuracy. For example, YOLOv5-CBF was introduced, incorporating a coordinate attention mechanism and replacing the original PANet with a bi-directional feature pyramid network (BiFPN) to enhance the feature extraction capability for disease information [21]. Additionally, the improved YOLOv5 model has achieved an accuracy of 91.4% in detecting leaf diseases and pests in tomatoes [22]. Furthermore, a pre-trained ResNet-50 model was employed to detect four major citrus diseases, attaining an accuracy of 90% [23]. Rabbia Mahum et al. proposed an efficient DenseNet model based on a pre-trained architecture with an additional transition layer, achieving an impressive accuracy of 97% in experiments focused on detecting and classifying four diseases in potato leaves [24].
Considering the diversity and subtle variations in citrus leaf pests and diseases, a model incorporating CARAFE (content-aware reassembly of features), SSD (single-shot multibox detector), and a combination of CBAM (convolutional block attention module) with the C3 module and coordinate attention (CA) could achieve superior performance. First, CARAFE, functioning as an adaptive feature reassembly upsampling module, enables more precise feature-map interpolation in small-object detection tasks, reinforcing the network’s ability to capture object boundaries and fine details. Second, the lightweight and efficient target-detection characteristics of SSD provide both a foundational baseline and a reference point for detecting multiple disease types. Finally, by incorporating both symmetrical and asymmetrical attention mechanisms—achieved by combining CBAM with the C3 module and integrating CA—the proposed model further enhances feature extraction, facilitating the more targeted recognition and detection of diverse and complex citrus leaf pests and diseases.
Most existing methods achieve reasonably accuracy in detecting and recognizing agricultural pests and diseases, thereby advancing crop pest and disease identification. However, research on citrus diseases primarily focuses on classification rather than the object detection of citrus leaf lesions, with only a limited number of target categories being addressed [25,26]. Recognizing citrus leaf diseases poses significant challenges due to minimal feature differences, small and densely packed targets, and complex, unstructured backgrounds. To address these gaps, our study proposes CBACA-YOLO5, an improved object detection algorithm based on YOLOv5s, which incorporates a convolutional block attention module (CBAM) and a CARAFE upsampling module. This approach enhances feature extraction and improves the detection accuracy in real-time while maintaining high speed. Experimental comparisons demonstrate its superior performance against existing models, providing effective technical support for early citrus disease prevention and economic loss reduction for growers.
In order to address these challenges, this study focuses on citrus leaf disease recognition. We propose a citrus disease leaf detection tailored from YOLOv5s, termed CBACA-YOLO5. We design a convolutional block attention module (CBAM) to enhance feature extraction using a convolutional coordinate attention mechanism. The CBAM improves small and occluded target detection. A C3 module with coordinate attention (CA) further strengthens disease feature extraction. A CARAFE upsampling module improves feature extraction efficiency and accelerates convergence. In this way, our CBACA-YOLO5 improves detection accuracy while maintaining real-time speed.
Experiments compared CBACA-YOLO5 with SSD, YOLOv4, YOLOv10s, YOLOv11s, and so on. Experimental results demonstrate the improved recognition accuracy and overall model effectiveness. Our algorithm provides technical support for early citrus disease prevention to reduce economic losses for growers. It is promising to promote agricultural modernization.
The contributions of this work are summarized as follows.
- Our model improves spatial and channel-wise attention for efficiently and quickly detecting small and occluded targets in citrus leaf diseases in real time.
- Our CARAFE module allows precisely localizing complex disease patterns and addresses previously overlooked challenges.
- Our effective technical support for early disease prevention may reduce economic losses for growers and promote agricultural modernization.
- We conduct sufficient experiments to demonstrate that the CBACA-YOLO5 outperforms existing models in detection accuracy and operational effectiveness.
2. Related Works
YOLOv5 is an efficient one-stage object detection model that has garnered significant attention due to its outstanding performance [27]. The network structure of YOLOv5s is shown in Figure 1. It features a flexible design based on the depth and width of the network architecture, resulting in four variants—YOLOv5s, YOLOv5m, YOLOv5l, and YOLOv5x [28]. These variants provide diverse choices between resource consumption and detection accuracy, catering to various needs, from lightweight applications on mobile devices to high-performance server-side computing.
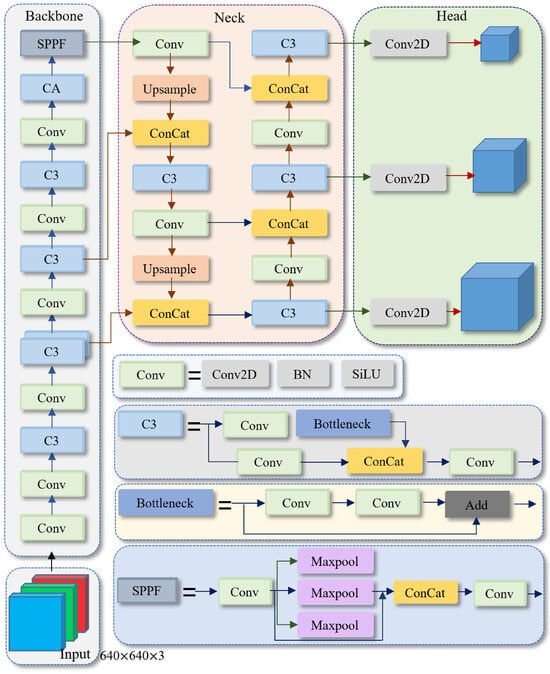
Figure 1.
The network structure of YOLOv5s. Conv denotes convolution. BN denotes batch normalization. SiLU is the activation function. Add represents tensor addition. Concat is the feature concatenation module. Upsample is the upsampling module, and SPPF refers to the spatial pyramid pooling module. Max pool2d represents max pooling.
Among these, the YOLOv5s variant excels in agricultural image processing due to its real-time detection capabilities and low latency, which are critical for precision agriculture [29,30]. Its lightweight architecture ensures high-speed processing without sacrificing accuracy, making it ideal for detecting small, complex targets such as pests and diseases on leaves. This capability facilitates the early detection of subtle symptoms, preventing extensive crop damage and economic loss, thereby establishing YOLOv5s as a vital tool in modern agriculture.
As a single-stage object detection algorithm, YOLOv5 demonstrates superior performance within its series, notably for its minimal training time and fastest inference speed. YOLOv5s, with its relatively shallow network structure and narrower feature maps, is an ideal choice for deployment in embedded systems [31]. Compared to Faster R-CNN, YOLOv5s offers significantly higher speed and accuracy, making it more suitable for real-time agricultural disease monitoring, while Faster R-CNN is better suited for offline analysis [17,18]. Additionally, YOLOv5s achieves a better balance between speed and accuracy than SSD, particularly excelling in small object detection, where SSD may overlook subtle disease features despite its relative speed [32].
After comparing the parameters of the newer YOLOv10s and YOLOv11s, as well as their performance in identifying diseases and pests on citrus leaves, it is evident that, while these updated YOLO versions offer more advanced features, YOLOv5 continues to demonstrate exceptional performance, particularly in the domain of leaf disease and pest image processing. Overall, YOLOv5s effectively balances speed and accuracy, making it advantageous for real-time detection tasks. Furthermore, the relative simplicity of implementing YOLOv5 is particularly important in resource-constrained environments. Thus, we adopt YOLOv5s as the backbone for our framework.
3. Methodology
3.1. Overall Architecture
In citrus disease identification, the YOLOv5s model faces challenges in practice agricultural environments, despite being lightweight and its good performance in many object detection tasks. First, disease symptoms in the early stages are subtle. YOLOv5s’ original detection head is less sensitive when it comes to processing these fine-grained features. Second, disease spot scales vary significantly from minute initial lesions to prominent severe ones. YOLOv5s may fail to extract multi-scale features, increasing the chances of missed or incorrect small lesion detection. Third, the backbone network and feature pyramid pose computational challenges. This results in insufficient feature extraction efficiency. Therefore, the YOLOv5s model’s identification and localization of citrus diseases in practice in agricultural environments requires further optimization.
In this paper, we propose a novel citrus leaf disease detection network following the backbone of YOLOv5s, termed CBACA-YOLO5. Our CBACA-YOLO5 addresses challenges in recognizing and locating citrus diseases. These challenges include complex lighting in citrus growth environments, subtle differences between diseased and healthy citrus tissue, and morphological changes during disease progression. The CBACA-YOLO5 consists of channel attention (CA), convolutional block attention module (CBAM), and CARAFE upsampling. Specifically, a C3_CA module with CA replaces the Backbone’s final C3 module. CARAFE upsampling is introduced in the neck to enhance key feature recognition. CBAM suppresses irrelevant information and focuses the model on key disease features.
The CBAM and CA enhance key feature identification and localization by integrating channel, spatial, and positional attention to significantly improve the detection accuracy for small targets and subtle features in agricultural disease detection. Figure 2 shows the architecture of our citrus leaf disease detection network.
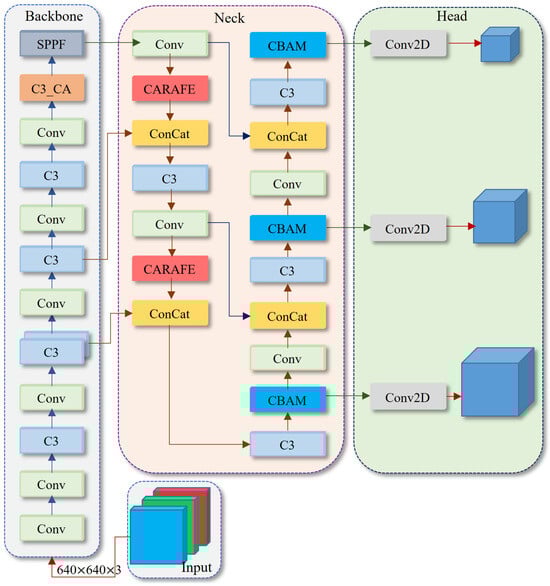
Figure 2.
The overall architecture of our CBACA-YOLO5. C3_CA denotes the C3 module with the CA attention mechanism. CARAFE represents the upsampling network structure, and CBAM is the added attention module within the CBACA-YOLO5 network.
3.1.1. Fusion of Location Guide in CA Attention Mechanism
Attention mechanisms optimize resource allocation in deep neural networks by focusing on key information to improve model performance [33], which are widely used in computer vision tasks [34,35]. However, many attention mechanisms focus on global features and may overlook local spatial relationships, sometimes neglecting target spatial layout information [36]. The CA attention mechanism addresses this by fusing channel features with positional guidance, enhancing target localization and disease feature recognition accuracy [37]. Figure 3 illustrates the structure of the CA attention mechanism, incorporating location guidance.
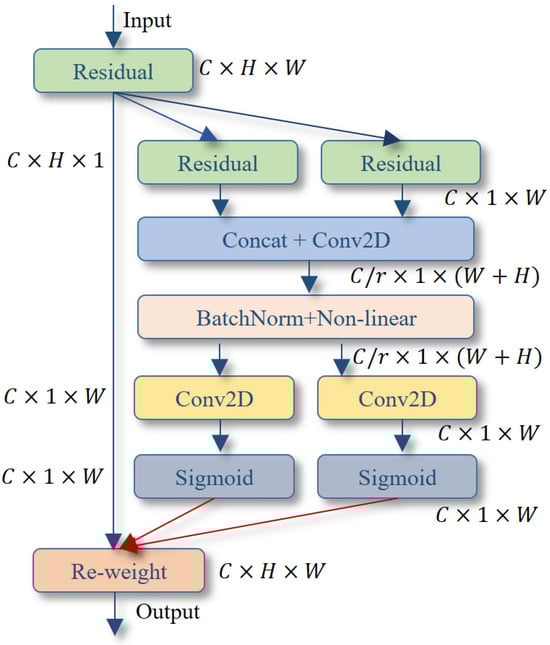
Figure 3.
The network structure diagram of the CA attention mechanism.
As shown in Figure 3, the parameters C, H, and W represent the number of channels, height, and width of the input feature map, respectively. r denotes the channel subsampling rate.
Let , where is the input layer. The basic process of the CA attention mechanism with integrated positional guidance is as follows.
(1) For the input , two separate pooling kernels and are employed. and encode the data of each channel of along the horizontal and vertical axes, respectively. For any channel c, represents the features along the image height H and represents features along the image width W.
where H and W represent the height and width of the X feature layer, respectively. indicates the output of the c-th channel. and denote the inputs of the feature map along the H direction and W direction, respectively.
(2) We separately extract features along the horizontal and vertical directions and then merge these separated features. We employ a one-dimensional convolution operation and an activation function to fuse these features. The encoding is calculated by
where f represents the intermediate feature map after encoding spatial information along the horizontal and vertical directions. The symbol denotes the concatenation operation along the spatial dimension. represents the convolution operation, and is the Sigmoid function.
(3) The integrated feature map f splits along its two spatial dimensions. We process these split features by two independent convolution operations. These operations adjust the channel number of the feature map to match the original input feature channel number to ensure channel-dimension consistency between processed features and input data. Then, we use a sigmoid function to calculate attention weights at each feature map position to emphasize important features for achieving selective feature enhancement.
where and represent the attention weights obtained from the convolution and activation along the two directions after the spatial split of feature map f by (3). and denote the feature maps along the H and W directions after the spatial split of f. and are the convolution operations along the respective directions. is the Sigmoid function.
3.1.2. Improving the Neck Backbone Network—Fusion of CBAM Attention Mechanism
To enhance citrus disease representation capture during multi-scale feature fusion, CBACA-YOLO5 integrates the CBAM attention mechanism [38] into the neck backbone network. CBAM uses a hierarchical attention fusion strategy to perform channel attention (CA) after spatial attention (SA). It focuses on feature map spatial distribution and emphasizes important inter-channel differences.
We extract global channel-wise descriptors from the feature map in the CA module by global average pooling and max pooling. These descriptors are fed into multi-layer perceptrons (MLPs) to map channel attention vectors. We form channel attention weights by summing and normalizing the two sets of vectors. Finally, the channel attention weights is calculated by a sigmoid activation function as
where f represents the input feature map; denotes sigmoid activation function; and represent average pooling and max pooling, respectively.
In the spatial attention module, the channel-refined feature map is obtained by element-wise multiplication between the calculated and the original input feature map f along the channel dimension. Two weight vectors obtained by and are concatenated. Finally, the spatial attention weight can be defined by applying a convolution operation followed by a Sigmoid activation function:
where f represents the input feature map; stands for the Sigmoid activation function; indicates a convolutional layer; finally, it is multiplied with the channel-refined feature to obtain the spatial channel-refined feature .
The CBAM structure is shown in Figure 4. It combines the positional guidance of the CA attention mechanism for citrus disease detection. This mechanism helps the model capture the spatial distribution characteristics of citrus diseases at different scales, such as specific colors, textures, and other channel features of various diseases. The bidirectional attention guidance of CBAM allows the CBACA-YOLO5 algorithm model to effectively select relevant features for disease recognition during multi-scale feature fusion to identify citrus disease locations and types.
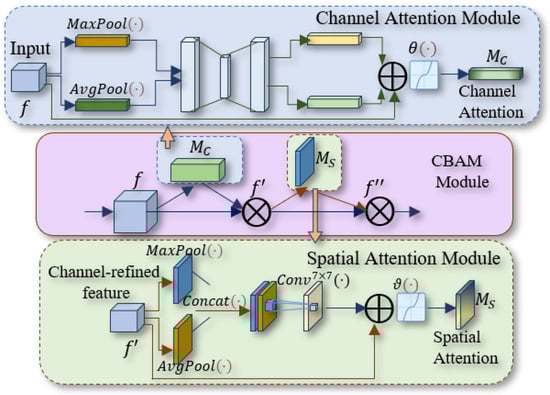
Figure 4.
Improved CBAM network structure.
3.1.3. Integrating CARAFE Upsampling
The feature upsampling operation is essential in CNN structures for feature enhancement during feature fusion. The YOLOv5s model constructs a feature pyramid structure to integrate feature information from shallow to deep network layers. However, the inherent perceptual limitations of nearest neighbor upsampling in YOLOv5s fail to comprehensively utilize high-level semantic features.
To address these limitations, our model adopts the content-aware reassembly of features (CARAFE) [39]. The upsampling module consists of a kernel prediction module and a content-aware reassembly module. These collaborated modules enhance the model’s recognition and utilization of key features through an efficient feature map upsampling process. CARAFE surpasses bilinear interpolation by employing content-aware convolutional kernels for dynamic upsampling to preserve feature details and edges. It avoids the checkerboard artifacts often introduced by deconvolution.
The kernel prediction module compresses the input feature map f () to channels by using a convolutional kernel as follows.
where represents the upsampling factor of the upsampling layer (typically set to ), and denotes the size of the upsampling kernel. This operation reduces the computational complexity and lays the groundwork for subsequent kernel prediction.
The feature map is reshaped to new dimensions (, , ) to obtain upsampling filters for prediction leveraging the pixel shuffle technique [40]. The predicted kernels are normalized using the softmax function to ensure the sum of their weights to 1 and outputs are appropriately distributed. In this way, the feature map is fed into a custom reshuffling module. For each target location in the output feature map, the module maps the region around the center of that location back to the feature map through element-wise multiplication for a high-quality feature map of size .
The CARAFE upsampling method intelligently generates customized upsampling strategies for different features within the feature map to focus on critical features from a global perspective. The clear restoration of small-scale features, such as disease edges and spots, is crucial for citrus disease detection. Compared to the nearest-neighbor upsampling method, the CARAFE upsampling module slightly increases the parameter count while improving the fidelity of disease features during the upsampling stage. This improvement benefits the overall inference speed of the model. The structure of our CARAFE upsampling module is shown in Figure 5.
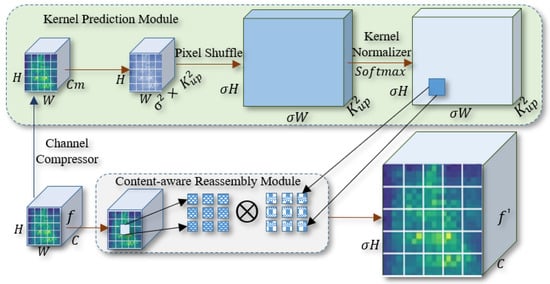
Figure 5.
The CARAFE upsampling module in the CBACA-YOLO5 model.
As shown in Figure 5, the input feature map is denoted as f (), where H and W represent the height and width of the input feature map, respectively. C denotes the number of channels in the original input feature map. represents the number of channels in the reduced-dimension feature layer, and denotes the size of the predicted upsampling kernel. and indicate the height and width of the upsampled feature map, respectively. The high-resolution feature map is denoted as ().
The superiority of the CARAFE upsampling method is mathematically encapsulated through its adaptive kernel prediction and content-aware reassembly processes. The kernel prediction module reduces the dimensionality of the input feature map using a convolution to construct a compressed feature map , where is the upsampling factor and is the kernel size. This operation not only reduces computational complexity but also preserves essential spatial information. The content-aware reassembly leverages the pixel shuffle technique to reshape the feature map into dimensions , allowing for context-sensitive upsampling. The predicted kernels are normalized using the Softmax function, ensuring that the sum of their weights is 1, which maintains numerical stability and consistency. This dynamic adaptation of the kernel size and spatial distribution enables CARAFE to maintain edge fidelity and restore high-frequency details, which is crucial for tasks like citrus leaf disease detection.
4. Experiments and Results Analysis
To validate the effectiveness of the CBACA-YOLO5 model in citrus leaf disease and pest detection and recognition, we conducted relevant experiments. We compared its performance with the latest and typical algorithms in the field.
4.1. Dataset Description
The experiment utilized a real-world dataset, a hybrid dataset created by integrating the CCL’20 dataset from the Kaggle platform [21,41] and the open dataset from the iFLYTEK Citrus Disease and Pest Recognition Challenge (Source: https://aistudio.baidu.com/datasetdetail/96817, accessed on 3 March 2025). The combined dataset contains a total of 2283 citrus leaf disease images with correct labels that meet the experimental requirements. The images are in the JPG format, with pixel resolutions ranging from to . The dataset covers four disease classes and one healthy leaf class, resulting in a total of five label categories.
Data preprocessing: To ensure consistent input for the model during both training and inference and to improve the model’s performance and stability, all images were resized to a resolution of pixels. The LabelImg rectangular annotation tool was used to label all images manually, capturing the category and location information of the target lesions. All images in the dataset were annotated by professionals, ensuring the quality and accuracy of the dataset. The converted annotation information, including image IDs, class labels, and lesion locations, was saved as a TXT file, completing the preprocessing of the citrus leaf disease dataset. Through data preprocessing, the trained model can accurately recognize various leaf diseases and correctly classify healthy leaves.
In the experiments, the dataset was randomly divided into a training set (1827 images) and a validation set (456 images) in an 8:2 ratio. Figure 6 shows the distribution of image instances for each disease in the dataset, and Table 1 provides detailed information on the number of images for each type of citrus leaf disease.
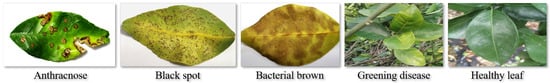
Figure 6.
Examples of citrus leaf disease and healthy leaf images.

Table 1.
Description of the citrus leaf disease dataset.
4.2. Experimental Setup and Evaluation Metrics
(1) Experimental environment configuration: The experimental setup in this study utilized Xeon(R) Platinum 8255C CPU (Intel Corporation, Santa Clara, CA, USA), NVIDIA RTX 2080 Ti GPU (NVIDIA Corporation, City: Santa Clara, CA, USA), and the Ubuntu 22.04 LTS operating system. The compilation environment employed Python 3.8, PyTorch 1.9.0, and TorchVision 0.10.0 deep learning frameworks. The GPU training acceleration version was CUDA 11.0. The detailed configuration parameters for the initial training are listed in Table 2.
Table 2.
Initial parameter settings of CBACA-YOLO5 for the network.
(2) Evaluation metrics: In order to verify the model’s detection performance on citrus leaf diseases in natural environments and optimize the model parameters to achieve the desired performance, this study employed multiple evaluation metrics. The training accuracy of the model was measured by precision (%), recall (%), and mean average precision (mAP, %). The number of parameters, computation, and model weight size evaluated the model complexity. The frame per second (FPS) was also used to assess the model’s real-time detection performance. In real-time field-based citrus leaf disease monitoring, achieving high FPS enables swift detection and timely intervention, minimizing crop losses. It enhances the operational efficiency and scalability of autonomous systems like UAVs, ensuring seamless integration and practical usability for dynamic agricultural environments.
The variables are given as follows:
- (true positives): The number of correct predictions that an object was present in the image.
- (false positives): The number of incorrect predictions that an object was detected in the image when it was not actually present.
- (false negatives): The number of instances that were not detected but were actually present in the image.
- R (Recall): The fraction of relevant instances that have been retrieved over the total relevant instances.
- N (Total instances): The total number of ground truth instances in the dataset.
4.3. Experimental Validation of the Effectiveness of the CBACA-YOLO5 Model
Experimental Results Analysis of the CBACA-YOLO5 Model
Applying the dataset obtained in Section 3.1, the effectiveness of the CBACA-YOLO5 model in citrus leaf disease detection was validated.
The CBACA-YOLO5 model utilized YOLOv5s as a pre-trained model for weight initialization, and the dataset was trained according to set hyperparameters. Figure 7 shows the change in loss value during the training process.
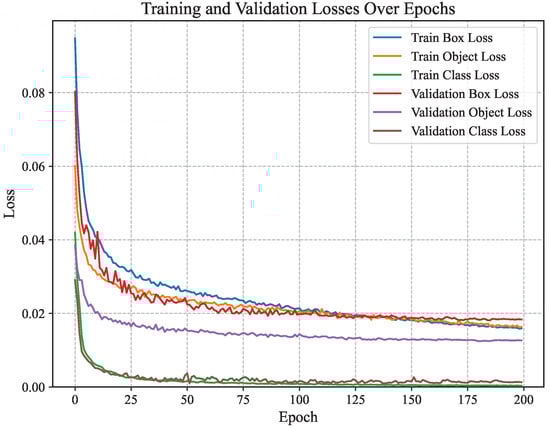
Figure 7.
The loss curve of the CBACA-YOLO5 model.
The smaller the confidence loss of the model, the more accurate its ability to detect targets; the smaller the classification loss, the higher the classification accuracy. As shown in Figure 7, after 200 training rounds, the Loss curve gradually tends to stabilize. These provide a detailed view of the CBACA-YOLO5 model’s training dynamics. Converting localization, confidence, and classification losses to low values (0.018, 0.0012, and 0.0012, respectively) signifies robust model performance. Specifically, low localization loss indicates precise bounding box predictions, which are essential for accurately identifying diseased areas on citrus leaves. The minimal confidence and classification losses reflect the model’s ability to reliably distinguish between healthy and diseased leaves, which is crucial for effective disease management in agricultural settings.
The accuracy changes during the training process of the CBACA-YOLO5 model are shown in Figure 8. Here, mAP_0.5 represents the mean average precision (mAP) when the intersection over union (IoU) is 0.5, while mAP_0.5:0.95 indicates the average mAP calculated over IoU thresholds from 0.5 to 0.95 (with a step size of 0.05).
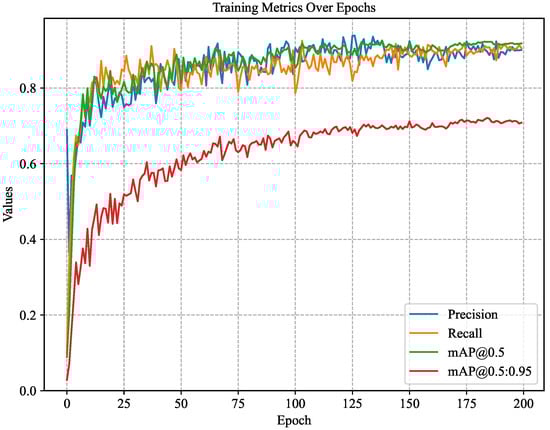
Figure 8.
The accuracy, recall, mAP0.5, mAP0.5:0.95 variation curve.
As shown in Figure 8, when the CBACA-YOLO5 model’s training iterations reach approximately 150, the model’s performance stabilizes without overfitting or underfitting. In the end, the model achieves an accuracy of 90.4%, a recall rate of 90.9%, a mAP_0.5 of 92.1%, and a mAP_0.5:0.95 of 72.5%.
To validate and compare the effectiveness of integrating the convolutional position attention mechanism, the detection performance difference between the CBACA-YOLO5 and basic YOLOv5s models was compared by conducting detection experiments on the test set using these two models. The PR curve graphs of YOLOv5s and CBACA-YOLO5 for each disease category are shown in Figure 9 and Figure 10.
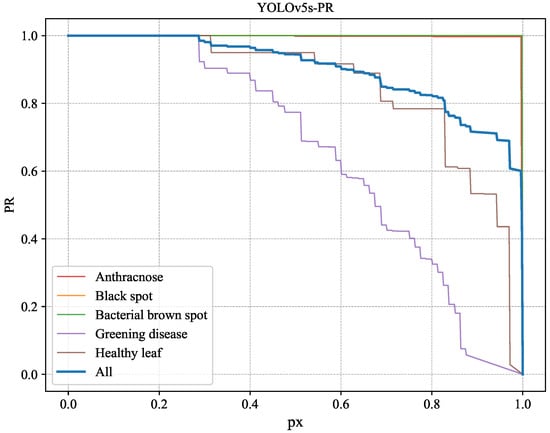
Figure 9.
PR variation curve of YOLOv5s across different disease categories.
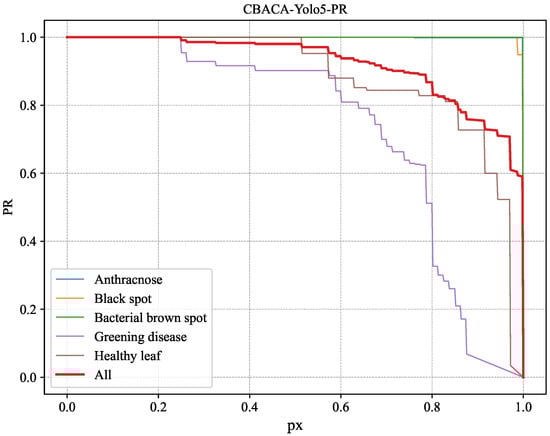
Figure 10.
PR variation curve of CBACA-YOLO5 across different disease categories.
From Figure 7, Figure 8, Figure 9 and Figure 10, it can be observed that the improved model shows enhanced identification performance for citrus leaf spots across all categories, manifested by significantly increased curve areas compared to the unimproved YOLOv5s. This indicates that the improved model has better identification capabilities.
Comparing the PR curves representing the overall situation in Figure 9 and Figure 10, the variation in Figure 10 is superior to the corresponding curve in Figure 9. To further illustrate, the change curve of the difference between the PR curves of YOLOv5s and CBACA-YOLO5: PR (CBACA-YOLO5) − PR (YOLOv5s) is shown in Figure 11.
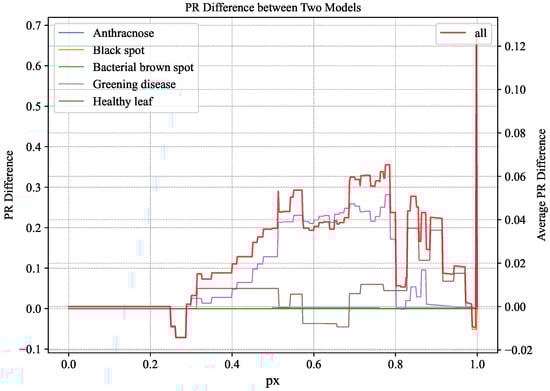
Figure 11.
PR difference variation curve between CBACA-YOLO5 and YOLOv5s.
Based on the significance of the difference in PR values between the two models, if the ordinate value of a point in the graph is positive, it indicates that for that recall rate, model A has higher precision than model B; conversely, it means that model B has higher accuracy than A. Figure 11 presents the difference between the PR values of CBACA-YOLO5 and YOLOv5s, with the curve mainly above the 0 scale across the five disease detections. The PR curves in Figure 11 illustrate the performance enhancement of CBACA-YOLO5 over YOLOv5s across various disease categories. A detailed examination of specific points on these curves shows that the CBACA-YOLO5 model consistently improves over YOLOv5s across various disease categories. The PR difference curve, which remains predominantly above zero, indicates that CBACA-YOLO5 achieves higher precision at equivalent recall levels. Notably, for anthracnose and black spot detection, the model shows significant gains, particularly in the mid to high recall range (0.4 to 0.8), suggesting enhanced detection capabilities. This improvement is crucial for accurate and reliable citrus disease monitoring, ensuring timely and effective interventions.
4.4. Ablation Study
4.4.1. Modules Performance in CBACA-YOLO5
The CBACA-YOLO5 model integrates the position-guided CA attention mechanism, CBAM attention mechanism, and CARAFE upsampling method to accurately and effectively detect the citrus leaf spots in natural environments. Relevant ablation experiments were conducted on the dataset to verify the effectiveness and necessity of these different optimization strategies in improving model performance.
The models in the experiment are named as follows: YOLOv5s_CA represents the integration of only the CA module; YOLOv5s_CA+CBAM represents the fusion of the CA and CBAM modules; YOLOv5s_CARAFE represents the integration of only the CARAFE upsampling method; YOLOv5s_CBAM represents the fusion of only the CBAM module. The performance comparison data obtained from the ablation experiments involving the individual and combined effects of the CA, CBAM, and CARAFE modules are presented in Table 3.
Table 3.
Performance comparison of ablation studies with various structures.
In each training round experiment, data were collected for the following performance metrics: train/box_loss, train/obj_loss, precision, recall, mAP_0.5, mAP_0.5:0.95, val/box_loss, val/obj_loss, val/cls_loss, x/lr0, x/lr1, x/lr2, totaling 12 performance indicator data. The results of each algorithm model on the above performance indicators are shown in Figure 12.
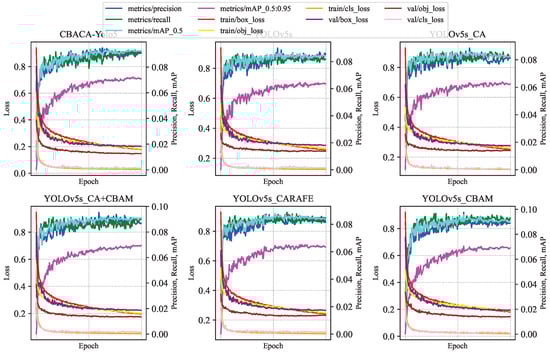
Figure 12.
Variation curves of each model on relevant performance indicators in ablation experiments.
The mAP results of the models with different modules added were statistically analyzed, and the mAP variation curves of each model after each training round are shown in Figure 13.
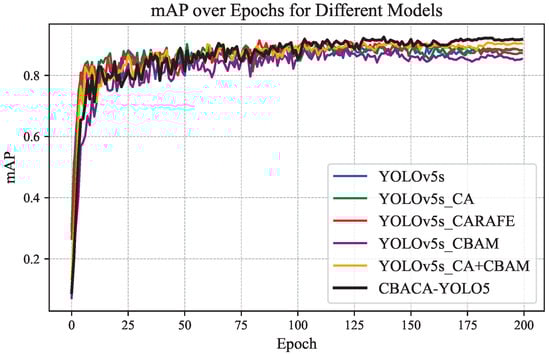
Figure 13.
The mAP variation curves of each model after each training round.
Based on the relevant data in Figure 12 and Figure 13, the difference distribution and improvement percentage of the mAP values of CBACA-YOLO5 compared to other models after each training round are shown in Figure 14 and Figure 15, respectively.
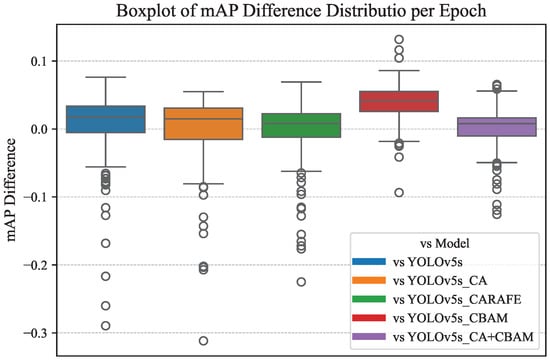
Figure 14.
Distribution of differences in mAP values compared to other models.
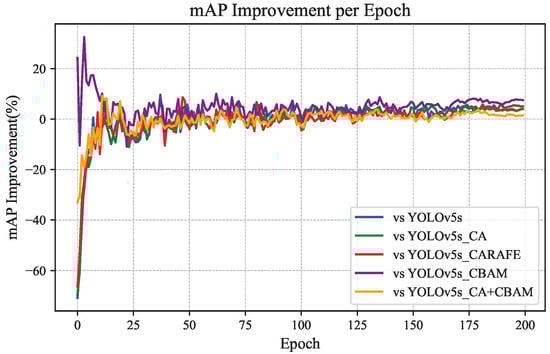
Figure 15.
Percentage improvement in mAP compared to other models.
From Figure 12, Figure 13, Figure 14 and Figure 15, the following observations can be made: (1) When using modules individually, such as enhancing the network’s representation capability of citrus leaf spots with the use of the CBAM module, the ablation experiment results in Table 4 show an increase in accuracy of 4.4% and mAP by 0.3%. However, when using the CA attention mechanism, the lack of spatial attention to highlight the area of the leaf spots resulted in a slight decrease in average precision. Using the CARAFE upsampling module enhanced the network’s receptive field, improving accuracy, recall, and mAP by 2.3%, 0.4%, and 1.6%, respectively.
Table 4.
Experimental results of CBACA module performs with YOLOv10s/11s.
The mAP improvements observed, such as the 2.3% increase with the CARAFE module, are significant when contextualized within the domain of object detection. Typically, enhancements in mAP of this magnitude indicate meaningful advancements in model performance, particularly in specialized tasks like citrus leaf disease detection. These improvements suggest that integrating modules like CARAFE effectively enhances the model’s receptive field and feature representation, leading to more accurate and reliable detection outcomes than the baseline YOLOv5s model.
When the CBAM module is used in conjunction with the CA module, they complementarily extract features in channel and spatial dimensions, leading to a 0.4% increase in mAP. Combining the CBAM, CA, and CARAFE modules achieves the optimization of feature propagation and representation, resulting in improvements in accuracy, recall, and mAP by 2.8%, 2.7%, and 2.2%, respectively. These enhancement methods have all contributed to the detection accuracy of the original model. The mAP performance curves of the six network models, as demonstrated in Figure 13, Figure 14 and Figure 15, confirm the effectiveness of integrating the position-guided CA attention mechanism, CBAM attention mechanism, and CARAFE upsampling method in the backbone and neck structures to optimize the model for the improved detection performance of citrus leaf spots.
The computational complexity of the CBACA-YOLO5 model has a slight increase of approximately 5% in computational cost compared to the baseline YOLOv5s. This increase is primarily due to the integration of advanced modules such as coordinate attention (CA), convolutional block attention module (CBAM), and content-aware reassembly of features (CARAFE). Despite this increase, the model maintains a practical inference time suitable for real-time applications with the highest mAP in the four enhancement methods and with only a marginal impact on power consumption, making it feasible for deployment in resource-constrained environments.
Through ablation experiments, it has been confirmed that the integration of the position-guided CA attention mechanism, CBAM attention mechanism, and CARAFE upsampling method in the backbone and neck structures is effective and necessary for optimizing the performance of the CBACA-YOLO5 model, leading to the improved detection performance of citrus leaf spots.
4.4.2. Comparison of CBACA Module Performs with YOLOv10s/11s
In order to compare the performance of YOLOv10s/11s integrated with the CBACA module, we modified these architectures accordingly to obtain CBACA-YOLOv10s and CBACA-YOLOv11s, respectively. The corresponding experimental results are presented in Table 4.
As indicated by the data in Table 4, CBACA-YOLO5 surpasses CBACA-YOLOv10s and CBACA-YOLOv11s across all key performance metrics. Specifically, its precision and recall reach 90.4% and 90.9%, respectively—both exceeding the 90% threshold and outperforming the other two models by more than two percentage points. Furthermore, its mean average precision (mAP) attains 92.1%, the highest among the three, suggesting superior robustness in multi-class object detection. In terms of computational efficiency, CBACA-YOLO5 achieves 16.3 GFLOPs, at least 24.5% lower than those of YOLOv10s/YOLOv11s, thereby significantly reducing hardware resource demands during inference. This lower computational burden enables the faster real-time inference (67.11 FPS) or parallel processing of additional detection tasks under identical hardware conditions. In addition, its parameter count (7.166) and weight size (14.3 MB) are the smallest among the three models, further minimizing the storage and transmission overhead during deployment. Overall, by combining high accuracy, reduced computational load, and a lightweight design, CBACA-YOLO5 offers a superior balance between the detection performance and deployment efficiency for industrial-scale applications.
4.5. Optimized Model Parameters
Data augmentation techniques were employed to optimize the detection performance of the model. Transformations such as rotation, flipping, and brightness adjustment were used to expand the dataset artificially. This approach enhances the model’s generalization ability under varying conditions, mitigates overfitting, and improves robustness. Consequently, experiments were conducted to configure the model from data augmentation, balancing the number of instances for each disease category in the expanded dataset and utilizing different image resolutions as model input. These experiments aim to identify the comparatively superior hyperparameter configurations for the model.
4.5.1. Data Augmentation
The experimental results obtained by the detection model CBACA-YOLO5 on datasets processed with varying levels of data augmentation, along with the corresponding training and validation loss metric trends, are presented in Table 5 and Figure 16, respectively.
Table 5.
Optimized data augmentation parameters and mAP (%) results.
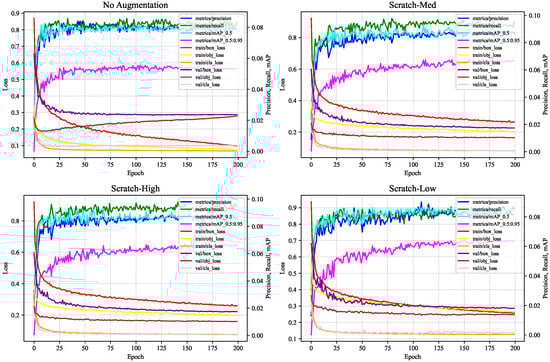
Figure 16.
Variation curves of data augmentation parameters based on relevant performance.
Based on the analysis of the table data and the curve charts, the following conclusions can be drawn: (1) The curve corresponding to the Scratch-Low configuration demonstrates rapid loss reduction alongside favorable precision and recall performance, indicating stable performance overall. (2) Although Scratch-Low involves a lower intensity of data augmentation, this moderate enhancement effectively prevents overfitting while providing sufficient diversity to enhance the model’s generalization capability. (3) Under the Scratch-Low parameter configuration, the model achieves the highest mAP value of 92.10%, signifying superior detection performance across different intersections over union (IoU) thresholds. Consequently, the Scratch-Low configuration achieves an optimal balance between the intensity and diversity of data augmentation, making it the preferred choice.
4.5.2. Imbalanced Class Adjustment
In the original dataset, there is a notable class imbalance, with 1240 images for Anthracnose and only 310 for Black Spots, potentially biasing the model. To mitigate this, we applied cropping, rotation, and stretching to augment the dataset, as shown in Table 6, and trained the CBACA-YOLO5 model.
Table 6.
Extended dataset post data augmentation.
The mAP varied slightly between 0.1 and 0.2, indicating minimal improvement. This may be due to the richness of the original data, curated by citrus experts, which covers most scenario variations and reduces the impacts of augmentation. It may also suggest a model performance bottleneck, which we aim to address in future work.
4.5.3. Optimized Input Image Sizes and Batch Sizes
The choice of input image size and batch size profoundly affects the model performance, including accuracy, speed, memory usage, and training dynamics. Balancing hyperparameters involves trade-offs between target accuracy, computational resources, and application needs. Proper adjustments can optimize the performance within hardware constraints and agricultural requirements. We conducted comparative experiments on various input sizes and batch sizes, with results detailed in Table 7 and Table 8.
Table 7.
Comparison of different input image sizes.
Table 8.
Comparison of different batch sizes.
Comprehensive analysis of experimental data in Table 7 and Table 8 indicates that an image size of 640 × 640 offers the optimal trade-off between FPS (67.11) and mAP (92.1%), maximizing model learning without causing significant computational inefficiencies. A batch size of four achieves the highest mAP (92.1%) while maintaining a reasonable FPS, effectively balancing computational load during training iterations. This suggests that the CBACA-YOLO5 model yields optimal performance with an input image size of 640 × 640 and a batch size of 4, making it well suited for application in agricultural smart terminal scenarios.
4.6. Comparison Experiment of Different Object Detection Models
Experimental Results Comparison
To confirm the superiority of the CBACA-YOLO5 model, we conducted experiments comparing it against several current and prominent algorithms, including the two-stage object detection algorithms faster-RCNN and RetinaNet, as well as the one-stage object detection algorithms SSD, YOLOv4, and YOLOv5s. Furthermore, we also included the latest versions, YOLOv10s, and YOLOv11s, in our comparisons to evaluate their effectiveness against CBACA-YOLO5.
To achieve a more comprehensive evaluation of model performance, we selected three new object detection models that represent different technological approaches for comparison. (1) EfficientDet achieves efficient feature fusion through its innovative compound scaling and bidirectional feature pyramid network (BiFPN), striking a balance between detection accuracy and computational efficiency. (2) Its lightweight variant, EfficientDet-Lite, retains the core advantages of the original architecture while significantly reducing the parameter count and computational overhead, making it particularly suitable for deployment on resource-constrained mobile and edge devices [42]. (3) RT-DETR is a real-time object detection model based on the Transformer framework. Through its innovative hybrid encoder–decoder architecture, it successfully delivers real-time inference while maintaining high detection accuracy [43].
The experimental results are summarized in Table 9.
Table 9.
Experimental results of different object detection models.
According to Table 9, the average precision (mAP) of the CBACA-YOLO5 model significantly outperforms other one-stage object detection models. Compared to RetinaNet, SSD, EfficientDet, EfficientDet-Lite, RT-DETR, YOLOv4, YOLOX, YOLOv5s, YOLOv7_tiny, YOLOv11s, and YOLOv10s, its mAP is higher by 0.08%, 5.90%, 8.4%, 4.9%, 35.25%, 2.3%, 7.97%, 10.69%, 1.9%, and 2.69%, respectively. Figure 17 presents a bar graph showing the improvement in CBACA-YOLO5 in terms of mAP compared to other detection models, along with a line graph showing the percentage of improvement.
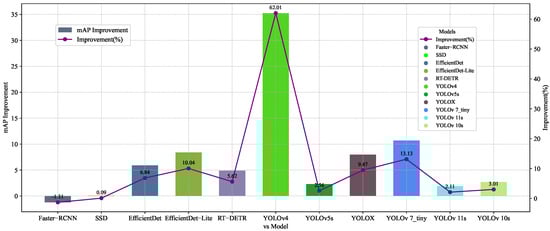
Figure 17.
CBACA-YOLO5 vs. other models in mAP.
As shown in Figure 17, CBACA-YOLO5 ranked second in the most important evaluation metric, mAP, with improvements of 5.99%, 0.09%, 62.01%, 2.56%, 9.47%, and 13.13% compared to SSD, YOLOv4, YOLOv5s, YOLOX, and YOLOv7_tiny, respectively, and a decrease of 1.31% compared to Faster-RCNN. In relation to the current versions of YOLO, specifically YOLOv10s and YOLOv11s, the proposed CBACA-YOLO5 model demonstrated significant improvements in the crucial metric of mean average precision (mAP), with enhancements of 1.9% and 2.69%, respectively. These correspond to percentage increases of 2.11% and 3.01%. This highlights that CBACA-YOLO5 outperforms the latest YOLO versions in terms of performance and accuracy in detecting citrus leaf diseases and pests.
For the application scenario of citrus leaf disease detection algorithms, detection models can be easily deployed to mobile devices on the Internet of Things and edge computing. Based on the application and deployment experience, the importance weight settings of the five indicators presented in Table 3 for deployment are mAP: 0.40; Computational_cost: 0.25; Parameters: 0.20; Model_size: 0.10; and FPS: 0.05. According to the characteristics of deployment on mobile devices, among the performance indicators, larger values are better for mAP and FPS, while smaller values are better for Computational_cost, parameters, and Model_size. Therefore, based on the importance of each performance indicator and its values, the radar charts of the five performance indicators for the participating predictive models are shown in Figure 18.
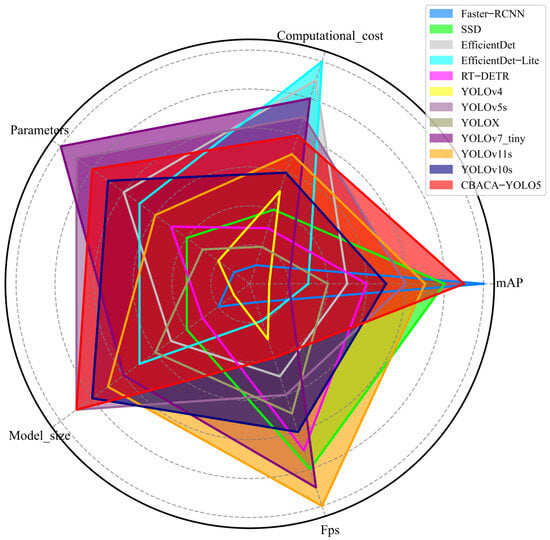
Figure 18.
The radar charts of scores on five performance indicators for each predictive model.
As shown in Figure 18, among the seven models, the faster R-CNN scored the lowest in computational cost and parameters and also performed comparatively poorly in model size. Although faster-RCNN demonstrated the highest mAP, its deployment on mobile devices or in environments with limited computational resources faces inference latency issues due to its large computational and parameter requirements.
In Figure 18, the CBACA-YOLO5 model excels in various performance metrics and achieves the highest overall score based on weighted metrics, indicating its significant advantage in comprehensive capability. This model ranks second in average precision (mAP) among all models, performing exceptionally well, just behind Faster-RCNN. Its computational complexity and parameter count are also competitive, allowing the model to maintain high performance while ensuring computational efficiency and parameter optimization. Furthermore, CBACA-YOLO5’s weight is lighter than that of other high-scoring models, enhancing its flexibility for various applications. Overall, CBACA-YOLO5 not only achieves a high recognition accuracy but also ensures a high frame rate and suitability for resource-constrained environments, making it an ideal choice for current object detection tasks.
In comparison, SSD has lower parameter and computational requirements than faster-RCNN, but its mAP is 1.3% lower than faster-RCNN, making it still challenging to deploy on mobile devices effortlessly. YOLOv4 has the highest number of parameters in one-stage object detection algorithms, with large computational and weight requirements, inadequate accuracy, and unsuitable for citrus leaf disease identification. Although YOLOX has improved accuracy, it still does not meet the requirements for real-time detection of citrus leaf diseases. YOLOv7_tiny, as a lightweight model, achieves decent accuracy with fewer parameters and computational requirements.
The mAP of CBACA-YOLO5 has increased to 92.10%, the highest among one-stage object detection algorithms, although the inference speed is slightly lower than the conventional YOLOv5s. The radar chart scores of CBACA-YOLO5 compared to other models in Figure 18 achieved a good balance in accuracy, computational cost, and model size. It can meet the real-time requirements on mobile devices, making it the most suitable and capable detection model for the real-time detection of citrus leaf diseases among all models.
The superior performance of CBACA-YOLO5, as depicted in Table 9, Figure 17 and Figure 18, can be attributed to its innovative architectural enhancements. The CA module enhances the model’s ability to capture spatial information, while CBAM improves feature refinement through channel and spatial attention mechanisms. CARAFE further boosts the model’s capability to handle fine-grained details, which is crucial for detecting small lesions on citrus leaves. These design elements collectively contribute to the model’s higher mean average precision (mAP) and balanced performance across other metrics, as shown in the radar chart (Figure 18).
4.7. Results Visualization Analysis
The CBACA-YOLO5 model’s design effectively balances precision, computational cost, and model size, making it the most suitable choice for real-time citrus leaf disease detection on mobile and embedded devices.
To intuitively compare the recognition performance of different object detection models and the method proposed in this paper for citrus leaf disease, partial prediction results are shown in Figure 19. It can be observed that, although the Faster-RCNN network model has the highest confidence level and can identify lesions on small targets, it also produces false detections, with multiple prediction boxes covering the same lesion, which affects accurate lesion localization and results in slower recognition speeds that do not meet the real-time detection requirements on mobile devices.
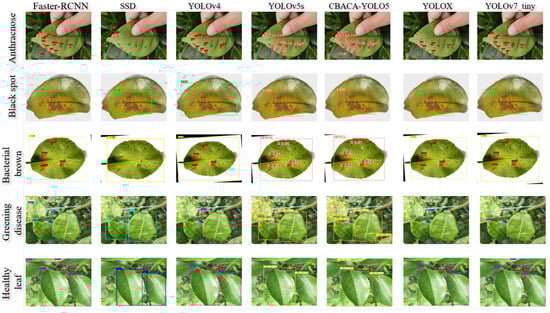
Figure 19.
Examples of citrus leaf disease and healthy leaf images.
The results of citrus leaf disease detected by CBACA-YOLO5, YOLOv10s, and YOLOv11s is shown in Figure 20.
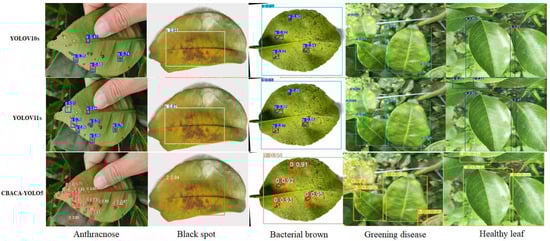
Figure 20.
Results of citrus leaf disease detected by CBACA-YOLO5, YOLOv10s and YOLOv11s.
The inference speed of the CBACA-YOLO5 model, though slightly lower than YOLOv5s, represents a deliberate design choice that prioritizes accuracy and feature detection capabilities. This trade-off is justified by the model’s architecture, which includes modules such as CA, CBAM, and CARAFE. These components enhance the model’s precision, particularly in recognizing small lesions that are crucial in citrus leaf disease detection, thereby improving mAP to 92.10%.
In comparison, while faster-RCNN achieves a higher mAP of 93.20%, it is constrained by significant computational demands and parameters, making it unsuitable for real-time applications on mobile devices. This scenario demonstrates the classic trade-off between the highest accuracy and practical deployment constraints.
Specific limitations impact the effectiveness of other models, such as SSD and YOLOv4. Despite SSD’s relatively low computational cost and parameter count, its mAP is 1.3% lower than faster-RCNN. It does not meet real-time deployment demands due to poor lesion detection on small targets. YOLOv4, on the other hand, has substantial computational and parameter requirements coupled with low accuracy, rendering it inefficient for citrus leaf disease identification.
Although YOLOX and YOLOv7_tiny offer better speed than YOLOv5s and CBACA-YOLO5, these fall short in feature extraction capabilities, particularly for nuanced features like lesion edges and color variations. This limits their overall detection performance.
In one-stage object detection algorithms, the CBACA-YOLO5 model demonstrates the highest confidence level. From the above analysis, we can conclude that CBACA-YOLO5 effectively balances accuracy and computational requirements, making it the optimal choice for deploying real-time citrus leaf disease detection models on embedded systems and mobile devices. This is evidenced by its performance metrics and improvements over existing models.
5. Conclusions
To address the challenges of background complexity, difficulties in identifying small target lesions, and high model complexity in citrus leaf disease detection in natural scenes, this paper proposes an improved citrus leaf disease detection model, CBACA-YOLO5. This model is based on YOLOv5s and incorporates a CA attention mechanism in the C3 module of the backbone network to enhance the extraction of crucial information. Additionally, the upsampling module in the neck layer is replaced with CARAFE to improve feature extraction efficiency and accelerate network convergence. Furthermore, three CBAM convolutional attention modules are added to the Neck network to strengthen the network’s focus on regions containing important information further, thus enhancing the detection accuracy and efficiency.
CBACA-YOLO5 demonstrates significant advancements in leaf disease detection by integrating CBAM, CA, and CARAFE modules. These architectural enhancements contribute novel improvements by elevating feature extraction and spatial attention mechanisms, which are critical for accurately identifying small and complex disease patterns on leaves. Integrating CBAM and CA refines the model’s capacity to concentrate on pertinent features through spatial and channel-wise attention. At the same time, CARAFE boosts feature upsampling, allowing for the more precise localization of disease-affected areas. This architecture effectively addresses previously neglected challenges, such as detecting subtle disease symptoms and differentiating overlapping disease patterns, and offers a robust solution for precision agriculture.
Empirical results indicate that CBACA-YOLO5 excels in small target detection compared to widely used object detection algorithms, such as faster R-CNN, SSD, YOLOv4, YOLOv5s, YOLOX, and YOLOv7_tiny. Achieving an average precision of 92.10%, which is a 2.3% improvement over YOLOv5s, the model meets real-time detection requirements despite a slight increase in model complexity, reducing the detection speed to 67.114 FPS. Importantly, this study considers practical application demands, balancing computational efficiency with accuracy, demonstrating a strong performance in citrus leaf disease detection in natural conditions, and highlighting its potential value in disease prevention and control.
For future work, in addition to collecting more data in complex environments to enhance dataset diversity and model generalization, we aim to explore advancements in model architecture and delve into more sophisticated attention mechanisms. Further research could focus on optimizing deployment strategies for mobile and IoT devices, ensuring efficient resource utilization, and maintaining high accuracy in diverse operational settings [44,45].
Author Contributions
Methodology, J.Z.; Software, J.C.; Validation, H.H. and T.Z.; Formal analysis, J.Z.; Resources, H.H.; Writing—original draft, J.Z.; Writing—review & editing, W.B. and T.Z.; Supervision, T.Z.; Project administration, T.Z.; Funding acquisition, T.Z. All authors have read and agreed to the published version of the manuscript.
Funding
The research was supported by the National Natural Science Foundation of China (No. 62462021), the Philosophy and Social Sciences Planning Project of Zhejiang Province (No. 25JCXK006YB), the Hainan Provincial Natural Science Foundation of China (No. 625RC716), the Guangdong Basic and Applied Basic Research Foundation (No. 2025A1515010197), the Hainan Province Higher Education Teaching Reform Project (No. HNJG2024ZD-16), the Special Fund for Guangdong Province University Key Field (No. 2023ZDZX3041), the Innovation Research Team Project of Zhaoqing University, in part by the Innovation Project of Guangdong Province University under Grant (No. 2024KQNCX023), and in part by the Innovation Project of Zhaoqing City under Grant (No. 241212154168613).
Data Availability Statement
The original contributions presented in this study are included in the article. Further inquiries can be directed to the corresponding author.
Conflicts of Interest
The authors declare no conflicts of interest.
References
- Zhang, X.; Zhang, S.; Liu, J.; Ran, N.; Zhang, X.; Ning, Q. Moderate scale and realization potential of new citrus-planting business entities in hilly and mountainous areas in China. J. Mt. Sci. 2023, 20, 2315–2343. [Google Scholar] [CrossRef]
- Tatineni, S.; Hein, G.L. Plant viruses of agricultural importance: Current and future perspectives of virus disease management strategies. Phytopathology 2023, 113, 117–141. [Google Scholar] [CrossRef]
- Shoaib, M.; Shah, B.; Ei-Sappagh, S.; Ali, A.; Ullah, A.; Alenezi, F.; Gechev, T.; Hussain, T.; Ali, F. An advanced deep learning models-based plant disease detection: A review of recent research. Front. Plant Sci. 2023, 14, 1158933. [Google Scholar]
- Rai, R.; Bansal, P. Accurate crop disease identification and classification in smart agriculture using a three-tier model and optimized fully conventional network. Multimed. Tools Appl. 2025, 84, 2539–2564. [Google Scholar] [CrossRef]
- Jha, S.; Kaechele, H.; Sieber, S. Factors influencing the adoption of agroforestry by smallholder farmer households in Tanzania: Case studies from Morogoro and Dodoma. Land Use Policy 2021, 103, 105308. [Google Scholar] [CrossRef]
- Liu, Y.; Gao, G.; Zhang, Z. Crop disease recognition based on modified light-weight CNN with attention mechanism. IEEE Access 2022, 10, 112066–112075. [Google Scholar] [CrossRef]
- Ajagbe, S.A.; Amuda, K.A.; Oladipupo, M.A.; AFE, O.F.; Okesola, K.I. Multi-classification of Alzheimer disease on magnetic resonance images (MRI) using deep convolutional neural network (DCNN) approaches. Int. J. Adv. Comput. Res. 2021, 11, 51. [Google Scholar] [CrossRef]
- Mirbabaie, M.; Stieglitz, S.; Frick, N.R. Artificial intelligence in disease diagnostics: A critical review and classification on the current state of research guiding future direction. Health Technol. 2021, 11, 693–731. [Google Scholar] [CrossRef]
- Xiao, F.; Wang, H.; Li, Y.; Cao, Y.; Lv, X.; Xu, G. Object detection and recognition techniques based on digital image processing and traditional machine learning for fruit and vegetable harvesting robots: An overview and review. Agronomy 2023, 13, 639. [Google Scholar] [CrossRef]
- Maity, M.; Banerjee, S.; Chaudhuri, S.S. Faster R-CNN and YOLO based vehicle detection: A survey. In Proceedings of the 2021 5th International Conference on Computing Methodologies and Communication (ICCMC), Erode, India, 8–10 April 2021; pp. 1442–1447. [Google Scholar]
- Cheng, X.; Yu, J. RetinaNet with difference channel attention and adaptively spatial feature fusion for steel surface defect detection. IEEE Trans. Instrum. Meas. 2021, 70, 2503911. [Google Scholar] [CrossRef]
- Ge, Z.; Liu, S.; Wang, F.; Li, Z.; Sun, J. YOLOX: Exceeding yolo series in 2021. arXiv 2021, arXiv:2107.08430. [Google Scholar]
- Yunlu, W.; Jiefang, W.; Peng, L.; Fengdi, L.; Chengkai, G.; Fenggang, S. Apple Disease Identification Using Improved Faster R-CNN. J. For. Eng. 2022, 7, 153–159. [Google Scholar]
- Qing, Y.; Jiale, G.; Jun, L.; Longjun, G.; Jian, T.; Baojun, Y.; Weigen, X. Automatic detection model for pest damage symptoms on rice canopy based on improved RetinaNet. Trans. Chin. Soc. Agric. Eng. 2020, 36, 182–188. [Google Scholar]
- Yu, C.; Xuemei, W.; Zhen, Z.; Jianwei, Y.; Fugui, Z.; Lihua, Y. Method for identifying tea diseases in natural environment using improved YOLOv5s. Trans. Chin. Soc. Agric. Eng. 2023, 39, 185–194. [Google Scholar]
- Zhang, X.; Xun, Y.; Chen, Y. Automated identification of citrus diseases in orchards using deep learning. Biosyst. Eng. 2022, 223, 249–258. [Google Scholar] [CrossRef]
- Bari, B.S.; Islam, M.N.; Rashid, M.; Hasan, M.J.; Razman, M.A.M.; Musa, R.M.; Ab Nasir, A.F.; Majeed, A.P.A. A real-time approach of diagnosing rice leaf disease using deep learning-based faster R-CNN framework. PeerJ Comput. Sci. 2021, 7, e432. [Google Scholar] [CrossRef]
- Gong, X.; Zhang, S. A high-precision detection method of apple leaf diseases using improved faster R-CNN. Agriculture 2023, 13, 240. [Google Scholar] [CrossRef]
- Bao, W.; Fan, T.; Hu, G.; Liang, D.; Li, H. Detection and identification of tea leaf diseases based on AX-RetinaNet. Sci. Rep. 2022, 12, 2183. [Google Scholar] [CrossRef]
- Sarkar, C.; Gupta, D.; Gupta, U.; Hazarika, B.B. Leaf disease detection using machine learning and deep learning: Review and challenges. Appl. Soft Comput. 2023, 145, 110534. [Google Scholar] [CrossRef]
- Xiao, Y.; Qin, H.; Kan, J.; Chen, K.; Dong, F.; Pan, X. Research on A Citrus Leaf Disease Detection Model Based on YOLOv5-CBF. In Proceedings of the 2023 2nd International Conference on Computing, Communication, Perception and Quantum Technology (CCPQT), Xiamen, China, 4–7 August 2023; pp. 12–18. [Google Scholar]
- Wang, G.; Xie, R.; Mo, L.; Ye, F.; Yi, X.; Wu, P. Multifactorial Tomato Leaf Disease Detection Based on Improved YOLOv5. Symmetry 2024, 16, 723. [Google Scholar] [CrossRef]
- Mariano, G.C.L.; Briones, D.M.; Villaverde, J.F. Detecting Calamansi Diseases through their Leaves Using Convolutional Neural Network. In Proceedings of the 2024 IEEE International Conference on Automatic Control and Intelligent Systems (I2CACIS), Shah Alam, Malaysia, 29 June 2024; pp. 128–133. [Google Scholar]
- Mahum, R.; Munir, H.; Mughal, Z.U.N.; Awais, M.; Sher Khan, F.; Saqlain, M.; Mahamad, S.; Tlili, I. A novel framework for potato leaf disease detection using an efficient deep learning model. Hum. Ecol. Risk Assess. Int. J. 2023, 29, 303–326. [Google Scholar] [CrossRef]
- Khanramaki, M.; Asli-Ardeh, E.A.; Kozegar, E. Citrus pests classification using an ensemble of deep learning models. Comput. Electron. Agric. 2021, 186, 106192. [Google Scholar] [CrossRef]
- Syed-Ab-Rahman, S.F.; Hesamian, M.H.; Prasad, M. Citrus disease detection and classification using end-to-end anchor-based deep learning model. Appl. Intell. 2022, 52, 927–938. [Google Scholar] [CrossRef]
- Zhu, X.; Lyu, S.; Wang, X.; Zhao, Q. TPH-YOLOv5: Improved YOLOv5 based on transformer prediction head for object detection on drone-captured scenarios. In Proceedings of the 2021 IEEE/CVF International Conference on Computer Vision Workshops (ICCVW), Montreal, BC, Canada, 11–17 October 2021; pp. 2778–2788. [Google Scholar]
- Trinh, T.H.; Nguyen, H.H.C. Implementation of YOLOv5 for Real-Time Maturity Detection and Identification of Pineapples. Trait. Signal 2023, 40, 1445. [Google Scholar] [CrossRef]
- Li, J.; Qiao, Y.; Liu, S.; Zhang, J.; Yang, Z.; Wang, M. An improved YOLOv5-based vegetable disease detection method. Comput. Electron. Agric. 2022, 202, 107345. [Google Scholar] [CrossRef]
- Wang, H.; Shang, S.; Wang, D.; He, X.; Feng, K.; Zhu, H. Plant disease detection and classification method based on the optimized lightweight YOLOv5 model. Agriculture 2022, 12, 931. [Google Scholar] [CrossRef]
- Yubin, L.; Binshu, S.; Lechun, Z.; Denan, Z. Identifying diseases and pests in ginger leaf under natural scenes using improved YOLOv5s. Trans. Chin. Soc. Agric. Eng. 2024, 40, 210–216. [Google Scholar]
- Liu, W.; Anguelov, D.; Erhan, D.; Szegedy, C.; Reed, S.; Fu, C.Y.; Berg, A.C. SSD: Single shot multibox detector. In Proceedings of the Computer Vision—ECCV 2016: 14th European Conference, Amsterdam, The Netherlands, 11–14 October 2016; Proceedings, Part I. Springer: Cham, Switzerland, 2016; pp. 21–37. [Google Scholar]
- Luo, Y.; Huang, Q.; Ling, J.; Lin, K.; Zhou, T. Local and global knowledge distillation with direction-enhanced contrastive learning for single-image deraining. Knowl.-Based Syst. 2023, 268, 110480. [Google Scholar] [CrossRef]
- Song, Y.; Zhang, A.; Zhou, J.; Luo, Y.; Lin, Z.; Zhou, T. Overlapping cytoplasms segmentation via constrained multi-shape evolution for cervical cancer screening. Artif. Intell. Med. 2024, 148, 102756. [Google Scholar] [CrossRef]
- Yin, D.; Zhang, B.; Yan, J.; Luo, Y.; Zhou, T.; Qin, J. CoWNet: A correlation weighted network for geological hazard detection. Knowl.-Based Syst. 2023, 275, 110684. [Google Scholar] [CrossRef]
- Ma, X.; Guo, J.; Sansom, A.; McGuire, M.; Kalaani, A.; Chen, Q.; Tang, S.; Yang, Q.; Fu, S. Spatial pyramid attention for deep convolutional neural networks. IEEE Trans. Multimed. 2021, 23, 3048–3058. [Google Scholar] [CrossRef]
- Hou, Q.; Zhou, D.; Feng, J. Coordinate attention for efficient mobile network design. In Proceedings of the 2021 IEEE/CVF Conference on Computer Vision and Pattern Recognition (CVPR), Nashville, TN, USA, 20–25 June 2021; pp. 13713–13722. [Google Scholar]
- Woo, S.; Park, J.; Lee, J.Y.; Kweon, I.S. CBAM: Convolutional block attention module. In Proceedings of the European Conference on Computer Vision (ECCV), Munich, Germany, 8–14 September 2018; pp. 3–19. [Google Scholar]
- Wang, J.; Chen, K.; Xu, R.; Liu, Z.; Loy, C.C.; Lin, D. CARAFE: Content-aware reassembly of features. In Proceedings of the 2019 IEEE/CVF International Conference on Computer Vision (ICCV), Seoul, Republic of Korea, 27 October–2 November 2019; pp. 3007–3016. [Google Scholar]
- Shi, W.; Caballero, J.; Huszár, F.; Totz, J.; Aitken, A.P.; Bishop, R.; Rueckert, D.; Wang, Z. Real-time single image and video super-resolution using an efficient sub-pixel convolutional neural network. In Proceedings of the 2016 IEEE Conference on Computer Vision and Pattern Recognition (CVPR), Las Vegas, NV, USA, 27–30 June 2016; pp. 1874–1883. [Google Scholar]
- Dananjayan, S.; Tang, Y.; Zhuang, J.; Hou, C.; Luo, S. Assessment of state-of-the-art deep learning based citrus disease detection techniques using annotated optical leaf images. Comput. Electron. Agric. 2022, 193, 106658. [Google Scholar] [CrossRef]
- Tan, M.; Pang, R.; Le, Q.V. EfficientDet: Scalable and efficient object detection. In Proceedings of the 2020 IEEE/CVF Conference on Computer Vision and Pattern Recognition (CVPR), Seattle, WA, USA, 13–19 June 2020; pp. 10781–10790. [Google Scholar]
- Zhao, Y.; Lv, W.; Xu, S.; Wei, J.; Wang, G.; Dang, Q.; Liu, Y.; Chen, J. Detrs beat YOLOs on real-time object detection. In Proceedings of the 2024 IEEE/CVF Conference on Computer Vision and Pattern Recognition (CVPR), Seattle, WA, USA, 16–22 June 2024; pp. 16965–16974. [Google Scholar]
- Zhu, J.; Bai, W.; Zhao, J.; Zuo, L.; Zhou, T.; Li, K. Variational mode decomposition and sample entropy optimization based transformer framework for cloud resource load prediction. Knowl.-Based Syst. 2023, 280, 111042. [Google Scholar] [CrossRef]
- Lin, Z.; Wang, D.; Cao, C.; Xie, H.; Zhou, T.; Cao, C. GSA-KAN: A Hybrid Model for Short-Term Traffic Forecasting. Mathematics 2025, 13, 1158. [Google Scholar] [CrossRef]
Disclaimer/Publisher’s Note: The statements, opinions and data contained in all publications are solely those of the individual author(s) and contributor(s) and not of MDPI and/or the editor(s). MDPI and/or the editor(s) disclaim responsibility for any injury to people or property resulting from any ideas, methods, instructions or products referred to in the content. |
© 2025 by the authors. Licensee MDPI, Basel, Switzerland. This article is an open access article distributed under the terms and conditions of the Creative Commons Attribution (CC BY) license (https://creativecommons.org/licenses/by/4.0/).