Article

Multi-Scale Feature Fusion Based on Difference Enhancement for Remote Sensing Image Change Detection

1
School of Electronic Information, Guilin University of Electronic Technology, Guilin 541004, China
2
Department of Architecture and Civil Engineering City Unive, Guilin University of Electronic Technologyrsity of Hong Kong, Hong Kong 999077, China
3
School of Electronic Information, Guilin University of Electronic Technology, Beihai 536000, China
4
School of Computer Engineering, Guilin University of Electronic Technology, Beihai 536000, China
5
College of Information Science and Technology, Zhongkai University of Agriculture and Engineering, Guangzhou 510225, China
*
Authors to whom correspondence should be addressed.
Symmetry 2025, 17(4), 590; https://doi.org/10.3390/sym17040590
Submission received: 3 January 2025 / Revised: 25 March 2025 / Accepted: 10 April 2025 / Published: 12 April 2025
(This article belongs to the Section Computer)

Abstract

:
Remote sensing image change detection is a core task of remote sensing image analysis; its purpose is to identify and quantify land cover changes in different periods. However, when the existing methods deal with complex features and subtle changes in buildings, vegetation, water bodies, roads, and other ground objects, there are often problems of false detection and missing detection, which affect the detection accuracy. To improve the accuracy of change detection, a multi-scale feature fusion network based on difference enhancement (FEDNet) is proposed. The FEDNet consists of a difference enhancement module (DEM) and a multi-scale feature fusion module (MFM). By summing the variation features of two-phase remote sensing images, the DEM enhances pixel-level differences, captures subtle changes, and aggregates features. The MFM fully integrates the multi-stage deep semantic information, which enables better extraction of changing features in complex scenes. Experiments on the LEVIR-CD, CLCD, WHU, NJDS, and GBCNR datasets show that the FEDNet significantly improves the detection efficiency of changes in buildings, cities, and vegetation. In terms of F1 value, IoU (Intersection over Union), precision, and recall rate, the FEDNet is superior to existing methods, which verifies its excellent performance.

1. Introduction

Remote sensing image change detection is an important research topic in remote sensing technology and is widely used in the fields of environmental monitoring, urban planning, disaster assessment, and agricultural management. Its main goal is to automatically identify and quantify land cover changes by comparing remote sensing images acquired at different times. With the continuous progress of remote sensing technology and imaging equipment, it is becoming more and more convenient to acquire high-resolution multi-temporal remote sensing images. However, the complex surface environment, diverse types of changes, and subtle change characteristics make change detection face many challenges.
In recent years, with the continuous development of deep learning, deep learning technology has been gradually applied to object detection [1,2], change detection [3], and other tasks. Studies in the field of change detection have made various achievements. The Fully Convolutional Early Fusion (FC-EF) network proposed by Daudt et al. [4] (subsequent iterations are based on the same principle) adopts the early fusion strategy, and the dual-temporal images are directly stitched in the input layer. Its overall structure is simple, and its computational efficiency is high. However, its ability to detect complex changes is limited, and it cannot fully extract and utilize deep features. The DTCDSCN proposed by Liu et al. [5] uses densely connected Siamese networks, which can enhance feature transfer and multiplexing to capture richer change information. However, the high complexity of the network leads to its long training time and high demand for computing resources. The SNUNet proposed by Fang et al. [6] adopts a symmetrical nested U-Net structure, and the nested structure can capture multi-scale features and improve the detection accuracy. However, this symmetrical nested structure makes the network structure complex, with large parameters and a long training time. The MFPNet proposed by Xu et al. [7] uses a multi-feature pyramid structure in the architecture and combines multi-scale features for change detection. The multi-scale feature extraction can adapt to change regions of different sizes, and the pyramid structure can enhance the detail in the expression of features. However, it has a high computational complexity and long training time, which is sensitive to the feature fusion strategy and parameter settings. The BiT network proposed by Chen et al. [8] uses large-scale training to continue transfer learning and enhance the change detection ability. This allows the model to obtain rich features and improves the performance in small sample scenarios. However, this makes the model bulky, requiring a large amount of training data, and the training is complex. The ChangeFormer proposed by Bandara et al. [9] adopts the Transformer structure to deal with the remote sensing image change detection task. The Transformer architecture captures long-distance dependencies and better captures large regions of change. However, it has high computational resource requirements and a long training time. Recently, the MSCANet proposed by Liu et al. [10] effectively improves the accuracy and robustness of change detection in high-resolution remote sensing images through multi-scale context aggregation and feature fusion. However, its high computational resource requirements, model complexity, and dependence on high-quality data also bring corresponding challenges. Later, the AMTNet network proposed by Liu et al. [11] introduces an attention mechanism and Transformer structure. It significantly improves the accuracy and robustness of remote sensing image change detection. However, its high demand for computing resources, long training time, and complex parameter tuning process also bring certain challenges. The DATNet proposed by Zhang et al. [12] combines a Transformer with a dual-attention mechanism and introduces a difference enhancement module to greatly improve the detection effect of different buildings, roads, and vegetation changes. However, its difference enhancement module branch is not fully combined with the Transformer module branch.
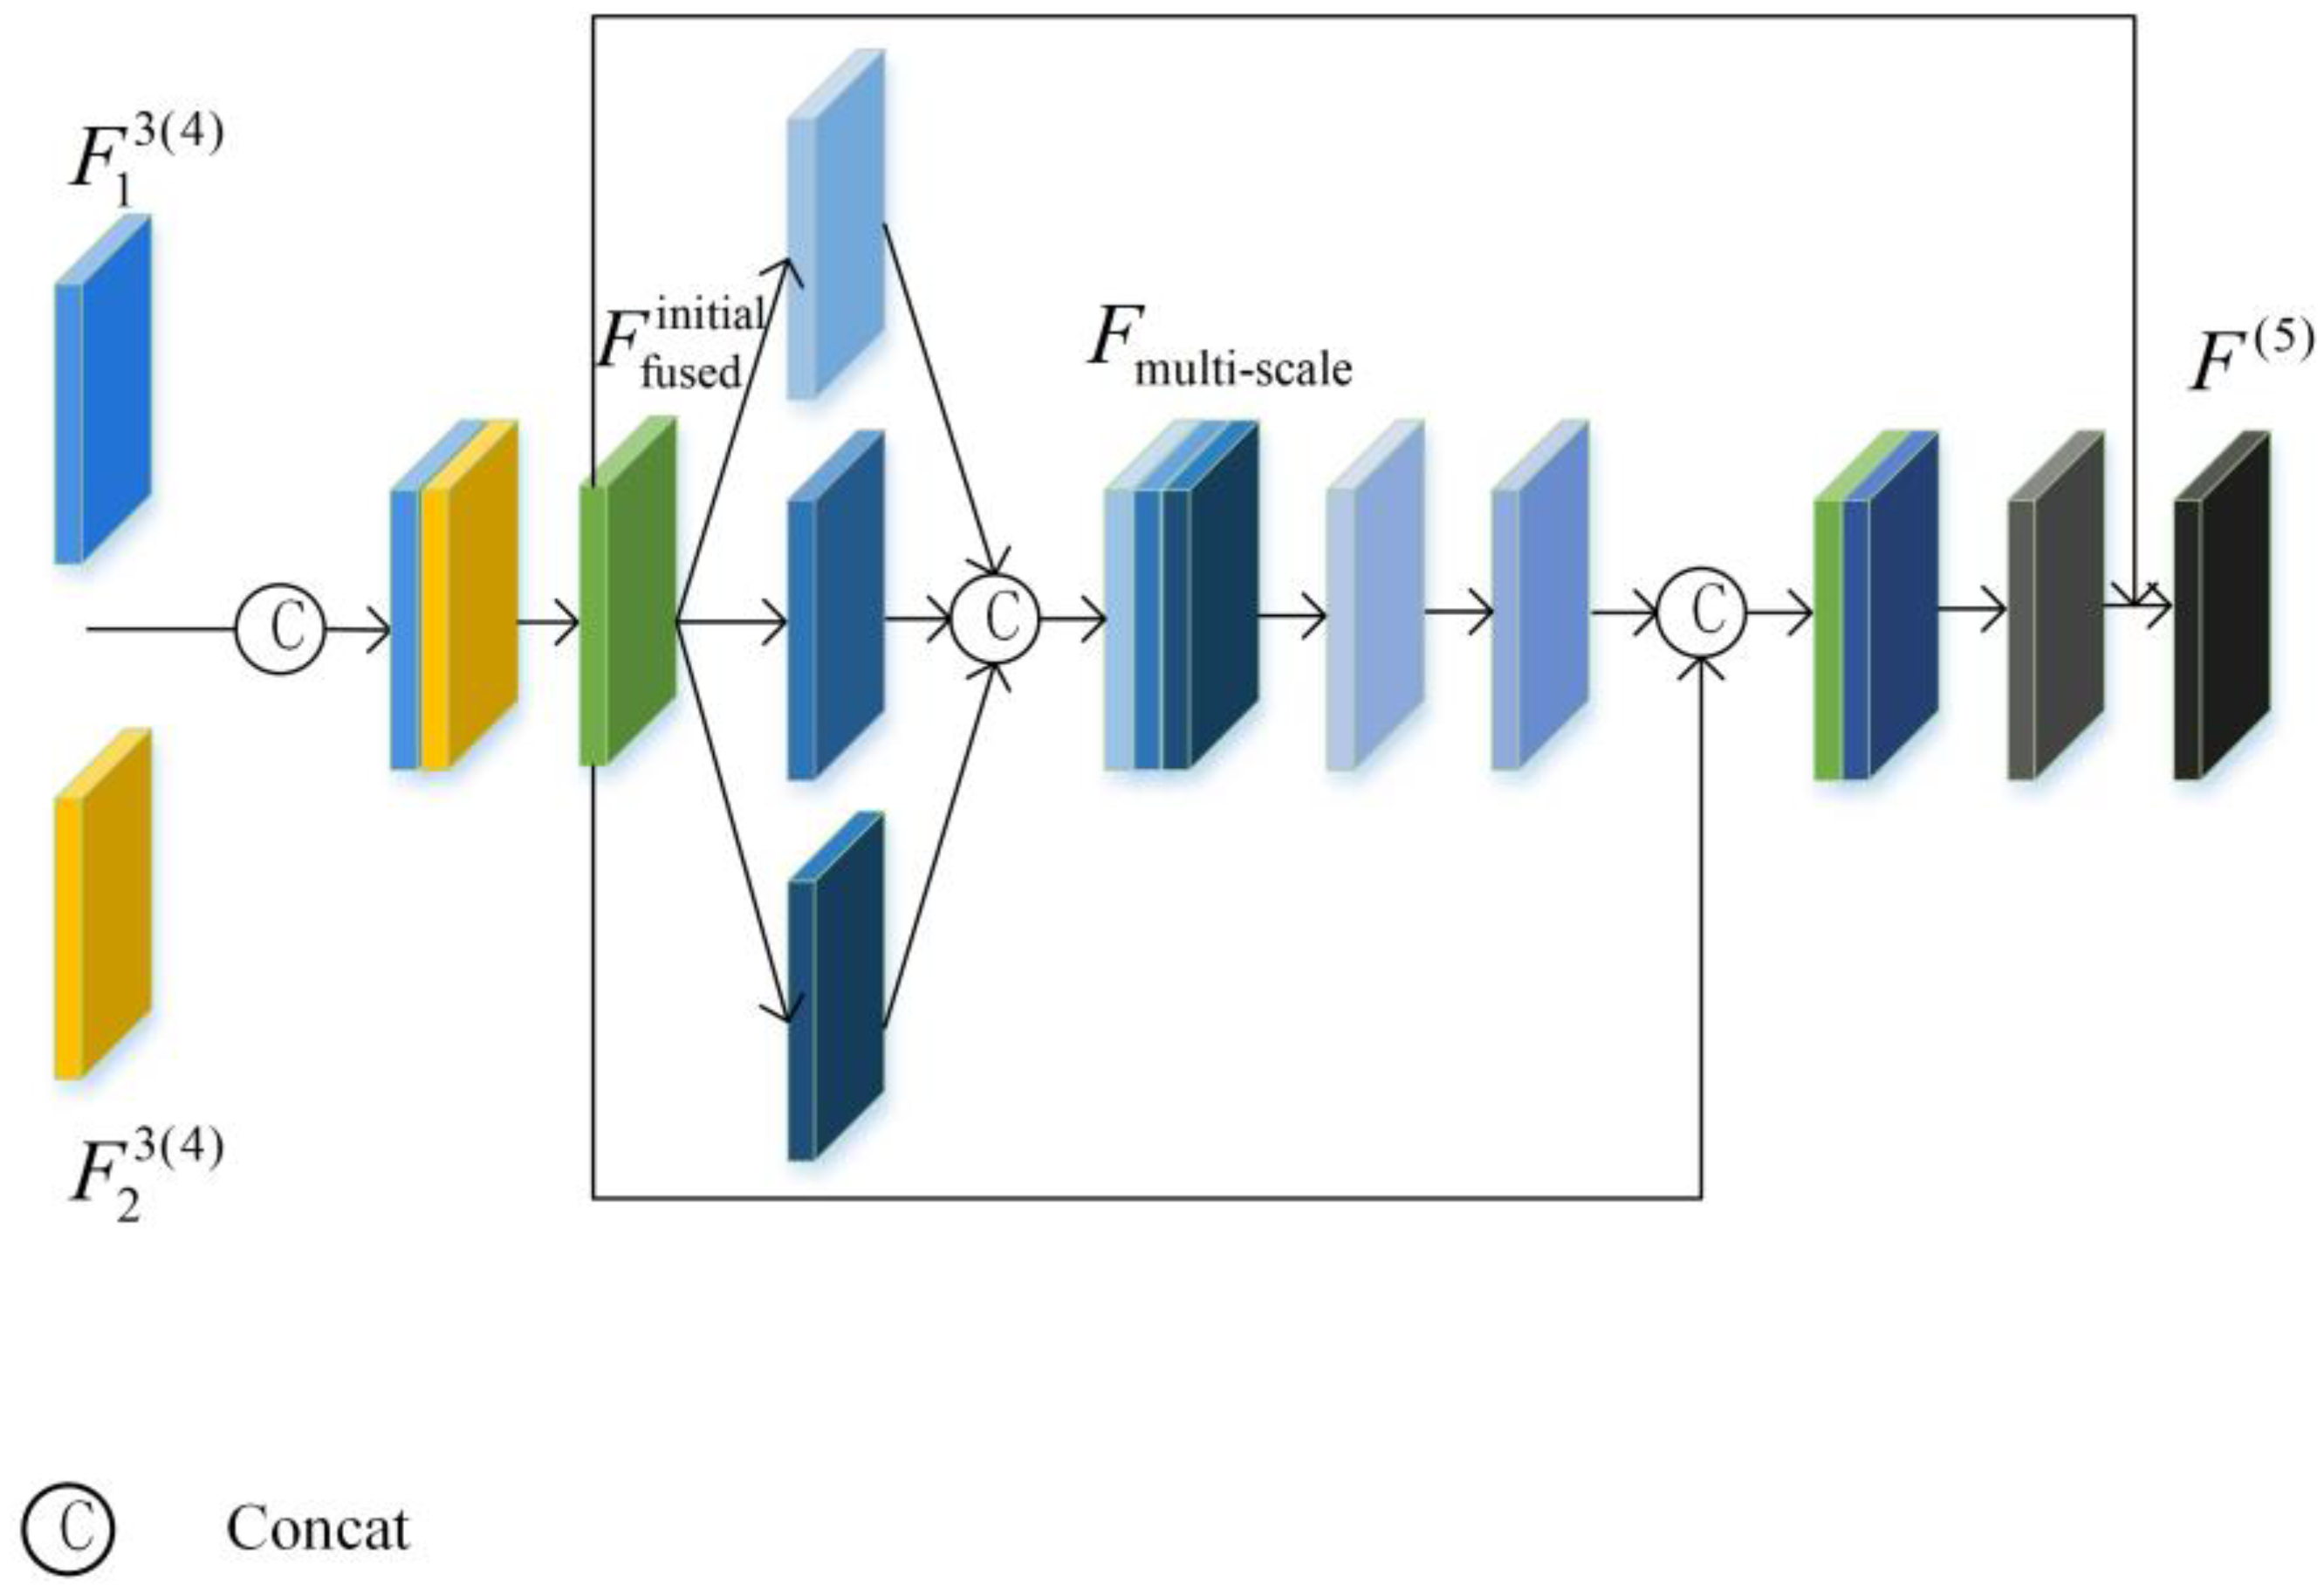
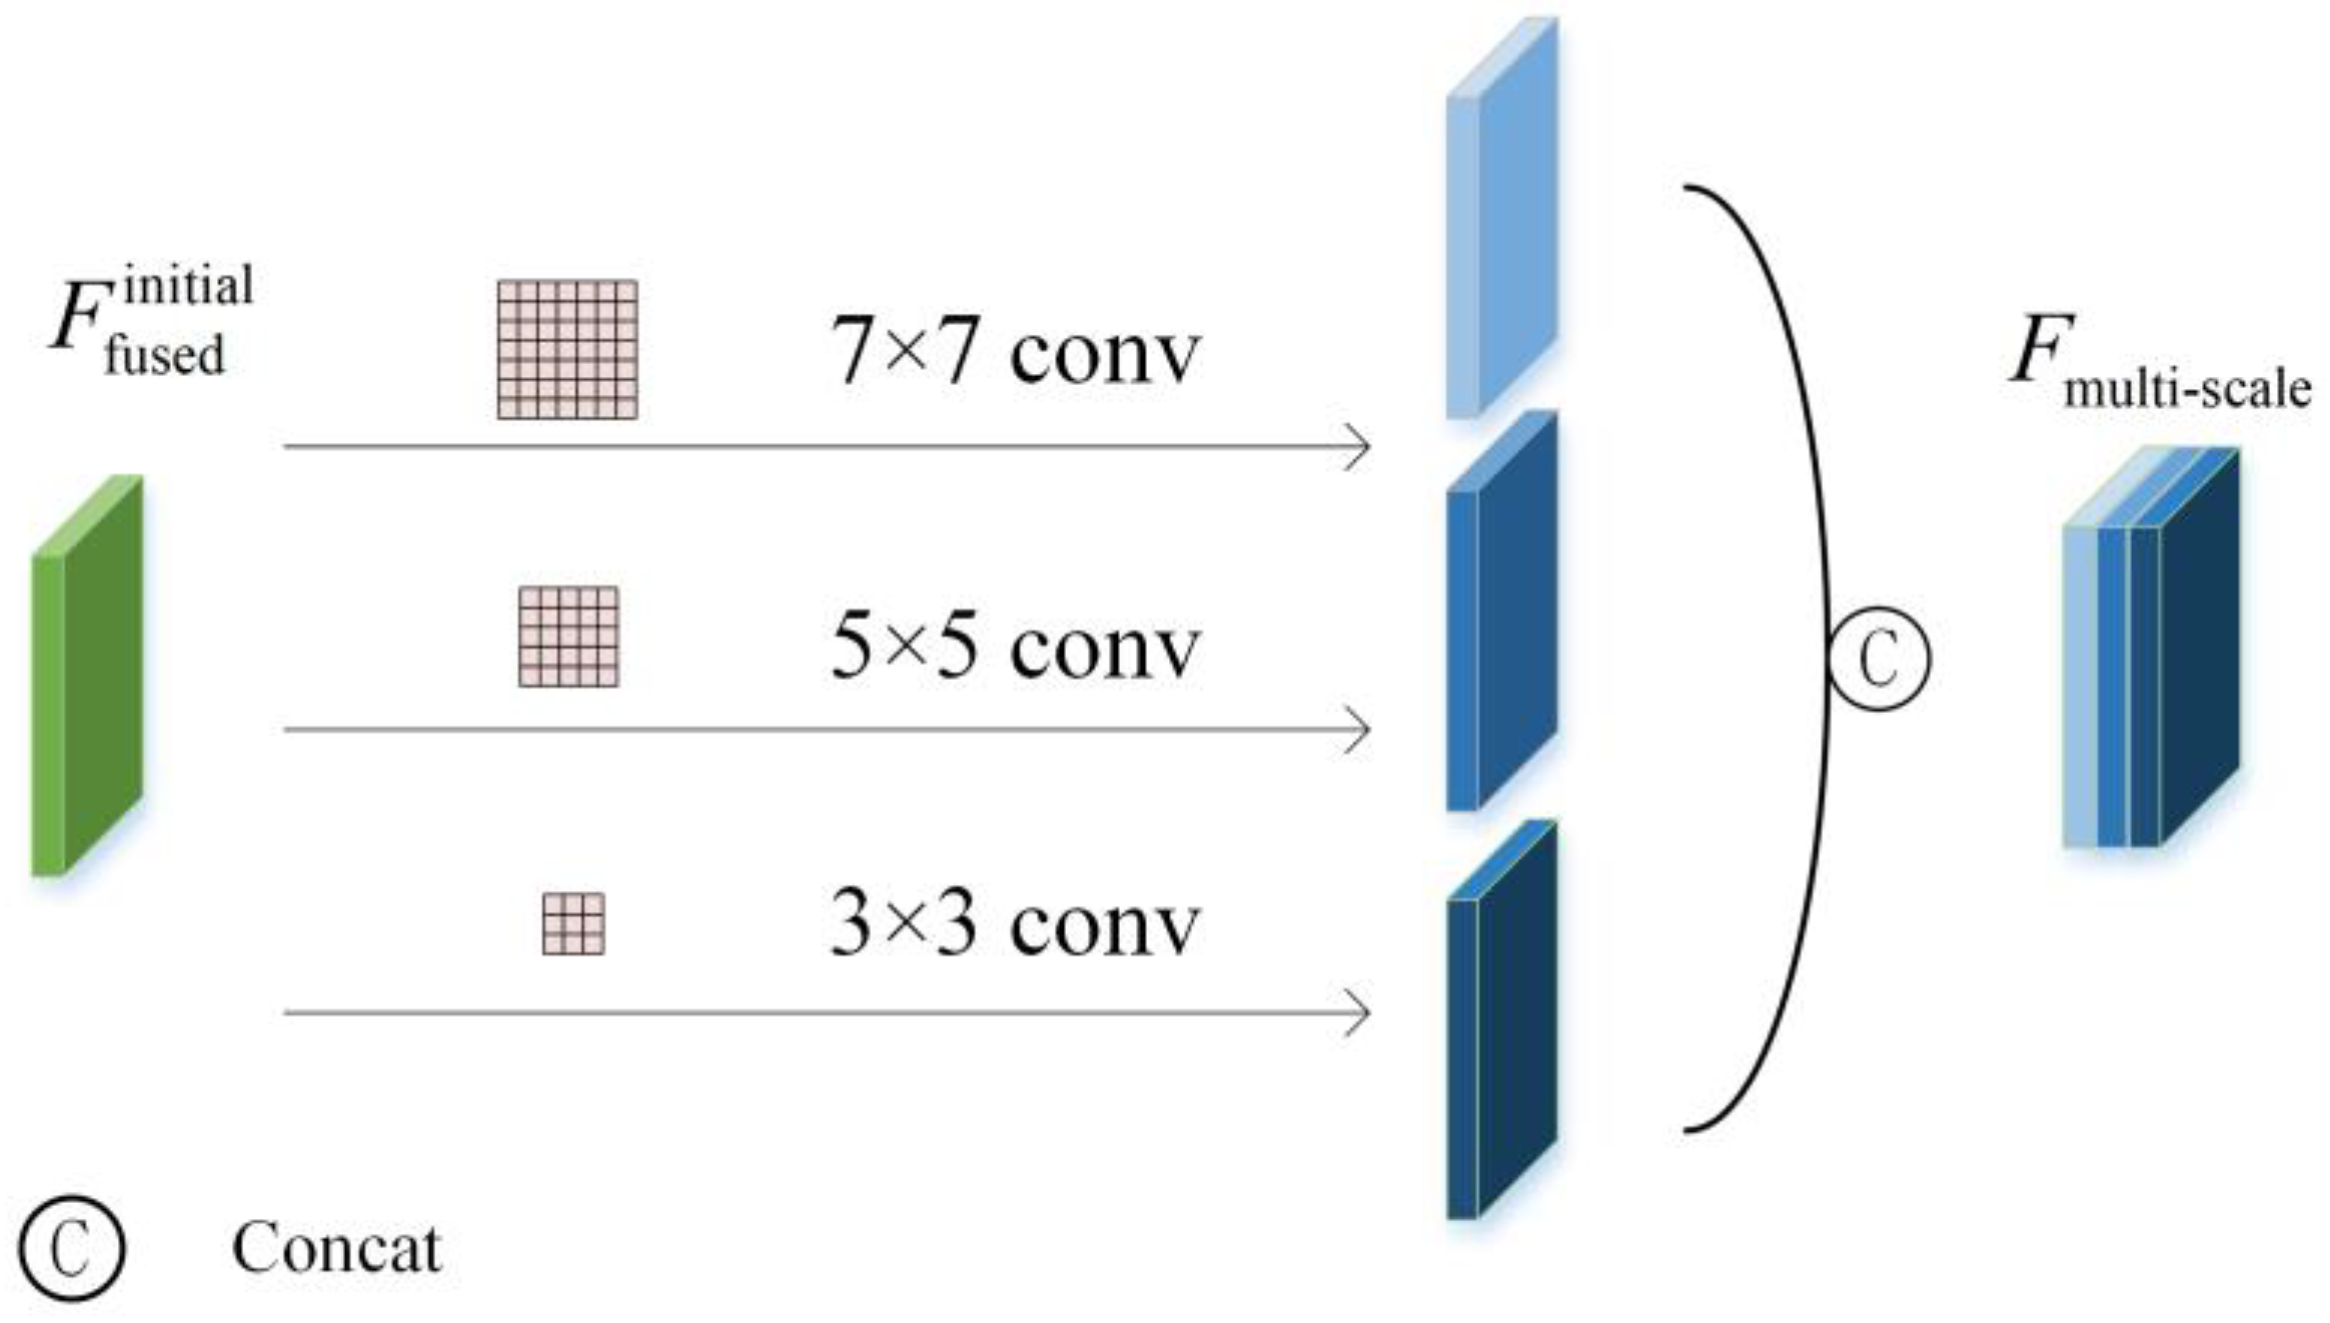
To address the aforementioned issues, this paper proposes a multi-scale feature fusion network based on difference enhancement (FEDNet) for remote sensing image change detection. The FEDNet incorporates an efficient ResNet-50 [13] backbone in the feature extraction stage of the Siamese network, improving the detection accuracy without increasing the parameter complexity. By combining feature exchange with a channel attention module, the FEDNet enhances contextual representation and bridges domain gaps between bi-temporal images. Finally, a classifier analyzes the fused feature maps to accurately locate and quantify change regions. The experimental results demonstrate that the FEDNet achieves outstanding performance on various remote sensing datasets, particularly in detecting complex environments and subtle changes. The main contributions of this paper can be summarized as follows:
  • The difference enhancement module (DEM) is designed for the remote sensing image to enable the change detection network to focus more on analyzing the image details, thereby improving the sensitivity to changes in the area and enhancing the overall reliability of the detection results.
  • The multi-scale feature fusion module (MFM) is designed to enhance the performance and applicability of the change detection algorithm, enabling more effective identification and extraction of change information in remote sensing images.
This research presents a multi-scale feature fusion method based on difference enhancement for remote sensing image change detection. The approach achieves high-precision change region identification by fully leveraging multi-level features. To further enhance the system’s performance, we will explore physics-based deep learning solutions. Yan et al. [14] demonstrated the powerful potential of integrating physical information with neural networks, successfully applying this approach in pantograph–catenary system modeling. The algorithm unrolling technique proposed by Monga et al. [15] provides us with a new research direction, systematically connecting iterative signal processing algorithms with neural networks while improving the model’s interpretability and data efficiency. The DIVA network developed by Dutta et al. [16] further proves the excellence of quantum physics-based unfolded architectures in processing non-local image structures, with its adaptive patch-level adjustment mechanism showing outstanding performance across various image restoration tasks. In future work, we plan to integrate algorithm unrolling techniques with our difference enhancement framework to develop change detection systems with better physical interpretability and computational efficiency, further improving the model’s generalization ability based on limited training data and complex scenarios, while exploring semi-supervised learning strategies to reduce the dependence on labeled data.

2. Methodology

2.1. Proposed Network

The overall framework of the proposed network (FEDNet) is illustrated in Figure 1. The FEDNet leverages a convolutional neural network (CNN) [17] with ResNet-50 as its backbone for feature extraction, where the weight parameters of the backbone network are shared. The feature exchange module incorporates channel exchange (CE) and spatial exchange (SE) [18], which bridge the domain gap between images from different time periods by exchanging features between the two branches of the Siamese network. Subsequently, the spatial attention module (SAM) [19] is employed to emphasize regions of change between the two temporal images, while suppressing irrelevant features. Additionally, a Transformer [20,21,22,23] is incorporated to effectively capture long-range dependencies and contextual relationships. The FEDNet also integrates a channel attention module (CAM) [11], which dynamically adjusts the weights of different channels to highlight critical features while suppressing less important ones, thereby improving the representational capacity of the features. Notably, the FEDNet introduces a multi-scale feature fusion module (MFM) to merge the advantages of bi-temporal feature maps, compensate for the lack of spatial distribution information, and enhance the representation of textures and features. Moreover, a difference enhancement module (DEM) is designed to amplify the discrepancies between the two temporal phases, emphasizing subtle differences in the images. This design enables the model to perform more effectively when processing detail-rich images.
Specifically, X1 and X2 are denoted as remote sensing images that are taken from the same region at different times. The specific flow of the proposed FEDNet is as follows:
Firstly, X i ( i { 1 , 2 } ) 3 × H × W is input into the CNN backbone network, and the backbone network outputs three feature maps of different scales F i 1 ( 1 ) , F i 2 ( 1 ) , and F i 3 ( 1 ) . Next, these feature maps of the same dimension of the two branches are partially replaced by pixels, where F i 3 ( 1 ) is the feature map that enters SE module, and F i 1 ( 1 ) and F i 2 ( 1 ) enter the CE module. After that, the feature maps that passed the exchange module are input into the SAM, and the feature maps of F i 1 ( 2 ) , F i 2 ( 2 ) , and F i 3 ( 2 ) at different scales are output. Then, in one branch, the two feature maps of F i 3 ( 3 ) are input into the transformer modules, MFM and CAM, to obtain the feature map F ( 5 ) . In the other branch, the two feature maps of F i 3 ( 3 ) are first fed into the difference enhancement module, and then, F ( 5 ) is input to the difference module to output the feature map of F 1 . Finally, it is fed into the CNN classifier to obtain the final change detection map.
The main modules of the proposed FEDNet are elaborated upon in the subsequent sections.

2.2. Multi-Scale Feature Fusion Module (MFM)

To address the issue of error detection caused by the quality problems of single temporal images and to enhance the model’s ability to perceive change areas, the proposed FEDNet incorporates a multi-scale feature fusion module (MFM). The MFM ensures that the single temporal feature map, after passing through the Transformer module, is enriched with multi-scale information. The feature map that is fused by the MFM contains higher-dimensional information, enabling the model to leverage a richer feature space during change detection. This facilitates more accurate identification of changes. The architecture of the MFM is illustrated in Figure 2.
As shown in Figure 2, the two input feature graphs F 1 3 ( 4 ) C × H × W and F 2 3 ( 4 ) C × H × W are joined together along the channel dimension to obtain a feature graph with a size of 2 C × H × W . Then, a 1 × 1 convolution operation compresses the number of channels to C . The specific formula is as follows:
F fused   initial   = Conv 1 × 1 F 1 3 ( 4 ) , F 2 3 ( 4 )
Here, F 1 3 ( 4 ) , F 2 3 ( 4 ) C × H × W represents the channel splicing operation, and Conv 1 × 1 a is a 1 × 1 convolution operation for channel compression.
Next, as shown in Figure 3, for the initial fusion feature F fused   initial   C × H × W , multi-scale features are extracted by multiple convolution operations with different kernel sizes (3 × 3, 5 × 5, 7 × 7) and concatenated. The formula is as follows:
F multi - scale   = Conv 3 × 3 F fused   initial   , Conv 5 × 5 F fused   initial   , Conv 7 × 7 F fused   initial  
Among them, Conv k × k represents the convolution operation with the convolution kernel size of k × k , [ ] represents the channel splicing operation, and the F multi - scale   ( 3 C ) × H × W is obtained.
Finally, the deep semantic information is extracted from the multi-scale feature F multi - scale   by a deep convolution operation, and the residual connection is performed with the preliminary fusion feature F fused   initial   to obtain the final output F output   . The specific formula is as follows:
F ( 5 ) = F fused   initial   + Conv 1 × 1 ( [ F fused   initial   , Conv 3 × 3 ( Re LU ( Conv 3 × 3 ( F multi - scale   ) ) ) ] )
Here, Conv 3 × 3 ( Re LU ( Conv 3 × 3 ( ) ) represents the 3 × 3 stacked convolution and activation function, and [ ] represents the concatenation in the channel dimension. Conv 1 × 1 maps the number of channels of the concatenation result back to the number of channels C of the input.

2.3. Difference Enhancement Module (DEM)

Remote sensing images often contain a large amount of information and a complex background, which may contain various noises, which will interfere with the results of change detection. And some changes are so subtle that they are hard to detect. Therefore, this paper designs a difference enhancement module (DEM), which has the ability to filter out the noise, enhance the signal in the change area, and make the change more obvious, so as to be captured by the detection algorithm. The architecture of the DEM is shown in Figure 4.
As shown in Figure 4, firstly, the pixel values of the two input feature maps F 1 3 ( 3 ) C × H × W and F 2 3 ( 3 ) C × H × W are subtracted and added, and the absolute values are taken to output F diff and F sum . The specific formula is as follows:
F diff = F 1 3 ( 3 ) F 2 3 ( 3 )
F sum = F 1 3 ( 3 ) + F 2 3 ( 3 )
Here, F diff   and F sum   are concatenated along the channel to generate preliminary fusion features. The specific formula is as follows:
F concat   = [ F diff   , F sum   ]
where [ F diff   , F sum   ] C × H × W represents the channel splicing operation.
Subsequently, F concat   is processed by 3 × 3 convolution, batch normalization (BN), and the ReLU activation function, and the number of channels is compressed from 64 to 32:
F conv 1   = Re LU ( BN ( Conv 3 × 3 ( F concat   ) ) )
where Conv 3 × 3 represents the convolution operation with a 3 × 3 convolution kernel, and BN represents the batch normalization operation.
In order to retain more original feature information, F res   is obtained by fusing the preliminary fusion feature map Conv 3 × 3 ( F concat   ) and feature map F conv 1   through a residual connection. After that, the pixels of F res   and the output image F ( 5 ) of MFM are added and subtracted to further capture the deep change and similarity information. The specific formula is as follows:
F diff 2 = F res F ( 5 )
F sum 2 = F res + F ( 5 )
Here, F diff 2 and F sum 2 are concatenated along the channel to generate preliminary fusion features, and the specific formula is as follows:
F final _ concat = [ F diff 2 , F sum 2 ]
where [ F diff 2 , F sum 2 ] C × H × W represents the channel splicing operation.
Finally, the deep fusion features are again processed by 3 × 3 convolution, batch normalization, and ReLU activation operations to generate the final output feature F 1 , and the specific formula is as follows:
F 1 = Re LU ( BN ( Conv 3 × 3 ( F final _ concat ) ) )
Among them, the output features F 1 are 32 × 128 × 128.

3. Results

3.1. Datasets and Metrics

We evaluate the performance of the proposed FEDNet on four popular change detection datasets: CLCD [24], WHU [25], LEVIR-CD [26], and NJDS [27], as well as the self-constructed GBCNR.
CLCD: This dataset is a public farmland dataset containing 2400 pairs of farmland change samples with high scores and a size of 256 × 256 pixels. These bi-temporal images were taken in 2017 and 2019 in Guangdong Province, China. The spatial resolution of these images ranges from 0.5 m to 2 m. Each sample group has two images and a binary label of cropland change. All samples are divided into training, validation, and test sets in a 6:2:2 ratio. Therefore, the sizes of the training, validation, and test sets are 1440, 480, and 480, respectively.
WHU: This is a public dataset for change detection, containing a pair of high-resolution bi-temporal aerial images with a resolution of 0.2 m and dimensions of 32,507 × 15,354 pixels. It covers areas that have experienced earthquakes and reconstructions over the years, mainly building renovations. We cropped the images into non-overlapping patches with a resolution of 256 × 256 pixels. The sizes of the training, validation, and test sets are 5947, 744, and 744, respectively.
LEVIR-CD: This dataset is a public building CD dataset captured from Google Earth. It consists of bi-temporal pairs of 637 h with a size of 1024 × 1024 pixels. These image pairs have a spatial resolution of 0.5 m and span from 5 to 14 years. The dataset includes complex variations of villa homes, small garages, high-rise apartments, and large warehouses. All bi-temporal image pairs are annotated using binary labels. The images are cropped into non-overlapping blocks with a resolution of 256 × 256 pixels. These patch pairs are randomly divided into training/validation/test sets of sizes of 7120/1024/2048.
NJDS: This dataset addresses the problem of building height displacement change detection. It contains bi-temporal images of Nanjing city in 2014 and 2018, which are obtained from Google Earth. The images include different types of low-rise, mid-rise, and high-rise buildings. We cropped the images into non-overlapping blocks of 256 × 256 pixels and randomly divided them into a training set (540 pairs), validation set (152 pairs), and test set (1827 pairs). The training sets and validation sets were expanded by rotations of 90°, 180°, and 270°, which finally yielded 2160 training pairs and 608 validation pairs.
GBCNR: This dataset was constructed by us, using a DJI Mavic series UAV (Shenzhen DJI Innovation Technology Co., LTD., Shenzhen, China) to take images at an altitude of up to 500 m in the Guangxi Binhai National Wetland Reserve, Guangxi Zhuang Autonomous Region, China, and the dimensions of each image are 5280 × 3956 pixels. Under the guidance of environmental ecological experts, we used the LabelMe tool to accurately label the wetlands. In order to fit the input requirements of the deep learning model, the images of the selected region were cropped, resized to 256 × 256 pixels, and randomly divided into a training set (containing 1748 image pairs), validation set (containing 499 image pairs), and test set (containing 249 image pairs).
Some samples of the four datasets are shown in Figure 5. T1 and T2 are remote sensing images of the same region with different phases, while GT represents the real binary image of change detection, where white represents the change region, and black represents the stable region.
To analyze the performance of our FEDNet and compare algorithms, we utilized four metrics that are commonly used in CD tasks: precision (P) [28], recall (R) [29], F1-score [30], and Intersection over Union (IoU) [31]. The evaluation index P (precision) refers to how many of the samples that are predicted by the model to be positive class samples are really positive class samples. R (recall) refers to how many of the real positive class samples are predicted by the model to be in the positive class. The F1 score is the harmonic average of accuracy and recall, taking both accuracy and recall into account. The Intersection over Union is a metric that is used to evaluate a target detection task, measuring the overlap between the predicted target and the actual target by dividing the intersection between the target boxes by the union.

3.2. Implementation Details

The graphics card used in the experiments was NVIDIA GeForce RTX 3090 (NVIDIA Corporation, CA, USA), and our proposed FEDNet, as well as all the baselines, were implemented using PyTorch(3.9) on the GPU. The FEDNet employs ResNet-50 that is pretrained on ImageNet [17] as the CNN backbone. The Transformer modules can be any commonly used Transformer architecture. The image size of the datasets is 512 × 512 or 256 × 256 pixels.
We adopted a method that combines Bayesian optimization techniques with initial learning rate selection to achieve precise tuning of the model’s training parameters. As shown in Table 1, first we we set the search space for the initial learning rate on a logarithmic scale ranging from 1 × 10⁻⁶ to 1 × 10⁻² and established initial sampling points, including 1 × 10⁻⁵, 1 × 10⁻⁴, and 1 × 10⁻³, based on the domain experience. Using 30% of the LEVIR-CD dataset, we conducted an iterative optimization process: training and evaluating initial points, building probabilistic mappings between learning rates and performance, intelligently selecting the next evaluation point through the expected improvement acquisition function, while comprehensively monitoring three key metrics: the F1 score, recall, and IoU. As shown in Figure 1, after iterative optimization, the Bayesian model recommended 1 × 10⁻⁴ as the optimal initial learning rate. Combined with batch size comparisons of 4, 8, and 32, this parameter combination demonstrated excellent model performance (F1 = 82.71%; recall = 83.14%; IoU = 74.57%), while significantly reducing the computational resource consumption, providing a more reliable parameter selection strategy for deep learning model training.
We performed data augmentation on the bi-temporal images. The data augmentation operations assign random rotation (probability = 0.15), vertical flip (probability = 0.3), and horizontal flip (probability = 0.5) to the input images using random values (0–1). For example, the LEVIR-CD training set contains 7120 images, of which 1068 images undergo random rotation, 2136 images undergo vertical flipping, and 3560 images undergo horizontal flipping, maintaining the augmented training set size at 7120 images. Together, these three data augmentation techniques significantly improve the model’s adaptability to spatial position and orientation changes of objects in images, thereby enhancing its performance in practical applications. Especially in remote sensing image analyses, due to the diversity of observation angles and conditions, these techniques help the model better generalize to different environments and conditions, improving its accuracy and reliability. By increasing the variability of training samples, the model learns richer features, reduces the risk of overfitting, and ultimately achieves better performance. The augmented model was trained 100 times. The optimization times for the CLCD, NJDS, WHU, and LEVIR-CD change detection datasets were 0.8 h, 6.4 h, 3.2 h, and 4.4 h, respectively.

3.3. Ablation Experiments

As shown in Table 2, we performed an ablation study on the CLCD, NJDS, WHU, and LEVIR-CD datasets to investigate the effectiveness of essential components of our method.
From Table 2, we can see that the experimental results of adding the multi-scale feature fusion module (MFM) and difference enhancement module (DEM) in the four datasets are better than those of the baseline network. Moreover, the best experimental results are achieved by incorporating both the MFM and DEM into the baseline network, which fully verifies the effectiveness of these two proposed modules.

3.4. Comparative Experiments

This study included comparative experiments with different methods on four datasets, and the experimental results are shown in Table 3, Table 4, Table 5 and Table 6.
From Table 3, we can see that the proposed method, the FEDNet, achieves a significant improvement in recall, F1, and IoU compared with other methods. The recall rate of the FEDNet is 74.97%, F1 is 76.01%, and IoU is 61.31%. The IoU is improved by at least 0.86% percentage points compared with other methods. Since CLCD is a public farmland dataset, we can conclude that the proposed method has high accuracy in terms of vegetation area changes.
From Table 4, we can see that the proposed FEDNet achieves good results in terms of recall, F1, and IoU. The recall rate of the FEDNet method is 91.36%, F1 is 90.99%, and IoU is 83.47%. Among them, the recall achieved the highest percentage with respect to the other baselines. The IoU and F1 also achieved the second highest percentages.
From Table 5, we can see that the proposed FEDNet achieves good results in terms of recall, F1, and IoU. The recall rate of the FEDNet method is 91.64%, F1 is 90.85%, and IoU is 83.24%. Among them, the recall, F1, and IoU all achieve suboptimal but good results.
From Table 6, we can see that the proposed FEDNet achieved the highest scores for all four indicators. In particular, for the FEDNet, we obtained a recall of 77.24%, an F1 score of 69.65%, an IoU of 53.44%, and a precision value of 63.42%.
The significant performance improvement achieved by the FEDNet in this paper is due in part to the newly introduced differential enhancement module and multi-scale feature module. The difference enhancement module (EDM) extracts the difference features of the two phases to enhance the perception ability of the model to the difference between the changed region and the unchanged region. By comparing and analyzing the image data at different time points, this module effectively enhances the change signal and reduces the interference of background noise, thus improving the accuracy and sensitivity of the change detection. By processing image data at various resolutions, the multi-scale feature module (MFM) ensures that the model is able to understand the image content in a wider context, enabling it to more accurately identify both subtle and large-scale changes. The data from Table 3 to Table 6 show that the FEDNet model is more accurate in dealing with complex spatial structures than other methods, especially when processing coastal wetland change detection tasks. Coastal wetland change detection is more difficult than other types of remote sensing image processing due to the complex land cover type, high dynamic range, and impact of environmental factors (such as tides, seasonal changes, etc.) on the image quality. But our approach is at the top of every category. This fully reflects the high precision and effectiveness of the method.

4. Discussion

In order to reflect the effectiveness of our proposed method and module more intuitively. We performed ablation and contrast experiments on the CLCD, LEVIR-CD, NJDS, WHU, and GBCNR datasets. According to the results of visualization, the elimination and contrast experiments are analyzed and discussed.

4.1. Ablation Experiment Visualization

As shown in Figure 6 for the ablation experiment visualization, T1 and T2 represent the input images of the change detection task, representing two remote sensing images in a time series. GT indicates the real label.Baseline Output of the basic model: Baseline + MFM indicates that the MFM is added to the baseline model. FEDNet represents the output of the complete model.
Through model comparison, it can be seen from the figure that the baseline model has a large number of false checks (green) and missed checks (red) on all datasets. After adding the MFM, the phenomena of false detection and missing detection are improved to some extent, especially on the CLCD and WHU datasets, where the contours of the changed regions are closer to the real labels. The FEDNet results showed significant advantages across all datasets, with fewer false detections (fewer green areas), improved accuracy in identifying regions of change (red areas that better fit the real label), and clearer boundaries of regions of change on the NJDS and GBCNR datasets. Analysis of different datasets: On the CLCD and LEVIR-CD datasets, the baseline model has a large number of false detections (large green areas), while Baseline + MFM improves the false detections, but there are still missing detections. The FEDNet significantly improves the identification of changing regions, and the phenomena of false detections and missing detections basically disappear. On the WHU dataset, the baseline model has obvious missing points (red), while the contour of the changing region is incomplete; the Baseline + MFM reduces the number of missing points, but false detection still exists; the FEDNet results are complete and accurate, and basically coincide with the real label. On the NJDS dataset, the baseline model’s error detection is significant, especially in the background region, while Baseline + MFM reduces the background error detection, but the boundary of the changed region is still fuzzy. The result boundary of the FEDNet is clear, and the phenomena of false detection and missing detection are significantly reduced. On the GBCNR dataset, the baseline model has a low detection accuracy in the changing region, and the boundary is fuzzy. Baseline + MFM improves the detection accuracy in the changing region, but there are still some missed detections. The FEDNet’s result is closest to the real label, and the boundary of the changing region is clear, without obvious false detection. Through visualization, we can see that after adding the MFM to the baseline, the phenomena of false detection and missing detection are improved, and the accuracy of change detection is improved, especially in complex backgrounds. As a complete model, the FEDNet showed significant advantages over all datasets, accurately detecting the region of change, creating clear boundaries, and achieving almost complete disappearance of false and missed detections.

4.2. Comparison Experiment Visualization

As shown in Figure 7 visualization of comparative experiments, T1 and T2 represent the input images of the change detection task and represent two remote sensing images in one time series. GT true label. AMTNet and FEDNet are comparative experimental methods.
From Figure 7, it can be seen that the proposed FEDNet outperforms the AMTNet, and the elements that produce a red color are significantly lower than those of the AMTNet on the CLCD and LEVIR-CD datasets. The proposed FEDNet drastically reduces the leakage rate and thus significantly improves the accuracy of the detection of changed regions. The number of regions that produce a green color on the NJDS and WHU datasets is significantly reduced. This indicates that the proposed FEDNet has significantly improved the detection accuracy of changed regions. On the GBCNR dataset, the proposed FEDNet produces significantly fewer red and green elements than the AMTNet. The above experimental results fully demonstrate that the proposed method can better detect changed regions in remote sensing images.

4.3. Model Efficiency

Table 7 presents the floating-point operations (FLOPs) and parameters (Params) for different methods to analyze their computational and spatial complexity. FC-EF, FC-Siam-diff, and FC-Siam-conc are pure convolution-based network architectures with the lowest FLOPs and Params. The FEDNet-ResNet50’s FLOP of 18.7 G is much lower than FEDNet-VGG16’s 58.99 G and ChangerFormer’s 202.79 G. It is also lower than AMTNet’s 21.56 G. FEDNet-ResNet18 has a lower FLOP than FEDNet-ResNet50, but FEDNet-ResNet50 has more processing power or better performance. In terms of the number of parameters, the Params of FEDNet-ResNet50 (24.68 M) are close to those of the AMTNet, but lower than ChangerFormer and FEDNet-VGG16, indicating that it is more balanced in model size and possible overfitting risk. Compared to FEDNet-ResNet18, it has more parameters, which may help achieve more complex features and a better learning ability. FEDNet-ResNet50 provides a good balance between computational efficiency and model complexity. This balance allows FEDNet-ResNet50 to maintain high efficiency without sacrificing too much performance, which is why it was chosen as the best model.

4.4. The Effect of Dataset Size on the Model

As shown in Table 8, F1, R, and IoU all improve when the dataset goes from smaller resolutions and data volumes (3560/512/1024) to larger resolutions and data volumes (7120/1024/2048) on the LEVIR-CD dataset. This improvement may indicate that the model is able to capture more detail, because it has more data and a higher resolution, thus improving the performance. This usually means that the model may require more parameters to handle larger amounts of input data and more complex features. On the CLCD dataset, when the data volume is expanded from 960/360/360 to 1440/480/480, all performance metrics also improve. Although the increase is not as significant as in LEVIR-CD, it also suggests that more training data and a slightly higher resolution can provide better learning opportunities, and that more parameters may be needed to accommodate this increased data complexity. The WHU dataset shows a change from 3964/496/496 to 5947/744/744, with a significant increase in performance. This indicates that the model can handle larger datasets more efficiently, which also indicates that as the size of the dataset increases, the model may need more parameters to accommodate a wider range of inputs. Overall, the increase in the number of parameters coincides with an increase in the size of the dataset and an increase in resolution, which helps the model capture more complex features, resulting in improved performance metrics.

5. Conclusions

In order to improve the accuracy of remote sensing image change detection, a multi-scale feature fusion method based on differential enhancement is proposed. The core of the FEDNet is the DEM and MFM. The DEM enhances the pixel difference in two-phase remote sensing images by calculating the difference in the change feature map, so as to better capture the subtle changes and aggregate the features. Through multi-scale fusion, the MFM fully integrates the deep semantic information of the two stages and can more accurately extract the change characteristics of the target in the complex scene. Change detection experiments on LEVIR-CD, CLCD, WHU, NJDS, and GBCNR datasets show that the method achieves significantly better detection of different building, city, and vegetation changes. Compared with the existing detection methods, the proposed method achieves better results on four evaluation indexes. In particular, for the GBCNR mangrove change detection dataset, the FEDNet has the highest index: P (precision) increased by 0.32%, R (recall) increased by 0.88%, F1 increased by 2.33%, and IoU increased by 2.71% compared with other models. This not only demonstrates its effectiveness but also highlights the potential and advantages of the model in dealing with the detection of changes in specific ecological environments. While excellent results were obtained on multiple datasets, these datasets may not cover all types of geographic and environmental conditions. Therefore, the generalization ability of the model still needs to be further verified. In future studies, we aim to create a lightweight component design and reduce the computational complexity. Semi-supervised and unsupervised learning strategies should be studied to reduce the dependence on large amounts of labeled data, which is especially important for remote sensing images with limited resources or difficult access to labeled data. The use of the FEDNet in other types of image processing tasks, such as disaster assessment, urban planning, and environmental monitoring, should be explored to increase the breadth and flexibility of its applications. In addition, we will explore algorithm unrolling techniques to systematically connect traditional signal processing algorithms with deep neural networks, constructing network architectures with interpretability, while introducing frameworks based on quantum many-body physics theory to process non-local image structures, further enhancing the model’s change detection capabilities in complex scenarios and limited-sample conditions through patch-level hyperparameter adaptive adjustment.

Author Contributions

H.H. was responsible for the overall framework design and methodological development of the paper, proposing the core concept of the FEDNet network. He led the experimental design and implementation, including data preprocessing, model training, and performance evaluation. He drafted the initial manuscript and revised its contents for improvement. Y.W. conducted a detailed review of the manuscript, provided critical revisions, and optimized the paper’s expression and logical structure. Q.Q. and Y.T. provided theoretical support and technical guidance, assisted in adjusting the structure of the paper and refining the language, and ensured that the manuscript met publication standards. T.L. offered feedback based on practical requirements in remote sensing scenarios, helping optimize the model’s performance. All authors have read and agreed to the published version of the manuscript.

Funding

This work was supported by Guangxi Science and Technology, Major Project (AA19254016), and Beihai Science and Technology Bureau Project: Bei Kehe 2023158004 Project support.

Data Availability Statement

The GBCNR dataset for this study is available from the corresponding author on reasonable request.

Acknowledgments

We thank the anonymous reviewers for their insightful comments, which greatly improved the quality of this paper. We thank all the individuals and organizations that provided support and assistance for this study. Special thanks to the Guangxi Science and Technology Major Project and the Beihai Science and Technology Bureau for funding and supporting this study. Special thanks to the Institute of Marine Electronics and Information Technology, Nanzhu Campus, Guilin University of Electronic Science and Technology, for providing the experimental environment and resource support.

Conflicts of Interest

The authors declare no conflicts of interest.

References

  1. Deng, Z.; Sun, H.; Zhou, S.; Zhao, J.; Lei, L.; Zou, H. Multi-scale object detection in remote sensing imagery with convolutional neural networks. ISPRS J. Photogramm. Remote Sens. 2018, 145, 3–22. [Google Scholar] [CrossRef]
  2. Cheng, G.; Zhou, P.; Han, J. Learning rotation-invariant convolutional neural networks for object detection in VHR optical remote sensing images. IEEE Trans. Geosci. Remote Sens. 2016, 54, 7405–7415. [Google Scholar] [CrossRef]
  3. Wang, Q.; Yuan, Z.; Du, Q.; Li, X. GETNET: A general end-to-end 2-D CNN framework for hyperspectral image change detection. IEEE Trans. Geosci. Remote Sens. 2018, 57, 3–13. [Google Scholar] [CrossRef]
  4. Daudt, R.C.; Le Saux, B.; Boulch, A.; Gousseau, Y. Urban change detection for multispectral earth observation using convolutional neural networks. In Proceedings of the IGARSS 2018-2018 IEEE International Geoscience and Remote Sensing Symposium, Valencia, Spain, 22–27 July 2018; pp. 2115–2118. [Google Scholar]
  5. Liu, Y.; Pang, C.; Zhan, Z.; Zhang, X.; Yang, X. Building change detection for remote sensing images using a dual-task constrained deep siamese convolutional network model. IEEE Geosci. Remote Sens. Lett. 2020, 18, 811–815. [Google Scholar] [CrossRef]
  6. Fang, S.; Li, K.; Shao, J.; Li, Z. SNUNet-CD: A densely connected Siamese network for change detection of VHR images. IEEE Geosci. Remote Sens. Lett. 2021, 19, 8007805. [Google Scholar] [CrossRef]
  7. Xu, J.; Luo, C.; Chen, X.; Wei, S.; Luo, Y. Remote sensing change detection based on multidirectional adaptive feature fusion and perceptual similarity. Remote Sens. 2021, 13, 3053. [Google Scholar] [CrossRef]
  8. Chen, H.; Qi, Z.; Shi, Z. Remote sensing image change detection with transformers. IEEE Trans. Geosci. Remote Sens. 2021, 60, 5607514. [Google Scholar] [CrossRef]
  9. Bandara WG, C.; Patel, V.M. A transformer-based siamese network for change detection. In Proceedings of the IGARSS 2022-2022 IEEE International Geoscience and Remote Sensing Symposium, Kuala Lumpur, Malaysiam, 17–22 July 2022; pp. 207–210. [Google Scholar]
  10. Liu, M.; Chai, Z.; Deng, H.; Liu, R. A CNN-transformer network with multiscale context aggregation for fine-grained cropland change detection. IEEE J. Sel. Top. Appl. Earth Obs. Remote Sens. 2022, 15, 4297–4306. [Google Scholar] [CrossRef]
  11. Liu, W.; Lin, Y.; Liu, W.; Yu, Y.; Li, J. An attention-based multiscale transformer network for remote sensing image change detection. ISPRS J. Photogramm. Remote Sens. 2023, 202, 599–609. [Google Scholar] [CrossRef]
  12. Zhang, Q.; Zhao, J. Remote sensing image change detection based on difference enhancement and dual-attention Transformer. Radio Eng. 2019, 54, 230–238. [Google Scholar]
  13. He, K.; Zhang, X.; Ren, S.; Sun, J. Deep residual learning for image recognition. In Proceedings of the IEEE Conference on Computer Vision and Pattern Recognition, Amsterdam, The Netherlands, 8–16 October 2016; pp. 770–778. [Google Scholar]
  14. Cheng, Y.; Yan, J.; Zhang, F.; Li, M.; Zhou, N.; Shi, C.; Jin, B.; Zhang, W. Surrogate modeling of pantograph-catenary system interactions. Mech. Syst. Signal Process. 2025, 224, 112134. [Google Scholar] [CrossRef]
  15. Monga, V.; Li, Y.; Eldar, Y.C. Algorithm unrolling: Interpretable, efficient deep learning for signal and image processing. IEEE Signal Process. Mag. 2021, 38, 18–44. [Google Scholar] [CrossRef]
  16. Dutta, S.; Basarab, A.; Georgeot, B.; Kouamé, D. DIVA: Deep unfolded network from quantum interactive patches for image restoration. Pattern Recognit. 2024, 155, 110676. [Google Scholar] [CrossRef]
  17. Fang, S.; Li, K.; Li, Z. Changer: Feature interaction is what you need for change detection. IEEE Trans. Geosci. Remote Sens. 2023, 61, 5610111. [Google Scholar] [CrossRef]
  18. Woo, S.; Park, J.; Lee, J.Y.; Kweon, I.S. Cbam: Convolutional block attention module. In Proceedings of the European Conference on Computer Vision (ECCV), Munich, Germany, 8–14 September 2018; pp. 3–19. [Google Scholar]
  19. Khan, S.; Naseer, M.; Hayat, M.; Zamir, S.W.; Khan, F.S.; Shah, M. Transformers in vision: A survey. ACM Comput. Surv. (CSUR) 2022, 54, 1–41. [Google Scholar] [CrossRef]
  20. Li, Q.; Zhong, R.; Du, X.; Du, Y. TransUNetCD: A hybrid transformer network for change detection in optical remote-sensing images. IEEE Trans. Geosci. Remote Sens. 2022, 60, 5622519. [Google Scholar] [CrossRef]
  21. Zhang, C.; Wang, L.; Cheng, S.; Li, Y. SwinSUNet: Pure transformer network for remote sensing image change detection. IEEE Trans. Geosci. Remote Sens. 2022, 60, 5224713. [Google Scholar] [CrossRef]
  22. Yang, J.; Huang, X. 30 m annual land cover and its dynamics in china from 1990 to 2019. Earth Syst. Sci. Data Discuss. 2021, 13, 3907–3925. [Google Scholar] [CrossRef]
  23. Ji, S.; Wei, S.; Lu, M. Fully convolutional networks for multisource building extraction from an open aerial and satellite imagery dataset. IEEE Trans. Geosci. Remote Sens. 2018, 57, 574–586. [Google Scholar] [CrossRef]
  24. Chen, H.; Shi, Z. A spatial-temporal attention-based method and a new dataset for remote sensing image change detection. Remote. Sens. 2020, 12, 1662. [Google Scholar] [CrossRef]
  25. Shen, Q.; Huang, J.; Wang, M.; Tao, S.; Yang, R.; Zhang, X. Semantic feature-constrained multitask siamese network for building change detection in high-spatial resolution remote sensing imagery. ISPRS J. Photogramm. Remote. Sens. 2022, 189, 78–94. [Google Scholar] [CrossRef]
  26. Luhn, H.P. A business intelligence system. IBM J. Res. Dev. 1958, 2, 314–319. [Google Scholar] [CrossRef]
  27. Cleverdon, C. The Cranfield tests on index language devices. Aslib Proc. 1967, 19, 173–194. [Google Scholar] [CrossRef]
  28. Van Rijsbergen, C. Information retrieval: Theory and practice. Proc. Jt. IBM/Univ. Newctle. Upon Tyne Semin. Data Base Syst. 1979, 79, 1–14. [Google Scholar]
  29. Everingham, M.; Van Gool, L.; Williams, C.K.; Winn, J.; Zisserman, A. The pascal visual object classes (voc) challenge. Int. J. Comput. Vis. 2010, 88, 303–338. [Google Scholar] [CrossRef]
  30. Krizhevsky, A.; Sutskever, I.; Hinton, G.E. ImageNet classification with deep convolutional neural networks. Commun. ACM 2017, 60, 84–90. [Google Scholar] [CrossRef]
  31. Ronneberger, O.; Fischer, P.; Brox, T. U-net: Convolutional networks for biomedical image segmentation. In Proceedings of theMedical Image Computing and Computer-Assisted Intervention–MICCAI 2015: 18th International Conference, Munich, Germany, 5–9 October 2015; Proceedings, Part III 18. pp. 234–241. [Google Scholar]
Figure 1. Overall architecture of the proposed FEDNet.
Symmetry 17 00590 g001
Figure 2. The architecture of the MFM.
Symmetry 17 00590 g002
Figure 3. Multi-scale feature fusion process diagram.
Symmetry 17 00590 g003
Figure 4. The architecture of the DEM.
Symmetry 17 00590 g004
Figure 5. Some samples from the CLCD, LEVIR-CD, NJDS, and WHU public datasets.
Symmetry 17 00590 g005
Figure 6. Visualization comparison of ablation experiments based on five datasets.True positive (TP) is represented by white pixels and true negative (TN) by black pixels. False positives (FPs) are shown in green and false negatives (FNs) in red.
Symmetry 17 00590 g006
Figure 7. Visualization of the results of change detection on five remote sensing image datasets. True positive (TP) is represented by white pixels and true negative (TN) by black pixels. False positives (FPs) are shown in green and false negatives (FNs) in red.
Symmetry 17 00590 g007
Table 1. Table of pre-experimental hyperparameter performance.
Initial Learning RateF1RIoUBatch SizeF1RIoU
1 × 10−380.6381.2471.82481.4681.9272.94
1 × 10−482.7183.1474.57882.7183.1474.57
1 × 10−578.4078.9268.953279.3279.8770.18
Table 2. Ablation studies performed on four datasets (%).
DatasetMethodsF1RIoU
LEVIR-CDBaseline0.902880.890340.82296
Baseline + MFM0.905170.892530.82677
Baseline + MFM + DEM0.906210.913620.83466
CLCDBaseline0.747540.733140.59685
Baseline + MFM0.748690.745880.59832
Baseline + MFM + DEM0.760110.749660.61305
NJDSBaseline0.822970.737740.69919
Baseline + MFM0.839350.798160.72318
Baseline + MFM + DEM0.857670.856590.75081
WHUBaseline0.897290.896620.81371
Baseline + MFM0.902940.891470.82302
Baseline + MFM + DEM0.908520.916380.83237
The red bold font indicates the best performance, and the black bold font indicates the second best.
Table 3. Comparison results for CLCD dataset (%).
MethodPRF1IoU
FC-EF [4]71.747.657.2240.07
DTCDSCN [5]54.4966.2359.7942.64
SNUNet [6]70.8262.3766.3249.62
MFPNet [7]76.4260.7470.2254.11
BiT [8]61.4262.7562.0845.01
ChangeFormer [9]69.1151.7559.1842.03
MSCANet [10]75.3667.6471.2955.39
AMTNet [11]76.6274.1275.3560.45
FEDNet77.1074.9776.0161.31
The red bold font indicates the best performance, and the black bold font indicates the second best.
Table 4. Comparison results for the LEVIR-CD dataset (%).
MethodPRF1IoU
FC-EF [4]86.9180.1783.4071.53
DTCDSCN [5]88.5386.8387.6778.05
SNUNet [6]89.1887.1788.1678.83
MFPNet [7]93.1689.0891.0883.62
BiT [8]89.2489.3789.3180.68
ChangeFormer [9]92.0588.8090.4082.48
MSCANet [10]91.3088.5689.9181.66
AMTNet [11]90.0991.0189.2081.96
FEDNet90.6291.3690.9983.47
The red bold font indicates the best performance, and the black bold font indicates the second best.
Table 5. Comparison results for the WHU dataset (%).
MethodPRF1IoU
FC-EF [4]80.8775.4378.0564.01
DTCDSCN [5]82.7288.4485.4974.65
SNUNet [6]83.2591.3587.1177.17
MFPNet [7]88.4489.0288.7379.74
BiT [8]83.0588.8085.8375.18
ChangeFormer [9]92.8985.6088.8279.89
MSCANet [10]91.1089.8690.4782.60
AMTNet [11]92.8691.9992.2785.64
FEDNet90.0891.6490.8583.24
The red bold font indicates the best performance, and the black bold font indicates the second best.
Table 6. Comparison results for the GBCNR dataset (%).
MethodPRF1IoU
U-net [31]33.30 50.22 40.0525.04
SNUNet [6]63.164.50 63.7946.83
FC-EF [4]56.97 63.12 59.89 42.74
FC-Siam-diff [4]61.40 57.05 59.14 41.99
FC-Siam-conc [4]59.79 54.99 57.29 40.14
AMTNet [11]60.1976.3667.3250.73
FEDNet63.4277.2469.6553.44
The red bold font indicates the best performance, and the black bold font indicates the second best.
Table 7. Model efficiency comparison table.
MethodFLOPs (G)Params (M)
FC-EF [4]3.581.35
FC-Siam-diff [4]4.731.35
FC-Siam-conc [4]5.331.55
SNUNet [6]54.8212.04
ChangerFormer [9]202.7941.03
AMTNet [11]21.5624.67
FEDNet-VGG1658.9930.46
FEDNet-ResNet1811.816.45
FEDNet-ResNet5018.724.68
Table 8. Model Performance Across Dataset Sizes.
DatasetDataset SizeF1RIoU
LEVIR-CD3560/512/10240.89460.88740.8162
7120/1024/20480.90620.91360.8347
CLCD960/360/3600.74650.72610.5719
1440/480/ 4800.76010.74970.6131
WHU3964/496/4960.89730.87920.8126
5947/744/7440.90850.91360.8324
Disclaimer/Publisher’s Note: The statements, opinions and data contained in all publications are solely those of the individual author(s) and contributor(s) and not of MDPI and/or the editor(s). MDPI and/or the editor(s) disclaim responsibility for any injury to people or property resulting from any ideas, methods, instructions or products referred to in the content.

