1. Introduction
In recent years, deep learning has been increasingly applied to medical imaging and key areas such as artifact removal, super-resolution reconstruction, and medical image segmentation. With the advancement of medical imaging technology, the automated analysis of skin lesions has gradually become a research hotspot. Skin cancer, for instance, is one of the most common types of cancer, and it typically occurs on the skin’s surface. However, if not detected and treated promptly, it can spread to other parts of the body [
1]. The primary cause of skin cancer is prolonged exposure to ultraviolet (UV) radiation, which damages the DNA of skin cells and leads to abnormal cell growth. In this regard, the ISIC (International Skin Imaging Collaboration) dataset is one of the most renowned and widely used skin lesion datasets. It contains thousands of skin lesion images, covering various types of skin lesions. Additionally, it includes both benign and malignant tumors, as well as melanoma and other categories. In particular, the symptoms of skin cancer typically present as new growths on the skin or changes in existing moles or spots [
1]. Common signs include color changes, irregular borders, rapid enlargement, bleeding, or ulceration. Specifically, the skin cancer cases in the ISIC dataset can be classified into four main categories: melanoma, benign melanocytic nevus, basal cell carcinoma, and squamous cell carcinoma [
2]. Therefore, this dataset enables researchers to develop and train deep learning models for accurate segmentation of skin lesion areas, which helps doctors improve diagnostic efficiency and accuracy. As a representative convolutional neural network architecture, U-Net has achieved remarkable success in medical image segmentation tasks [
3]. The encoder-decoder structure and residual connections of it demonstrate exceptional capabilities in learning local features. Consequently, U-Net-based variants have become a major research focus [
4,
5].
However, U-Net itself still has certain limitations, although it and its variants have shown excellent performance in the field of medical image segmentation [
6,
7,
8]. The local feature extraction mechanism of convolutional kernels makes it challenging for convolutional networks to model long-range contextual dependencies, which restricts the effective expansion of their receptive field [
9]. This structural limitation significantly impacts the segmentation performance of convolutional networks. Suboptimal segmentation results are obtained in boundary regions, especially in complex tasks that require high boundary precision. U-Net++ addresses this issue by introducing denser skip connections and enabling multiple feature fusions between different layers [
10]. This not only helps preserve high-resolution details but also enhances the model’s ability to capture contextual information. Moreover, this structure promotes the reuse of deep features by utilizing multiple feature maps from the encoder in the decoder, thus allowing features from different levels to be more effectively extracted when handling complex structures [
11]. Feature extraction is improved by R2U-Net through the use of residual connections and repeated convolutions. Features are extracted more deeply by performing multiple convolution operations to enhance segmentation accuracy.
As attention mechanisms are increasingly recognized for their excellent performance, several studies have started incorporating them into the basic U-Net framework to address the limitations of convolutional operations. Oktay, Ozan, and colleagues proposed Att U-Net [
12], which evolves the simple residual connections in the original structure to model global contextual relationships of image tensor flows at different scales. Compared with basic architecture, Att U-Net achieves significant improvements in segmentation performance across various metrics. TransAttUnet was proposed by Chen B, Liu Y, Zhang Z, and others. Transformer Self-Attention (TSA) and Global Spatial Attention (GSA) are integrated into the U-Net bridging layer [
13,
14]. The network uses a linear layer to separate the original downsampling results into two tensor paths, each introducing TSA and GSA modules. Outputs of both modules are then combined with the original downsampling results and fed into the upsampling layer [
15]. This structure enhances the network’s ability to model multi-scale contextual information. Contextual information from various levels is integrated through different methods and leads to superior segmentation performance by TransAttUnet compared with contemporary advanced networks.
Despite significant progress made by existing deep learning methods in medical image segmentation tasks, certain limitations still persist. Traditional U-Net and its variants perform excellently in feature extraction. However, due to the local nature of convolution operations, these networks struggle to capture long-range dependencies and global context information. U-Net++ enhances feature fusion capabilities through dense skip connections. On the other hand, it still lacks a module specifically designed for extracting boundary information, which limits its performance in complex or ambiguous boundary segmentation tasks. R2U-Net improves feature extraction with repeated convolutions and residual connections. Nevertheless, it mainly focuses on global feature extraction and still faces challenges in processing boundary details. Additionally, existing attention mechanism-enhanced models, such as Att U-Net and TransAttUnet, improve the network’s ability to model global information [
16]. However, they do not include specialized modules for boundary modeling, restricting their performance in precise boundary segmentation.
To address the issues mentioned above, this paper proposes a novel three-component fusion network, BAG-Net, which combines an independent boundary information extraction module with an attention mechanism [
17]. This approach enhances both the ability to capture boundary information and the modeling of global context information. The network obtains precise edge information through the boundary self-correlation module. Additionally, it utilizes a global attention mechanism to strengthen the network’s ability to model long-range dependencies, which achieves more comprehensive feature fusion. The objective of this study is to improve the limitations of existing models in boundary segmentation and global information extraction through this fusion strategy. Therefore, it enhances the accuracy and robustness of medical image segmentation [
18]. By comparing the segmentation performance of BAG-Net with that of classical networks, we validate the effectiveness of the proposed three-component fusion mechanism in segmentation tasks and provide valuable insights for medical image segmentation [
19].
2. Methods and Materials
The structure of BAG-Net is illustrated in
Figure 1. In this architecture, the network consists of three components: the Preliminary Segmentation Block (PSB), Global Context Attention (GCA), and Boundary Self-Attention (BSA). Consequently, these components work together to segment and annotate the skin lesion areas. As for the PSB, it is used to generate preliminary segmentation results and provide essential local semantic information. Meanwhile, the GCA and BSA components are responsible for extracting global context and boundary information. These components further enhance the model’s segmentation capability. To better train the model, the images in the dataset were uniformly scaled to a size of 256 × 256 × 3. The processed images were then fed into the SEU-Net module, where they underwent multiple layers of convolution and downsampling operations, which resulted in an initial segmentation output (PSR) with a size of 256 × 256 × 64. In the BSA component, the initial segmentation result (PSR) serves as input to the module for boundary self-attention calculation. In the GCA component, the segmented images pass through three consecutive integrated convolutional layers and max-pooling layers to obtain input for the multi-head attention mechanism. After these three operations, the tensor sizes become 128 × 128 × 128, 64 × 64 × 256, and 32 × 32 × 512, respectively. Finally, the outputs of these three components are fused through a decoder to generate high-accuracy segmentation results. Characteristics of each component are described below.
2.1. PSB Component
In PSB component, the input image is first processed by SEU-Net for preliminary segmentation that generates the Preliminary Segmentation Results (PSR). Then image is passed through two convolutional rectification layers to generate boundary tensors, which are subsequently fed into the BSA component. PSB employs a symmetric encoder-decoder structure to efficiently extract and process local feature information from the image. SEU-Net (Squeeze-and-Excitation U-Net) is a simplified variant of U-Net, and its architecture is illustrated in
Figure 2.
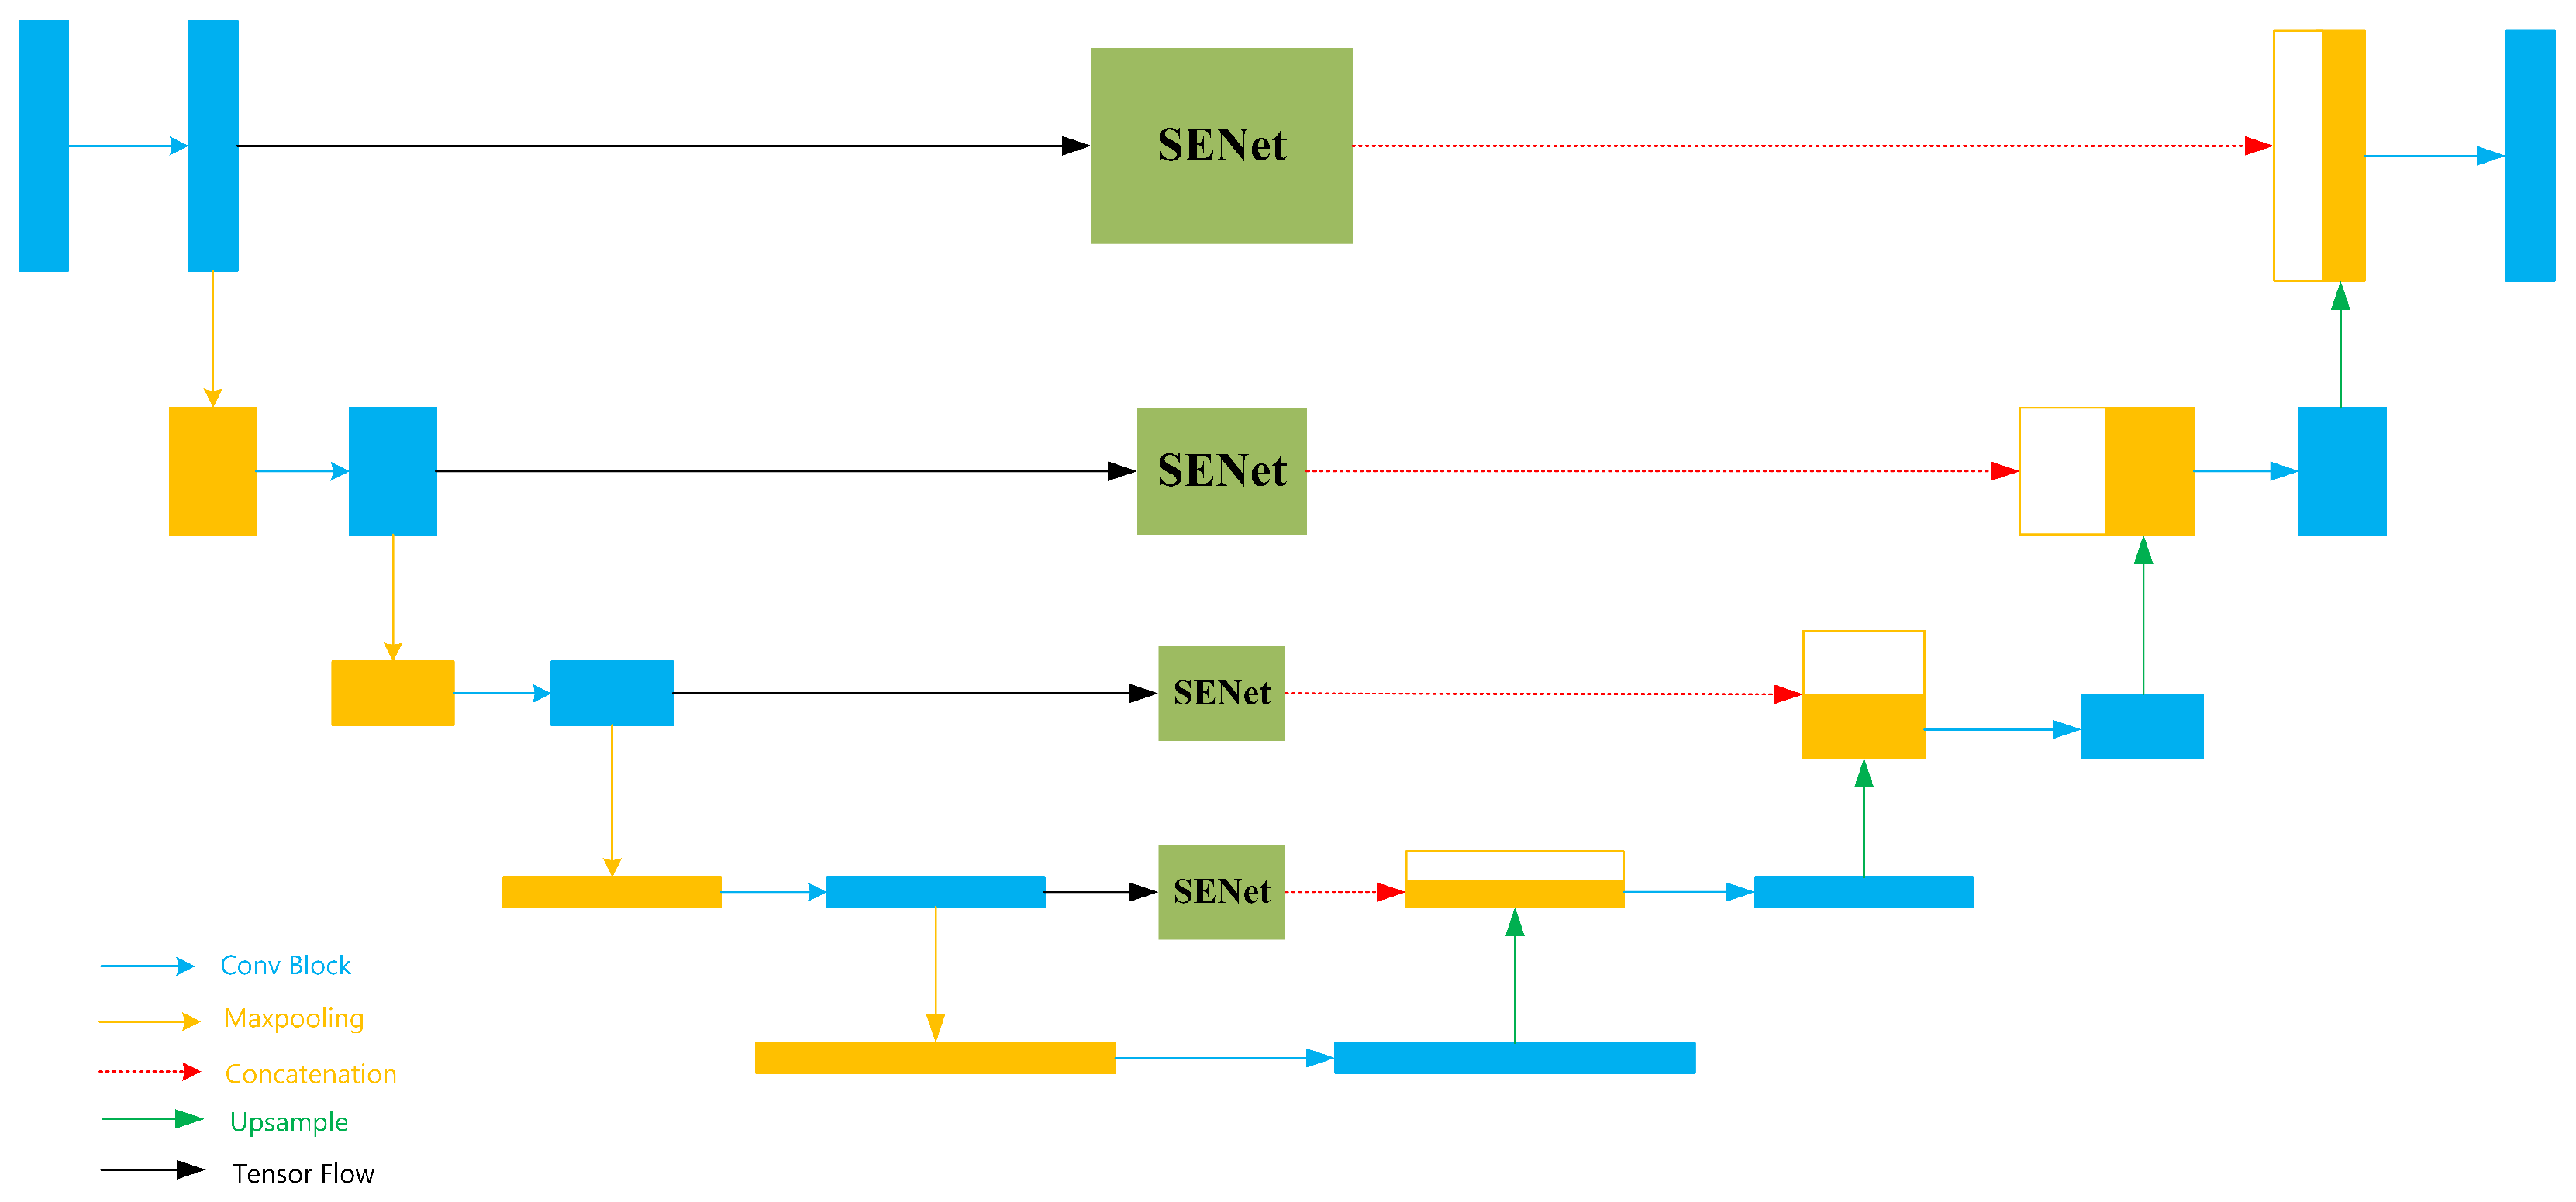
Figure 2 illustrates a network that combines the U-Net backbone with the SE-Net structure. The input to the network is a preprocessed image with a size of 256 × 256 × 3. After the first convolutional block, the output tensor has a size of 256 × 256 × 64. And during the subsequent downsampling operations, the tensor size is reduced to 128 × 128 × 64. After each following convolution operation, the number of channels in the tensor doubles. During the subsequent max-pooling operations, the tensor size is halved. The bottom-most blue tensor block has a size of 16 × 16 × 1024. In the subsequent upsampling layers, the number of tensor channels is halved, while the tensor size gradually restores to the original output size.
The specific structure of the Conv Block submodule in SEU-Net is shown in
Figure 3. The input tensor first passes through a 3 × 3 convolutional layer for feature extraction. Then, the tensor goes through a batch normalization layer to accelerate model convergence. Next, it passes through a ReLU activation function to introduce non-linearity. Finally, the output tensor goes through the same three layers again for further feature extraction, resulting in the final output of the entire submodule. SEU-Net incorporates SENet into the skip connections of each layer in U-Net. In this approach, the core concept of SENet is to enhance the network’s feature selection ability through a “channel attention mechanism” [
20]. Compared with this, traditional U-Net employs a relatively simple feature fusion mechanism. Feature maps from a given layer of the encoder are directly connected to the corresponding layer in the decoder, and feature maps of the same resolution are concatenated. However, this fusion mechanism may introduce redundant information, especially when there is a large disparity between low-level and high-level features. In such cases, direct concatenation or addition of these features may result in an excessive amount of redundant feature information being passed to the decoder. The model’s efficiency and generalization capability may be affected as a result. To address this, SENet is integrated with the traditional U-Net in this paper, and the channel attention mechanism is introduced into the framework. In particular, a weighted approach is applied before concatenation to minimize the interference from low-level features during the decoding process and optimize U-Net’s feature fusion mechanism at the structural level. SENet improves the focus on relevant features through two steps: Squeeze and Excitation [
21]. And these steps together form the channel attention mechanism, and the network’s feature selection capability is enhanced. In the Squeeze step, the input feature map is compressed into a global description vector via adaptive global pooling. And spatial information of each channel is compressed into a single value to evaluate the importance of each channel. In the Excitation step, the inter-channel dependencies of the feature map are learned through two fully connected layers and a ReLU activation function. In this section, a lightweight fully connected neural network is used to model the importance of each channel and output inter-channel weight relationships [
22]. The weights are then multiplied with the original feature map to apply the weighting. Important features are emphasized, and less relevant ones are suppressed. Structure of SENet is illustrated in
Figure 4.
Structure in
Figure 4 demonstrates the Squeeze and Excitation steps. In the downsampling process at the same scale,
is first processed by a global pooling operation to obtain the tensor
. And
then passes through a fully connected layer with C/r neurons and a ReLU activation function to compress the number of channels, resulting in
. After that, the tensor
is passed through a fully connected layer with C neurons and a Sigmoid activation function to obtain the attention weights. Then attention weights are multiplied with X to obtain the weighted result
. Finally, the result is concatenated with the upsampled result.
In SEU-Net, the output tensor undergoes a ReLU activation function after each convolution operation to facilitate the network’s learning of nonlinear mappings. Immediately, a batch normalization layer is added to accelerate the model’s convergence and prevent overfitting after each ReLU activation. In SEU-Net, the computational formula for the output tensor at each layer is shown below.
Here,
represents the ReLU activation function,
represents the batch normalization layer, and
represents the 1 × 1 convolution layer of the i-th layer.
and
represent the input and output of each layer during the downsampling process, respectively. In SEU-Net, four layers of SENet are integrated into the skip connections of the original U-Net. Each layer of SENet reduces the number of channels of the input tensor to 1/r of the original number. For instance,
Table 1 illustrates the changes in channel numbers before and after compression across different layers of SEU-Net with r = 16.
As shown in
Table 1, SENet compresses the number of channels at each layer of U-Net by a fixed factor using the Squeeze operation and then restores the number of channels with the Excitation operation. This mechanism allows SENet to significantly enhance the feature representation capability of the network.
The output of SEU-Net is fed into a 64-channel convolutional layer to obtain the input for the BSA component, which is referred to as “Boundary”. Simultaneously, another 64-channel convolutional layer processes the output of SEU-Net to generate the Preliminary Segmentation Results (PSR).
2.2. BSA Component
To effectively extract and utilize boundary information, the Boundary Self-Attention (BSA) component is introduced in this paper. It is designed to focus precisely on important features within the image. This enables better understanding of the image content by the model and superior performance to be achieved in various medical image segmentation tasks. Boundary information in medical images is often considered to contain critical diagnostic details, especially in regions with complex shapes such as tumors and lesions. Accurate boundary extraction is crucial for improving segmentation accuracy. As such, the core concept of BSA is to apply a spatial attention mechanism in which different weights are assigned to various positions in the feature map. This emphasizes the most important boundary features within the image.
BSA component generates attention maps by utilizing the relationships between Query, Key and Value [
23]. Initially, the BSA component processes the input through three 1 × 1 convolution operations to produce the Query matrix (Q), Key matrix (K), and Value matrix (V). The computation process is as follows [
24]:
These matrices are dimensionally adjusted to compute the similarity between the Query and Key matrices in the subsequent batch matrix multiplication process. In this step, the relationship between the Query and Key matrices is quantified through batch matrix multiplication. As a result, this process produces a set of weighted Value features. The computation process is shown in the following equation [
25].
Weighted features correspond to the importance of different regions in the image and enable the model to effectively focus on key areas while irrelevant or redundant parts are disregarded. Once the weighted features are obtained, they are multiplied by the Value matrix in the BSA component. Subsequently, the dimensions are restored to produce the weighted feature map. This output incorporates boundary self-attention information and ensures the precise modeling of boundary regions by the model.
The boundary self-attention mechanism assigns different weights to various regions. This enables the model to focus more on areas with significant boundary information in the image. Especially when complex structures or fine details are processed, interference from background noise and irrelevant regions is effectively minimized by BSA. For this reason, model’s performance is enhanced. Compared with traditional boundary extraction methods, the BSA component does not rely on manually designed boundary detection rules. Instead, it adaptively learns and extracts key boundary information through a data-driven approach. Thus, this allows the BSA component to demonstrate exceptional performance in dynamic and complex medical image segmentation tasks.
2.3. GCA Component
To achieve efficient feature extraction and global context modeling, we designed and implemented the GCA component [
26]. Specifically, the central idea behind the design of this component is to effectively convert image data into processable feature representations and perform deep learning through the self-attention mechanism. Initially, the input image is divided into multiple fixed-size blocks by the component. Then, local information is encoded. This process can be viewed as a non-overlapping segmentation of the image that allows each block to independently learn features while preserving the structure of global information [
27]. Furthermore, the embedding of image blocks effectively replaces traditional convolution operations, which enhances the model’s ability to understand spatial information. The core idea of the attention mechanism is to assign different weights to different parts of the input. Thus, this enables more efficient information extraction [
28]. Designed to simulate human visual attention, the attention mechanism allows the model to “focus” on the most pertinent information during data processing [
29]. Correlations between different parts of the input tensor are computed, and the attention on each part is dynamically adjusted. In line with the attention mechanism’s structure, we incorporated trainable positional encodings to help the model understand the spatial relationships between image blocks. These encodings are added to the embedding vectors, ensuring that the positional information of each block is effectively integrated into the feature representation [
30]. Subsequently, these embedding vectors are passed into 8 encoder blocks for processing, each block consisting of a multi-head self-attention mechanism and a feed-forward neural network. By using the multi-head attention mechanism, the model can simultaneously focus on different parts of the input sequence. And the complex contextual information is captured. Model calculates the similarity between the query matrix, key matrix, and value matrix [
31]. Then model generates output features through weighted summation. This process can be expressed by the following formula [
32]:
Here, Q, K, and V represent the query matrix, key matrix, and value matrix, respectively, and
denotes the dimension of the key [
33]. In parallel, computation is performed with 8 attention heads. As a result, information from different subspaces is gathered by the model, which enhances the richness of the feature representation. Once processed through multiple encoder blocks, the output embedded features are restored to their original dimensions. Finally, the final output is generated. In subsequent computations, the output of this component is combined with the outputs of the other two components [
34]. And the final segmentation prediction is obtained through the output convolution layer.
3. Experiment and Discussion
In this paper, skin lesion segmentation experiments were conducted using the ISIC 2017 [
35], ISIC 2018 [
36], and PH2 [
37] datasets to evaluate the segmentation performance of the proposed method on different types of skin lesions. The ISIC 2017 dataset was released by the International Skin Imaging Collaboration (ISIC) to promote skin lesion research and analysis. It contains over 2000 skin lesion images, which are primarily used for skin cancer (especially melanoma) classification and segmentation tasks. Each image is accompanied by detailed annotations that include lesion area masks annotated by dermatology experts. The ISIC 2018 dataset extends the previous year’s dataset by adding more images and increasing diversity. The dataset contains over 25,000 images and encompasses various types of skin lesions, which include melanoma, basal cell carcinoma, and squamous cell carcinoma. Similar to ISIC 2017, ISIC 2018 provides detailed annotations that support precise segmentation of lesion areas. The PH2 dataset was released by the research team at the University of Portugal. It is specifically designed for skin lesion research. It contains 200 skin lesion images, which mainly focus on melanoma features. In the same vein, each image in the PH2 dataset is paired with expert-annotated lesion area masks and relevant clinical information. Although smaller than the ISIC datasets, the PH2 dataset’s high-quality annotations make it highly valuable for skin lesion segmentation and classification research.
In order to validate the effectiveness of the proposed model, we performed experiments on ISIC 2017, ISIC 2018, and PH2 datasets. The experimental setup is shown in
Table 2. The experiment ran for 120 epochs, with training using the Adam optimizer, a learning rate set to 0.0001, and a batch size of 32. The experimental results were evaluated using four metrics: DSC, Sensitivity, Accuracy, and Specificity. The formulas for calculating each of the metrics are shown below.
In deep learning model evaluation, TP (True Positive) refers to the number of instances that are correctly classified as positive. This reflects the number of positive samples that are accurately identified by the model. TN (True Negative) refers to the number of instances that are correctly classified as negative. This reflects the model’s accuracy in identifying negative samples. Conversely, FP (False Positive) denotes the number of negative samples that are incorrectly classified as positive. This typically results in false alarms. FN (False Negative) refers to the number of instances that are actually positive but are misclassified as negative, which often leads to missed detections [
38].
As shown in
Figure 4, SENet first performs a channel compression operation on the tensor after global pooling and then restores the tensor to its original number of channels. During channel compression, the number of channels in the tensor is reduced to 1/r of the original number of channels. To investigate the effect of the compression factor r on the performance of SEU-Net, corresponding experiments were designed in this paper. In particular, we tested the training performance of SEU-Net on the ISIC 2018 dataset for different values of r. In this experiment, the number of channels in the input tensor of the topmost convolutional neural network layer containing SENet is 64. To ensure that the number of channels after compression is an integer, we tested SEU-Net’s segmentation performance on the ISIC 2018 dataset for compression factors r of 4, 8, 16, and 32. And the experiment was conducted for 120 epochs. The training was performed using the Adam optimizer, with the learning rate set to 0.0001 and the batch size set to 32. The results of the experiment are presented in
Table 3.
As shown in
Table 3, when the value of r is 16, the highest DSC, Specificity, and Accuracy are achieved by SEU-Net on the ISIC 2018 dataset. Although SEU-Net exhibits higher sensitivity when r is set to 4, the model’s segmentation performance is optimal at r = 16 when considering the overall testing performance. Therefore, we ultimately embedded the SEU-Net with r = 16 into the PSB component.
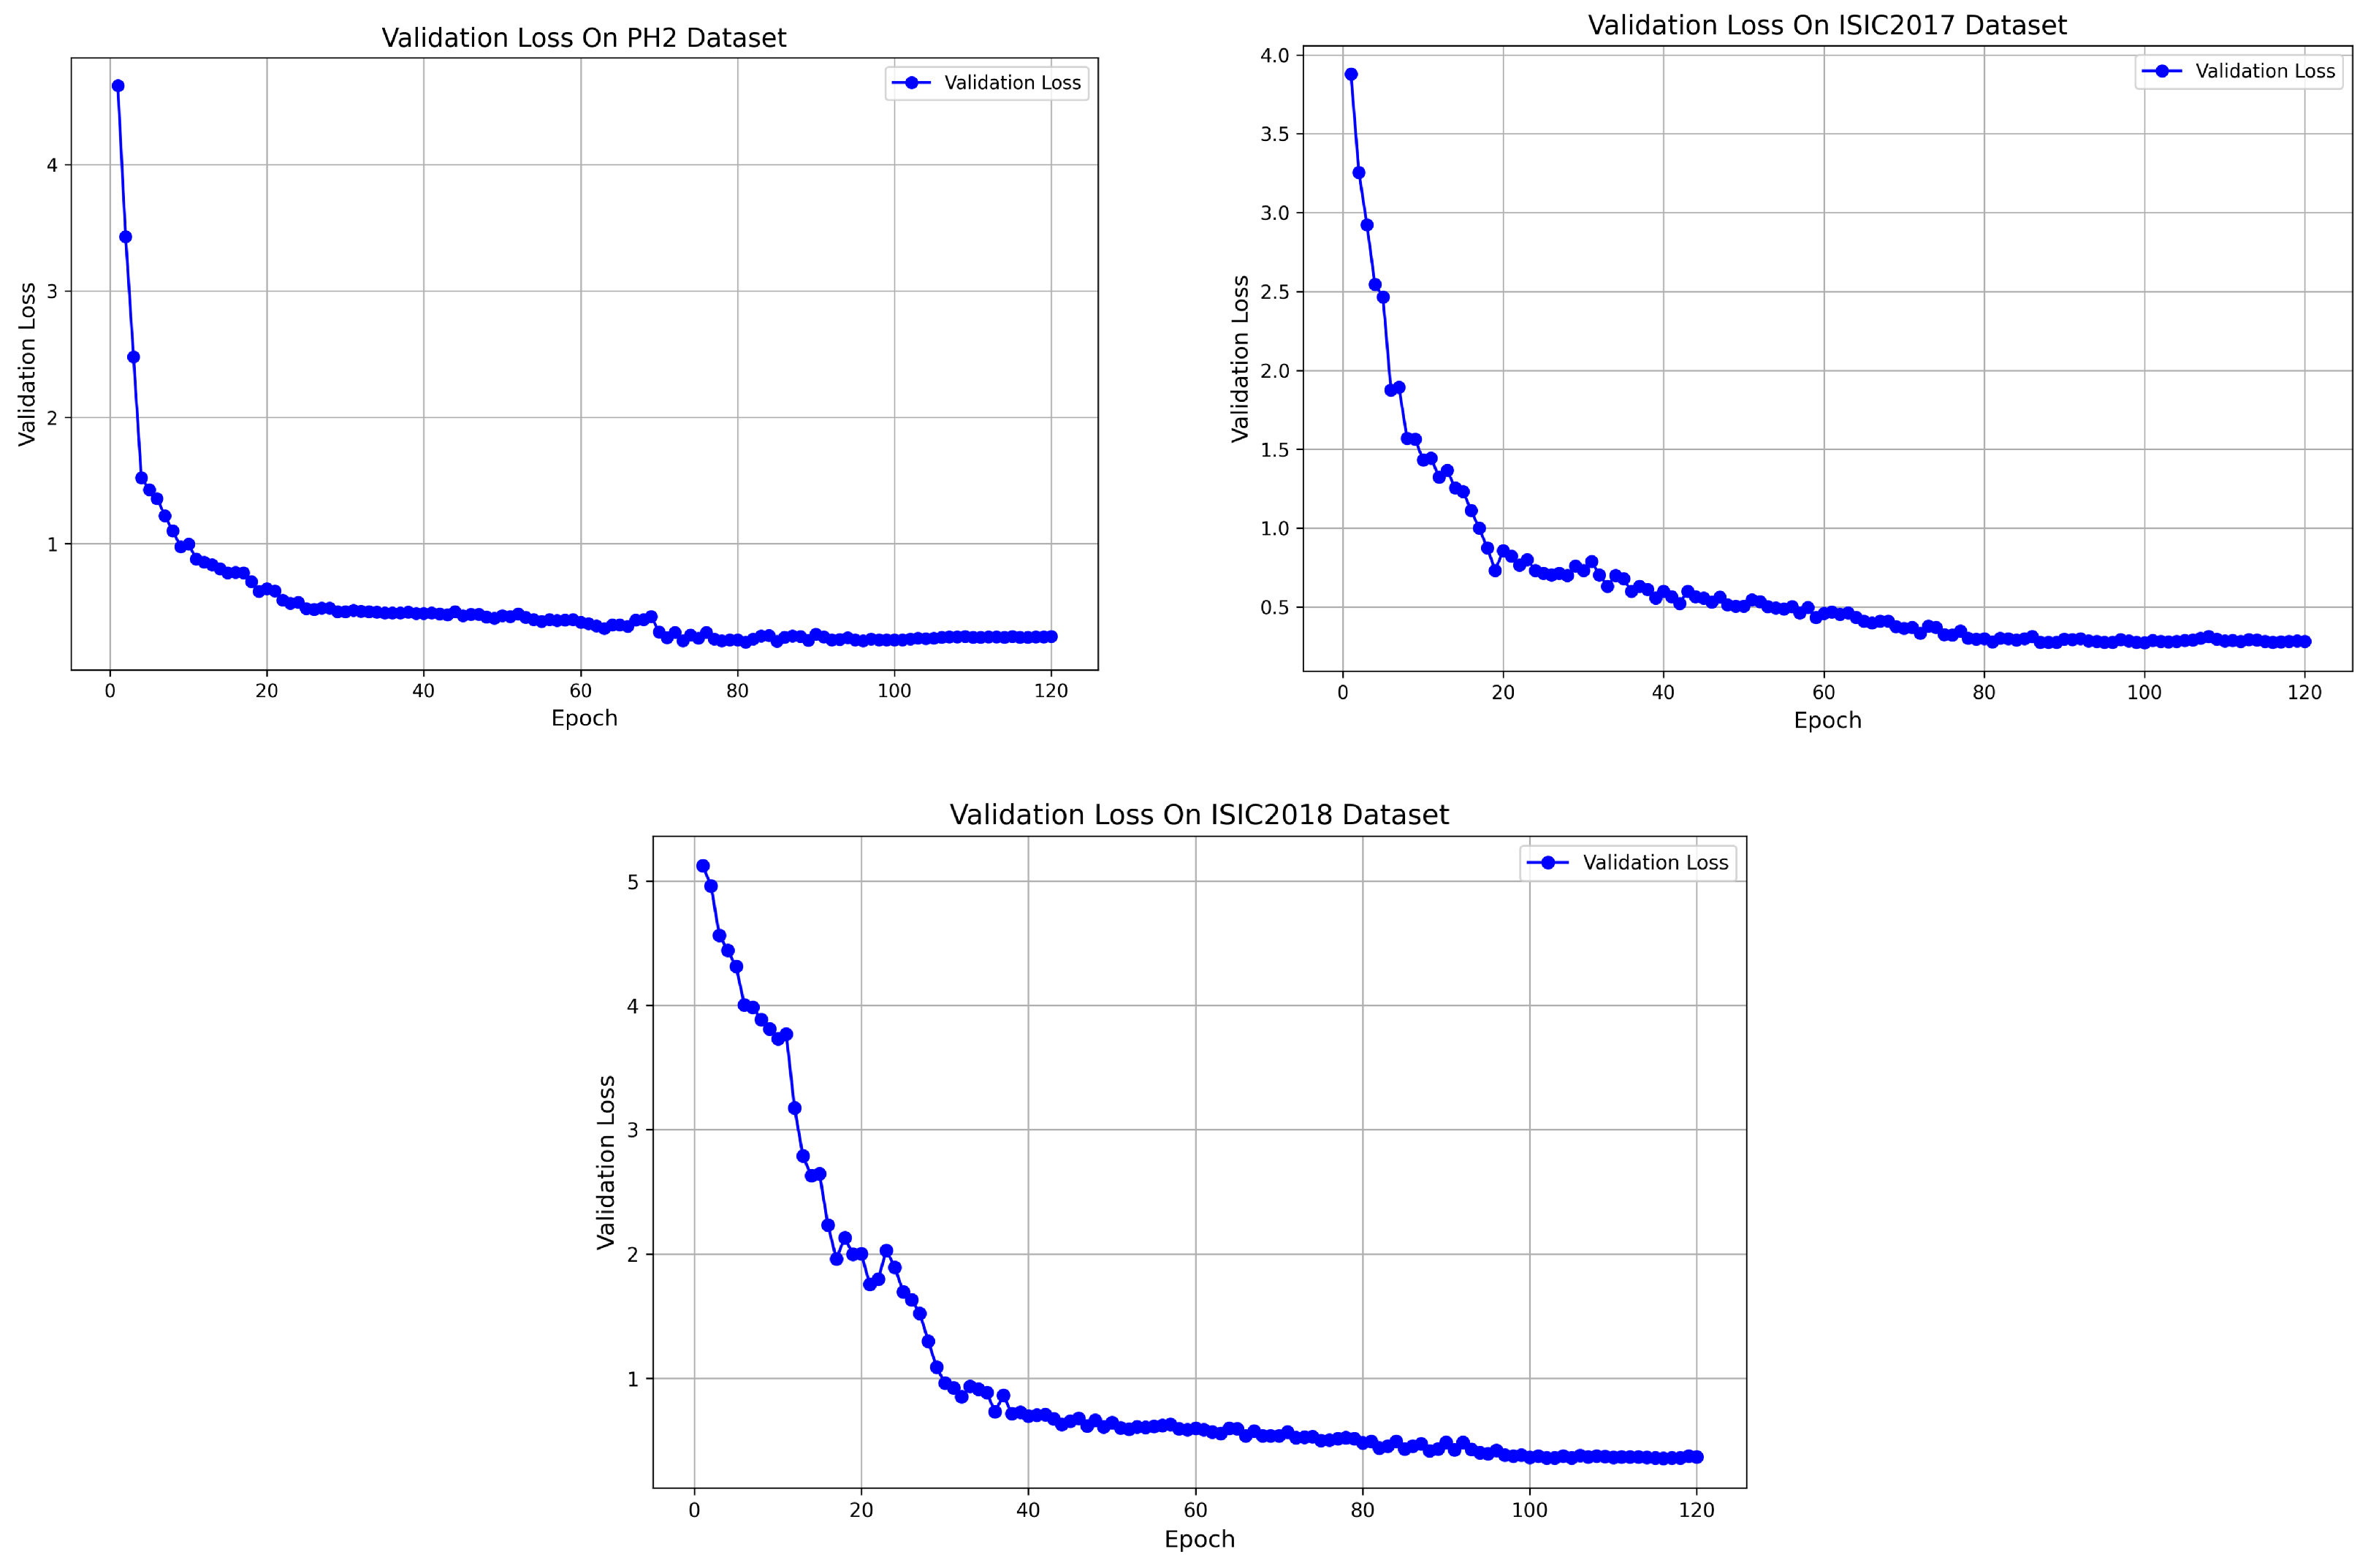
Figure 5 shows the convergence of the loss function for the model on three different datasets (PH2, ISIC 2017, and ISIC 2018). From the figure, it can be observed that the loss function exhibits a stable decreasing trend on each dataset. On the PH2 dataset, the loss function converges within 80 epochs. While on the ISIC 2017 and ISIC 2018 datasets, it converges, respectively, within 100 epochs. These results indicate that despite differences between the datasets, the model effectively converges during training on each dataset. The loss value gradually decreases and stabilizes throughout the process. Overall, these convergence trends validate the high stability and consistency of the training process across different datasets, which further confirms the reliability of BAG-Net.
To comprehensively evaluate the performance of BAG-Net, several classical networks were selected as comparison models. Their performance in medical image segmentation tasks was focused on. The comparison metrics include Dice Similarity Coefficient (DSC), Sensitivity, Specificity, and Accuracy, which together provide a comprehensive assessment of the model’s segmentation capability and practical value. In terms of the experimental setup, publicly available datasets that contain various skin lesion images, such as ISIC 2017, ISIC 2018, and PH2, were used. Each network was trained and evaluated using a common training process and evaluation standards. All models were trained and tested in the same hardware environment to ensure the fairness of the comparison results. Experimental results are presented in
Table 4,
Table 5 and
Table 6.
Table 4,
Table 5 and
Table 6 provide a detailed comparison of the image segmentation performance of the proposed BAG-Net and other networks. According to the experimental results in
Table 4, the segmentation performance of BAG-Net on the ISIC 2017 dataset is particularly outstanding. Its Dice Similarity Coefficient (DSC), Sensitivity, and Accuracy are surpassed by all comparison networks. Although Fat-Net [
39] slightly outperforms BAG-Net in terms of specificity, the overall evaluation results indicate that superior segmentation performance is demonstrated by BAG-Net on this dataset. This highlights its stronger capability in medical image segmentation tasks.
Table 5 and
Table 6 further validate the performance of BAG-Net. On the ISIC 2018 and PH2 datasets, BAG-Net also achieved satisfactory segmentation results. These results not only highlight the excellent ability of the global attention mechanism and boundary self-attention mechanism in modeling long-range contextual dependencies but also validate the effectiveness of our proposed three-component feature fusion strategy. SEU-Net, which is embedded in the PSB component, was extracted, and segmentation experiments were conducted with it as an independent network to evaluate its performance. Experimental results show that SEU-Net, with its simple and efficient structure, achieved a specificity of 0.9816 on the PH2 dataset. It ranked first among all comparison networks. Its potential in medical image segmentation tasks is highlighted. Notably, strong competitiveness is demonstrated by SEU-Net across all three datasets, and it is not only suitable for embedding into specific networks but also has broad adaptability and application prospects. In consequence, these results provide solid support for our proposed network architecture and methods, suggesting their promising potential in the field of medical image segmentation. For the newly proposed U-Net variant SEU-Net, experimental results validate the effectiveness of its structure and demonstrate its outstanding performance in medical image segmentation tasks. This finding provides valuable insights for future research on further improvements to the U-Net structure. Although BAG-Net has demonstrated excellent performance in skin lesion segmentation, its segmentation performance in other domains cannot be fully guaranteed since the datasets used in our experiments consist solely of skin lesion images. This implies that BAG-Net may not achieve the same level of segmentation accuracy when applied to other types of images, such as organs, tumors, or natural images. As a result, this study has certain limitations. To address this issue, future research will focus on extending BAG-Net to a wider range of image segmentation tasks to comprehensively evaluate its performance and implement necessary optimizations. By testing BAG-Net on different types of segmentation tasks, we aim to enhance its adaptability and robustness across multiple domains, promoting its broader application beyond medical image segmentation.
When improving model segmentation performance through a hybrid structure, one often faces the issue of high computational overhead. The proposed BAG-Net in this paper integrates three components, which results in a relatively complex structure. While the model’s performance is improved, we also tested the model’s computational overhead and parameter count. In the tests, we assumed that the input tensor shape for the model is (256, 256, 3).
Table 7 presents the parameter values and Floating Point Operations Per Second (FLOPs) for different models. As shown in
Table 7, although BAG-Net’s parameter count and FLOPs are higher compared with U-Net, it still has certain advantages in terms of saving computational overhead when compared with common image segmentation models.
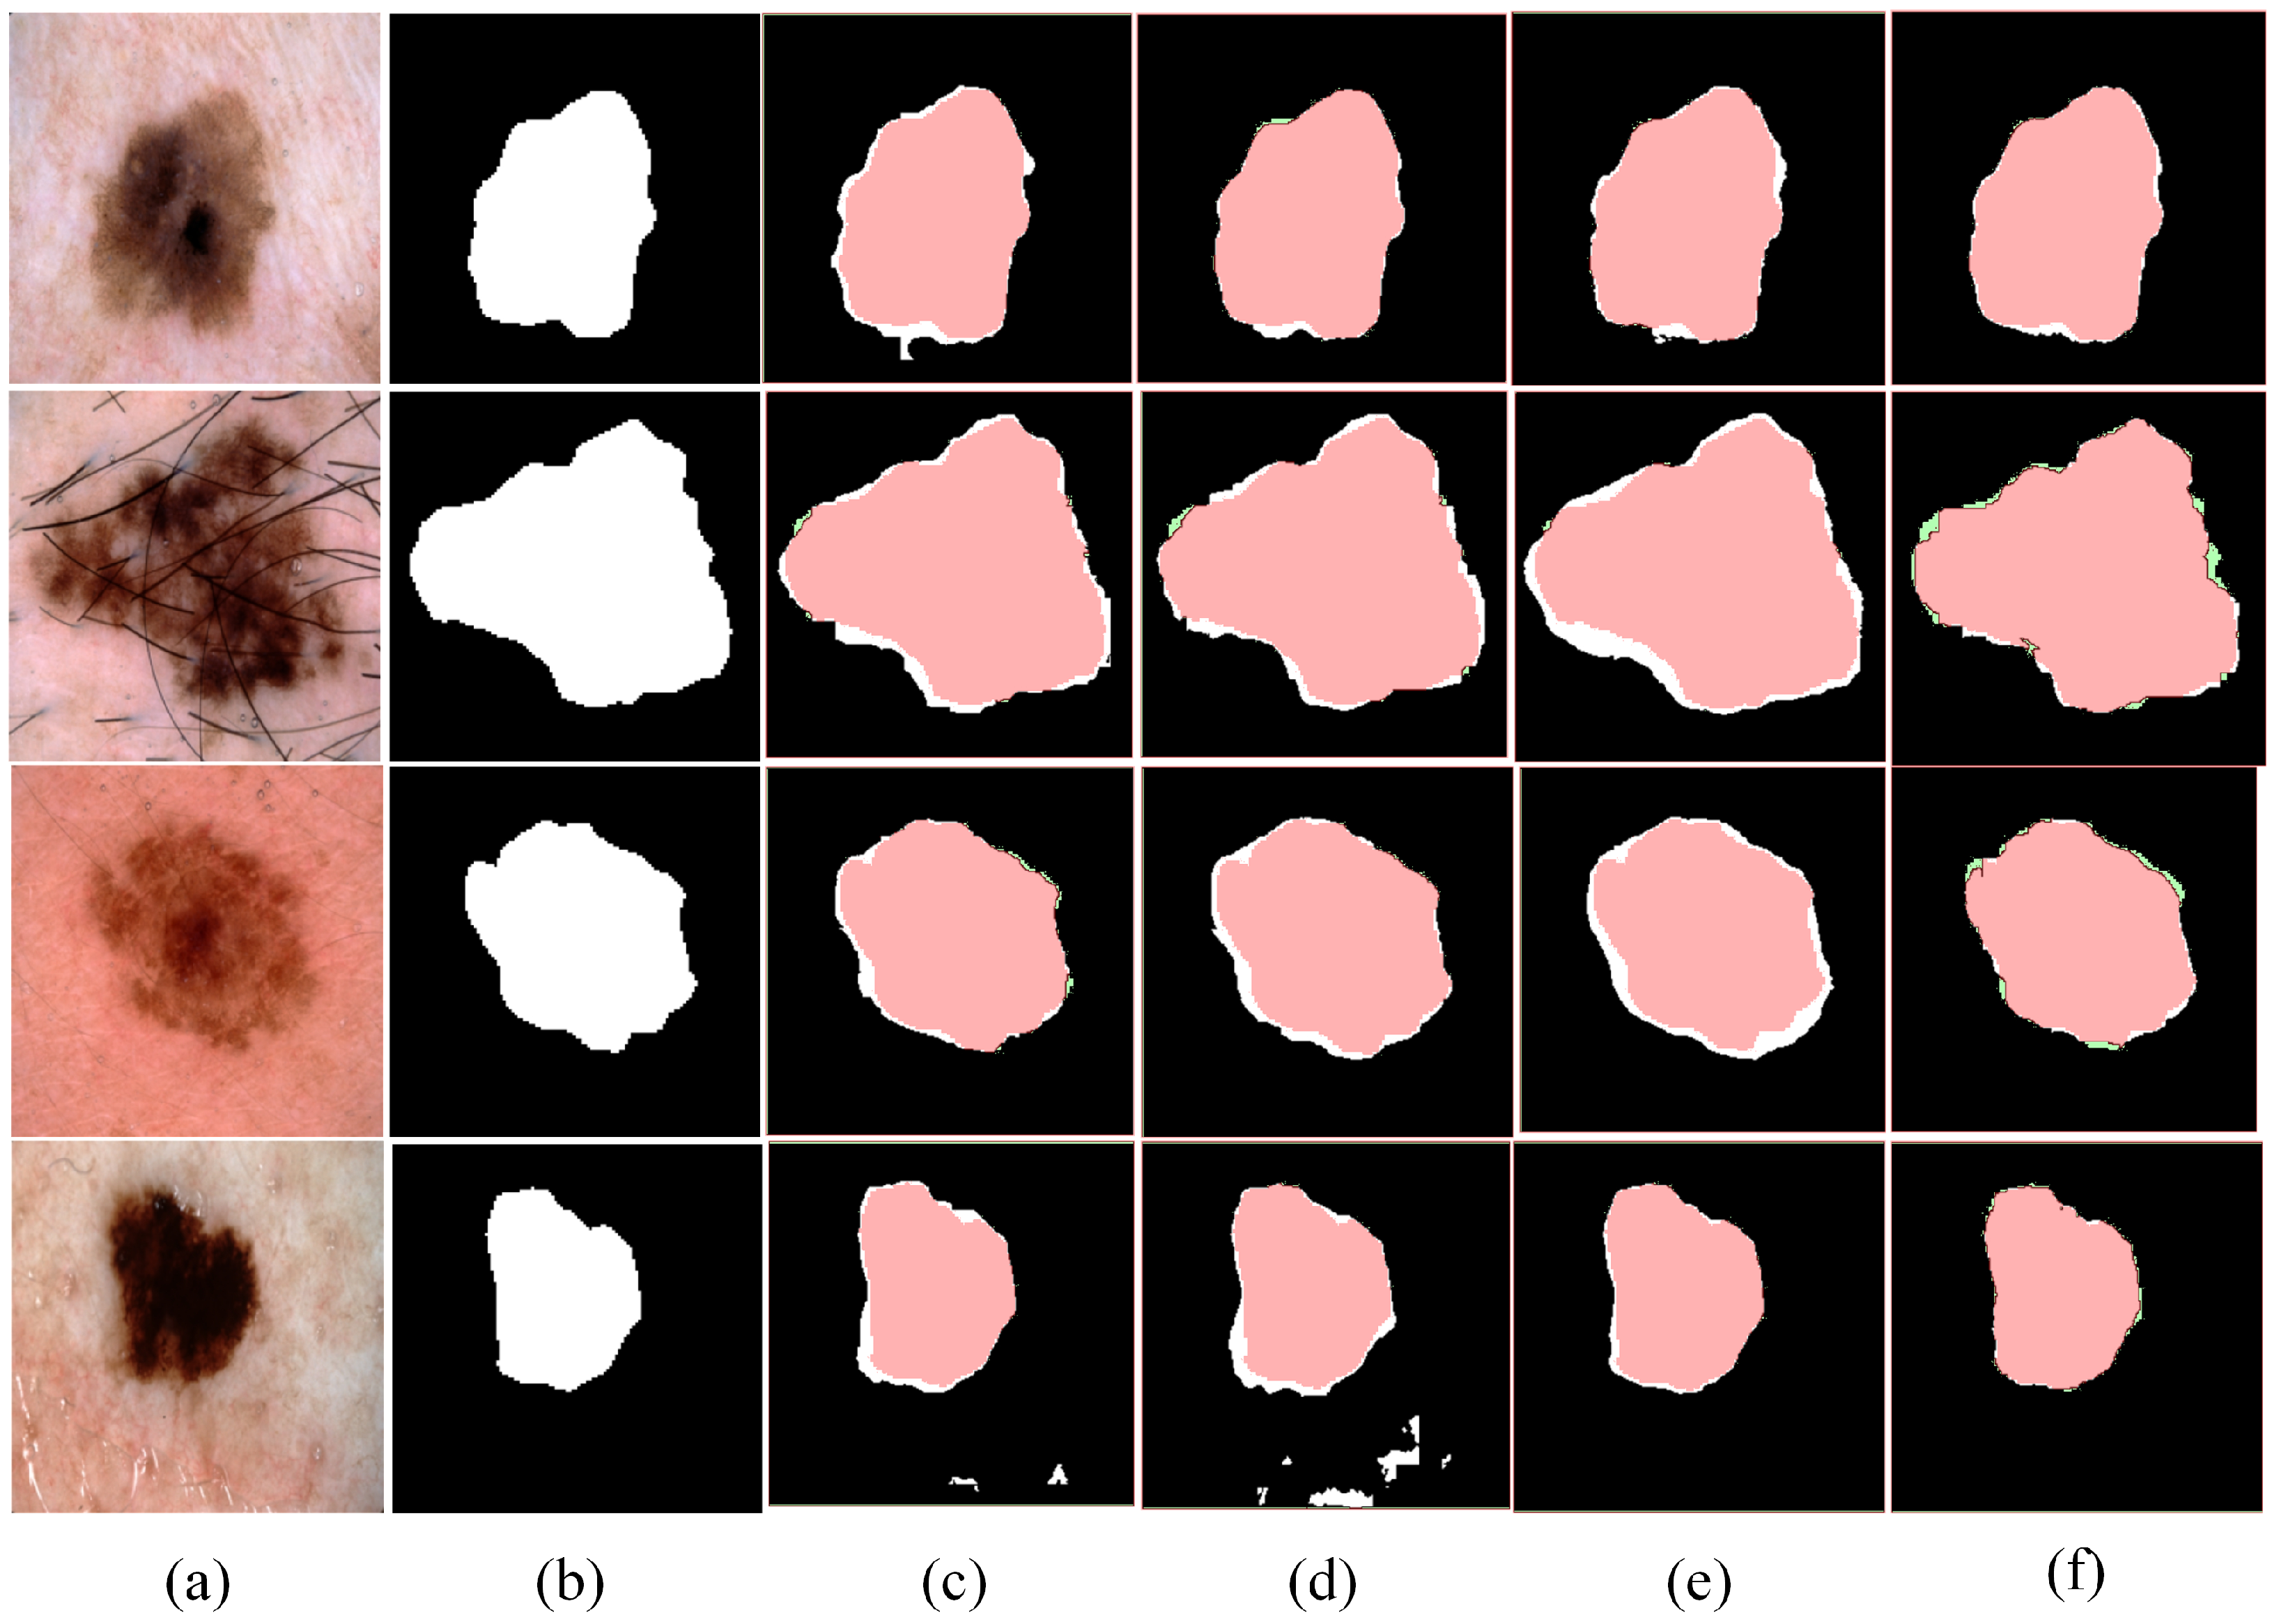
To evaluate the performance of the method proposed in this paper for skin lesion segmentation tasks, we conducted a systematic comparison of its segmentation performance with other models.
Figure 6 clearly illustrates the segmentation results of different models, emphasizing the significant differences in segmentation accuracy and detail preservation. In comparison, the method proposed in this paper demonstrates exceptional segmentation performance. On the one hand, it significantly outperforms other models in boundary segmentation accuracy with clearer segmentation results and boundaries that more accurately match the true contours. On the other hand, in complex scenarios, the proposed method handles intricate structures with greater precision. Particularly in small object detection tasks, it exhibits remarkable performance. It substantially reduces false negatives and false positives, which further validates the superiority of the BAG-Net architecture.
BAG-Net consists of three main components. To experimentally assess the contribution of each component to the model’s segmentation performance, we designed an ablation experiment. Specifically, each component was removed individually, and segmentation experiments were performed on the ISIC 2018 dataset. Each experiment was run for 120 epochs using the Adam optimizer, with a learning rate set to 0.0001 and a batch size of 32. Experimental results are presented in
Table 8, which shows the effect of each component on the overall segmentation performance.
Experimental results in
Table 8 indicate that removing any component significantly affects the model’s segmentation performance. Among these, removing the PSB component has the most pronounced impact on overall performance. This result underscores the crucial role of the PSB component in the model while also showing the superiority of SEU-Net. Experiment demonstrates that the PSB component not only enhances the model’s performance but also plays a vital role in the overall architecture.
To further validate the importance of the three components in BAG-Net, we conducted a visual analysis of the model’s segmentation performance after removing each component. These visual results reinforce the experimental evidence. And they also provide a more intuitive perspective for understanding the specific contribution of each component to the segmentation task. Segmentation results are presented in
Figure 7.
According to the visual results, the model’s performance significantly decreases after removing any component. Specifically, the model shows reduced capability in predicting boundary contours and extracting image features. Furthermore, the model exhibits more false positive predictions with some background areas being incorrectly labeled as targets when the PSB or BSA component is removed. The experimental results further validate the importance of each component in BAG-Net and support the effectiveness of our proposed three-component fusion structure.


