4.1. Dataset
In order to validate the effectiveness and generalization ability of the proposed intrusion detection model, three representative datasets are selected in this paper: the NSL-KDD, the CSE-CIC-IDS2018, and the TON-IoT. These datasets cover traditional attack scenarios, modern cyber threats, and IoT environments, thereby ensuring the stability and adaptability of the model in multiple application scenarios.
The NSL-KDD dataset [
43] is a revised version of the widely known KDD99 dataset, encompassing four different types of attacks: DoS, Probe, U2R, and R2L. It consists of four sub-datasets, with the full training set containing 308,071 records and the full test set containing 28,954 records. Each dataset includes 43 features, 41 of which pertain to the traffic input itself, while the remaining two are related to labels and levels. We use this dataset to evaluate the model’s ability to detect traditional structured network attack scenarios, providing a benchmark for subsequent model performance comparisons.
The CICIDS2018 dataset [
44] was developed under the guidance of the Canadian Institute for Cybersecurity Research. It consists of network traffic data collected over five consecutive days, during which multiple cyber-attacks and normal traffic were simulated in a controlled experimental environment. The dataset is highly realistic and diverse, with each entry containing detailed characteristics of the network traffic, including packet sizes, protocol types, and source and destination IP addresses. In total, this dataset includes fifteen distinct attack scenarios, and over seventy features were extracted using CICFlowMeter-V3. We use this dataset to examine the performance of the model in the face of modern sophisticated network attacks (e.g., DDoS, brute force, penetration attacks, etc.).
The TON-IoT dataset [
45,
46,
47,
48,
49,
50,
51,
52] is a next-generation dataset designed for evaluating the accuracy and efficiency of AI-based cybersecurity applications in the context of Industry 4.0 and the Industrial Internet of Things (IIoT). It leverages a variety of IoT and IIoT sensors to capture and record telemetry data. Based on the design of interactive network elements and IoT systems, the dataset covers a three-layer architecture, including edge computing, fog computing, and cloud computing. This structure enables the simulation of real-world IoT networks in production environments. We downloaded heterogeneous data sources collected from the Windows 10 operating system, which were then processed and filtered to generate standard features and labels, making the dataset more accessible for research purposes. Following the implementation of the feature alignment and normalization process, the generalization capability of the model in IoT heterogeneous environments is verified, with particular emphasis on its robustness in the presence of significant device-level data diversity.
For the above dataset, a data preprocessing process is used in this paper, which includes One-Hot coding of the category features, the min-max normalization process, and category balancing operation when necessary. Through the aforementioned joint validation of multi-source datasets, the paper demonstrates the adaptability and effectiveness of the proposed method under different network environments and attack types.
4.2. Data Processing
In the data preprocessing phase, we first conducted data cleaning to ensure the quality of the dataset by addressing outliers and missing values. For the NSL-KDD dataset, we began by applying one-hot encoding to non-numeric data and numeric features with values greater than 100, converting these features into multi-dimensional binary vector representations. For numeric features with values less than 100, we applied Min-Max normalization, scaling the values to a uniform range of [0, 1].
For the CICIDS2018 dataset, we first numerically normalized the Timestamp feature, converting it into a usable numeric form for modeling purposes. We then applied standard normalization across all features to ensure that they had a consistent scale during model training, thus minimizing any potential impact of scale discrepancies on model performance.
For the ToN-IoT dataset, which was already preprocessed and normalized upon official release, our main preprocessing steps involved removing samples with missing values to ensure data integrity. Subsequently, for numerical features, we applied Min-Max normalization to scale the feature values within the range of [0, 1], addressing the impact of differing magnitudes on model training. We selected the TYPE column as the target label for the supervised learning task and extracted it for model training. To avoid redundancy, we removed the label column from the dataset.
Given the notable class imbalance present in some datasets, we employed the SMOTETomek method [
53] for comprehensive sampling. This technique first uses SMOTE (Synthetic Minority Over-sampling Technique) to oversample the underrepresented classes by generating synthetic samples. Following this, the Tomek Link method is applied to identify and remove pairs of samples that are close to each other but belong to different classes. This combination effectively balances the class distribution, increasing the number of samples for minority classes while also optimizing the dataset’s boundary structure. As a result, the classification model’s stability and accuracy during training are improved. Furthermore, we found that this method significantly improves the accuracy of the training set, while the improvement in the accuracy of the test set is relatively limited.
4.3. Data Visualization
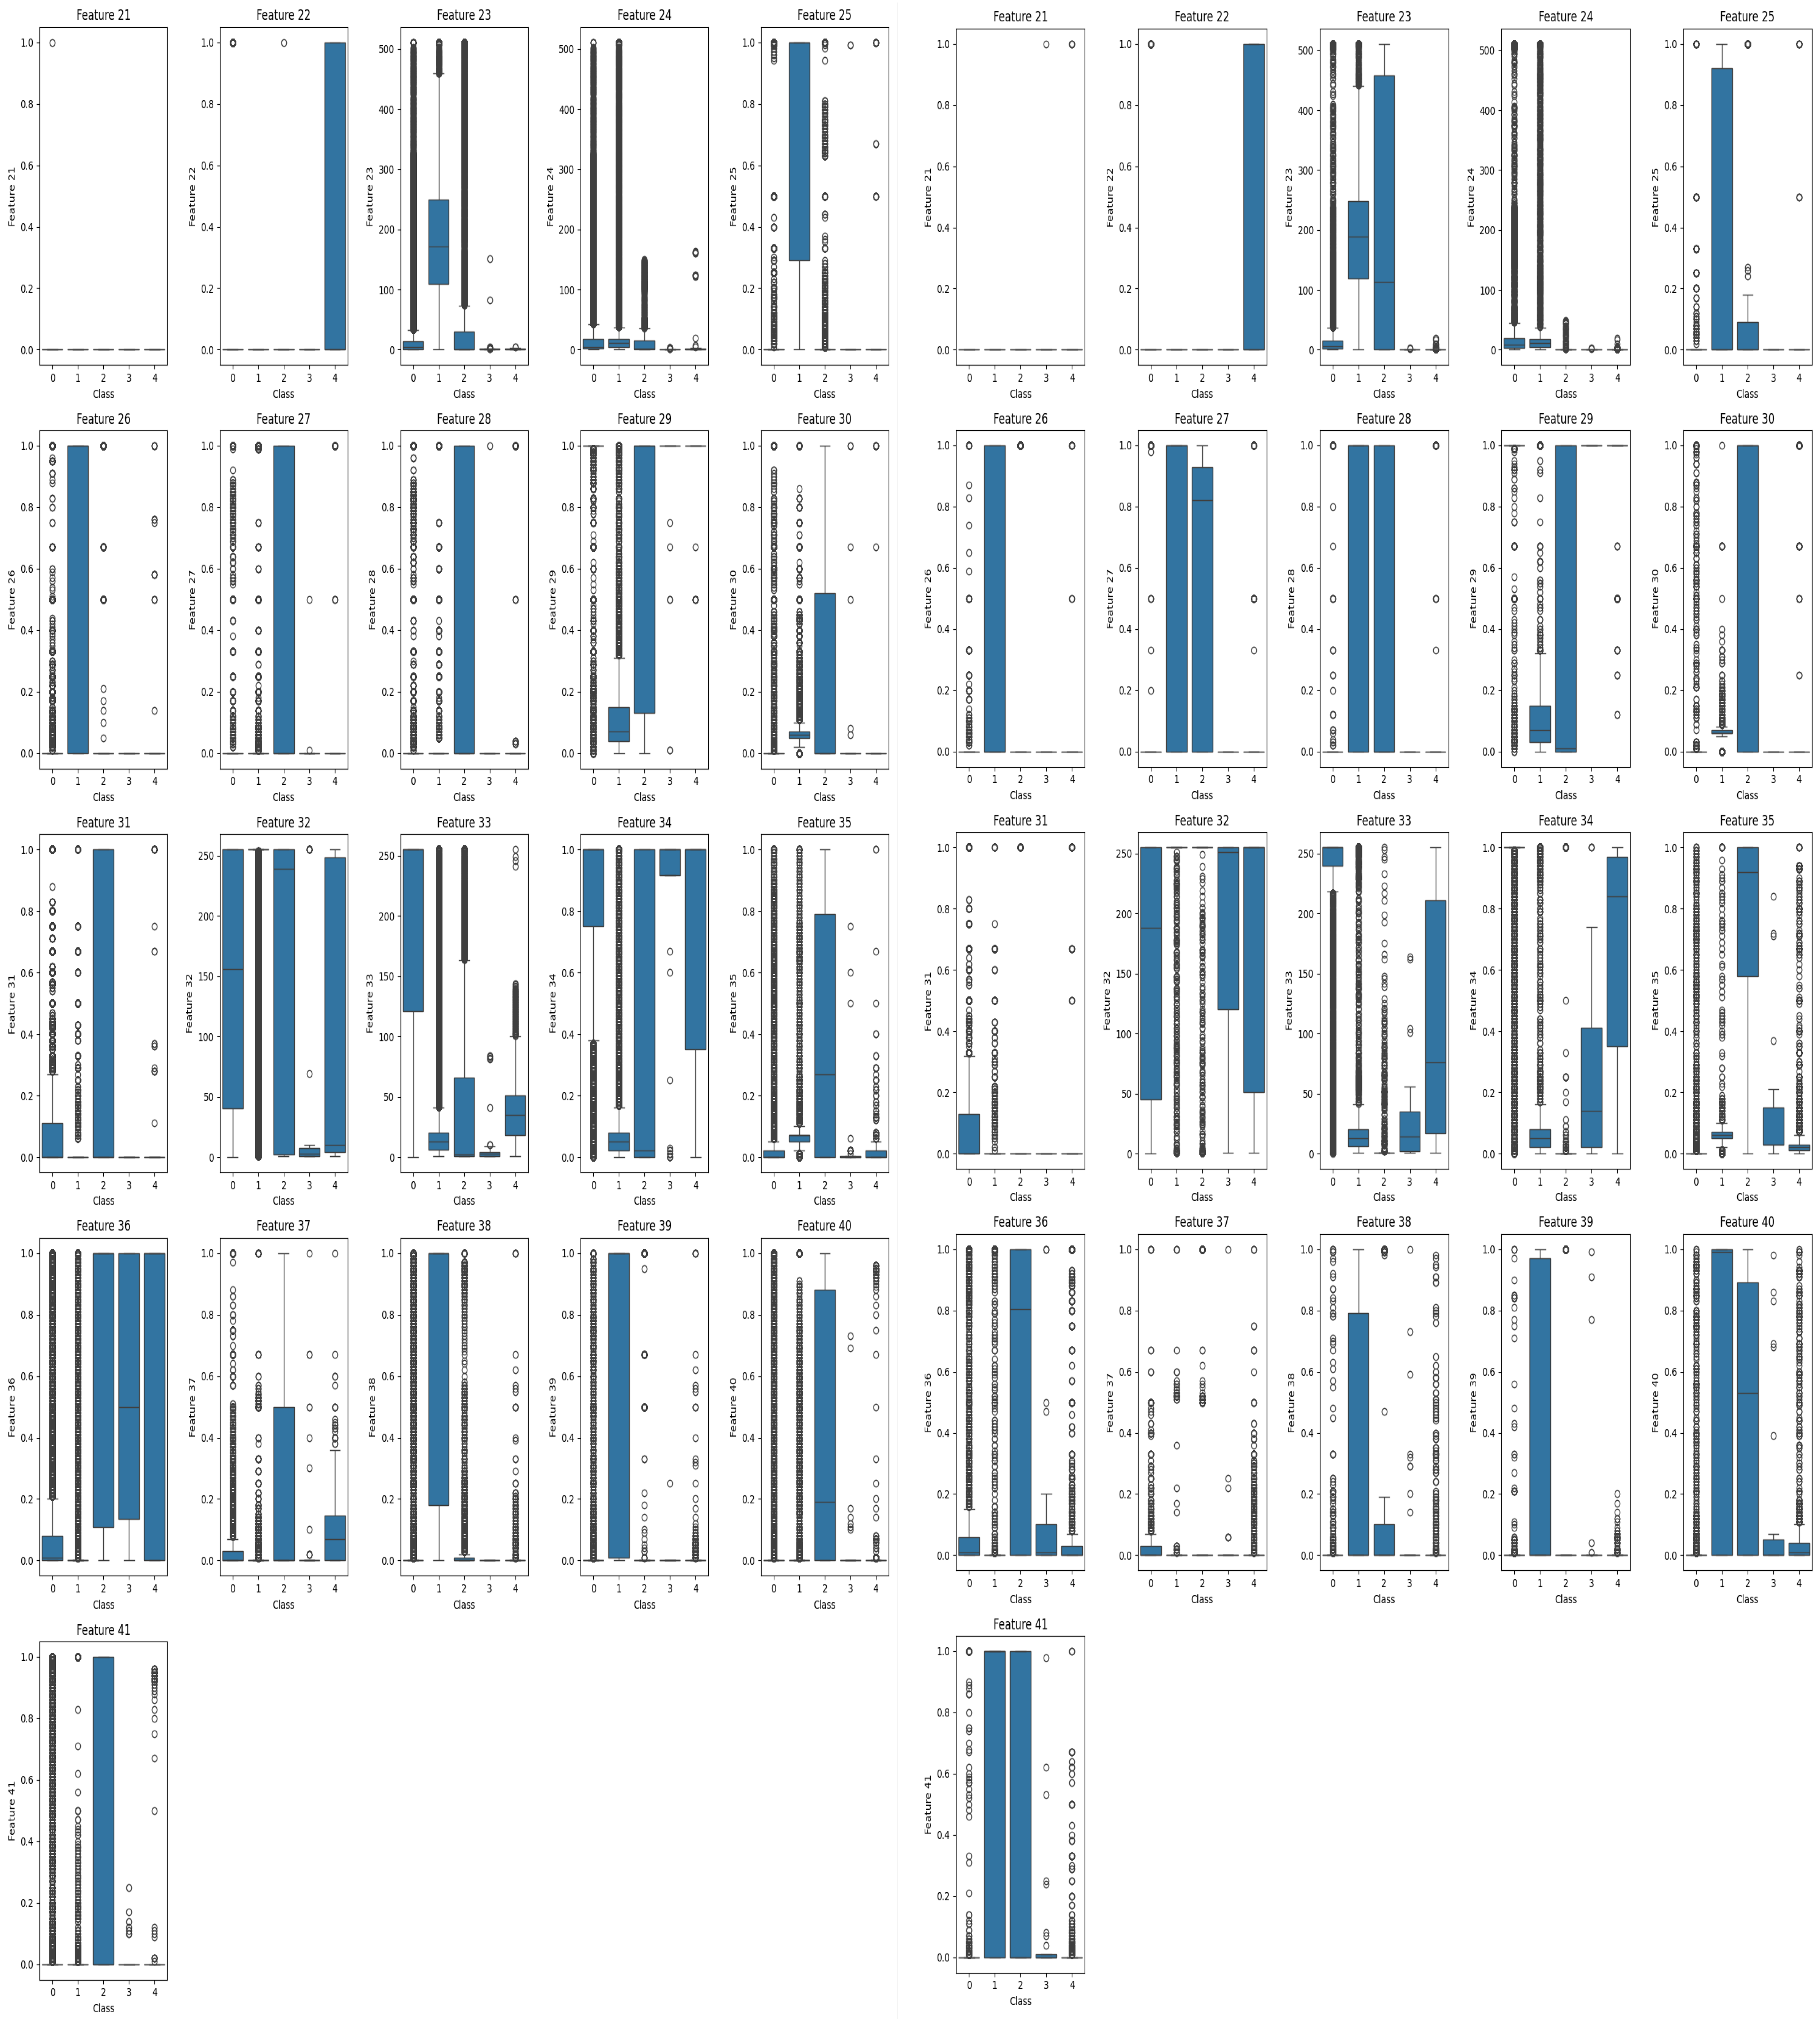
In IDS datasets, particularly the NSL-KDD dataset, a significant issue of class imbalance is evident, with the quantitative disparity between certain classes reaching tens of thousands. This imbalance leads to an asymmetric data distribution, which can negatively impact model generalization and detection performance. Although the original dataset is partitioned into training and test sets, our analysis using box plot visualizations reveals substantial discrepancies in the feature distributions between these sets, further exacerbating the asymmetry. Notably, features such as Feature 33, Feature 34, and Feature 36 exhibit pronounced differences in distribution across training and test sets, as shown in
Figure 5. To address this issue, ensuring a more symmetric data distribution is crucial for improving the robustness and reliability of model in intrusion detection.
This disparity introduces the risk of the model mislearning, particularly with respect to distinguishing between the “normal” class, the “u2r” (user to root) intrusion class, and the “r2l” (remote-to-local) attack class. Simply removing these features could lead to incomplete learning of certain categories, potentially affecting the overall accuracy of the model. To mitigate this bias, we chose to merge the training and test sets, then re-partition the dataset to ensure consistent data distribution, thereby improving the model’s learning process.
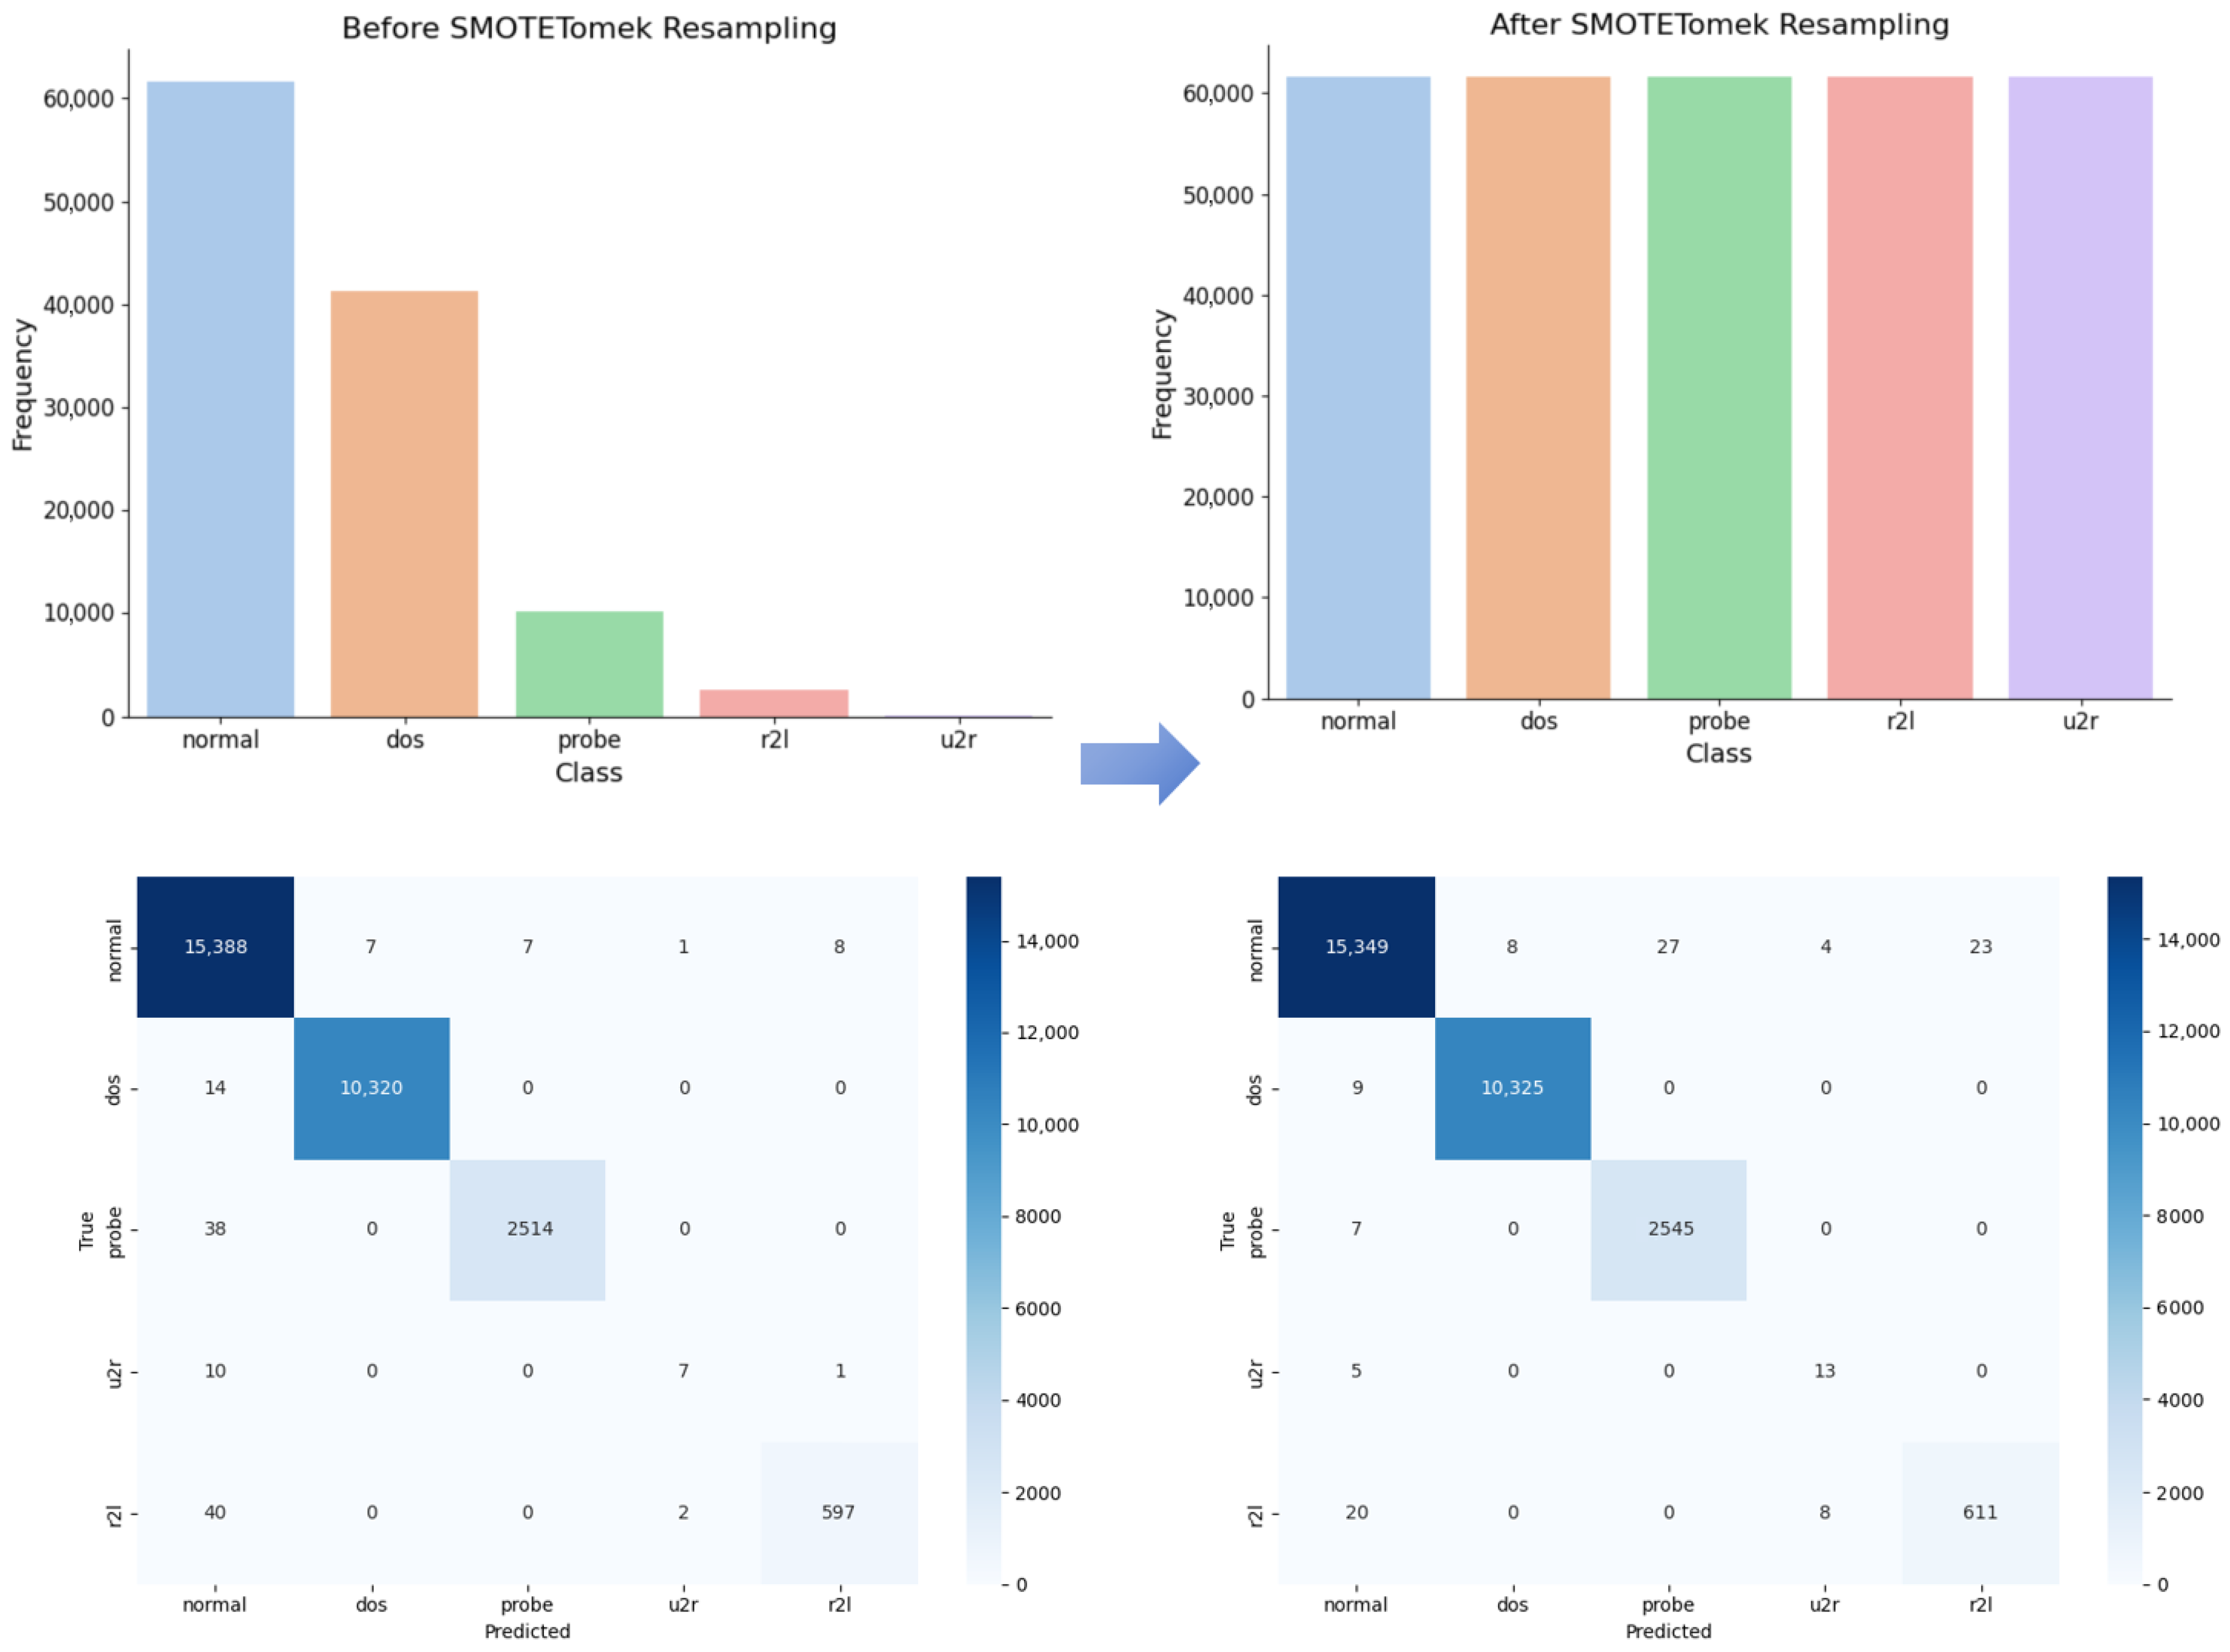
After re-segmenting the concatenated dataset and analyzing the feature distributions before and after applying SMOTETomek, we observed (as shown in
Figure 6) that the preprocessing step significantly enhances the symmetry of the data distribution, making the class distribution more balanced and uniform. This improvement ensures that the model is trained on a more representative dataset, thereby enhancing its generalization ability. However, for datasets with inherently imbalanced distributions, we recommend integrating additional data augmentation techniques to further improve model performance.
Furthermore, a comparison of the confusion matrices before and after sampling (as illustrated in
Figure 6) reveals a notable improvement in the detection accuracy of minority classes. Before applying SMOTETomek, the model tended to misclassify minority attack types as majority attack types, leading to low recall and precision, which negatively impacted the detection capability for low-frequency attack types. After applying SMOTETomek, the detection accuracy of minority classes significantly improved. This result indicates that a more symmetric data distribution contributes to a more balanced decision boundary, ultimately enhancing the overall detection performance of the model.
4.7. Comparison of SE-DWNet Performance with Other Models
In this experiment, we used the Adam optimizer with a learning rate set to 0.0005. The Adam optimizer is particularly well-suited for handling sparse data, as it adjusts the learning rates of individual parameters dynamically based on an adaptive mechanism. The NSL-KDD dataset, after undergoing SMOTETomek-integrated sampling, consists of five categories. The number of samples in each category after the integrated sampling process is 61,585, 61,621, 61,631, 61,628, and 61,606, respectively.
The model was trained over 100 epochs with a batch size of 1000. During each epoch, the optimal model parameters were recorded and the learning rate was maintained at 0.0005. The best performing model, as determined by the recorded parameters, was then used to evaluate the model performance through 5-fold cross-validation (K = 5).
For the loss function, we used focal loss, with the
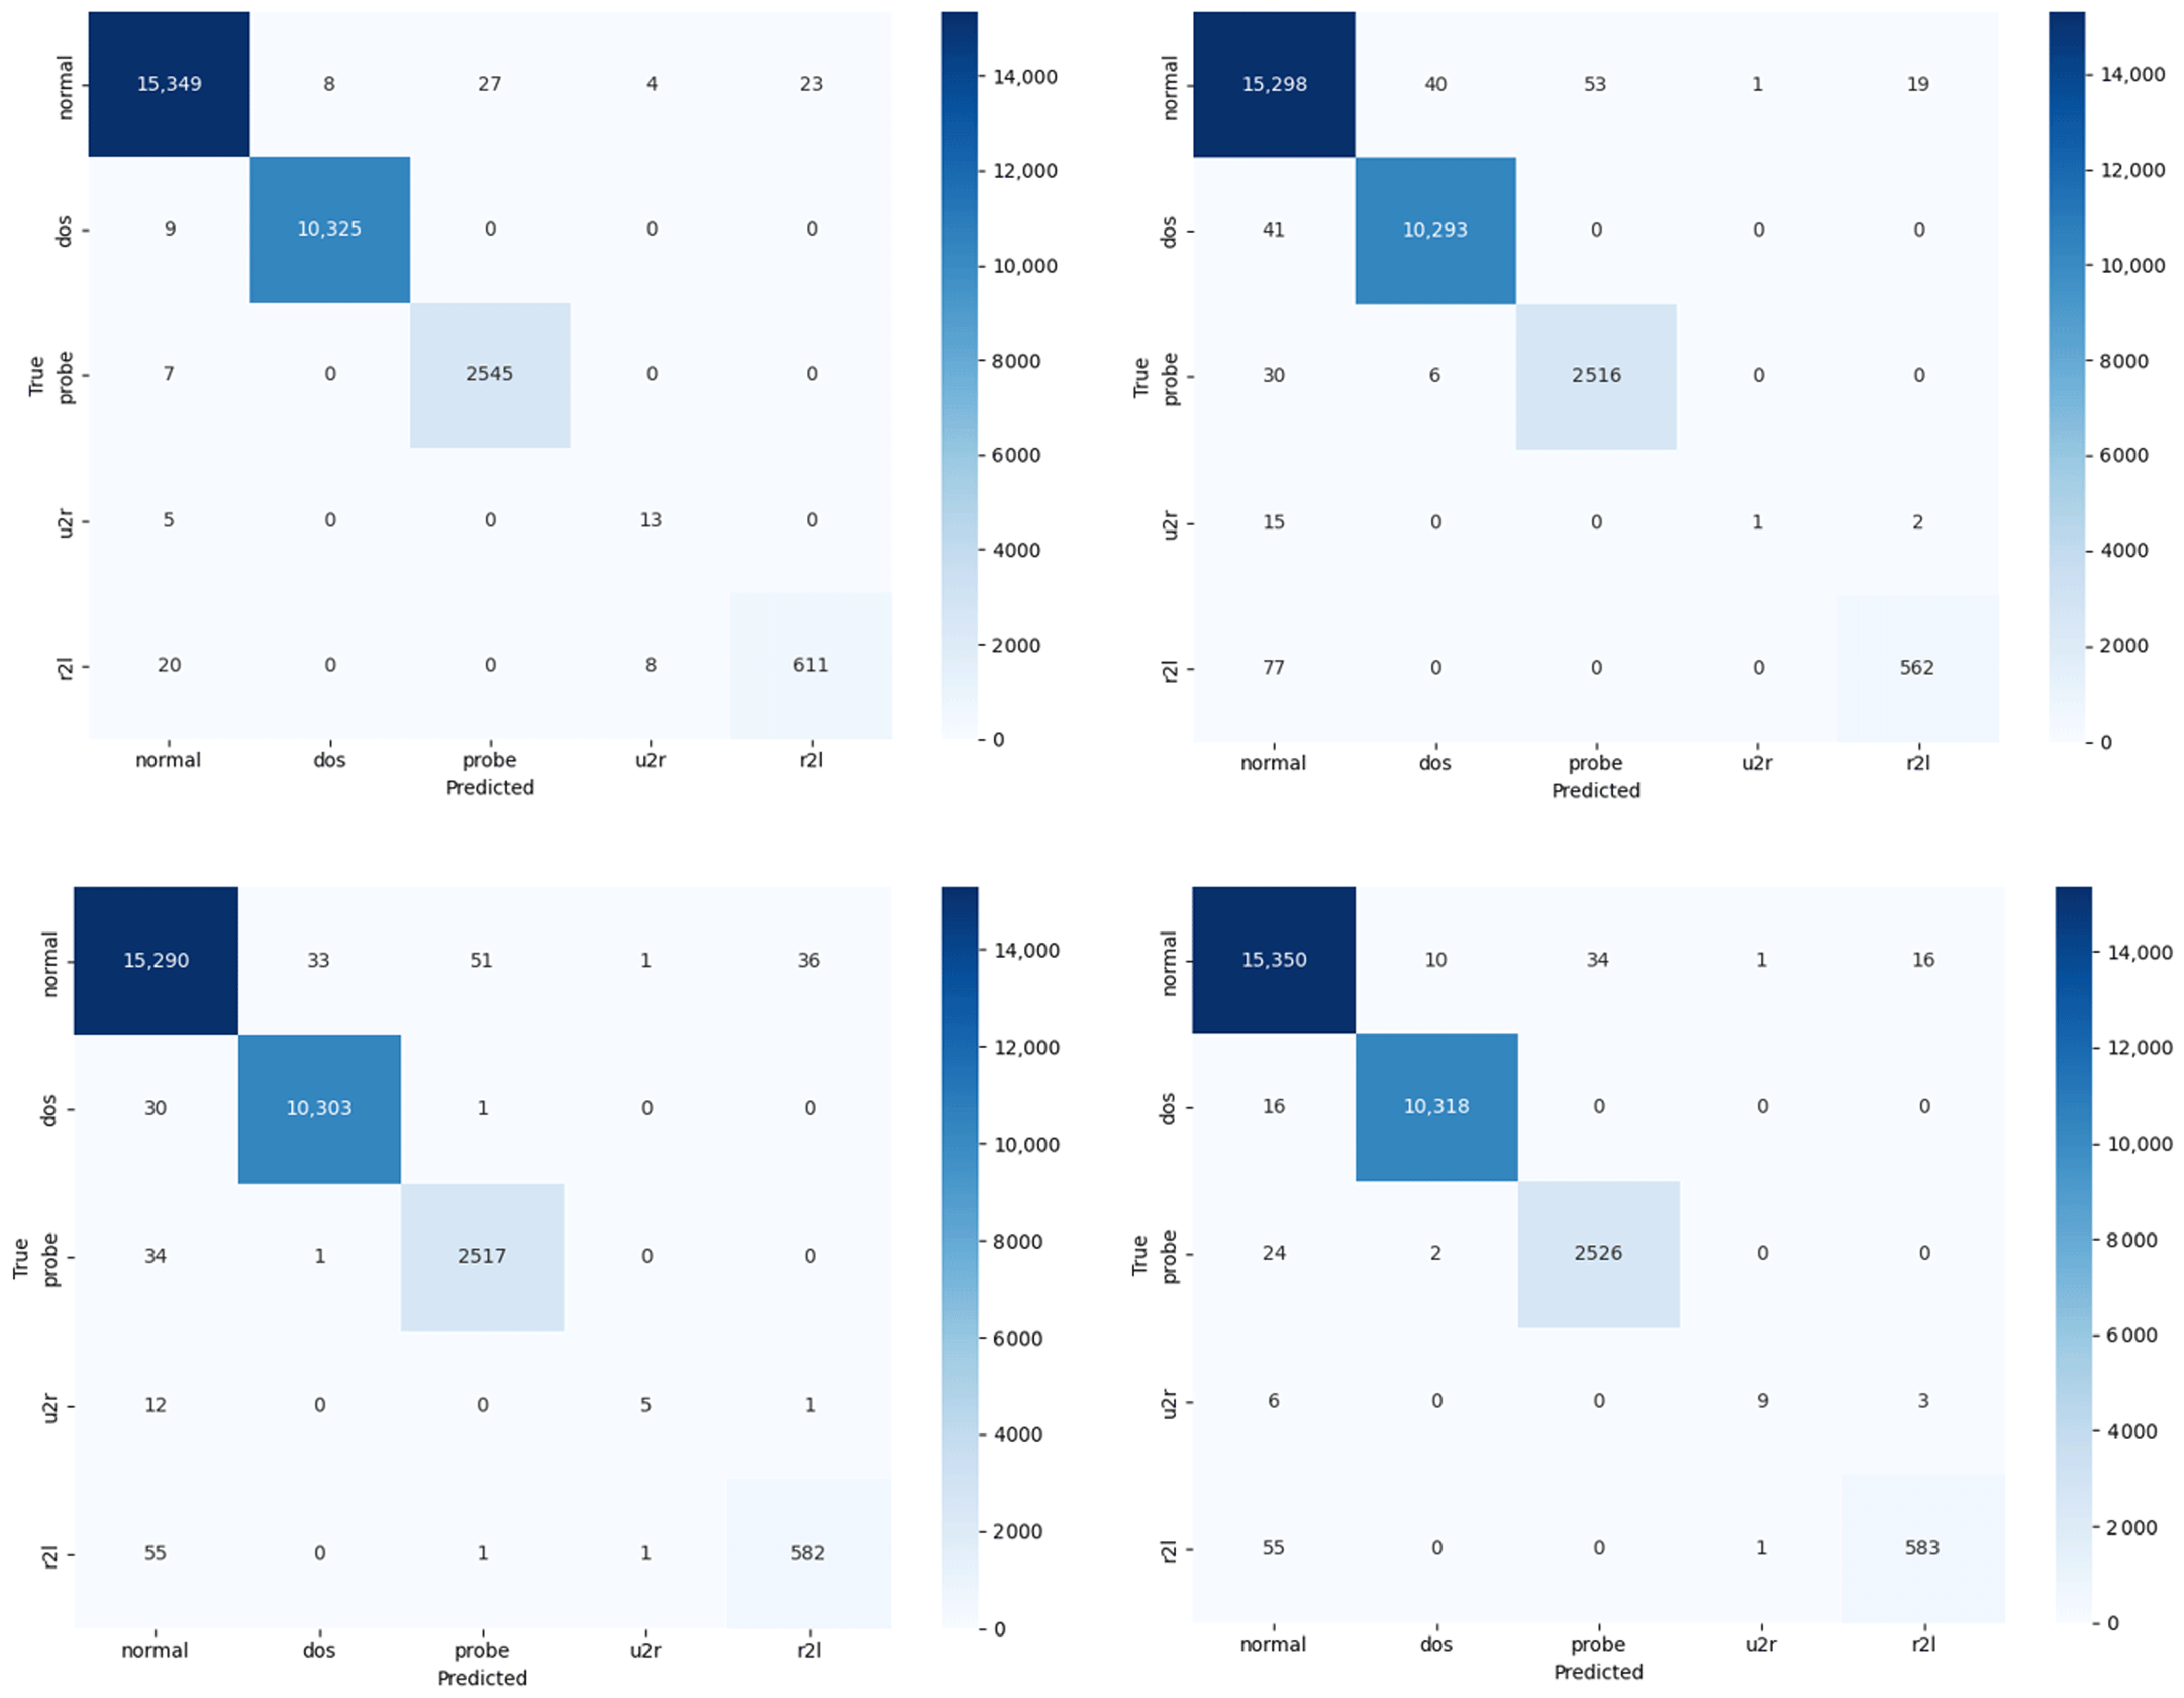
parameter set to 2, to address class imbalance by placing more emphasis on hard-to-classify instances. The final performance metrics are presented in
Table 3, and the corresponding confusion matrix is shown in
Figure 7. The results indicate that our model consistently outperforms the other models in all evaluation metrics.
In order to comprehensively evaluate the performance of the proposed model in the multiclassification intrusion detection task, this paper adopts a `one-to-many’ strategy for each category in the NSL-KDD dataset, as shown in
Table 4. The model attains near-perfect performances in the majority of the categories, particularly in the Normal, DoS, and Probe categories, as measured by the two metrics of AUC-ROC and AUC-PR. Notably, the model exhibits superior performance, especially in the Normal, DoS, and Probe categories. It is noteworthy that the model exhibits a substantial enhancement in identifying infrequent categories of attacks (e.g., U2R and R2L) in comparison to prevailing methodologies. This observation signifies that the residual attention mechanism and the integrated sampling strategy proposed in this study play a pivotal role in enhancing the model’s discriminative capability.
To construct a new dataset with both diversity and representativeness, we performed sample extraction and processing on the CICIDS2018 dataset. Given the large size of the dataset, we extracted a fixed number of samples from each category within each file. The number of extracted samples for each category is presented in
Table 5, which ensures balanced representation across all categories. Additionally, due to the large sample size of the `Benign’ category, we applied SMOTETomek for comprehensive sampling. Experimental results indicate that this hybrid sampling method improves model accuracy by approximately 4% for the training set, but does not show a significant effect on the test set. Consequently, in order to optimize computational efficiency, we decided not to use SMOTETomek hybrid sampling in this study.
After these preprocessing steps, the generated dataset includes multiple types of attack samples, ensuring both diversity and representativeness. To ensure the effectiveness of model training and evaluation, we conducted 800 training rounds with a batch size of 1000, allowing for more efficient handling of large datasets in each iteration. The sampled training set contains 118,990 instances, while the test set consists of 4571 instances, covering a total of 15 categories.
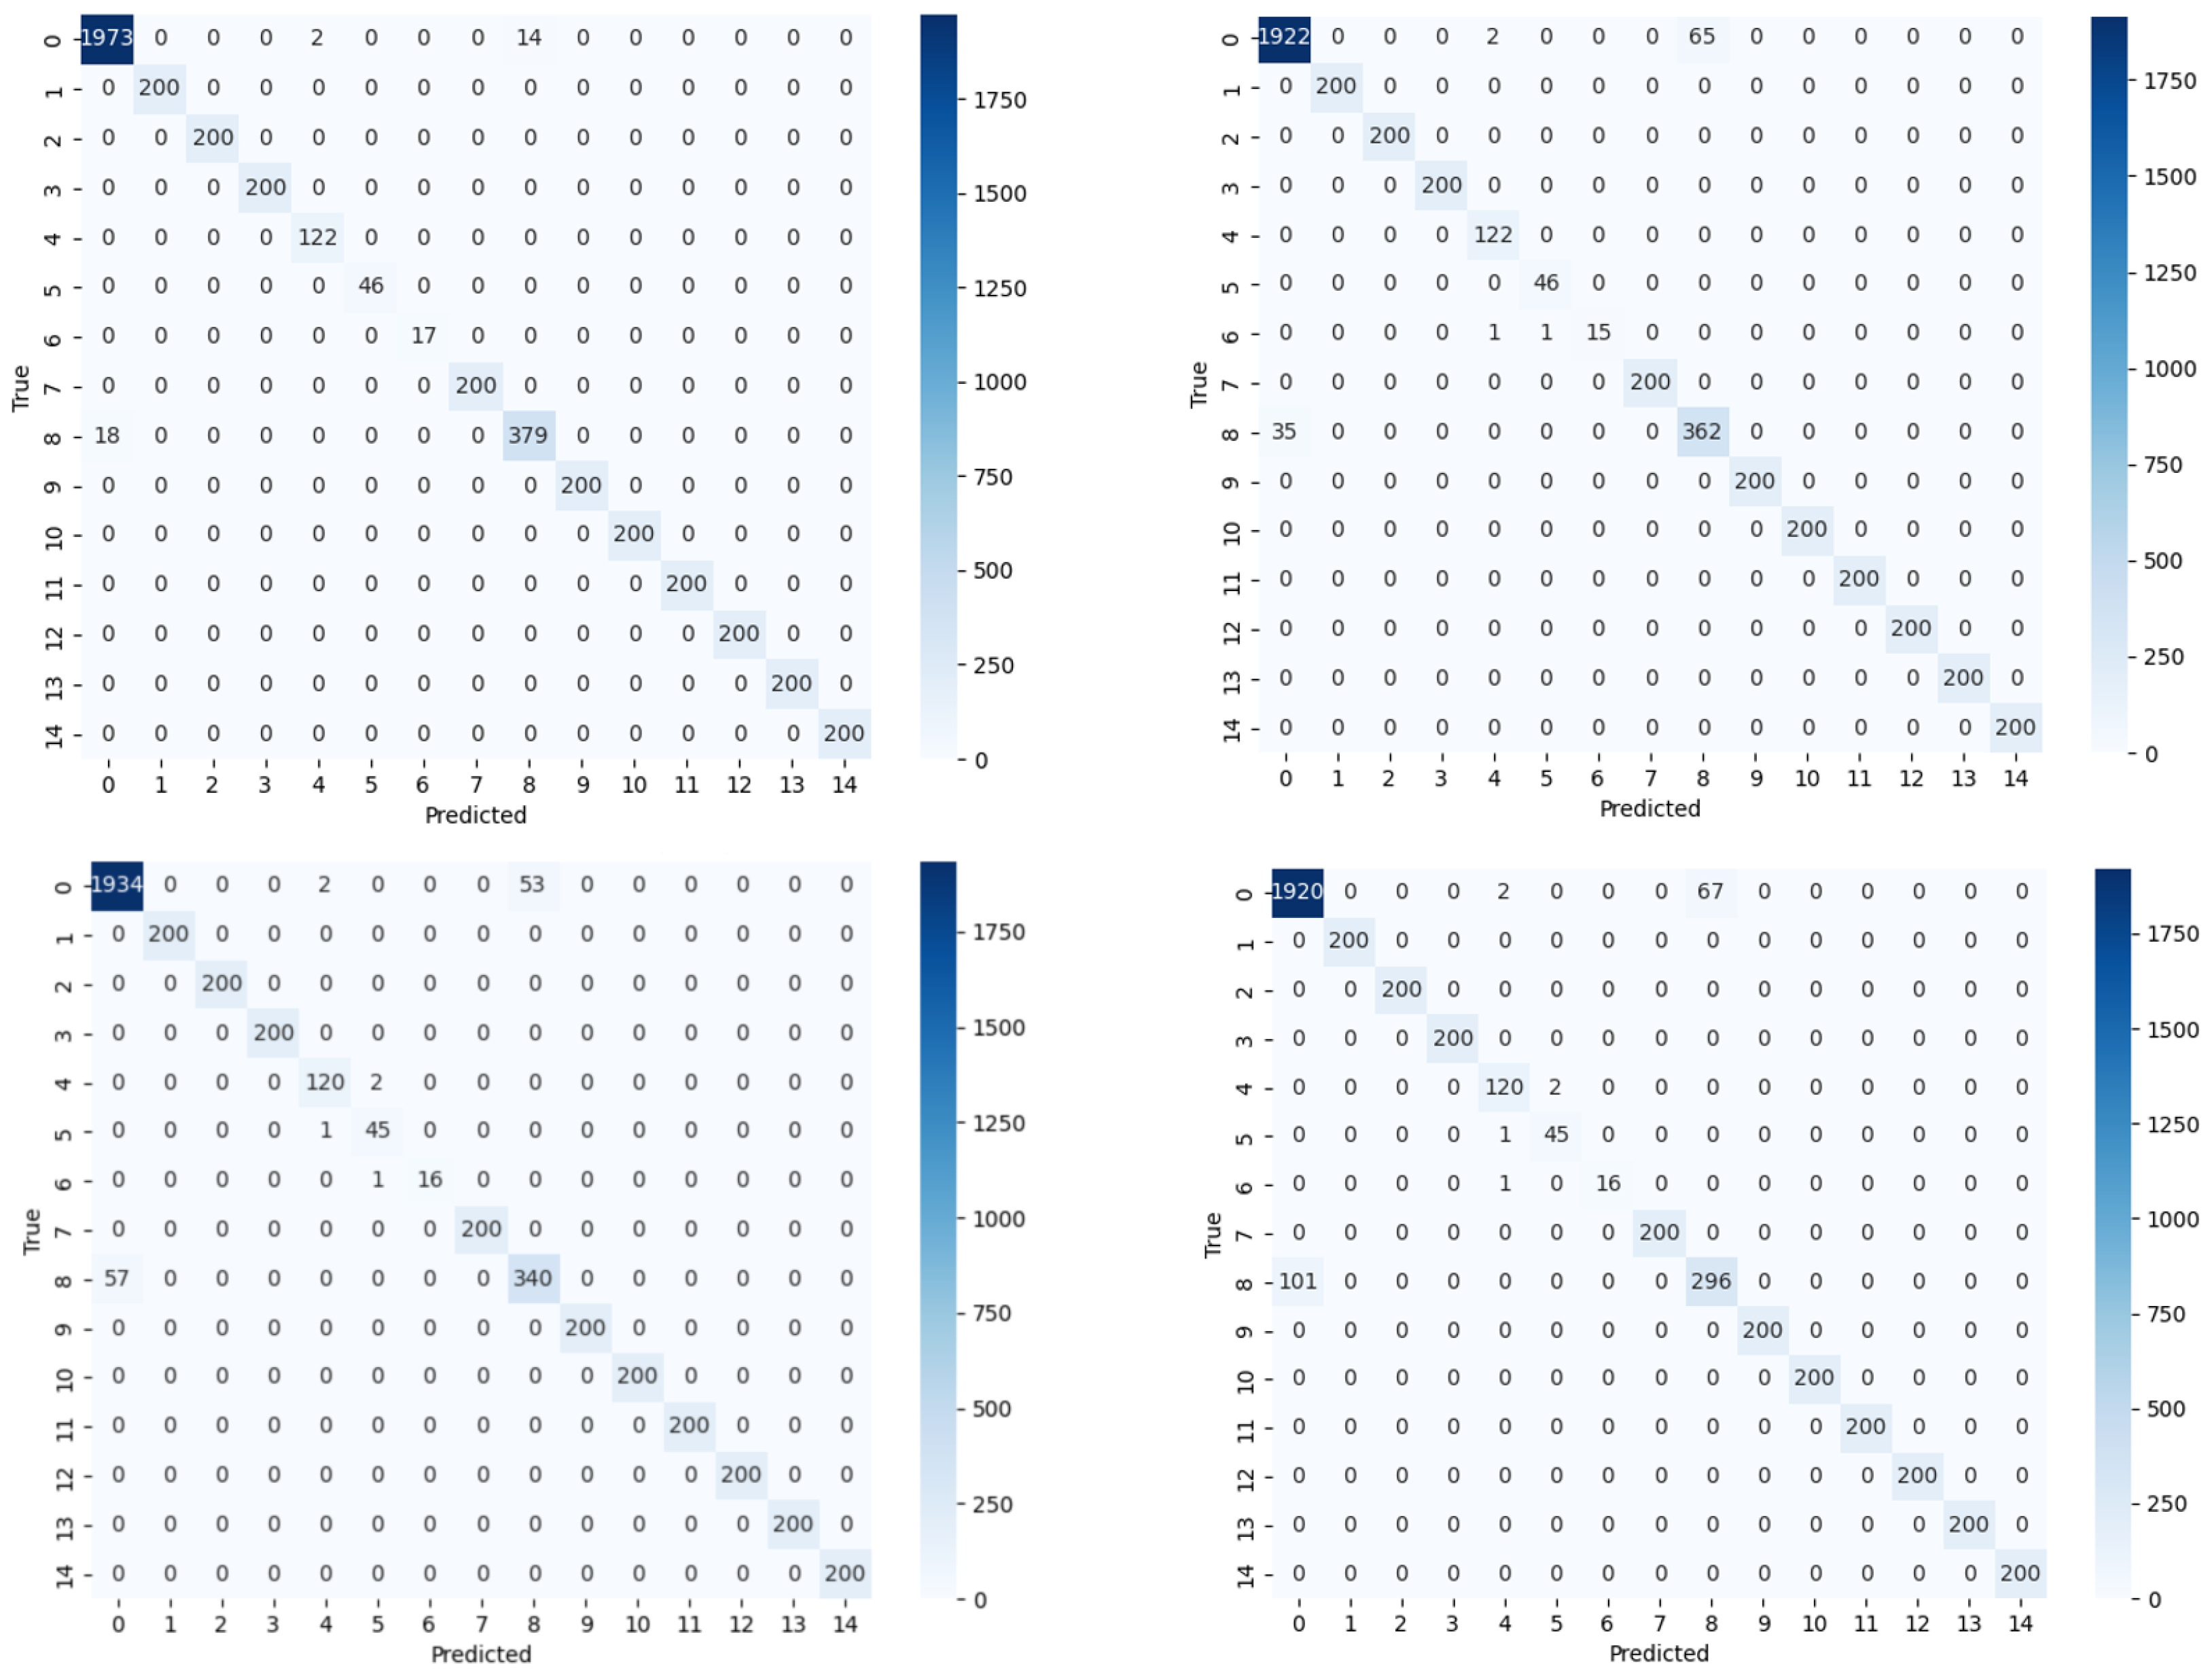
For model evaluation, we employed K-fold cross-validation to enhance the generalization ability and stability of the model. To address the issue of class imbalance, we utilized stratified K-fold cross-validation (StratifiedKFold), which ensures that the class distributions in both the training and validation sets are similar for each fold, thus mitigating the negative effects of data skew. We set K to 5, performing 5-fold cross-validation to improve the reliability of the performance scores and the robustness of the model. As shown in
Table 6 and
Figure 8, the performance metrics of our model consistently exceed those of the other models. Each category in the CICIDS2018 dataset was also evaluated using a ‘one-to-many’ strategy, as shown in
Table 7, as demonstrated by the AUC-ROC and AUC-PR metrics, the model exhibited a high degree of accuracy in the majority of categories, with performance levels approaching 100 percent.
We conducted experiments on the TON-IoT dataset for multi-class classification tasks. For model evaluation, 5-fold cross-validation was employed, with K set to 5. To ensure the reproducibility of experimental results and the stability of the cross-validation process, the random_state parameter was set to 77 for both data partitioning and model initialization. The training set consists of 28,171 samples, while the validation set contains 7043 samples. The dataset is comprised of eight categories: normal, DDoS, password, XSS, injection, DoS, scanning, and MITM.
The model was trained for 50 epochs with a batch size of 11, using the Adam optimizer with a learning rate of 0.001. For the loss function, we selected Focal Loss. Comparative experiments were performed using different models, and the best performance results are presented in
Table 8 and
Table 9. The corresponding confusion matrix is shown in
Figure 9. The experimental results demonstrate that our model outperforms the other models across all performance metrics, particularly in the detection of the Normal and MITM classes. The Transformer model performs marginally worse on this dataset, primarily due to the non-temporal structure of the ToN-IoT dataset, which lacks significant temporal dependencies between the data. The Transformer model relies on the global self-attention mechanism for temporal modeling, which is less effective when dealing with non-temporal data. This may result in redundant modeling and noise, leading to a reduction in the detection effect. Our model is able to accurately identify this class, whereas the other models fail to detect it effectively.


 ,
, 

