Article

IM-GNN: Microservice Orchestration Recommendation via Interface-Matched Dependency Graphs and Graph Neural Networks

Laboratory of Intelligent Collaborative Computing, School of Information and Software Engineering, University of Electronic Science and Technology of China, Chengdu 610054, China
*
Author to whom correspondence should be addressed.
Symmetry 2025, 17(4), 525; https://doi.org/10.3390/sym17040525
Submission received: 3 March 2025 / Revised: 25 March 2025 / Accepted: 28 March 2025 / Published: 31 March 2025
(This article belongs to the Section Computer)

Abstract

:
Microservice workflow orchestration recommendation aims to streamline business process construction by suggesting relevant microservices, yet existing methods relying on functional similarity in dependency graphs prove inadequate. Traditional graphs cluster functionally analogous microservices, neglecting execution-order dependencies critical for orchestration. This paper introduces a novel interface-matching-based approach to construct microservice dependency graphs, addressing the incompatibility of current methods with orchestration scenarios. The proposed method leverages a TF-WF-IDF algorithm and language models to extract input–output representations from microservice documentation, followed by interface-matching algorithms to establish call dependencies. By capturing the inherent structural symmetry in microservice interactions, where balanced and reciprocal relationships between inputs and outputs guide service connectivity, our approach enhances the fidelity of dependency graphs. Building on this graph, we present IM-GNN, a graph neural network-based recommendation model that generates microservice embeddings and computes node similarities to recommend orchestration candidates. Experiments on Amazon’s SageMaker and Comprehend datasets validate the model’s effectiveness, demonstrating superior recommendation accuracy compared to traditional methods. Key contributions include the interface-driven graph construction framework, the IM-GNN model, and empirical insights into hyperparameter impacts. This work bridges the gap between dependency graph quality and orchestration needs, offering a foundation for integrating deep learning with microservice workflow design while highlighting the role of symmetry in structuring service dependencies and optimizing orchestration patterns.

1. Introduction

Microservice workflows integrate decentralized services into cohesive business processes, with orchestration recommendation systems playing a pivotal role in guiding developers to assemble services efficiently [1,2,3,4,5,6]. Central to these systems is the microservice dependency graph, a structural representation where nodes denote services and edges encode inter-service relationships. Such graphs not only elucidate system-wide dependencies [7,8,9], but also empower graph-based deep learning techniques for tasks like microservice recommendation [10,11], microservice fault prediction [12], and QoS optimization [13]. Crucially, the graph’s quality directly governs model performance, making its construction methodology a linchpin for downstream applications.
Despite the successful application of microservice dependency graphs in many related fields, research on microservice orchestration recommendation remains sparse. The primary challenge is that current methods for constructing these graphs are not well suited to orchestration recommendation scenarios. Most existing approaches establish edges between microservices based solely on functional similarity, grouping together services with similar functions and distancing those with differing functions. While such a “birds of a feather flock together” strategy works well in product or video recommendations, for instance, by suggesting items similar to those a user has frequently purchased, it falls short in microservice orchestration. In orchestration scenarios, the critical factors are the dependencies between microservices and the sequence in which they are executed; adjacent microservices in a workflow are often functionally distinct, rendering a simple similarity-based grouping ineffective.
To overcome these limitations, this paper proposes a novel method for constructing microservice dependency graphs based on interface matching, a necessary condition for microservice calls, where the output of one service must match the input of another.
The main contributions of this work are as follows:
  • Symmetry-Aware Dependency Graph Construction: We propose a novel method for constructing microservice dependency graphs based on interface matching, explicitly capturing the structural symmetry in microservice interactions. Initially, we introduce the TF-WF-IDF algorithm, an enhancement of the traditional TF-IDF approach [3], to extract keywords from microservice documentation. Next, we employ a language model to generate input–output representations for each microservice. Finally, we utilize an interface matching algorithm to analyze these representations and establish reciprocal call dependencies, ensuring a balanced and structured dependency graph that aligns with the execution-order constraints of orchestration.
  • IM-GNN Model: We present the Interface Matching-Graph Neural Networks (IM-GNN) model for microservice workflow orchestration recommendation. This model leverages the constructed microservice dependency graph and applies graph neural networks to generate vector representations for each microservice node. By computing the similarities between these vectors, the model identifies and recommends a candidate set of microservices, ensuring that the orchestration process maintains structural coherence and functional symmetry.
  • Experimental Evaluation: The proposed model undergoes extensive empirical evaluation on Amazon’s SageMaker and Comprehend datasets. These experiments validate the effectiveness of IM-GNN, demonstrating its superior recommendation accuracy compared to traditional approaches. Additionally, we analyze the impact of various hyperparameters, highlighting the role of symmetry-aware graph construction in improving model performance.
This work addresses a significant gap in microservice orchestration recommendation and demonstrates that a dependency graph constructed through interface matching, with an emphasis on symmetric input–output relationships, can substantially enhance the performance of recommendation models.

2. Materials and Methods

2.1. Preliminaries

In recent decades, recommendation algorithms have developed rapidly, giving rise to an innumerable number of models. Collaborative filtering is one of the most representative methods in recommendation algorithms. This algorithm is based on user behavior or preference information, predicting the items or content a user might like by analyzing the similarity between the user and other users. The core of collaborative filtering lies in constructing the co-occurrence matrix. In the co-occurrence matrix, items are placed on the horizontal axis and users on the vertical axis, with an element A u , p in matrix A representing user u’s rating for item p. By using the co-occurrence matrix, the recommendation problem can be transformed into predicting the unknown elements in the matrix based on the known ones. Collaborative filtering algorithms can be divided into two main types: item-based collaborative filtering (ItemCF) and user-based collaborative filtering (UserCF) [3,14]. The core idea of the UserCF algorithm is to find other users whose interests are similar to the current user. In the co-occurrence matrix, the row vectors represent user vectors, and calculating the similarity between these user vectors provides the similarity of interests among users. In contrast, the ItemCF algorithm focuses on finding items that are similar to the current item. In the co-occurrence matrix, the column vectors represent item vectors, and ItemCF computes the similarity between items by calculating the similarity between their corresponding column vectors. Common similarity calculation methods include cosine similarity and the Pearson correlation coefficient.
While collaborative filtering algorithms are highly interpretable and intuitive, they also suffer from critical drawbacks, such as low generalization ability and severe popularity bias (head effect). In practical applications, the co-occurrence matrix constructed using collaborative filtering is often extremely sparse, making it difficult to generate high-quality user and item vectors, which in turn leads to unsatisfactory recommendation performance. To address these issues, matrix factorization techniques were introduced [15]. The basic idea behind matrix factorization is to decompose a large matrix into two smaller matrices, whose product approximates the original matrix. In recommendation systems, matrix factorization is commonly applied to the user–item rating matrix; by learning latent feature vectors for users and items, it becomes possible to effectively predict unknown ratings. A common optimization method for matrix factorization is gradient descent, which optimizes model parameters by minimizing the error between predicted and actual ratings, thereby improving prediction accuracy. The goal of the matrix factorization algorithm is to decompose the rating matrix into the product of a user matrix and an item matrix, with the aim that their product approximates the original ratings as closely as possible.
Although collaborative filtering and matrix factorization algorithms are highly interpretable, their expressive power is generally limited, and they cannot perform effective feature crossing. To automatically and efficiently perform feature crossing, Rendle proposed a recommendation algorithm based on factorization machines (the FM model) [16,17]. The FM model captures the implicit relationships between features by performing second-order feature interactions, thereby enhancing the model’s expressive capability. FM introduces a latent vector for each feature and models the nonlinear relationships between features through pairwise interaction terms. This allows FM not only to handle sparse data effectively but also to learn higher-order relationships between features, resulting in excellent performance in recommendation and classification tasks. Shortly after the introduction of the FM model, researchers extended it to propose the Field-aware Factorization Machine (FFM) model [18]. FFM introduces the concept of fields by partitioning features into different groups, and performs second-order interactions within each field. This enables FFM to capture the relationships between different features more flexibly, especially when dealing with data containing various types of features. By learning latent vectors across different fields, FFM can better model the nonlinear relationships among features, achieving higher performance in recommendation systems, ad click-through rate prediction, and similar tasks.
With the advent of the deep learning era, the FM algorithm was combined with deep learning to give rise to DeepFM [19,20,21]. This algorithm integrates the strengths of factorization machines and deep neural networks, overcoming the limitations of traditional factorization machines when processing high-dimensional sparse data. DeepFM first uses a factorization machine to learn the second-order interactions between features, capturing the low-order associations and learning their interaction weights. Then, it introduces a deep neural network to learn more abstract and nonlinear feature representations, thereby enhancing the model’s ability to capture complex relationships. During training, DeepFM jointly optimizes the parameters of the factorization machine and the deep neural network by minimizing a loss function, enabling precise modeling of user interests and item features. This combined approach of shallow and deep learning has proven to be outstanding in large-scale recommendation systems, especially when handling user–item interaction data with a vast number of high-dimensional sparse features.

2.2. Proposed Method

2.2.1. IM-GNN

Our IM-GNN model can be divided into two main parts, with a total of four modules. The first part focuses on constructing the microservice dependency graph based on the interface matching method, while the second part aims to build a graph neural network on the already constructed microservice dependency graph to recommend microservice orchestration. The model structure is shown in Figure 1.

2.2.2. Text Processing

The method for constructing the microservice dependency graph based on interface matching relies on the microservice documentation, where the input–output relationships between microservices are used to build the graph. In order to facilitate the algorithm’s functionality, it is necessary to preprocess the microservice documentation.
A comprehensive microservice documentation should include the microservice name, functionality description, inputs, outputs, error messages, and other relevant details. This algorithm, on the contrary, only focuses on extracting and filtering input and output information to generate corresponding documents, which detail parameter names, types, and formats. For microservices with multiple inputs or outputs, multiple corresponding documents are created, as illustrated in Figure 2. These documents structure input–output relationships, enabling accurate interface matching and microservice dependency graph construction.
Keyword extraction is a text processing technique aimed at automatically identifying and extracting the most representative and important words or phrases from a large volume of text. Keyword extraction has wide applications across multiple fields, including information retrieval, search engine optimization, text summarization, topic modeling, and automatic tag generation. By extracting keywords, it is possible to effectively summarize the content of a text and help the model understand the document’s theme and core information. This is particularly important for large datasets, complex textual contexts, and information retrieval tasks.
Traditional keyword extraction methods, such as the TF-IDF method [22], only consider the frequency of words in the document to assess their importance in the entire corpus, without taking into account the structural information of the document. However, microservice documentation is a highly structured document, consisting of five main parts: microservice name, functionality description, inputs, outputs, and error messages. The importance of words within each part differs, so a more nuanced approach is needed.
Therefore, in this paper, we propose a new keyword extraction method called TF-WF-IDF. The algorithm dynamically assigns weights to words based on the section they belong to, considering the document’s structure. TF-WF-IDF is a novel keyword extraction method designed specifically for microservice documentation. It builds on the TF-IDF method by incorporating text structure information and assigning different weights to words based on their position in the document structure. The algorithm evaluates the importance of words within a document and converts the words or phrases into numerical form, enabling easier analysis and processing by a computer. The specific formula for TF-WF-IDF is shown in Equation (1).
TF-WF-ID F w , d = T F w , d W F w , d I D F w .
Here, T F w , d is the term frequency, representing the frequency of the word w occurring in the microservice document d, and it is computed as follows:
T F w , d = n w , d k n k , d ,
where n w , d represents the number of occurrences of word w in the microservice documentation d and n k , d represents the number of distinct words in d. W F w , d is the weight parameter used to assign different weights to words based on the section they appear in. Its calculation formula is as follows:
W F w , d = S F w , d = n w , d k n k , d + 1 ,
where n w , d represents the number of occurrences of word w in the input or output section of the microservice documentation d and k n k , d denotes the total number of distinct words in this section.
I D F w represents the inverse document frequency, which is used to measure the importance of key words or phrases. The higher the IDF value, the less common the word or phrase is, but it may be very important for certain texts. Its calculation is as follows:
I D F w = lg N d : w n j ,
where N denotes the total number of documents in the text corpus and d : w n j is the total number of documents that contain the word w. After calculating TF, WF, and IDF, the algorithm multiplies these values together to obtain the final result. The words with the highest TF-WF-IDF values are selected as the keywords extracted by the algorithm.

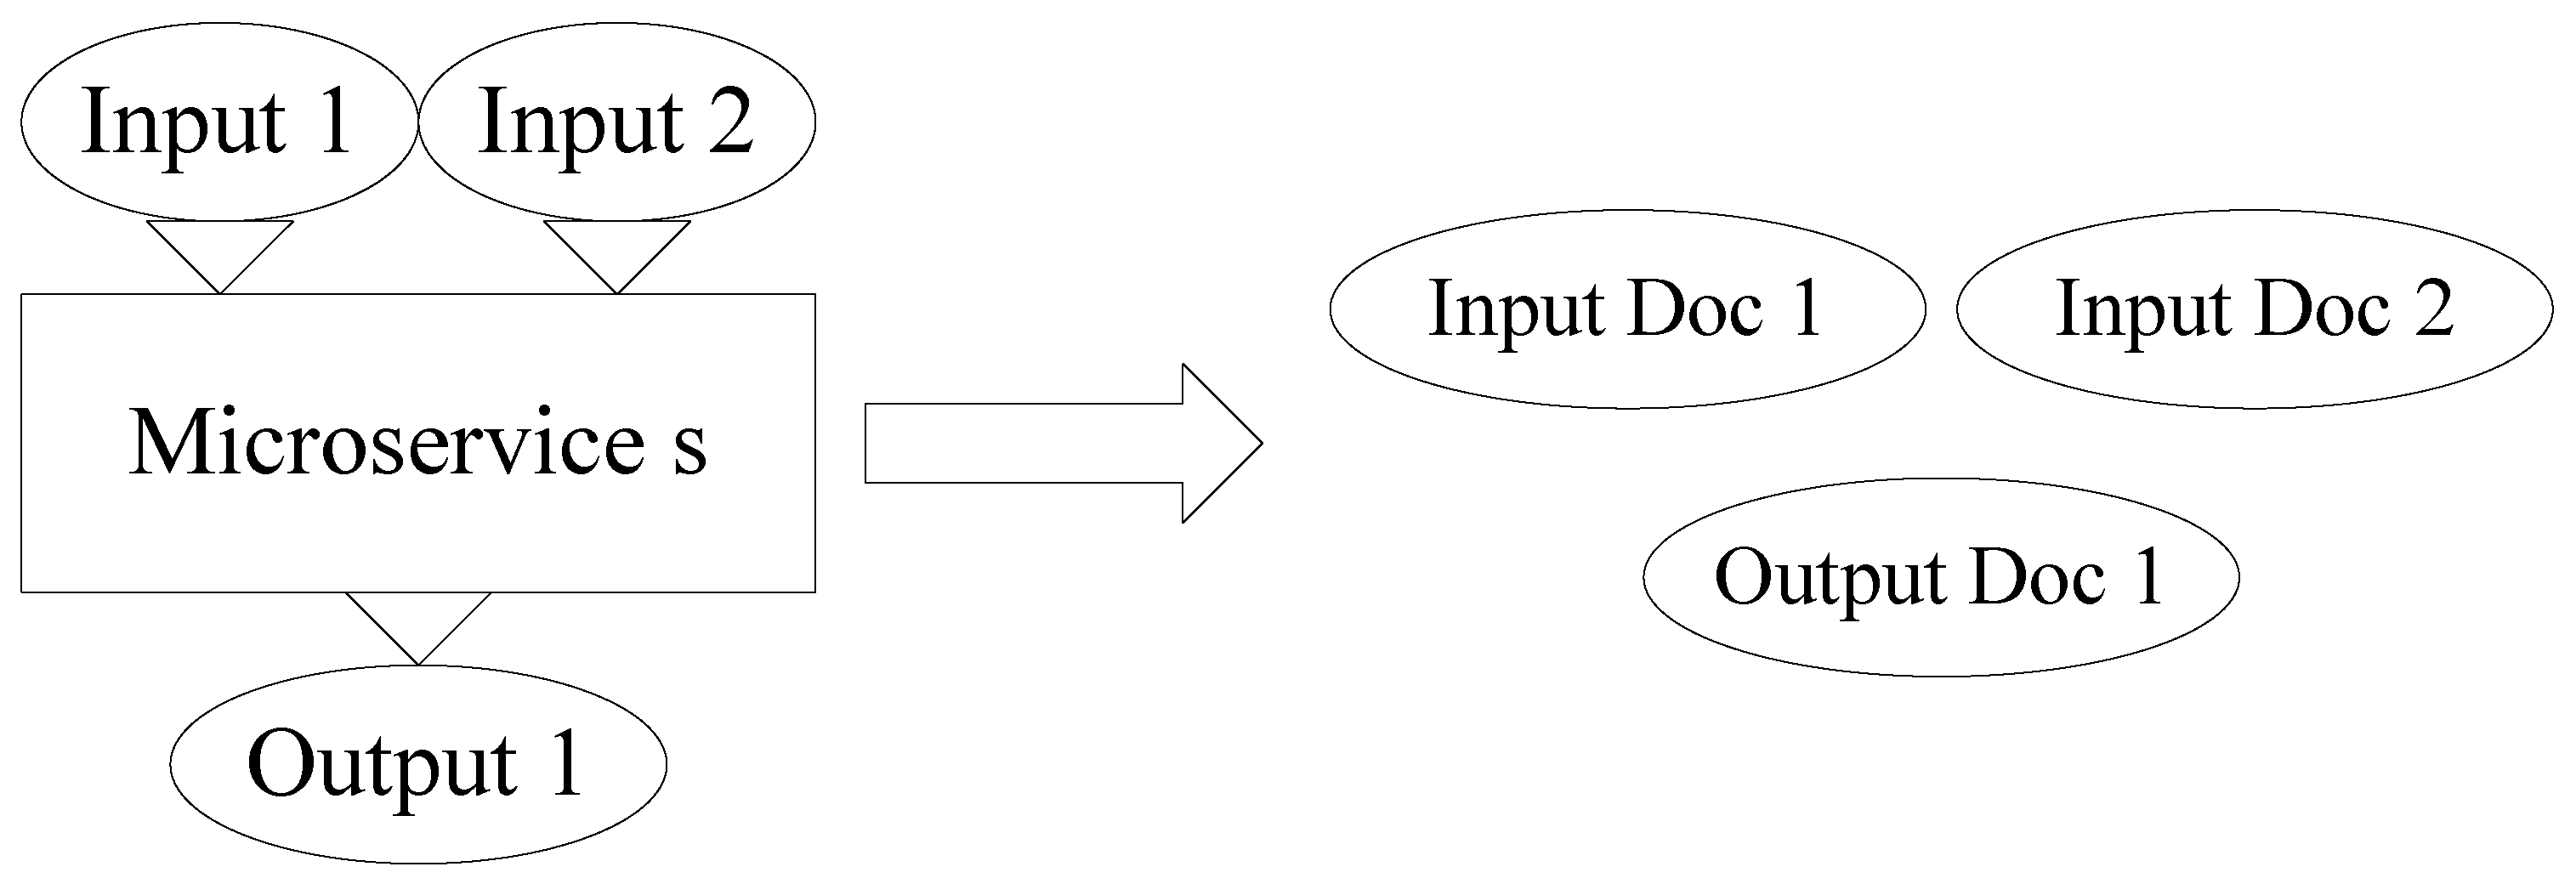
2.2.3. Construction of the Microservice Dependency Graph

After text processing, we utilize Bert as a Service (BaaS), which utilizes Google’s Bidirectional Encoder Representations from Transformers (BERT) [23] as an online service, with the obtained keywords to generate corresponding input and output vectors for each microservice. In a microservice architecture, the necessary condition for establishing a calling relationship between microservices is that the input–output interfaces between the microservices can match, meaning that the output of one microservice can be used as the input for another microservice. Based on this condition, the IM-GNN algorithm defines a scoring method to evaluate the likelihood of a call occurring between microservices, as follows:
s c o r e = max 1 i n j = 1 n s i m O S 1 , i , I S 2 , j ,
where S 1 and S 2 are two microservices, O S 1 , i represents the i-th output vector of microservice S 1 , I S 2 , j is the j-th input vector of microservice S 2 , and similarity s i m · is computed as:
s i m O , I = i = 1 n O i × I i i = 1 n O i 2 × i = 1 n I i 2 ,
where O and I are two vectors, O i and I i represent the i-th component of vectors O and I, respectively, and n denotes the total number of components in the vector.
In the microservice dependency graph construction, for each microservice S 1 , our method computes pairwise dependency scores between S 1 and all other microservices. With these computed scores, the algorithm then establishes directed edges from S 1 to the top microservices with the highest dependency scores. This edge formation process is iteratively applied to all microservices, resulting in a fully constructed dependency graph where edges represent the most significant functional relationships. The final graph captures the essential dependencies required for accurate workflow orchestration and recommendation.

2.2.4. Construction of Graph Neural Network

The microservice dependency graph has a complex graph structure and also contains rich structural information. Traditional methods for processing graph data, such as random walks, convert the graph structure into a sequence format, which disrupts the complex network topologies in microservice workflows, such as branches, concurrency, and loops. Therefore, in this paper, we build a graph neural network (GNN) based on the microservice dependency graph to mine the information within the graph. This network generates an embedding vector for each microservice node, which captures the complex network structure information of the microservice dependency graph, as well as information about the neighboring nodes of the microservices.
The core of the GNN in the IM-GNN model is a local convolution operation. In this operation, the model learns how to aggregate information from the neighborhood of node u. The basic idea is to first identify the neighboring node v of node u, then input v’s current embedding vector into a deep neural network (DNN) to obtain a set of vectors representing its neighbors. The obtained vectors are then input into an aggregator to generate the final vector representation, as shown in Equation (7):
n u = f R e L U Q h v + q | v N u ,
where n u represents the neighborhood vector, h v is the vector representation of node v, Q is the parameter matrix, q is the bias vector, R e L U is the non-linear activation function, and f · is the aggregation function.
Then, the algorithm concatenates the aggregated neighborhood vector n u with the current representation h u of node u, and then applies a neural network to transform the concatenated vector:
z u n e w = R e L U W · C O N C A T z u , n u + b ,
where W is the parameter matrix, b is the bias vector, and C O N C A T · is the concatenation operation, which connects two vectors together.
Lastly, the resulting vector is normalized to make the model training more stable. This normalization also makes approximate nearest neighbor search on the normalized embedding representation more efficient. The output of the algorithm is the vector representation of u, which contains information about both the node itself and its local graph neighborhood:
z u n e w = z u n e w z u n e w 2 ,
where z u n e w 2 is the l-2 norm of z u n e w .
In the convolution operation, our algorithm does not use all of node v’s neighboring nodes, as this would significantly increase the computational complexity. Instead, the algorithm samples a subset of the neighboring nodes of v and only aggregates information from these selected neighbors. Each time the model applies a convolution operation, it produces a new representation for the microservice node. The model stacks multiple such convolution operations to gain more information about the local graph structure surrounding node u. At the k-th layer, the convolution input depends on the output of the k 1 -th layer, and the input of the k 1 -th layer’s convolution depends on the output of the k 2 -th layer, and so on. This process continues until k reaches 0, as shown below:
h = h v k 1 , v N u , h u k = C o n v h u k 1 , h .
The output of the convolutional layers is passed through a fully connected neural network, which then generates the final output embedding Z u with two weight matrices W 1 and W 2 , as follows:
Z u = W 2 · R e L U W 1 h u k + I .
During training, we want the embedding vectors of the nodes near Z u to have higher similarity with Z u ’s embedding vector. If we represent similarity using the inner product, we aim to maxmize Z u T Z v . For negative samples, the goal is the opposite. The loss function for training is shown as follows:
J Z u = E v 1 log σ Z u T Z v U · E v log σ Z u T Z v ,
where v is the node co-occuring with u during a fixed-length random walk in the vicinity of u, σ is the sigmoid function, E v is a 0 1 function, where E v = 0 when the current node is a positive sample and E v = 1 when it is a negative sample, and U is the weight coefficient. The pseudocode of the complete algorithm is provided in Algorithm 1.
Algorithm 1 IM-GNN
Input: 
Node set M V ; order K.
Output: 
Vector representation z u , u M .
 1:
S K M
 2:
for k = K, K−1, …, 1 do
 3:
     S K 1 S K
 4:
    for  u S k  do
 5:
         S K 1 S K 1
 6:
    end for
 7:
end for
 8:
h u 0 x u , u S 0
 9:
for k = K, K−1, …, 1 do
10:
    for  u S K  do
11:
         H { h v k 1 , v N u }
12:
         h u k C o n v h u k 1 , h
13:
    end for
14:
end for
15:
for  u M   do
16:
     z u P 2 · R e L U P 1 h u k + I
17:
end for

2.2.5. Microservice Orchestration Recommendation

The microservice orchestration recommendation module, based on the existing microservice dependency graph, recommends the next potential microservice node to the user based on the microservices the user has already orchestrated. In this paper, services that are close in vector space are more likely to form service combinations and invoke each other in actual production environments. Therefore, our model calculates the similarity between the target microservice and other microservices. The calculation is as follows:
S i m A , B = i = 1 n α v k + β v k 1 i × B i i = 1 n α v k + β v k 1 i 2 × i = 1 n B i 2 .
Here, A represents the vector of the current microservice workflow, B represents the vector of a microservice in the microservice library, α and β are the weights, v k is the vector of the last microservice in the current workflow, and v k 1 is the vector of the previous microservice to v k . B i represents the i-th component of vector B, and n represents the total number of components in the vector.

2.3. Experimental Materials

2.3.1. Experimental Environments

We set up two sets of experiments to validate the effectiveness of our algorithm. The first set of experiments is used to verify the effectiveness of the microservice dependency graph construction method based on interface matching. The second set of experiments is used to validate the recommendation performance of the microservice orchestration recommendation method based on graph neural networks. The hardware environment for this experiment is as follows: the CPU is an Intel(R) Xeon(R) Gold 6248R, the GPU is an Nvidia Tesla T4, and the memory size is 128 GB. The software environment includes the following: the operating system is Ubuntu 22.04.3, the CUDA version is 11.2, the Python version is 3.8.0, the deep learning framework is TensorFlow 2.0-gpu, the IDE used is PyCharm 2022.3.3, and the environment management tool is Anaconda3. The hardware configuration and software version information used in our experiments are shown in Table 1.

2.3.2. Experimental Data

The experiments used datasets provided by Amazon Web Services (AWS) [24]. AWS is committed to making it easier for individuals, businesses, and organizations to build, deploy, and scale applications using microservice technologies, without requiring significant hardware and software resources. The microservices offered by AWS cover various fields, such as Elastic Compute Cloud (EC2), which allows users to flexibly run virtual servers, Amazon S3 storage service, which provides scalable cloud storage solutions for object storage, and Identity and Access Management (IAM) service, which is used to securely control access to AWS services and resources. Additionally, AWS provides a wide range of machine learning and artificial intelligence services, such as SageMaker, which is used for building, training, and deploying machine learning models. These microservices are widely used in application development, enterprise IT infrastructure, and innovative projects across various industries. AWS has become the largest cloud service provider globally, offering over 300 different products, each containing several microservices. For this experiment, we used two AWS products, SageMaker and Comprehend, as the datasets.
Amazon SageMaker is a one-stop machine learning service provided by AWS that offers comprehensive machine learning solutions for developers and data scientists. It supports the building, training, and deployment of machine learning models, providing a complete platform for developing and deploying intelligent applications. Users can build models using SageMaker’s integrated development environment, choose training from various popular machine learning frameworks, and fine-tune models using SageMaker’s automation features. Additionally, SageMaker supports model explainability, automated model tuning, and integrated model management, making it the preferred tool for building scalable, interpretable, and high-performance machine learning applications.
Amazon Comprehend is a global natural language processing (NLP) service provided by AWS designed to help users gain deeper insights and analyze large volumes of text data. The service supports multiple languages, automatically detecting text languages, and providing functions such as sentiment analysis, keyword extraction, and named entity recognition. By using Comprehend, users can quickly extract important information from text, identify topics and entities, evaluate sentiment, and generate meaningful insights about documents. This makes Comprehend a powerful tool for building intelligent applications, automating workflows, and deriving value from social media, customer feedback, and other text data sources. Comprehend’s flexibility and scalability make it suitable for a wide range of applications, including business intelligence, social media analysis, and public opinion monitoring.

2.3.3. Experimental Metrics

To accurately evaluate the performance of the model created in this paper, two different evaluation metrics, H i t @ K and the normalized discounted cumulative gain ( N D C G @ K ) [25], are used. These two metrics provide a relatively comprehensive assessment of the model’s recommendation performance. In recommendation tasks, H i t @ K represents the hit rate of recommendations. As a metric, H i t @ K helps the system discover more useful information and improve the quality of the recommendation results. Here, K represents the top K items in the recommendation list. The algorithm accumulates all the hit rates and then divides by the total number of users to obtain the H i t @ K value. When the value of H i t @ K is high, it indicates that the recommendation list contains more content that the user needs, thus the model’s recommendation accuracy is higher. Conversely, if the H i t @ K value is lower, it indicates that there is less content that the user needs in the recommendation list, resulting in lower recommendation accuracy. The specific formula for H i t @ K is the following:
H i t @ K = n h i t N .
Here, n h i t represents the cumulative hit rate of the top K items in the recommendation list returned by the model and N is the total number of users.
H i t @ K only evaluates the top K items in the user’s recommendation list, without considering the order of the items in the list. In comparison, N D C G @ K takes the ordering of items in the recommendation list into account, where items that appear earlier in the list are considered more important and those later are less important, by combining two concepts: cumulative gain and discount factor. Cumulative gain refers to the accumulated relevance of each item, with higher relevance for items placed earlier in the list, leading to a greater cumulative gain. The further down an item is in the list, the less value it has for the user. Therefore, a discount factor is applied to reduce the influence of later items. By combining these two, we can obtain the mathematical formula for DCG@K as follows:
D C G @ K = j = 1 K h i t u , j lg j + 1 ,
where h i t u , j is a 0–1 function: if the j-th item in the recommendation list for user u appears in the actual interaction list, then h i t u , j = 1 , otherwise h i t u , j = 0 .
Finally, the cumulative gain is normalized by the ideal cumulative gain to allow for comparison across different queries or systems. The ideal cumulative gain refers to the cumulative gain calculated after ranking the results based on relevance in an ideal order. The formula for N D C G @ K is shown in Equation (16):
N D C G @ K = D C G @ K u I D C G @ K u = 1 N u = 1 K j = 1 K h i t u , j lg j + 1 ,
where N is the total number of users included in the test set.

3. Results

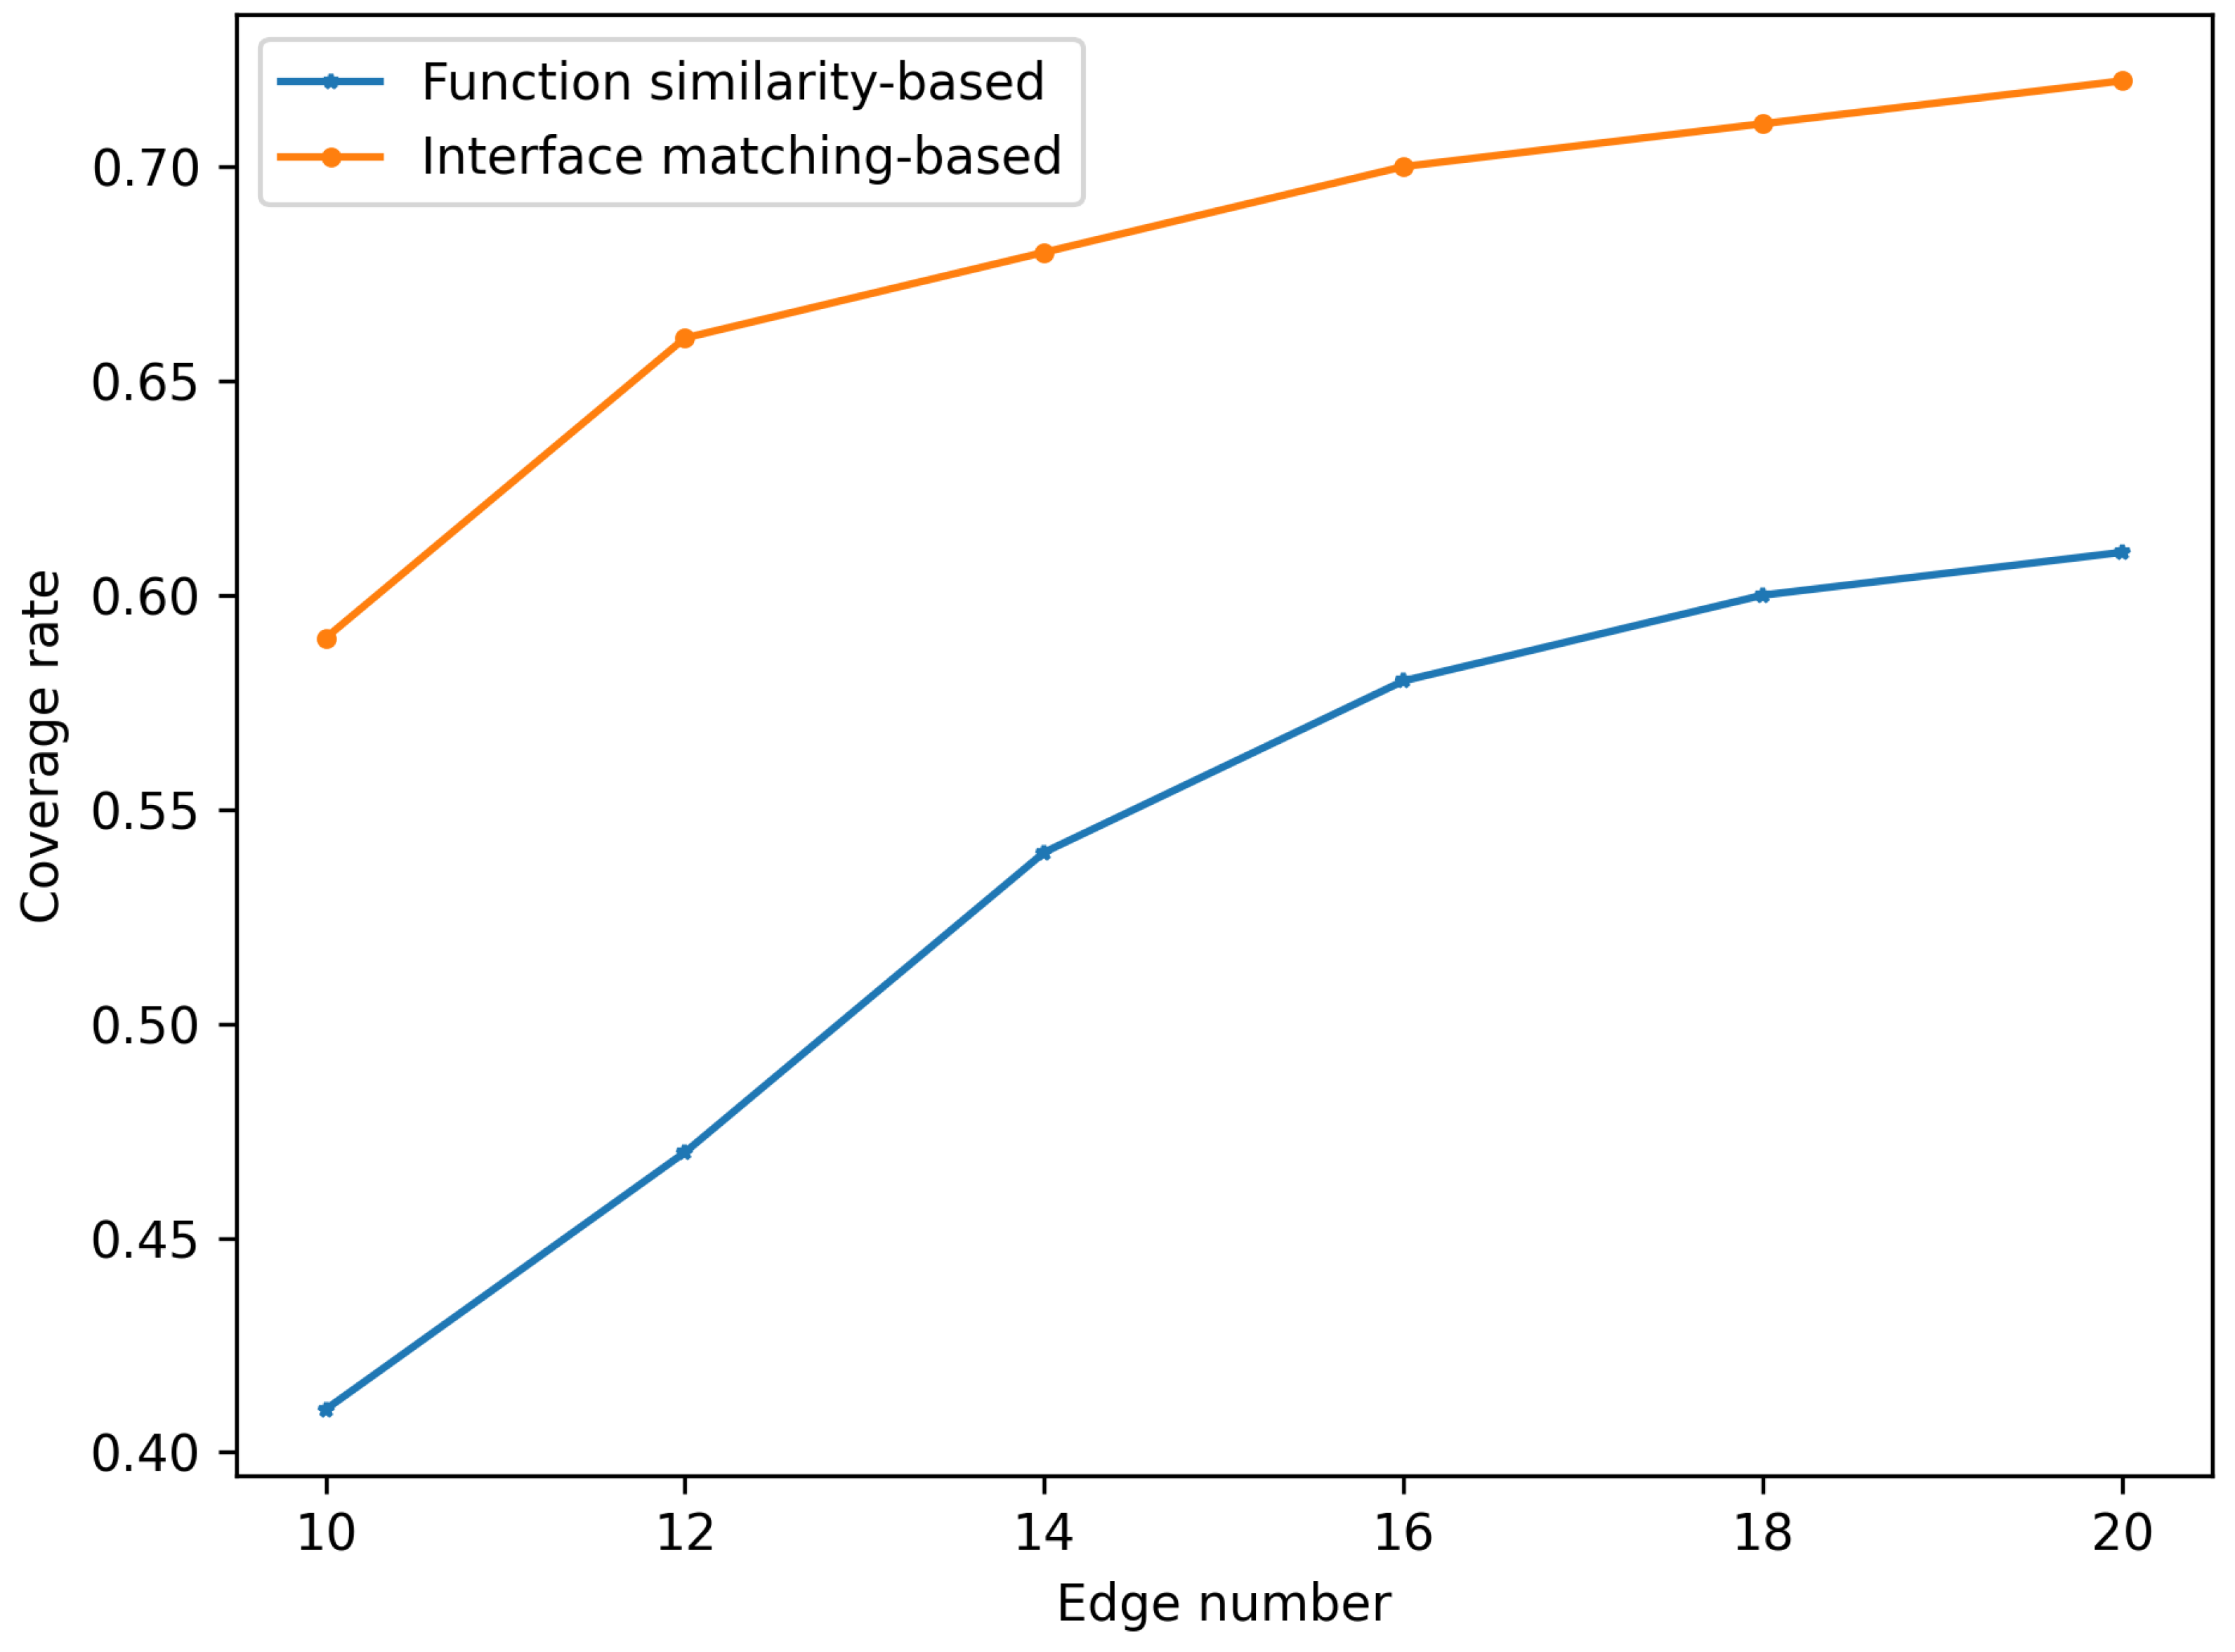
3.1. Experiments on Constructing the Microservice Dependency Graph

Amazon AWS provides many real-world code examples on its official website. In this paper, the call relationships between microservices in these codes are extracted and used as the test set for this experiment. Then, the microservice dependency graph is constructed on the SageMaker and Comprehend datasets using the interface matching-based method. At the same time, a microservice dependency graph is constructed based on the microservice functional similarity method as a control group. This paper argues that a high-quality microservice dependency graph should include more real-world microservice call relationships. Therefore, the quality of the microservice dependency graph is judged by the coverage of microservice call relationships. The experimental results are shown in Figure 3 and Figure 4.
To ensure a relatively fair comparison, the number of edges in the graphs constructed for this experiment is kept consistent. The analysis shows that when the number of edges in the graph is small, the coverage of the interface matching-based method significantly outperforms the functional similarity-based method. As the number of edges increases, the coverage of both methods rises and then stabilizes. On both the SageMaker and Comprehend datasets, the coverage of the microservice dependency graph constructed using the interface matching method is clearly superior to that of the graph constructed based on microservice functional similarity.

3.2. Ablation Study

This subsection designs an ablation experiment to observe the impact of the quality of the microservice dependency graph on the recommendation model’s performance, thereby demonstrating that the microservice dependency graph constructed through interface matching has higher quality and is beneficial for improving the model’s recommendation accuracy. The experiment is conducted on the SageMaker dataset, using N D C G @ 10 and H i t @ 10 as evaluation metrics. The experimental results are shown in Table 2.
In Table 2, “W/O” is the abbreviation for “without”, and the best experimental results are highlighted in bold. From the experimental results, it can be analyzed that the microservice dependency graph constructed in this paper is crucial for the model. When the microservice dependency graph is missing, the overall performance of the model significantly decreases. This is because low-quality graph data contain very limited useful information and include a large amount of erroneous data, preventing the model from learning useful information. In contrast, the microservice dependency graph constructed in this paper is closer to real-world usage, containing a large amount of useful microservice call relationships, enabling the model to learn more valuable information and thus improve the accuracy of the recommendation results.

3.3. Performance Comparison

Due to the limited number of comparison models available in the field of microservice workflow orchestration recommendation, this paper adjusts some classic traditional recommendation algorithms to make them suitable for microservice workflow orchestration recommendation. These models are then compared with the IM-GNN model. A brief introduction to the comparison models is as follows:
GRU4Rec [26]: GRU4Rec uses a gated strategy, which includes update and reset gates, enabling dynamic regulation of information transmission and storage to more precisely capture patterns and characteristics in sequential data. GRU4Rec can predict the next action of the user and provide personalized recommendations by studying the user’s past behavior patterns, such as purchase history or click history. The advantage of this model is that it can handle long-term dependencies with fewer parameters, making it suitable for large-scale datasets and real-time recommendation systems.
SASRec [27]: The SASRec model introduces the self-attention mechanism, which allows the model to better understand and apply the relationships between different elements in a sequence. In SASRec, the self-attention mechanism enables the model to consider all the information of other items in the sequence, not just adjacent items, when computing the representation for each item in the sequence. This allows the model to capture long-term dependencies and contextual information in the sequence more comprehensively, improving recommendation accuracy and personalization.
MA-GNN [28]: MA-GNN is a memory-augmented graph neural network recommendation model. In MA-GNN, a graph neural network is used to capture the user’s short-term interests, while a memory-augmented network is used to capture the user’s long-term interest descriptions. Finally, an item relationship model is established, and the features are integrated using a gating mechanism to form the final sequence representation, which is then used to predict the candidate set for recommendations.
IM-GNN: The IM-GNN model constructed in this paper is designed for the microservice workflow orchestration recommendation scenario. It builds a microservice dependency graph using an interface matching-based method. Then, based on the microservice dependency graph, a graph neural network generates vector representations for each microservice node. By calculating the similarity between vectors, a candidate set of microservices is constructed to complete the final recommendation.
In the construction of the microservice workflow orchestration recommendation model IM-GNN, the code is primarily implemented using the Pytorch framework. During the training of the model, the number of layers in the graph neural network is set to three, the dimension of the embedding vectors is set to 128, and the number of neighbor nodes sampled in the graph is set to 20. The Adam optimizer is used to automatically adjust the learning rate.
The comparison experiments were conducted on the publicly available SageMaker and Comprehend datasets, using H i t @ 10 and N D C G @ 10 as the evaluation metrics for the models. The experimental results are shown in Table 3, with the best experimental results highlighted in bold. As shown in the table, except for MA-GNN achieving the highest H i t @ 10 on the Comprehend dataset, our proposed IM-GNN consistently outperforms all other models across the remaining metrics.
From the experimental results, it can be seen that our IM-GNN model outperforms other recommendation models on both the Comprehend and SageMaker datasets. It is hypothesized that this is due to the lower suitability of other recommendation algorithms for microservice orchestration scenarios. These methods primarily rely on item similarity, which is effective for domains like product and video recommendations. However, in microservice orchestration, similarity-based approaches mainly cluster functionally similar microservices, failing to capture critical dependency relationships and execution order. In practice, adjacent microservices often serve distinct functions, meaning that merely grouping similar microservices does not effectively support orchestration.

4. Discussion

In this section, we shall discuss the impact of the hyperparameters used in IM-GNN and their choice.

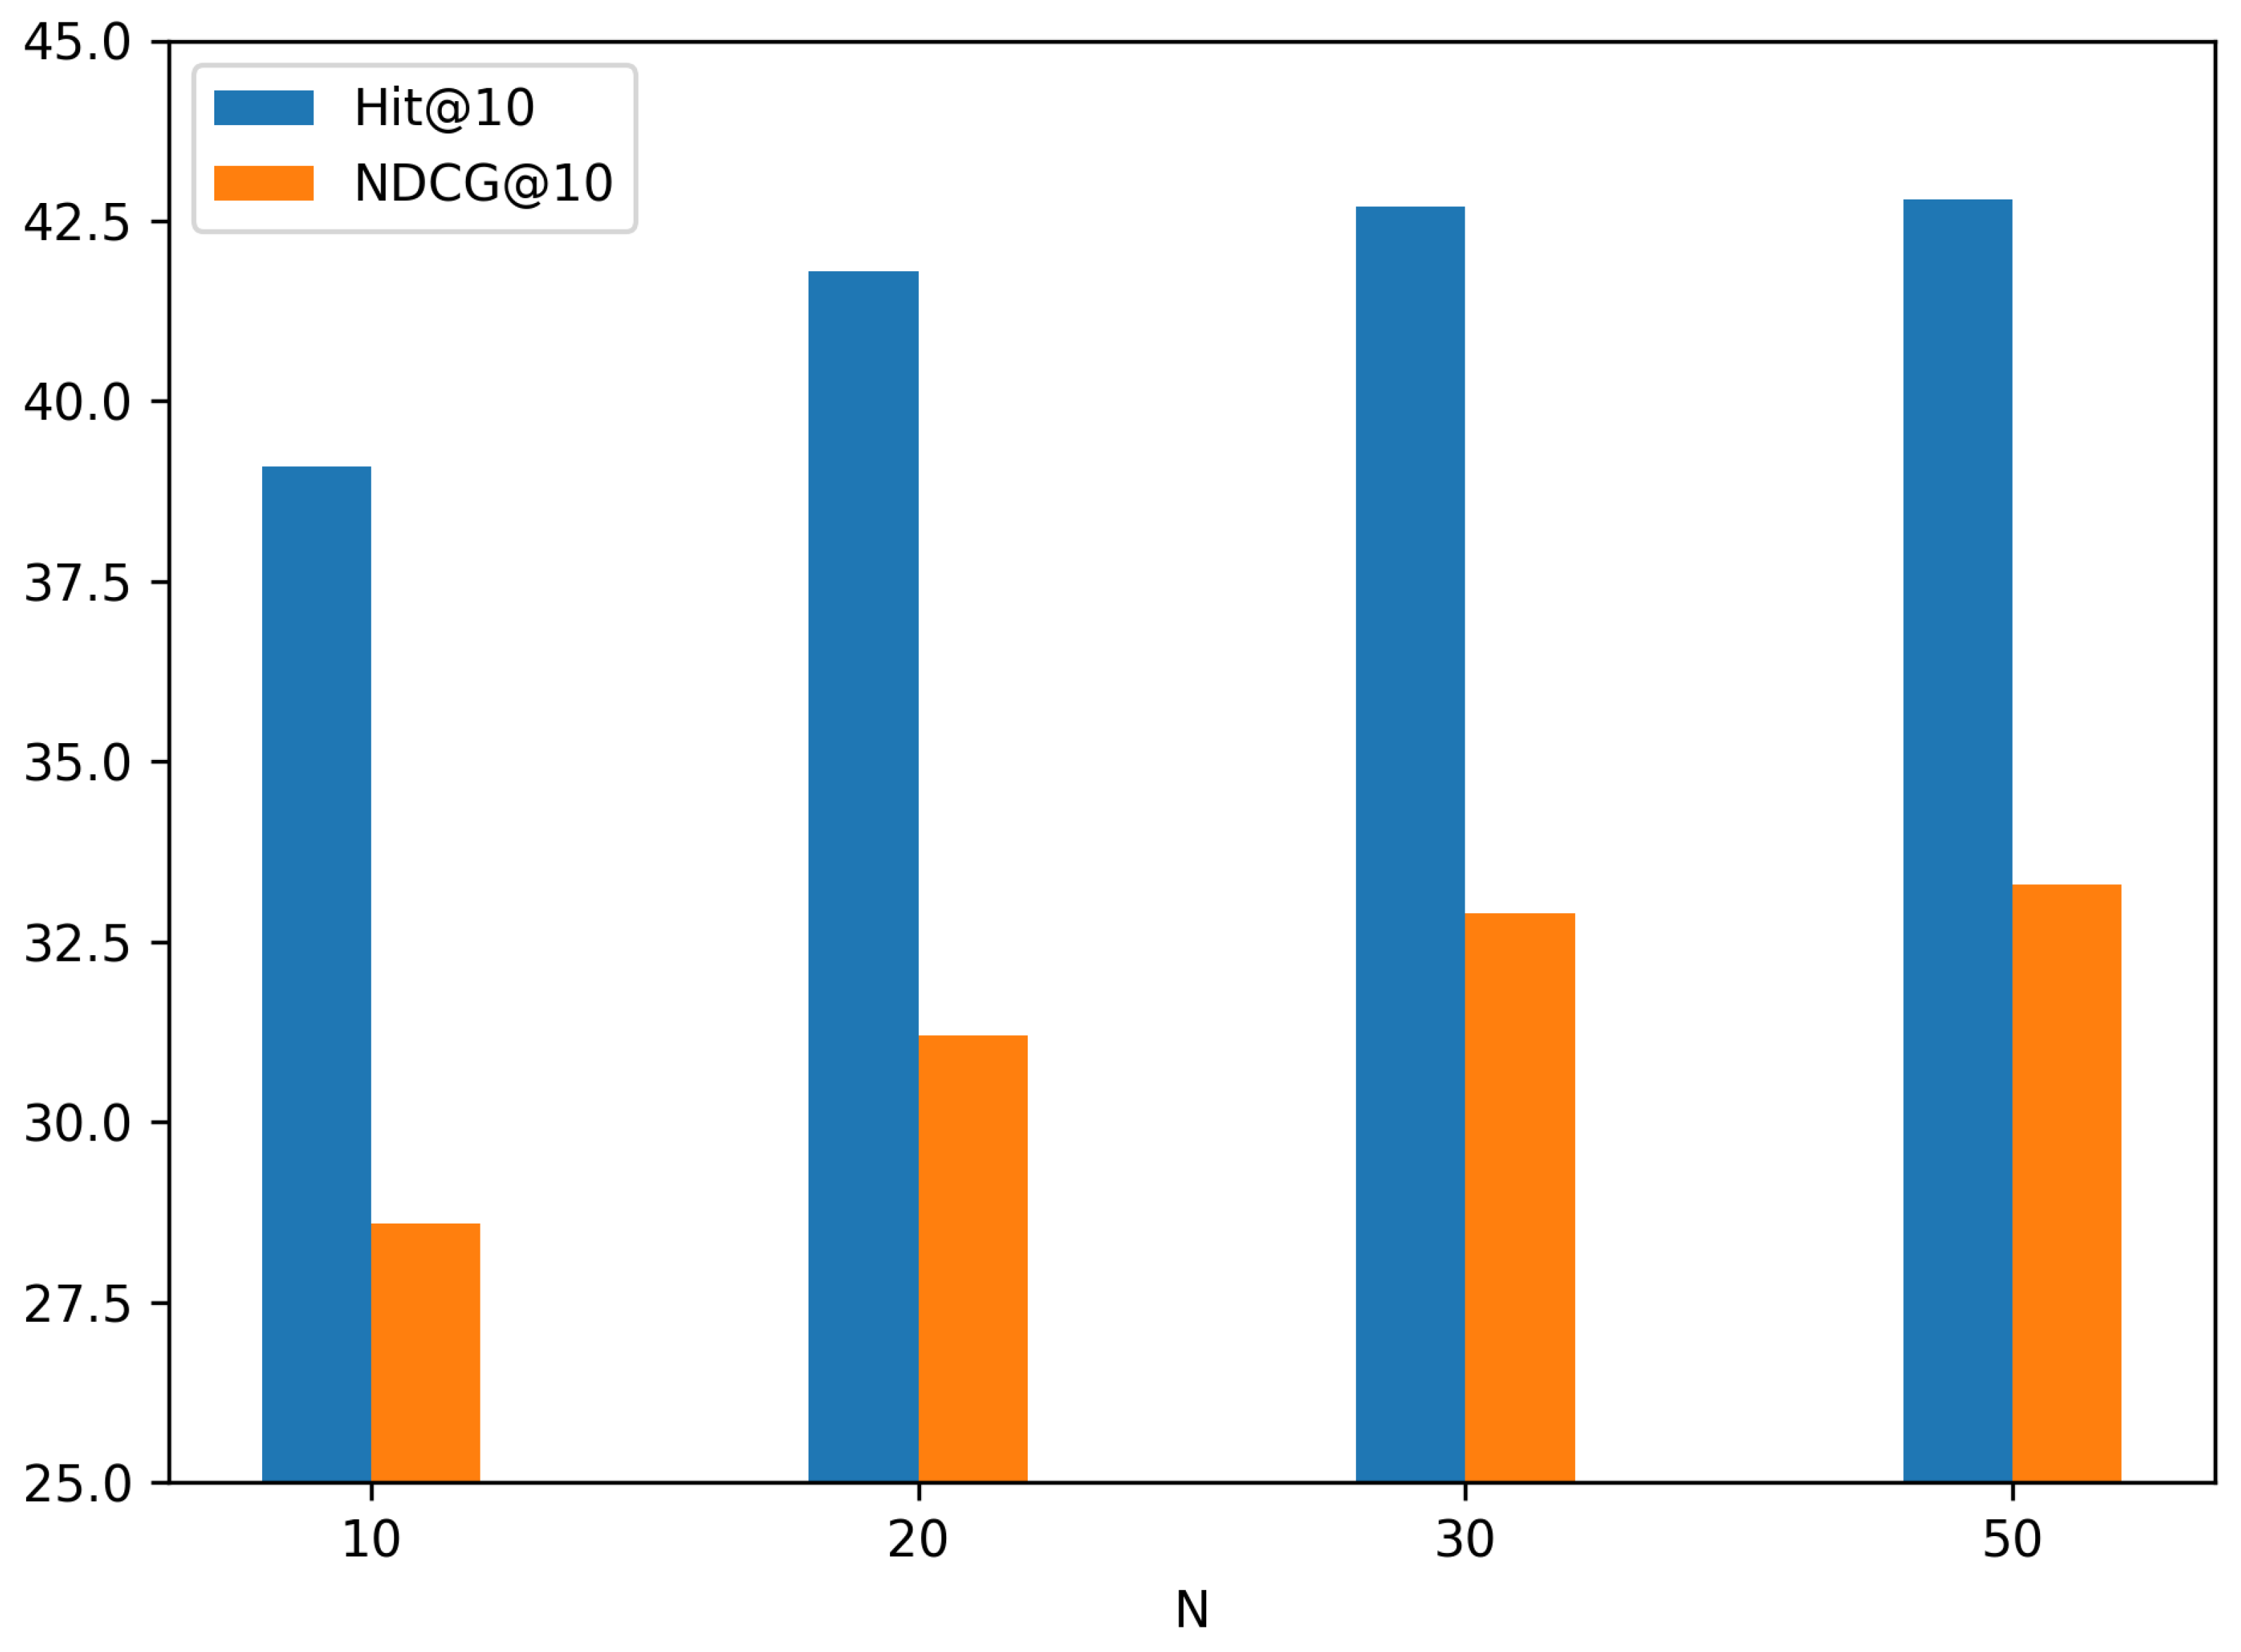
4.1. The Impact of the Number of Neighbors

During the model training process, the IM-GNN model aggregates the neighboring nodes u of the target node v to update its own vector representation, as given in Equation (10). N u defines the number of neighbors to sample for each node at each layer, and k defines the aggregation order. These two hyperparameters determine the scale of information aggregation, which will affect both the model’s training time and performance. If the model collects information from all neighboring nodes during each aggregation, it will incur a significant computational overhead. On the other hand, if too few neighbors are selected, the model’s training performance may degrade. Therefore, selecting appropriate parameters is crucial. Be carefully adjusting these parameters, the model can effectively learn the representations of node neighbors while maintaining computational efficiency, thus optimizing the performance and training effectiveness of the GNN.
Figure 5 shows the runtime and performance of IM-GNN when the number of neighbors N is set to 10, 20, 30, and 50. As N increases, the performance gains of IM-GNN diminish. The experiment found that when the number of neighbors is set to 20, the difference in the model’s H i t @ 10 and N D C G @ 10 metrics compared to when the number of neighbors is 30 is relatively small, but the computational efficiency is higher. Therefore, the number of neighbors is set to 20 in IM-GNN.

4.2. The Impact of the GNN Layer

In order to allow the model to better learn information from higher-order neighbors, this paper introduces a multi-layer graph neural network to integrate information from higher-order neighboring nodes, which increases the richness of node information. It is important to note that the number of network layers K is a hyperparameter, and therefore needs to be determined through experiments. From a theoretical perspective, the higher the K value, the richer the node data collected by the model. We set K = 1 , 2 , 3 , 4 , 5 and conducted experiments on the SageMaker and Comprehend datasets based on different network layer numbers. The experimental results are shown in Figure 6.
From the experimental results, it can be observed that when the number of layers in the network K = 1 , the value of H i t @ 10 is relatively low, and the model performs poorly. As the K value increases, the model’s performance improves to some extent. When K = 3 , 4 , 5 , the performance improvement becomes marginal, but the computation time increases as K grows. Therefore, we choose K = 3 as the final value of IM-GNN.

5. Conclusions

This paper presents a novel microservice workflow orchestration recommendation model, IM-GNN. The model constructs a microservice dependency graph using an interface matching-based method and then uses a graph neural network to make recommendations based on the microservice dependency graph. We first analyzed the existing issues in current microservice workflow orchestration recommendation methods and then introduced the improvements made in IM-GNN. The IM-GNN model can be divided into two parts: constructing the microservice dependency graph and building the graph neural network. In the microservice dependency graph construction part, the paper first divides the input and output documents of the microservices, then proposes the TF-WF-IDF algorithm to extract keywords from the documents, generates the microservice input–output vectors using a language model, and finally introduces the interface matching algorithm to connect the microservice nodes and build the microservice dependency graph. In the graph neural network construction part, the model, based on the microservice dependency graph, uses a graph neural network to generate vector representations for each microservice node. By calculating the similarity between vectors, a candidate set of microservices is constructed, completing the final recommendation. Finally, a series of experiments were conducted on Amazon’s SageMaker and Comprehend datasets. The IM-GNN model proposed in this paper was compared with other recommendation models to verify the recommendation performance. The experiments also demonstrate the selection of relevant hyperparameters and their impact on the model’s effectiveness.

Author Contributions

Conceptualization, T.Z. and Y.X.; methodology, T.Z.; software, T.C. and Y.S.; validation, T.C. and Y.S.; formal analysis, T.Z.; investigation, T.Z. and Y.X.; resources, T.Z.; data curation, T.C.; writing—original draft preparation, Y.S. and T.Z.; writing—review and editing, T.Z. and Y.X.; visualization, T.C. and Y.S.; supervision, Y.X.; project administration, T.Z.; funding acquisition, T.Z. All authors have read and agreed to the published version of the manuscript.

Funding

This research was funded by the Chengdu Key Research and Development Support Program “Jie Bang Gua Shuai” Project under grant number 2023-JB00-00012-GX.

Data Availability Statement

SageMaker is available at https://aws.amazon.com/cn/sagemaker-ai/ (accessed on 23 March 2023) and Comprehend is available at https://aws.amazon.com/cn/comprehend/ (accessed on 24 March 2023).

Conflicts of Interest

The authors declare no conflicts of interest.

References

  1. Ko, H.; Lee, S.; Park, Y.; Choi, A. A Survey of Recommendation Systems: Recommendation Models, Techniques, and Application Fields. Electronics 2022, 11, 141. [Google Scholar] [CrossRef]
  2. Li, Z.; Shen, X.; Jiao, Y.; Pan, X.; Zou, P.; Meng, X.; Yao, C.; Bu, J. Hierarchical Bipartite Graph Neural Networks: Towards Large-Scale E-commerce Applications. In Proceedings of the 2020 IEEE 36th International Conference on Data Engineering (ICDE), Dallas, TX, USA, 20–24 April 2020; pp. 1677–1688. [Google Scholar] [CrossRef]
  3. McAuley, J. Personalized Machine Learning; Cambridge University Press: Cambridge, UK, 2022. [Google Scholar]
  4. Qian, F.; Pan, S.; Zhang, G. Tensor Computation for Seismic Data Processing: Linking Theory and Practice; Earth Systems Data and Models Series; Springer: Cham, Switzerland, 2025. [Google Scholar]
  5. Fan, W. Recommender Systems in the Era of Large Language Models (LLMs). IEEE Trans. Knowl. Data Eng. 2024, 36, 6889–6907. [Google Scholar] [CrossRef]
  6. Saboor, A.; Hassan, M.F.; Akbar, R.; Shah, S.N.M.; Hassan, F.; Magsi, S.A.; Siddiqui, M.A. Containerized Microservices Orchestration and Provisioning in Cloud Computing: A Conceptual Framework and Future Perspectives. Appl. Sci. 2022, 12, 5793. [Google Scholar] [CrossRef]
  7. Luo, S.; Xu, H.; Lu, C.; Ye, K.; Xu, G.; Zhang, L.; He, J.; Xu, C. An In-Depth Study of Microservice Call Graph and Runtime Performance. IEEE Trans. Parallel Distrib. Syst. 2022, 33, 3901–3914. [Google Scholar] [CrossRef]
  8. Su, Y.; Li, Y.; Zhang, Z. Two-Tower Structure Recommendation Method Fusing Multi-Source Data. Electronics 2025, 14, 1003. [Google Scholar] [CrossRef]
  9. Li, Y.; Liu, K.; Satapathy, R.; Wang, S.; Cambria, E. Recent Developments in Recommender Systems: A Survey [Review Article]. IEEE Comput. Intell. Mag. 2024, 19, 78–95. [Google Scholar] [CrossRef]
  10. Huang, S.; Wang, C.; Bian, W. A Hybrid Food Recommendation System Based on MOEA/D Focusing on the Problem of Food Nutritional Balance and Symmetry. Symmetry 2024, 16, 1698. [Google Scholar] [CrossRef]
  11. Vaidhyanathan, K.; Caporuscio, M.; Florio, S.; Muccini, H. ML-enabled Service Discovery for Microservice Architecture: A QoS Approach. In Proceedings of the 39th ACM/SIGAPP Symposium on Applied Computing, New York, NY, USA, 8–12 April 2024; SAC ’24. pp. 1193–1200. [Google Scholar] [CrossRef]
  12. Dang, Q.; Li, N.; Dong, H.; Li, X.; Guo, M. Improved Microservice Fault Prediction Model of Informer Network. In Proceedings of the 2024 IEEE 7th Information Technology, Networking, Electronic and Automation Control Conference (ITNEC), Chongqing, China, 20–22 September 2024; Volume 7, pp. 1116–1120. [Google Scholar] [CrossRef]
  13. Kaushik, N. Improving QoS of Microservices Architecture Using Machine Learning Techniques. In Proceedings of the Software Architecture. ECSA 2024 Tracks and Workshops; Ampatzoglou, A., Pérez, J., Buhnova, B., Lenarduzzi, V., Venters, C.C., Zdun, U., Drira, K., Rebelo, L., Di Pompeo, D., Tucci, M., et al., Eds.; Springer: Cham, Switzerland, 2024; pp. 72–79. [Google Scholar]
  14. Niu, B.; Ma, J.; Yang, Z. A Comparative Study of CF and NCF in Children’s Book Recommender System. In Proceedings of the 2021 3rd International Workshop on Artificial Intelligence and Education (WAIE), Xi’an, China, 19–21 November 2021; pp. 43–47. [Google Scholar] [CrossRef]
  15. Mao, C.; Wu, Z.; Liu, Y.; Shi, Z. Matrix Factorization Recommendation Algorithm Based on Attention Interaction. Symmetry 2024, 16, 267. [Google Scholar] [CrossRef]
  16. Rendle, S. Factorization Machines. In Proceedings of the 2010 IEEE International Conference on Data Mining, Sydney, NSW, Australia, 20 January 2011; pp. 995–1000. [Google Scholar] [CrossRef]
  17. Qian, F.; He, Y.; Yue, Y.; Zhou, Y.; Wu, B.; Hu, G. Improved Low-Rank Tensor Approximation for Seismic Random Plus Footprint Noise Suppression. IEEE Trans. Geosci. Remote Sens. 2023, 61, 1–19. [Google Scholar] [CrossRef]
  18. Juan, Y.; Zhuang, Y.; Chin, W.S.; Lin, C.J. Field-aware Factorization Machines for CTR Prediction. In Proceedings of the 10th ACM Conference on Recommender Systems, New York, NY, USA, 15–19 September 2016; RecSys ’16. pp. 43–50. [Google Scholar] [CrossRef]
  19. Guo, H.; Tang, R.; Ye, Y.; Li, Z.; He, X. DeepFM: A factorization-machine based neural network for CTR prediction. arXiv 2017, arXiv:1703.04247. [Google Scholar]
  20. Alhwayzee, A.; Araban, S.; Zabihzadeh, D. A Robust Recommender System Against Adversarial and Shilling Attacks Using Diffusion Networks and Self-Adaptive Learning. Symmetry 2025, 17, 233. [Google Scholar] [CrossRef]
  21. Qian, F.; Liu, Z.; Wang, Y.; Zhou, Y.; Hu, G. Ground Truth-Free 3-D Seismic Random Noise Attenuation via Deep Tensor Convolutional Neural Networks in the Time-Frequency Domain. IEEE Trans. Geosci. Remote Sens. 2022, 60, 1–17. [Google Scholar] [CrossRef]
  22. Sammut, C.; Webb, G.I. (Eds.) TF–IDF. In Encyclopedia of Machine Learning; Springer: Boston, MA, USA, 2010; pp. 986–987. [Google Scholar] [CrossRef]
  23. Devlin, J.; Chang, M.W.; Lee, K.; Toutanova, K. BERT: Pre-training of Deep Bidirectional Transformers for Language Understanding. arXiv 2019, arXiv:1810.04805. [Google Scholar]
  24. Wittig, A. Amazon Web Services in Action, 3rd ed.; Simon and Schuster: New York, NY, USA, 2023. [Google Scholar]
  25. Rashed, A.; Grabocka, J.; Schmidt-Thieme, L. A Guided Learning Approach for Item Recommendation via Surrogate Loss Learning. In Proceedings of the 44th International ACM SIGIR Conference on Research and Development in Information Retrieval, New York, NY, USA, 11–15 July 2021; SIGIR ’21. pp. 605–613. [Google Scholar] [CrossRef]
  26. Hidasi, B.; Karatzoglou, A.; Baltrunas, L.; Tikk, D. Session-based recommendations with recurrent neural networks. arXiv 2015, arXiv:1511.06939. [Google Scholar]
  27. Kang, W.C.; McAuley, J. Self-Attentive Sequential Recommendation. In Proceedings of the 2018 IEEE International Conference on Data Mining (ICDM), Los Alamitos, CA, USA, 17–20 November 2018; pp. 197–206. [Google Scholar] [CrossRef]
  28. Ma, C.; Ma, L.; Zhang, Y.; Sun, J.; Liu, X.; Coates, M. Memory augmented graph neural networks for sequential recommendation. In Proceedings of the AAAI Conference on Artificial Intelligence, New York, NY, USA, 7–12 February 2020; Volume 34, pp. 5045–5052. [Google Scholar]
Figure 1. IM-GNN structure.
Symmetry 17 00525 g001
Figure 2. Microservice input and output document partitioning.
Symmetry 17 00525 g002
Figure 3. Coverage comparison between the functional similarity-based method and the interface matching method on the SageMaker dataset.
Symmetry 17 00525 g003
Figure 4. Coverage comparison between the functional similarity-based method and the interface matching method on the Comprehend dataset.
Symmetry 17 00525 g004
Figure 5. The impact of the number of neighbors.
Symmetry 17 00525 g005
Figure 6. The impact of the GNN layer.
Symmetry 17 00525 g006
Table 1. Experimental environments.
NameVersion
CPUIntel(R) Xeon(R) Gold 6248R CPU @ 3.00 GHz
Memory128 GB
GPUNvidia Tesla T4
CUDACUDA Toolkit 11.2
OSUbuntu 22.04.3
Programming LanguagePython 3.8.0
FrameworkTensorFlow 2.0-gpu
IDEPyCharm 2022.3.3
Environment Management ToolAnaconda 3
Table 2. Ablation results on SageMaker.
ResultsSageMaker
Hit @ 10 NDCG @ 10
W/O Interface Match36.2328.44
IM-GNN (ours)41.4531.23
Table 3. Comparison with baselines.
ResultsSageMakerComprehend
Hit @ 10 NDCG @ 10 Hit @ 10 NDCG @ 10
GRU4Rec28.6525.8527.8126.29
SASRec32.0226.3433.0928.57
MA-GNN40.4430.0536.7435.31
IM-GNN (ours)41.4531.2335.1336.82
Disclaimer/Publisher’s Note: The statements, opinions and data contained in all publications are solely those of the individual author(s) and contributor(s) and not of MDPI and/or the editor(s). MDPI and/or the editor(s) disclaim responsibility for any injury to people or property resulting from any ideas, methods, instructions or products referred to in the content.

