1. Introduction
Reconfigurable Intelligent Surfaces (RISs), as an emerging technology, integrate a large number of low-cost passive reflective elements on a planar surface to intelligently configure the wireless transmission environment, thereby significantly enhancing the performance of wireless networks [
1,
2,
3,
4,
5]. By independently controlling the phase and amplitude, RISs enable three-dimensional beamforming to amplify desired signal power or mitigate channel interference. Moreover, their lightweight design and ease of installation allow for rapid deployment on building surfaces such as walls and ceilings without requiring modifications to existing wireless system standards or hardware [
3,
4,
5,
6]. In wireless educational device networks, RISs can optimize signal transmission efficiency and reduce power consumption. For example, by jointly designing the switching selection, phase adjustment, and power allocation of the RIS, it can reshape the electromagnetic propagation environment, thereby improving signal transmission rates and energy efficiency. In addition, Simultaneously Transmitting and Reflecting Reconfigurable Intelligent Surfaces (STAR-RISs) can be used to assist communication between multiple devices, thereby improving the overall network performance.
The concept of Simultaneously Transmitting and Reflecting Reconfigurable Intelligent Surfaces (STAR-RISs) was first introduced in [
7,
8]. The conventional RIS only supports signal reflection and requires that both the transmitter and the user be located on the same side, thereby imposing a half-space symmetry constraint [
7]. In contrast, a STAR-RIS breaks the electromagnetic symmetry constraint by introducing magnetoelectric currents, unlike traditional RISs, which rely solely on electric field polarization [
8]. This enables independent control over transmitted and reflected signals, as well as the simultaneous refraction and reflection of incident signals. Leveraging this capability, STAR-RISs overcome the limitations of full-space coverage and geographical adaptability, achieving complete 360° coverage [
8]. Specifically, signals transmitted to the area behind the RIS are referred to as “transmitted signals”, while those reflected to the front of the RIS are termed “reflected signals”. These two distinct regions are correspondingly labeled as the Transmission (T) region and the Reflection (R) region [
9]. Moreover, the electromagnetic properties of STAR-RIS elements can be modified using an intelligent controller, allowing for the adjustment of transmitted and reflected signals via the Transmission And Reflection Coefficients (TARCs). This mechanism provides flexibility in energy allocation between users on both sides, enabling both symmetric and asymmetric energy distribution [
10].
It is worth noting that the author in [
7] proposed three practical protocols—Energy Splitting (ES), Mode Selection (MS), and Time Splitting (TS). In the ES mode, each element simultaneously transmits and reflects, and by allocating transmission and reflection coefficients symmetrically or asymmetrically it can prioritize meeting the rate requirements of critical users while ensuring the energy conservation constraint. In the MS mode, each element operates at full power in either the transmission or reflection mode, forming a spatially asymmetric coverage. When most users are located on the transmission side, STAR-RISs can configure more elements in the transmission mode to enhance system capacity [
11]. In the TS mode, time resources are symmetrically split into transmission and reflection periods, making it suitable for scenarios with symmetrical user distribution [
10]. These three protocols effectively coordinate the T and R modes in STAR-RIS-assisted Multiple Input Single Output (MISO) networks [
9]. Additionally, from a manufacturing standpoint, the suggested innovative RISs can be implemented using a variety of designs predicated on metasurfaces [
7]. For instance, NTT DoCoMo from INC recently unveiled a dynamic metasurface capable of dynamically controlling both reflection and transmission within a highly transparent package [
7,
12]. Other effective strategies for managing transmission and reflection have also been documented, such as graphene-based dynamic metasurfaces and multilayer metasurfaces [
7,
13,
14].
The exploration and application of Non-Orthogonal Multiple Access (NOMA) technology, an efficient multi-user service strategy, in conjunction with STAR-RIS-assisted communication, continues to expand. The study of these assisted NOMA systems spans numerous areas, such as the design of energy efficiency, improving security performance, channel allocation, and resource optimization. For instance, energy efficiency designs based on deep reinforcement learning have been shown to markedly increase the energy utilization efficiency of STAR-RIS-assisted NOMA networks [
15]. Performance evaluations of these systems under Nakagami-m fading channels demonstrate their benefits across diverse channel conditions [
16,
17]. Additionally, extensive research has been conducted on covert communication and physical layer security within STAR-RIS-assisted NOMA systems, resulting in a variety of proposed strategies and methods to bolster security [
18,
19,
20,
21]. In the realm of STAR-RIS-assisted NOMA system research, Qureshi and Hamza Ahmed in 2024 examined the influence of Extra-Large Size Reconfigurable Intelligent Surfaces (XL-STAR-RISs) on the aggregate rate of uplink NOMA systems. Their findings indicate that XL-STAR-RISs substantially boost the aggregate rate of NOMA systems, particularly in near-field channels where its augmentation effect is notably more pronounced [
22].
Furthermore, most studies indicate that STAR-RIS-assisted NOMA communication networks can significantly enhance the performance of communication systems, while effectively improving the stability and reliability of communication links [
16,
23,
24,
25,
26,
27,
28,
29]. Specifically, the authors in [
16] investigated STAR-RIS-assisted Cooperative NOMA (CNOMA) networks in Nakagami-m fading channels, demonstrating that this system markedly augments both Spectral Efficiency (SE) and Energy Efficiency (EE). In a separate study, the authors modeled and validated STAR-RIS-assisted downlink NOMA communication systems. These systems leveraged energy splitting and Maximal Ratio Combining (MRC) at the user end, combined with beamforming technology at the base station, resulting in an elevated system performance [
23]. Within cognitive radio frameworks, the authors in [
24] examined the contribution of RISs to spectrum efficiency enhancement in cognitive NOMA networks with multi-primary constraints, suggesting that RISs can effectively elevate the overall performance of 5G and subsequent systems. In [
25], the authors delved into the performance of RIS-assisted downlink NOMA wireless systems amidst D2D interference, deriving Signal-to-Interference-plus-Noise Ratio (SINR) expressions and calculating user rates, thus affirming the efficacy of RISs in intricate network scenarios.
The authors in [
26] assessed the functionality of STAR-RIS in HARQ-assisted NOMA networks, highlighting that this system achieves a balance between security and reliability, which is especially advantageous for Secondary Users (SRUs). In [
27], the authors analyzed the outage probability of STAR-RIS-assisted NOMA communication and derived closed-form expressions for the outage probabilities of reflection and refraction users. In [
28], the authors integrated STAR-RISs into Industrial Internet of Things (IIoT) networks and proposed a STAR-RIS-assisted Cognitive Radio (CR)-NOMA network. They conducted a comprehensive performance analysis of the system from the perspectives of outage probability and Ergodic Rate (ER). In [
29], the authors proposed a STAR-RIS-assisted CR-NOMA network, derived the outage probability of users under Nakagami-m fading channels, and analyzed its asymptotic behavior in the high signal-to-noise ratio regime. The above studies demonstrate that STAR-RIS-assisted NOMA communication networks offer significant advantages in terms of system performance and link stability.
Inspired by the aforementioned studies, this paper mainly investigates and analyzes the performance of STAR-RIS-assisted NOMA wireless education networks under multiple interference devices. Specifically, in the STAR-RIS-assisted wireless NOMA network based on the Nakagami-m channel, STAR-RISs are used to provide wireless communication services for both near and far-end devices, with the ES protocol based on symmetric and asymmetric transmission and reflection coefficient allocation. Considering distance factors, the SINR of both near and far-end devices are analyzed, and the exact closed-form approximate expressions for the outage probability are derived. Furthermore, to gain a more comprehensive understanding of the impact of direct communication links and interference devices on the near-end devices, a detailed analysis of the SINR in different scenarios is performed, and the exact closed-form approximate expressions for the outage probability in these different cases are derived. The main contributions of this paper are summarized as follows:
Based on Nakagami-m fading channel, considering the effect of distance factor on the system.
The effects of the direct communication link and interference devices on the near-end device are considered separately.
The square of the composite channel amplitude between the base station and the near-end device is approximated using the Gamma distribution.
A detailed analysis of the SINR for both near-end and far-end devices is provided, and closed-form approximate expressions for the outage probabilities of these devices, as well as the closed-form approximate expression for the system spectral efficiency, are derived.
The accuracy of all analytical results is validated through simulations.
The simulation results show that the power allocation of the base station, the allocation of the transmission and reflection coefficients of the STAR-RIS, the number of STAR-RIS elements, and the presence of interference devices all significantly impact the communication performance of the receiving devices. Furthermore, increasing the number of STAR-RIS elements can effectively enhance the overall performance of the system.
Notations:
denotes the statistical expectation,
denotes the statistical variance,
denotes the k-th order moment,
denotes the probability of an outcome or an event,
denotes the Probability Density Function (PDF),
denotes the Cumulative Distribution Function (CDF),
denotes the Gamma function [
30], eq. (8.310),
denotes the lower incomplete Gamma function [
30], eq. (8.350.1),
denotes the upper incomplete Gamma function [
30], eq. (8.350.2),
denotes the modified Bessel function [
30], eq. (8.432),
denotes the Beta function [
31], eq. (8.38),
denotes the Meijer G-function [
30], eq. (9.301),
denotes the univariate Fox’s H-function [
31], Definition 1.1, and
(The bivariate Fox’s H-function can be computed by using the methods provided in [
32,
33,
34]) denotes the bivariate Fox’s H-function [
31], Definition 2.7.
2. System and Channel Models
As shown in
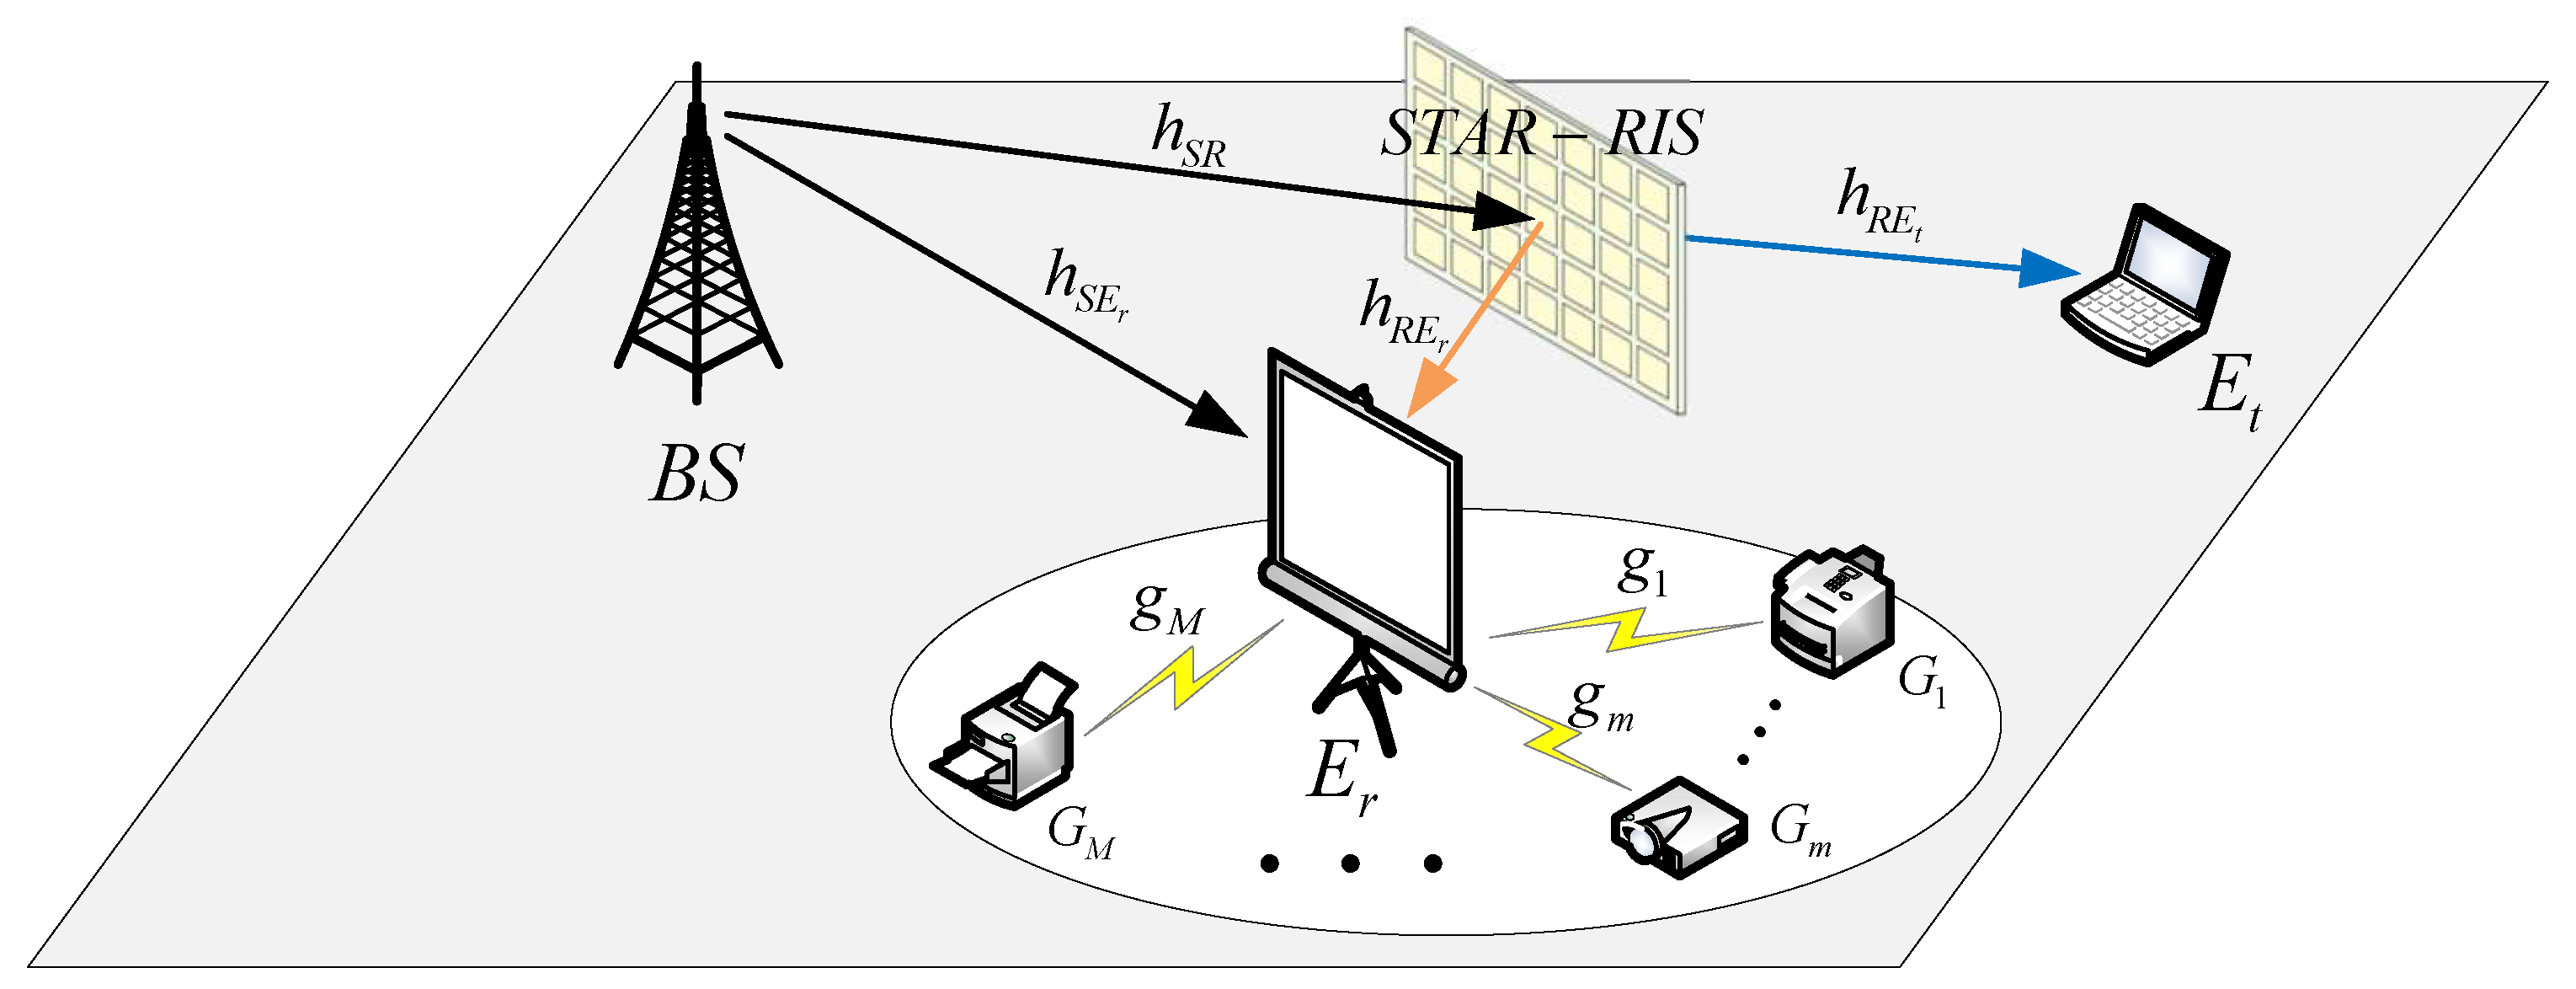
Figure 1, considering a STAR-RIS-assisted downlink NOMA wireless educational communication system with
N elements, where the Base Station (BS) serves as the transmitter and simultaneously delivers messages to two authorized devices: a near-end device (
) and a far-end device (
). Specifically,
is located on the front side of the STAR-RIS and can receive signals directly from the BS as well as reflected signals from the STAR-RIS. Meanwhile, multiple interference devices (
) are present near
. On the other hand,
is positioned on the back side of the STAR-RIS, and due to severe fading or blockage has no direct link to the BS. Consequently,
can only receive transmitted signals from the STAR-RIS. Additionally, it is assumed that each device is equipped with a single antenna [
35,
36]. Notably, each element of the STAR-RIS is capable of simultaneously reflecting and transmitting incident signals in the desired directions.
It is assumed that the BS-R and R- () links are Line-Of-Sight (LOS) paths, while the BS- and - links are non-Line-Of-Sight (nLOS) paths. All LOS links are modeled as Nakagami-m fading channels, and all nLOS links are modeled as Rayleigh fading channels (a special case of the Nakagami-m distribution with ). Specifically, the direct BS- and interference - channel coefficients are denoted as ∼ and ∼, respectively, where and represent the distances of the BS- and - links, and and denote the path loss exponents for these links. The channel vectors of the S-R and R- links are represented as ∼ and ∼, respectively, where and represent the distances of the BS-R and R- links, and and denote the corresponding path loss exponents. Therefore, the magnitudes of all channel coefficients follow a Nakagami-m distribution, specifically ∼, ∼, ∼, and ∼, where the parameter (, ) and represent the shape and scale parameters of the Nakagami-m distribution. Additionally, all channels are assumed to be mutually independent.
The reflection and transmission matrices of the STAR-RIS can be represented as
and
, respectively, where
and
denote the adjustable phases introduced by the
n-th element of the STAR-RIS during the reflection and transmission processes, respectively, with
. In the Enhanced Sensing (ES) mode, the total incident energy is divided into reflection and transmission modes. Specifically,
and
represent the adjustable reflection and transmission coefficients associated with the
n-th element of the STAR-RIS for devices
and
, respectively, with
[
37,
38,
39]. In the case of a large number of STAR-RIS elements assisting transmission, and to reduce computational complexity and facilitate simulation validation, it is assumed that the amplitude coefficients of all reflection elements are identical, and the amplitude coefficients of all transmission elements are also identical, i.e.,
and
for
[
27,
37,
40,
41], where
and
are constant values. Additionally, perfect Channel State Information (CSI) for all links is assumed to be available at the device nodes in order to maximize the SINR at the device end [
35,
36,
42,
43,
44].
Based on the NOMA transmission scheme, the BS employs Superposition Coding (SC) to transmit the superimposed signal
to
and
, where
is the transmitted power by the BS and
and
represent the information intended for
and
, respectively. The parameters
and
denote the power allocation coefficients for
and
under the NOMA mechanism. Considering average performance,
generally exhibits better channel quality than
. Therefore, the BS allocates more power to the far-end device
compared to the near-end device
. As a result,
employs Successive Interference Cancellation (SIC) to decode its signal, while
directly decodes its signal without interference cancellation. The power allocation coefficients satisfy the relationship
, with
[
45].
The received signal at device
, consisting of the superimposed signals from both the BS and the STAR-RIS, can be expressed as
where
represents the interference signal from the interference source and
denotes the average power of the interference signal.
is an Additive White Gaussian Noise (AWGN) with zero mean and variance
, i.e.,
∼
. The device
receives the combined signal from the STAR-RIS and the interference source
, which is expressed as
where
is also the AWGN with zero mean and variance
, i.e.,
∼
.
In the downlink NOMA scheme, the near-end device with better channel gain performs SIC and detects the signal of the far-end device with poorer channel conditions. After performing SIC, the near-end device subtracts the signal corresponding to the data detected from the far-end device from the received signal and then decodes its own data [
37,
38,
39]. Since
is closer to the BS than
, the SINR for decoding
at
is given by
where
represents the average Signal-to-Noise Ratio (SNR) of the signal source and
represents the average SNR of the interference source. After performing SIC, the near-end device, i.e.,
, decodes its own signal
, and the corresponding SINR can be expressed as
Unlike
, the far-end device
directly decodes its own signal
and treats the information from
as interference. Therefore, the SINR at
can be expressed as
For ease of analysis, define that
and
, which can be further expressed as
and
By adjusting the reflection or transmission phase of the STAR-RIS elements, the total phase shift of the composite S-R-Er link can be cancelled to achieve the maximum SINR, i.e.,
and
[
37]. Meanwhile, let
and
[
38]. Considering the independence between the interference links and their identical distribution, the maximum SINR at devices
and
can be further written as
and
where
.
For the near-end device, if the direct communication link is not considered and only the STAR-RIS reflection link is taken into account, the SINR at
can be expressed as
If the impact of interference devices is neglected, the SINR at
can be expressed as
3. The PDF and CDF of H1
The structure of
is inherently complex. Directly employing its exact PDF and moments to derive the PDF or CDF can lead to significant computational complexity and analytical challenges. To mitigate these issues, an approximation method proposed in [
5] is adopted; the Gamma distribution is leveraged to simplify the analysis, i.e.,
and the parameters
and
can be expressed as
and
Furthermore, if
X follows a Nakagami-
m distribution, i.e.,
X∼
, its
k-th moment is given by [
5], i.e.,
here,
, where
m and
represent the shape and scale parameters of the Nakagami-
m distribution, respectively (note that the Rayleigh distribution is a special case of the Nakagami-
m distribution when
). For convenience in the following calculations and expressions,
,
,
. The variances are given by
,
,
.
The expectation and variance of
can be written as
and
where
and
If two random variables,
X and
Y,are independent, the variance of their product can be computed as
. Then, we have
and the expectation of
can ultimately be expressed as
For the fourth moment of
, i.e.,
, directly solving using the integral definition is too complex. Here, we adopt the Gaussian distribution approximation method, i.e., approximate
by a Gaussian distribution, i.e.,
where
and
. Then, based on the Gaussian distribution, the fourth moment of
is calculated, i.e.,
Based on the integral equation
[
30], eq. 6.462.4, and the definition of the Hermite polynomials [
30], eq. 8.950.1, i.e.,
, and the expression for
given in [
30], eq. 8.950.7, i.e.,
, we can obtain the fourth moment of
, i.e.,
, as
Then, we can obtain the PDF and CDF of
, i.e.,
and
Thus, the PDF and CDF of
can be expressed as
and
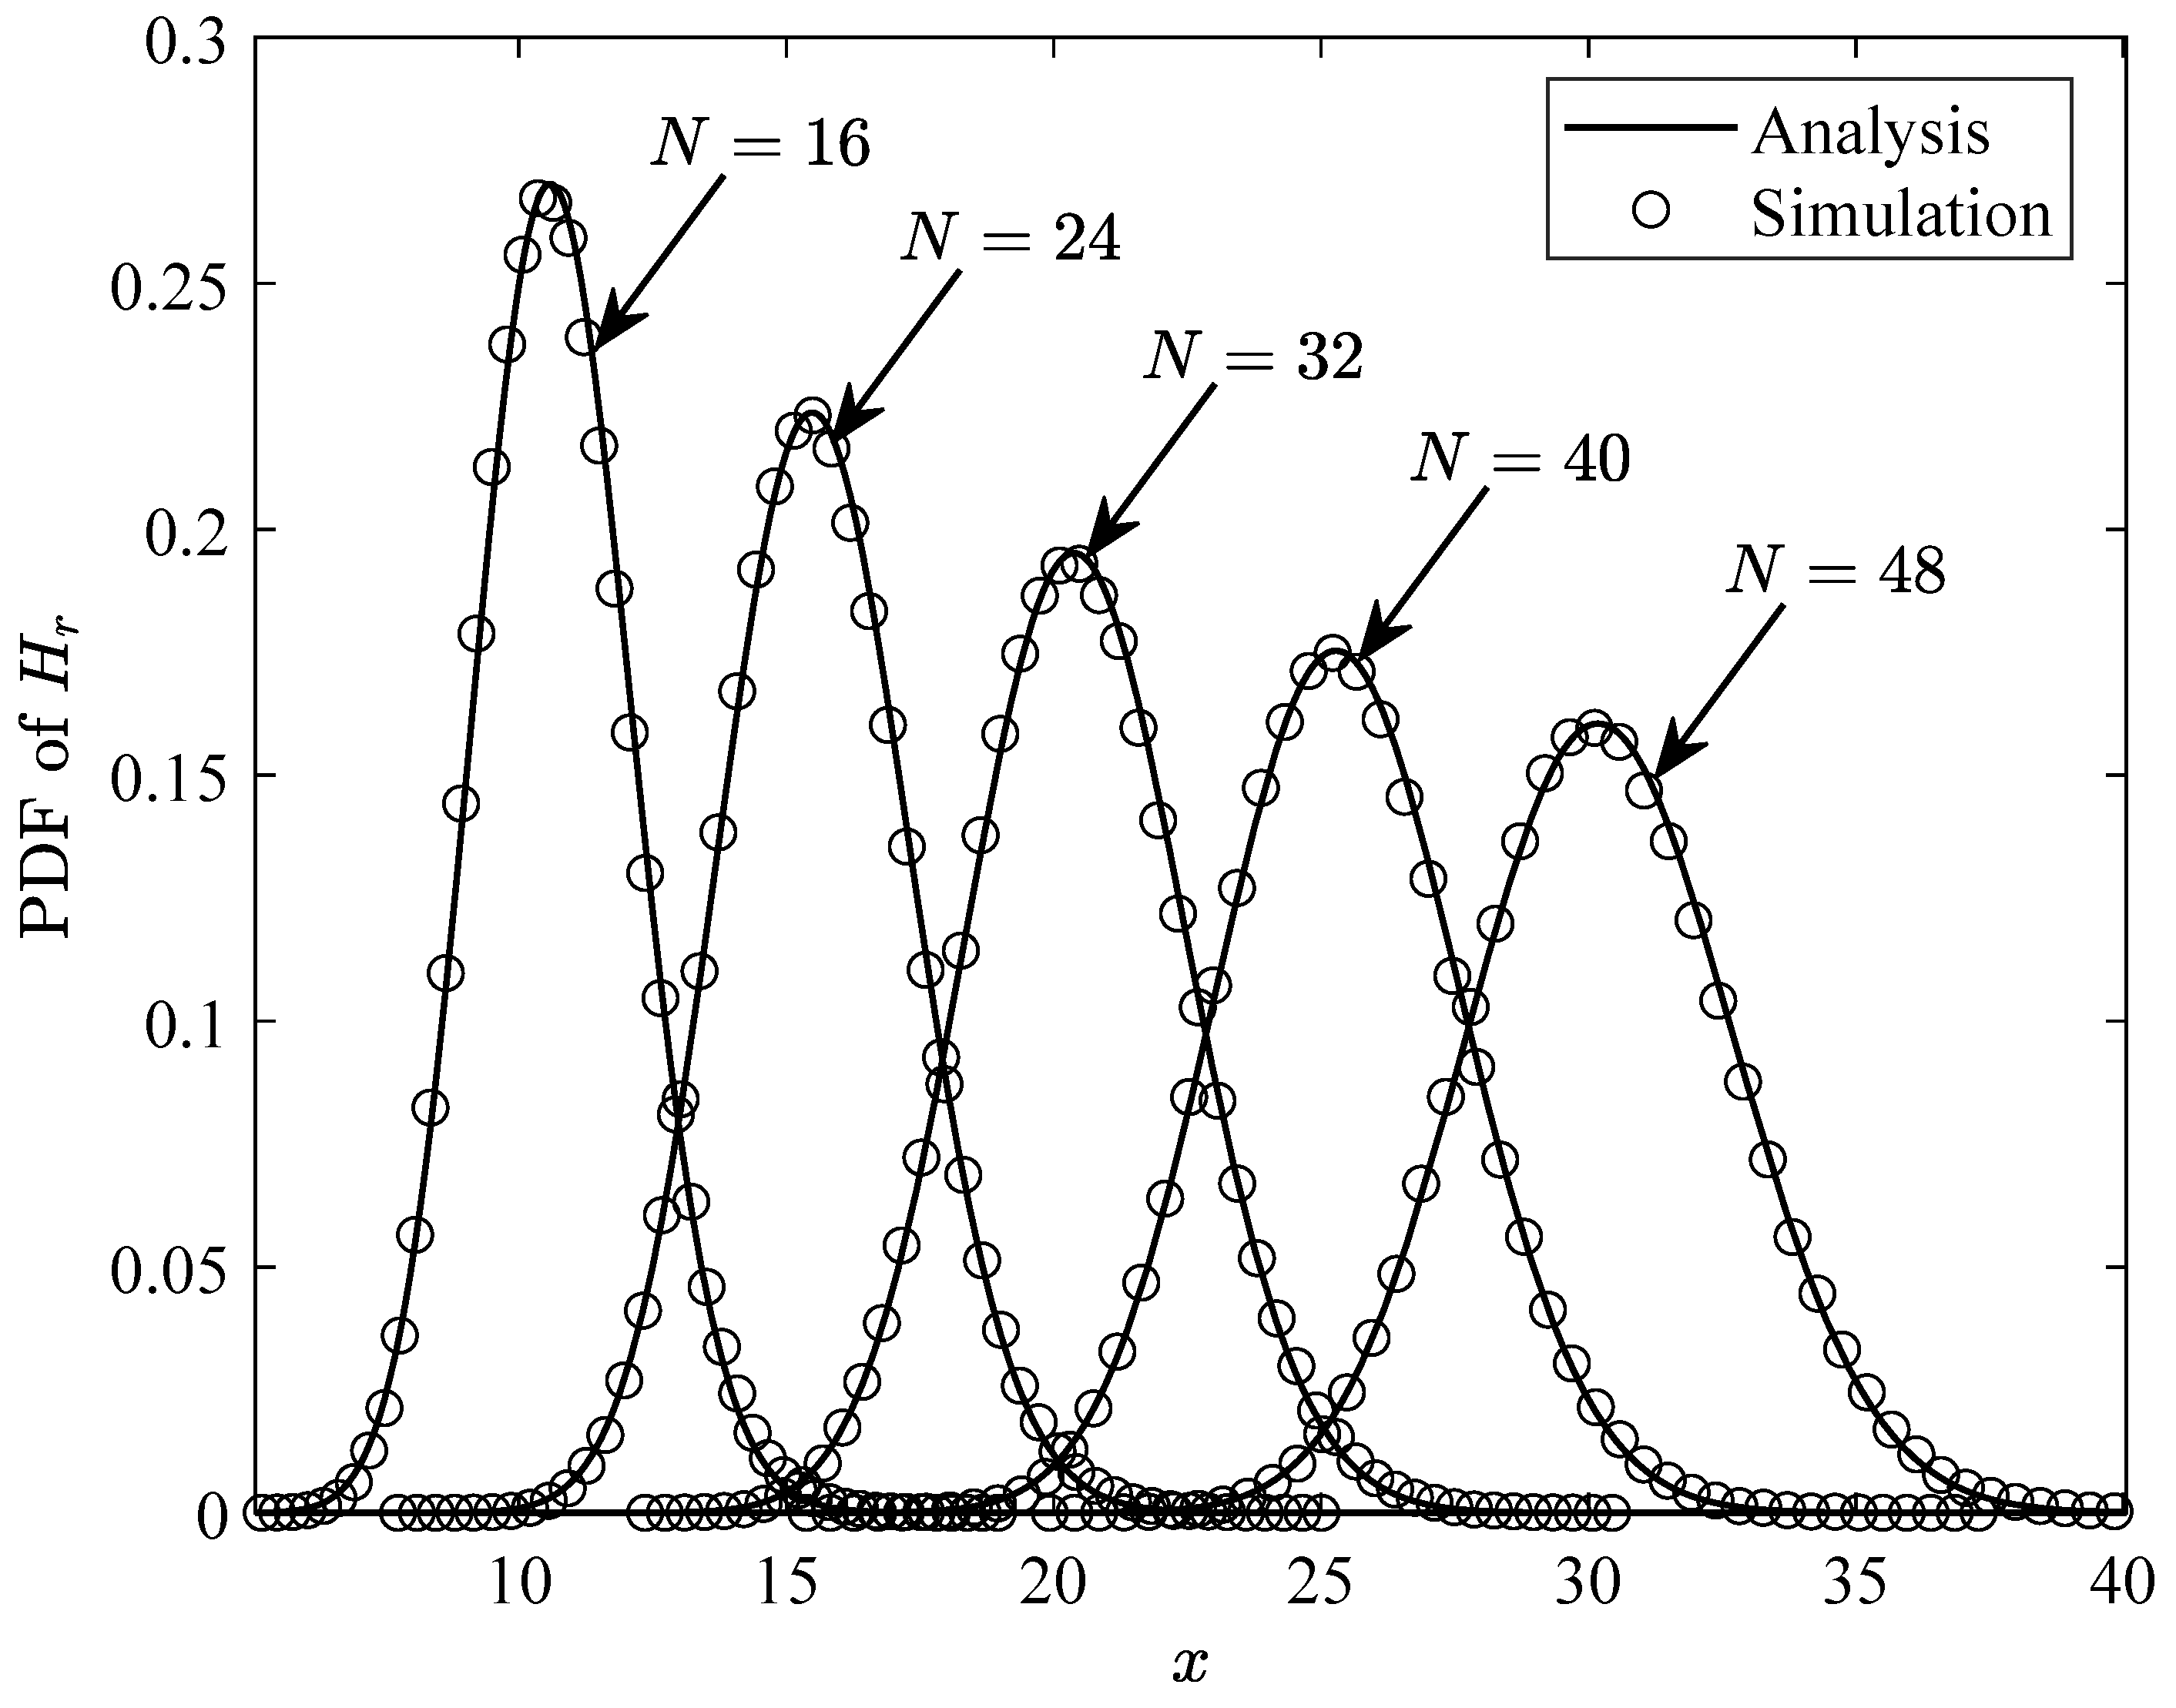
Figure 2 and
Figure 3 validate the accuracy of the previously derived approximate distributions. Specifically, under the conditions of
,
,
, and
,
, the approximate expressions for the PDF and CDF of
are compared with the estimated true distribution obtained through Monte Carlo simulations. As illustrated in the figures, the PDF and CDF curves for different values of
N exhibit strong consistency with the Monte Carlo simulation results of the true distribution. This further confirms the accuracy of the derived PDF and CDF expressions for
, i.e., (
25) and (
26).
7. Numerical and Simulation Results
This chapter presents the numerical and simulation results for the outage probabilities of near-end and far-end devices, as well as the system spectral efficiency under the assistance of STAR-RISs. In order to gain a more comprehensive understanding of the performance of near-end devices, the impact of interference devices and direct communication links on the outage probability of the near-end device is discussed in detail. It is noteworthy that, unless otherwise specified in the figures, the simulation parameters are set as follows:
,
,
,
,
;
,
,
,
,
,
,
,
,
, and
,
[
16,
28,
29,
37,
38,
39,
48,
49].
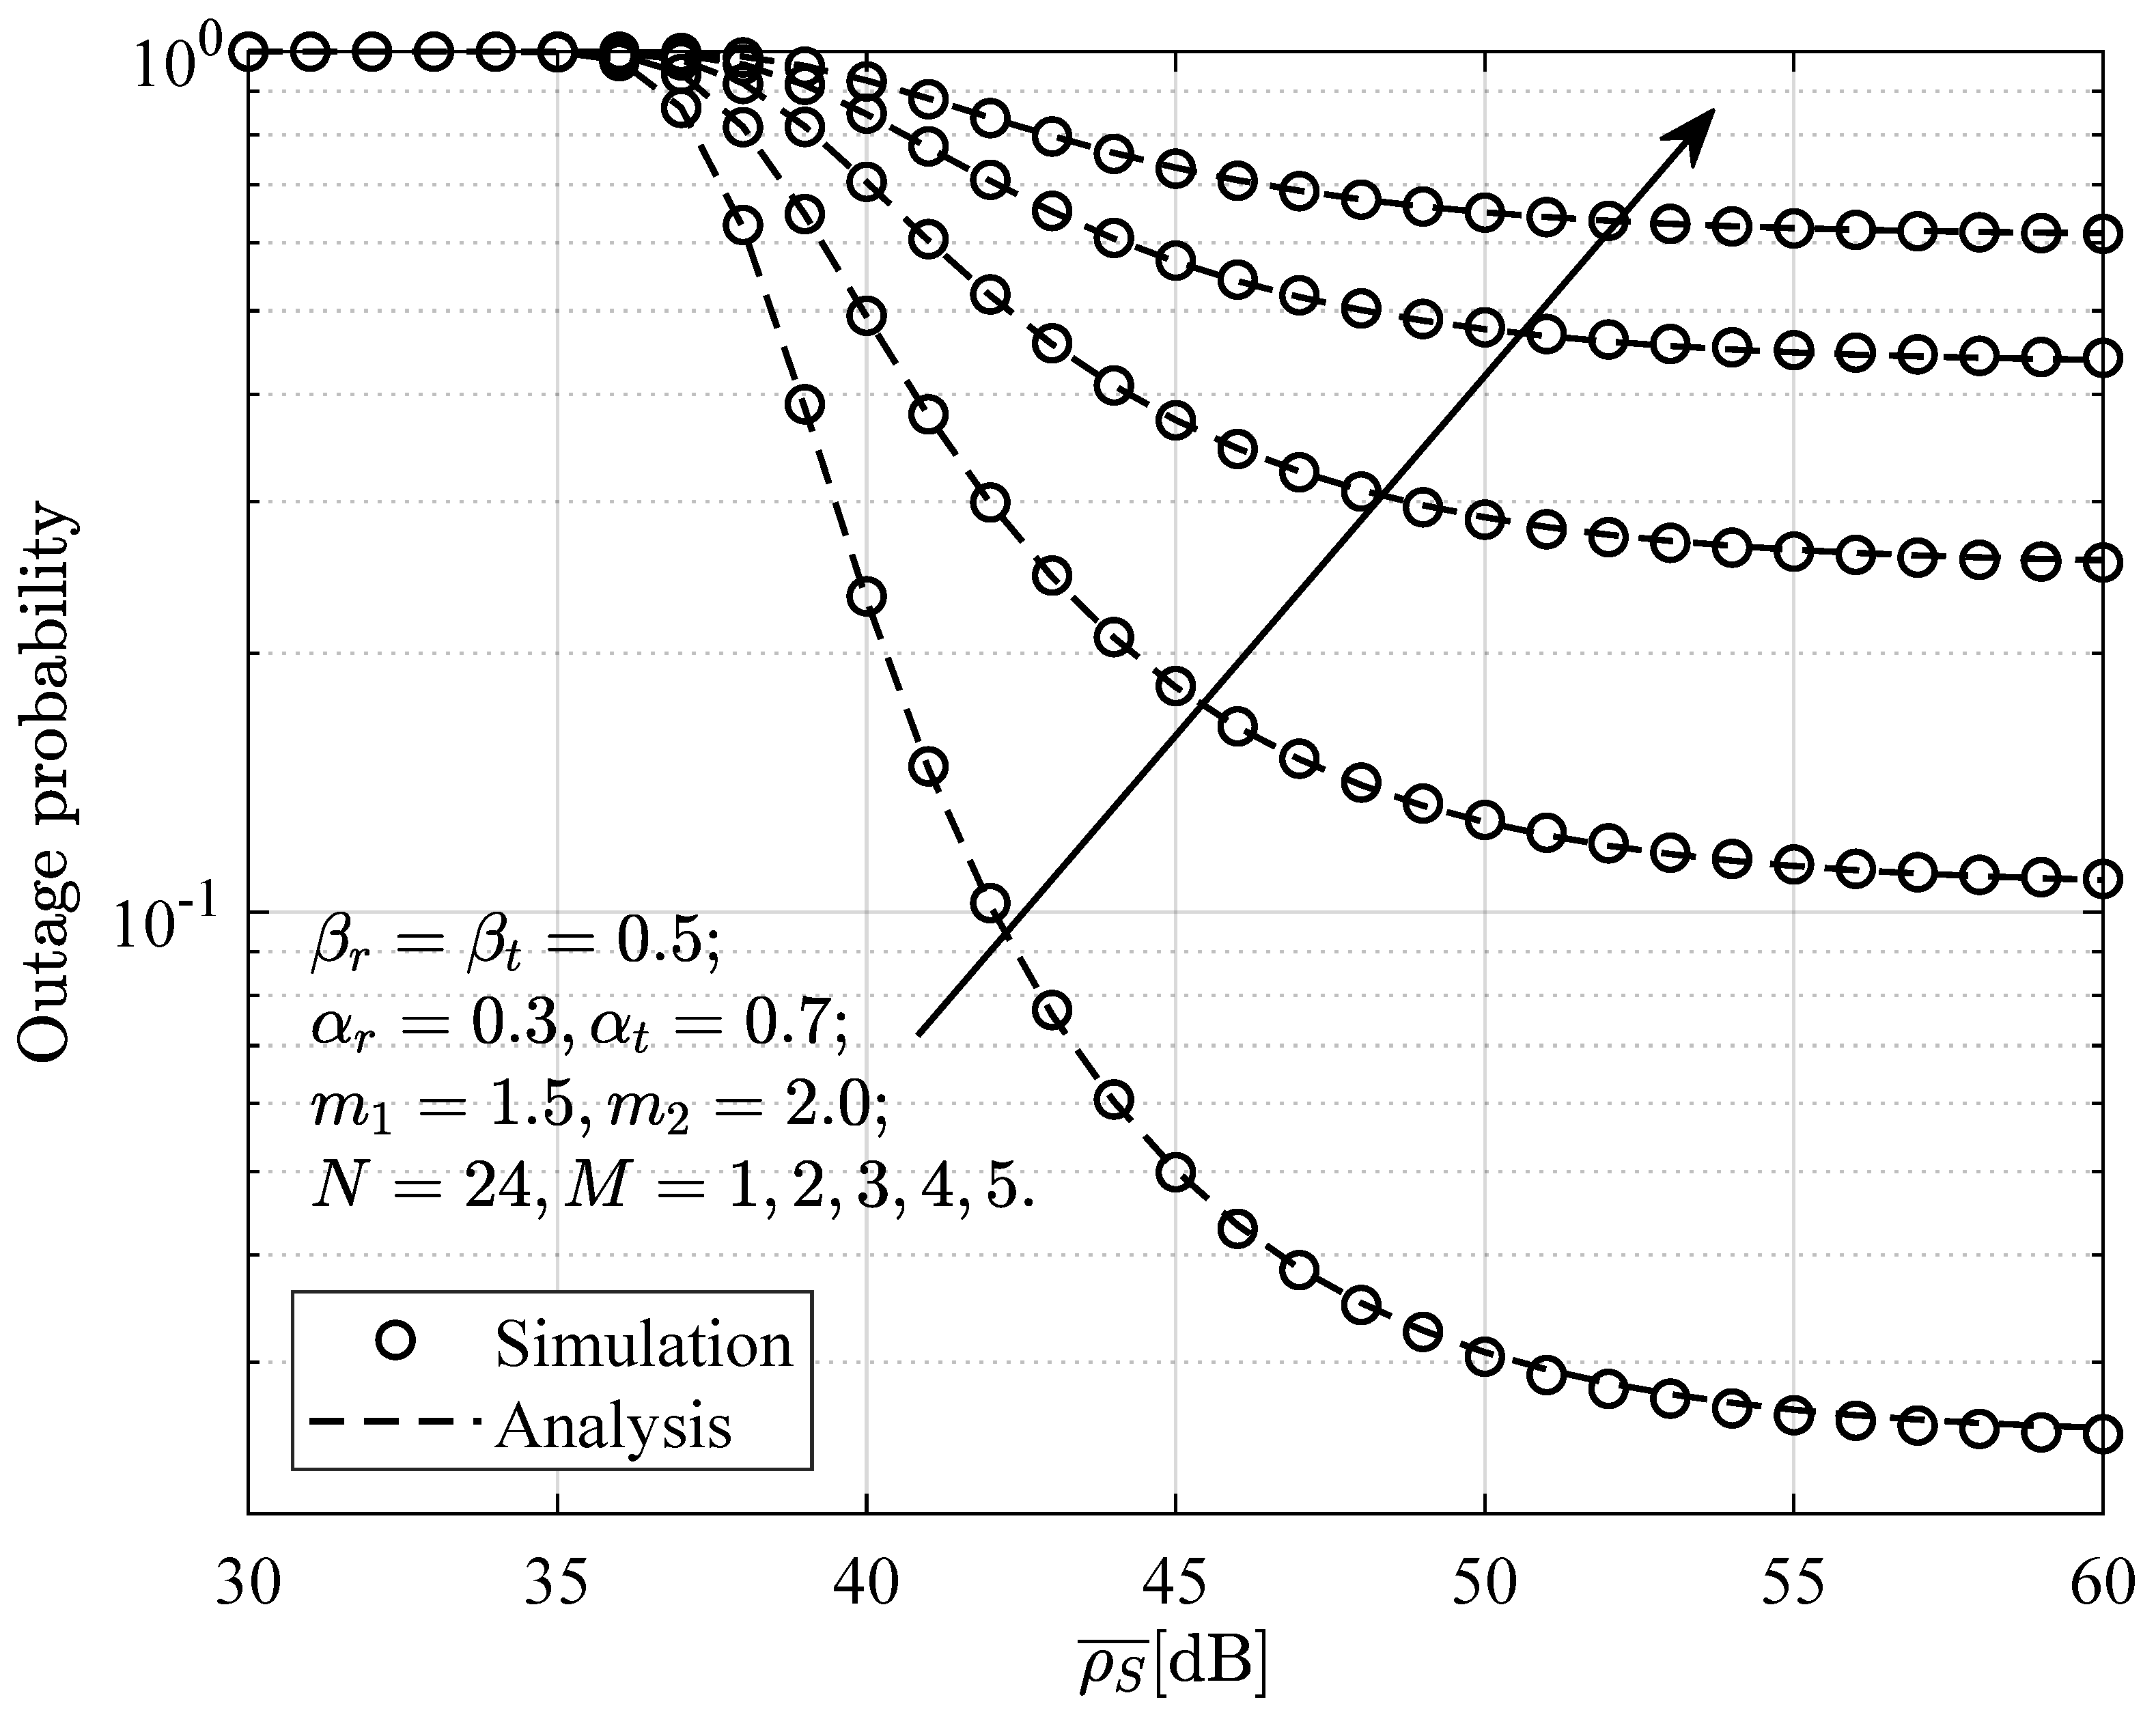
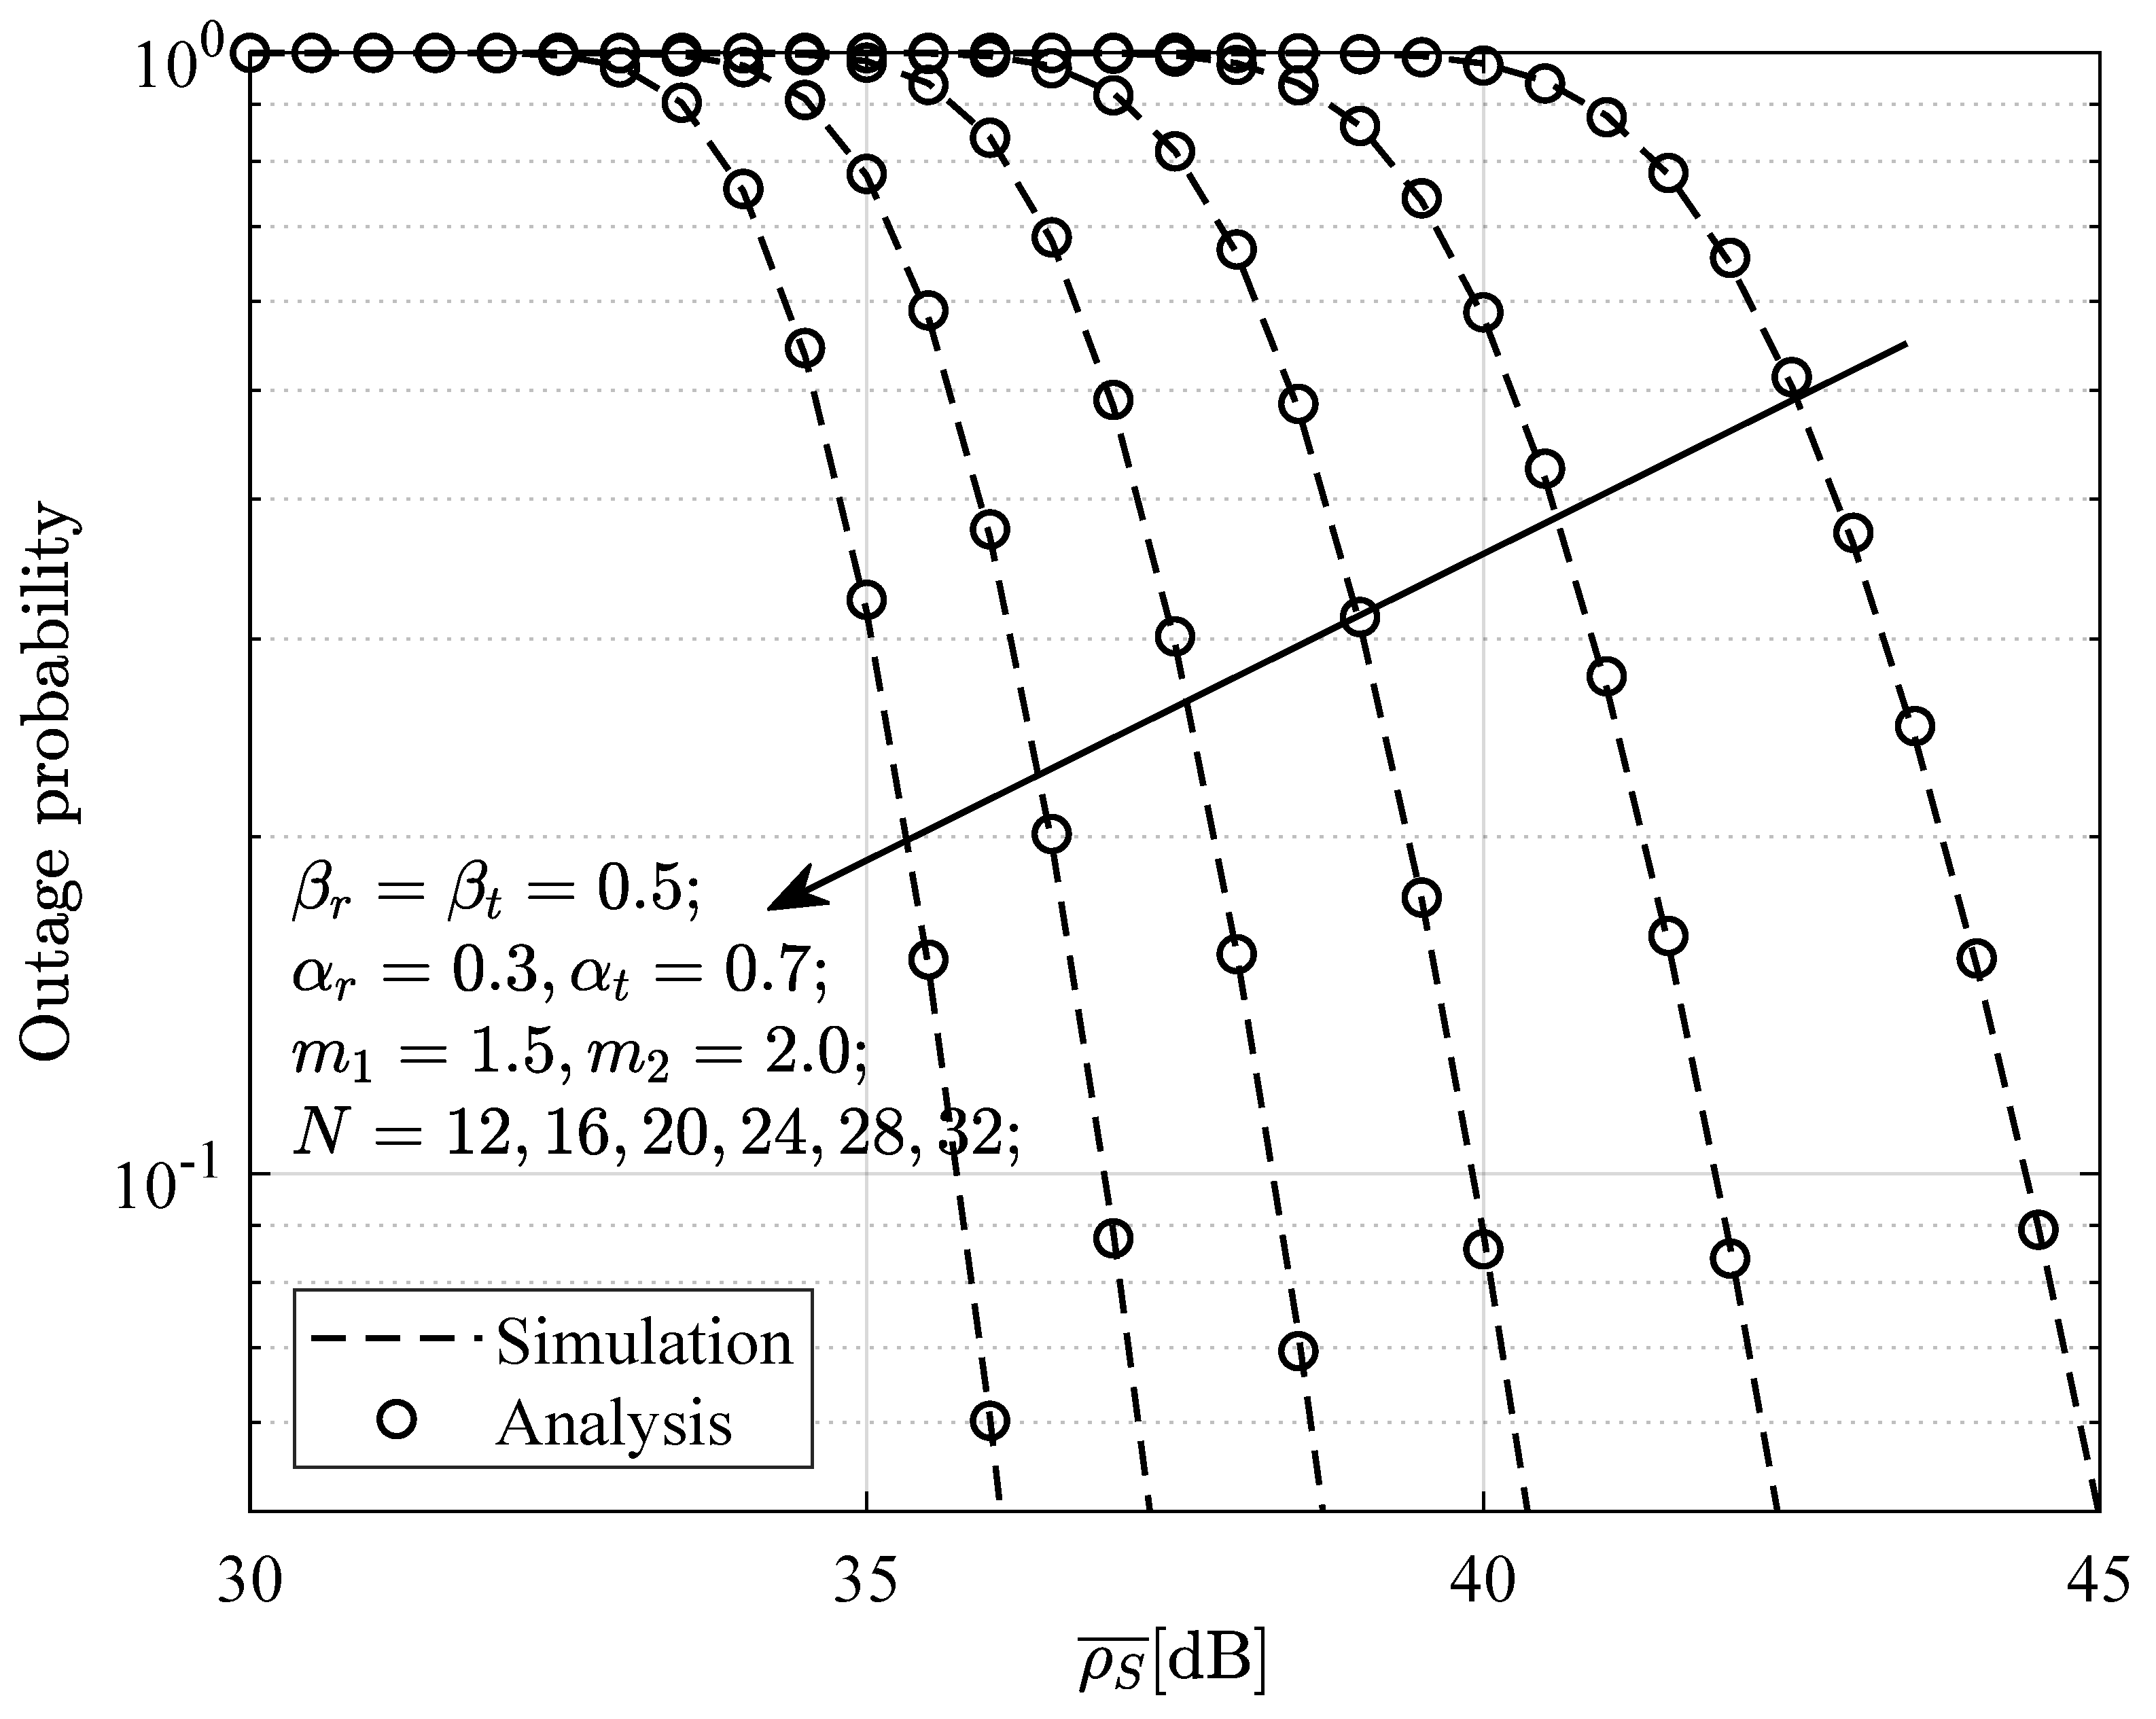
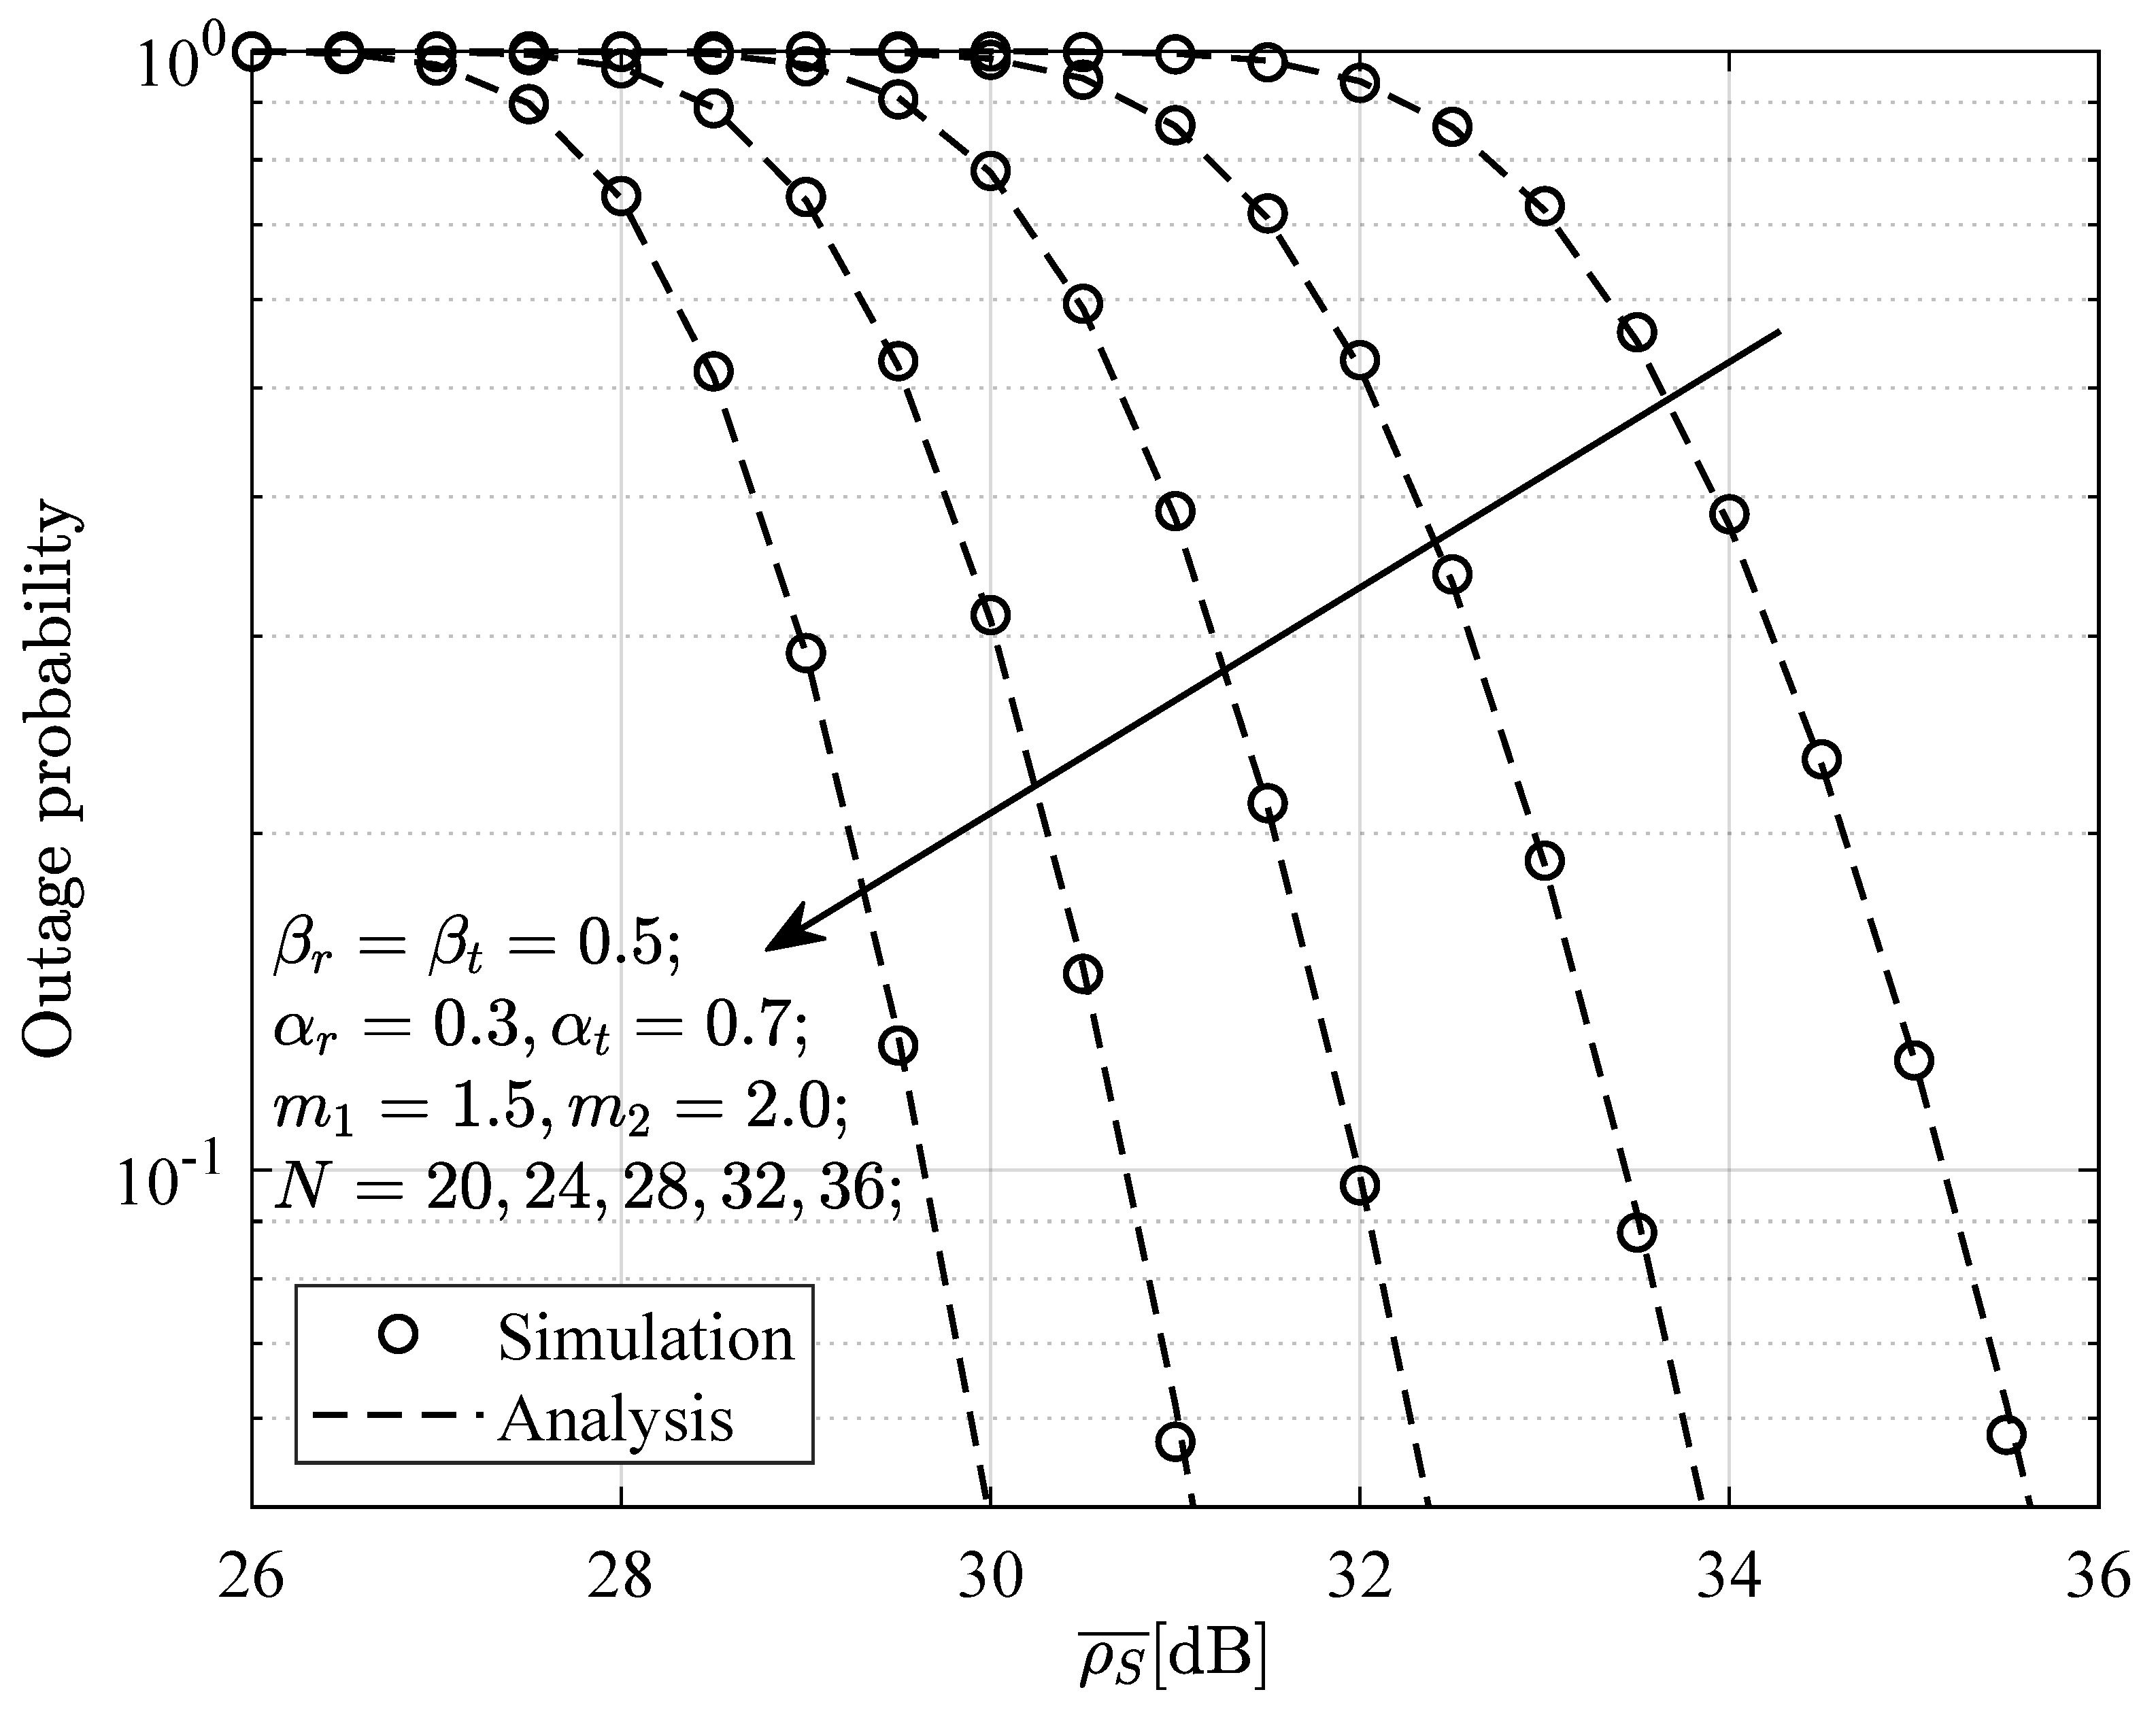
Figure 4 and
Figure 5 show the relationship between the outage probability at the near-end device and the average SNR when a direct communication link and interference devices are present. Specifically, under the conditions
,
,
,
,
,
, and
,
Figure 4 and
Figure 5 compare the effects of different values of
N and
M on the outage probability. From the figures, it can be observed that the numerical and simulation curves are in good agreement. As the average SNR increases, the outage probability gradually decreases. Furthermore, from
Figure 4, it is evident that, as
N increases, the outage probability decreases, suggesting that increasing the number of elements in the STAR-RIS can effectively mitigate the impact of interference devices on the receiving device. In contrast,
Figure 5 shows that, as the number of interference devices around the near-end device increases, the outage probability increases, indicating that interference devices have a significant impact on the receiving device.
Figure 6 and
Figure 7 present the relationship between the outage probability at the near-end device and the average SNR when the direct communication link is absent but interference devices are present. From the figures, it can be observed that, under certain conditions, the numerical results align well with the simulation results. Additionally, the outage probability decreases as the average SNR increases. Moreover, the outage probability also decreases as
N increases, but increases as
M increases. This suggests that, even in the absence of a direct communication link, increasing the number of elements in the STAR-RIS can effectively mitigate the impact of interference devices on the receiving device.
Figure 8 illustrates the relationship between the outage probability at the near-end device and the average SNR when no interference devices are present but a direct communication link exists. From the figure, it can be observed that the numerical results align well with the simulation results. As the average SNR or
N value increases, the outage probability continuously decreases, which further validates the accuracy of the analytical results provided in the previous chapter.
Figure 9 shows the relationship between the outage probability at the far-end device and the average SNR for different values of
N. From the figure, it can be observed that, as the average SNR increases, the outage probability continually decreases. Furthermore, as the
N value increases, the corresponding outage probability curve becomes lower. Additionally, the numerical results align well with the simulation curves, which further confirms the accuracy of the analysis and derivation results.
Figure 10 shows the relationship between the outage probability and the average SINR for different values of
and
, where the two have a good fit. Specifically, under the condition
, when
or
is fixed, the outage probability increases as
or
increases. In other words, as the power allocated to the far-end device or the transmission coefficient of the STAR-RIS increases, the outage probability decreases. Therefore, by controlling the power allocation at the transmitter or the transmission and reflection coefficients of the STAR-RIS, the performance of the far-end device can be significantly improved.
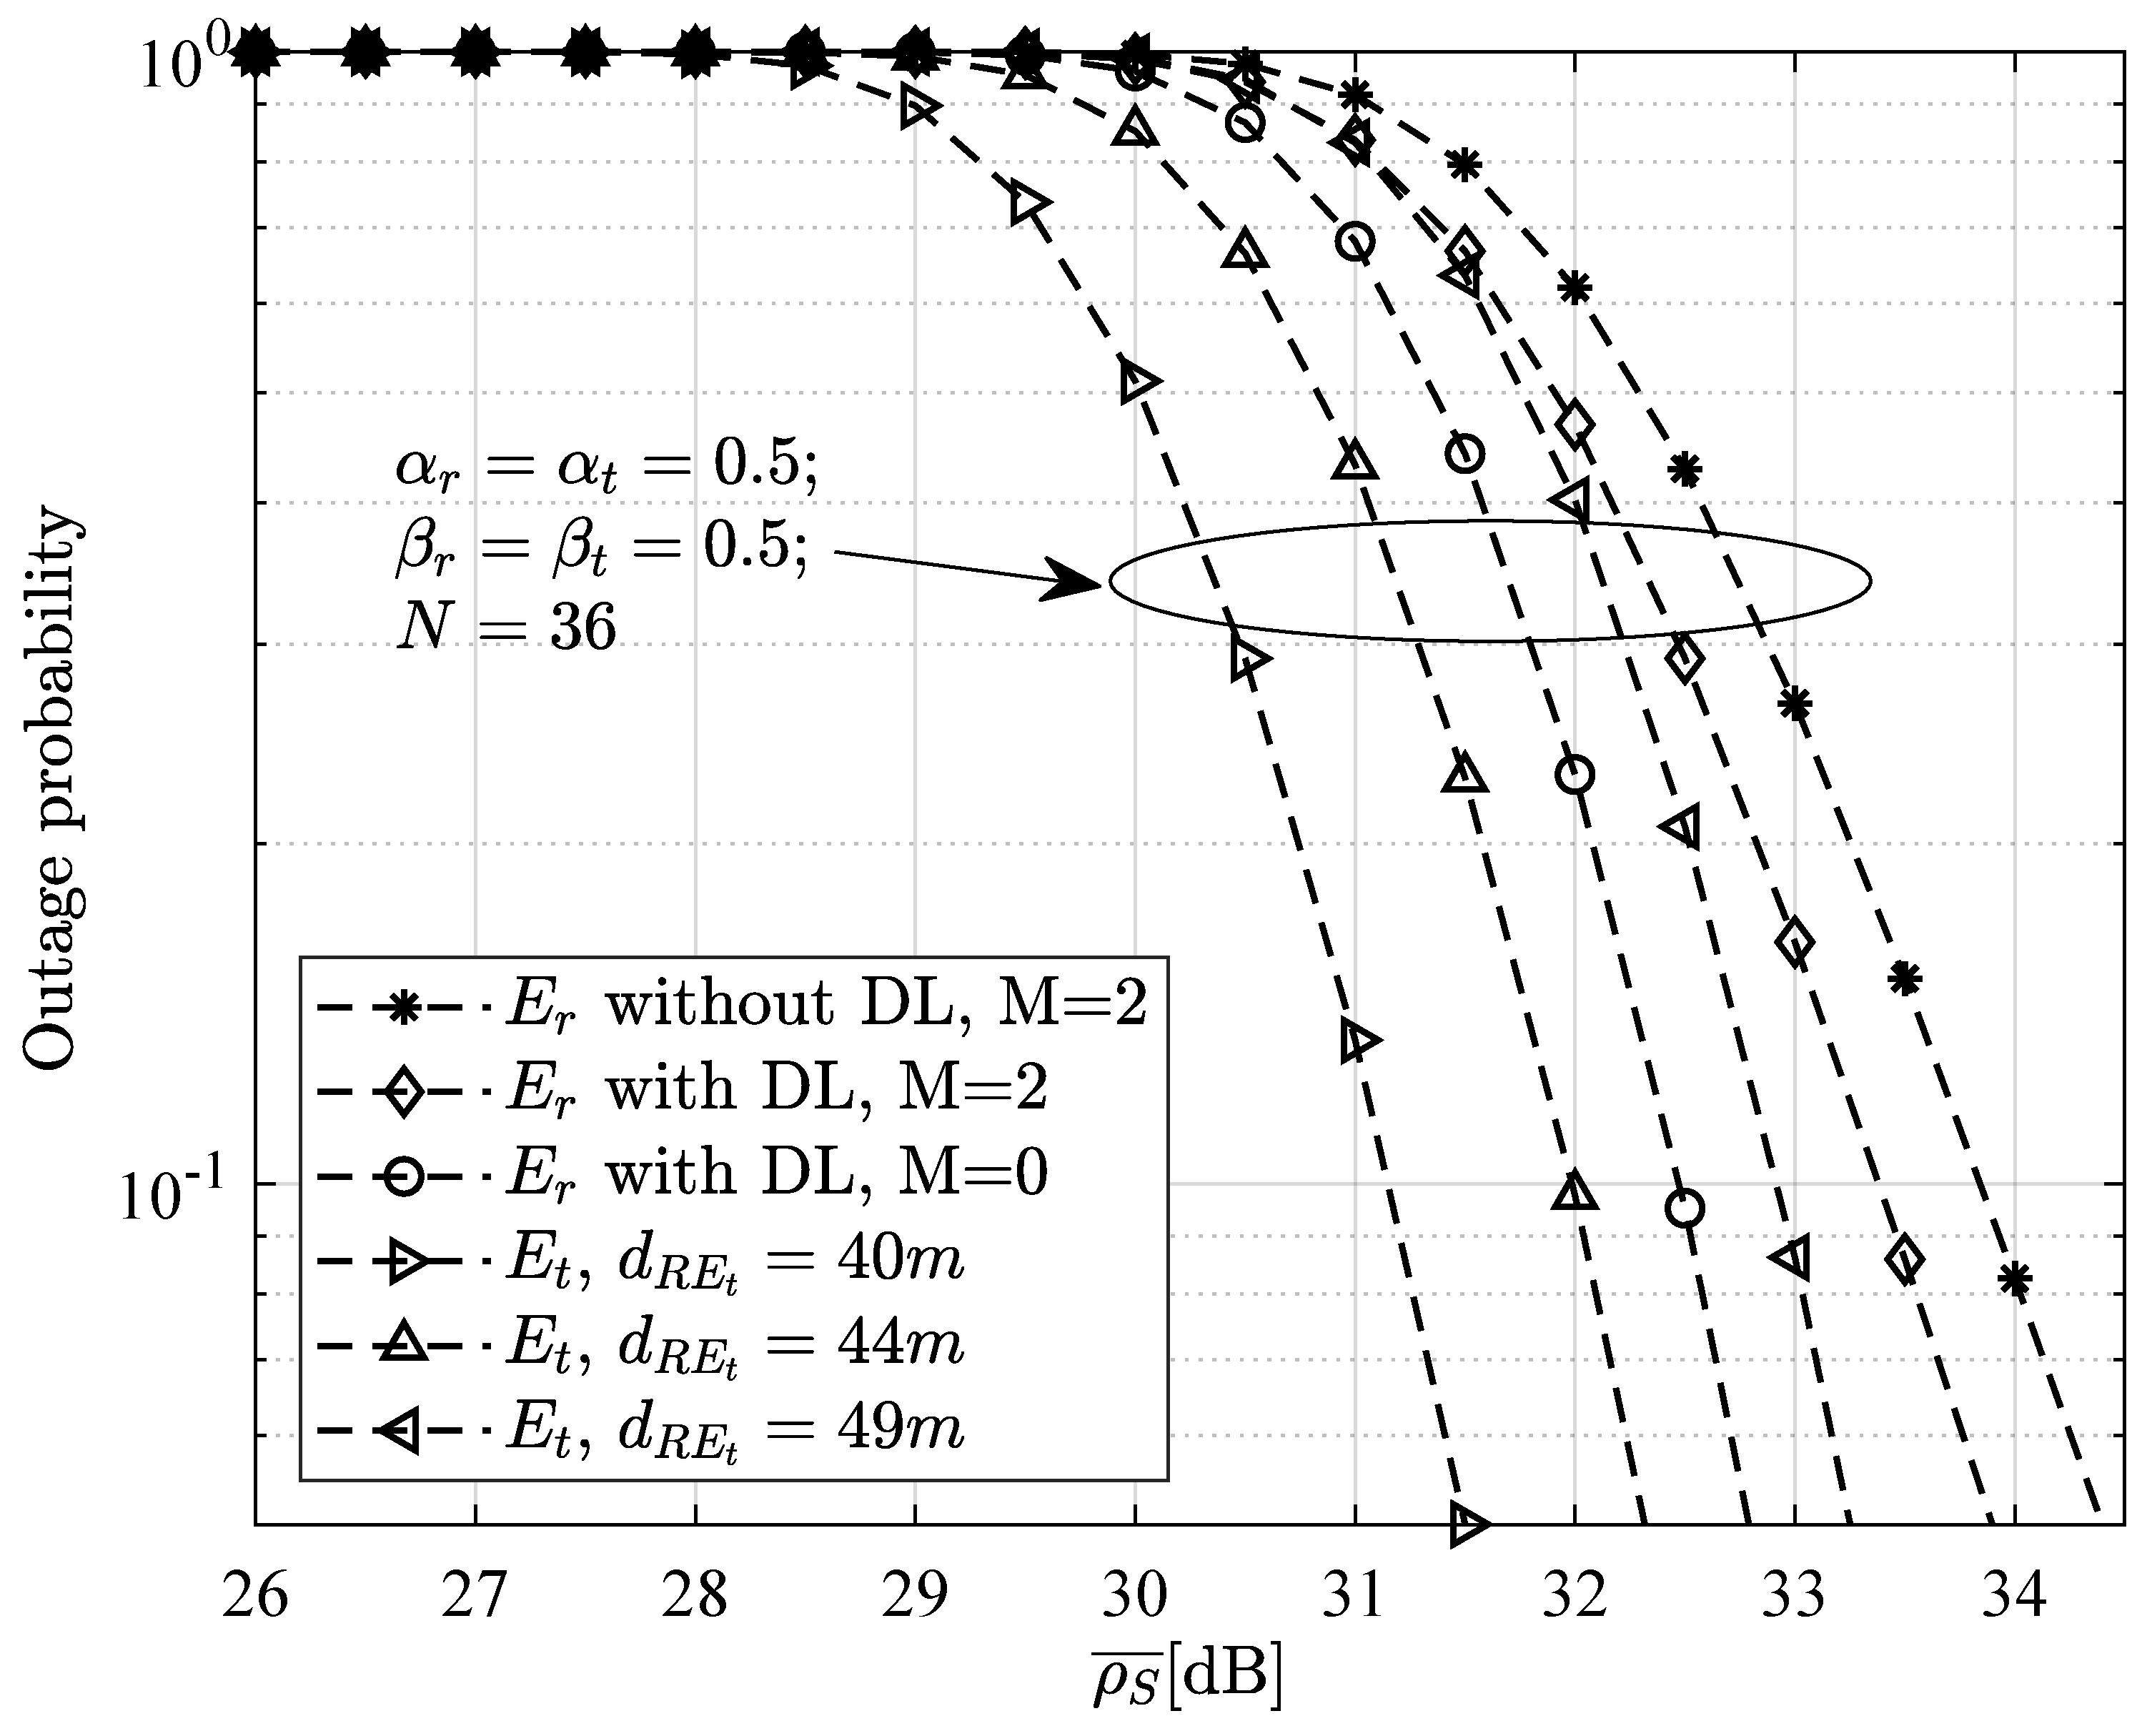
Figure 11 provides a comparison of the outage probability under different conditions. It is worth noting that the distance between the STAR-RIS and device
is set to
. From the figure, it can be observed that, under the conditions of
, the outage probability is the lowest for
when there are no interference devices and the direct communication link exists. The outage probability is the highest when interference devices are present and the direct communication link is absent. For
, as the distance between the STAR-RIS and
increases, the outage probability also increases. Furthermore, a comparison shows that, under the same conditions and with
, the outage probability of device
is lower than that of
when interference devices are present (M = 2) and the direct communication link exists, but higher than that of
when there are no interference devices and the direct communication link exists. This indicates that, under the same conditions, the direct communication link can significantly improve the communication performance of device, while the presence of interference devices can significantly degrade the communication performance.
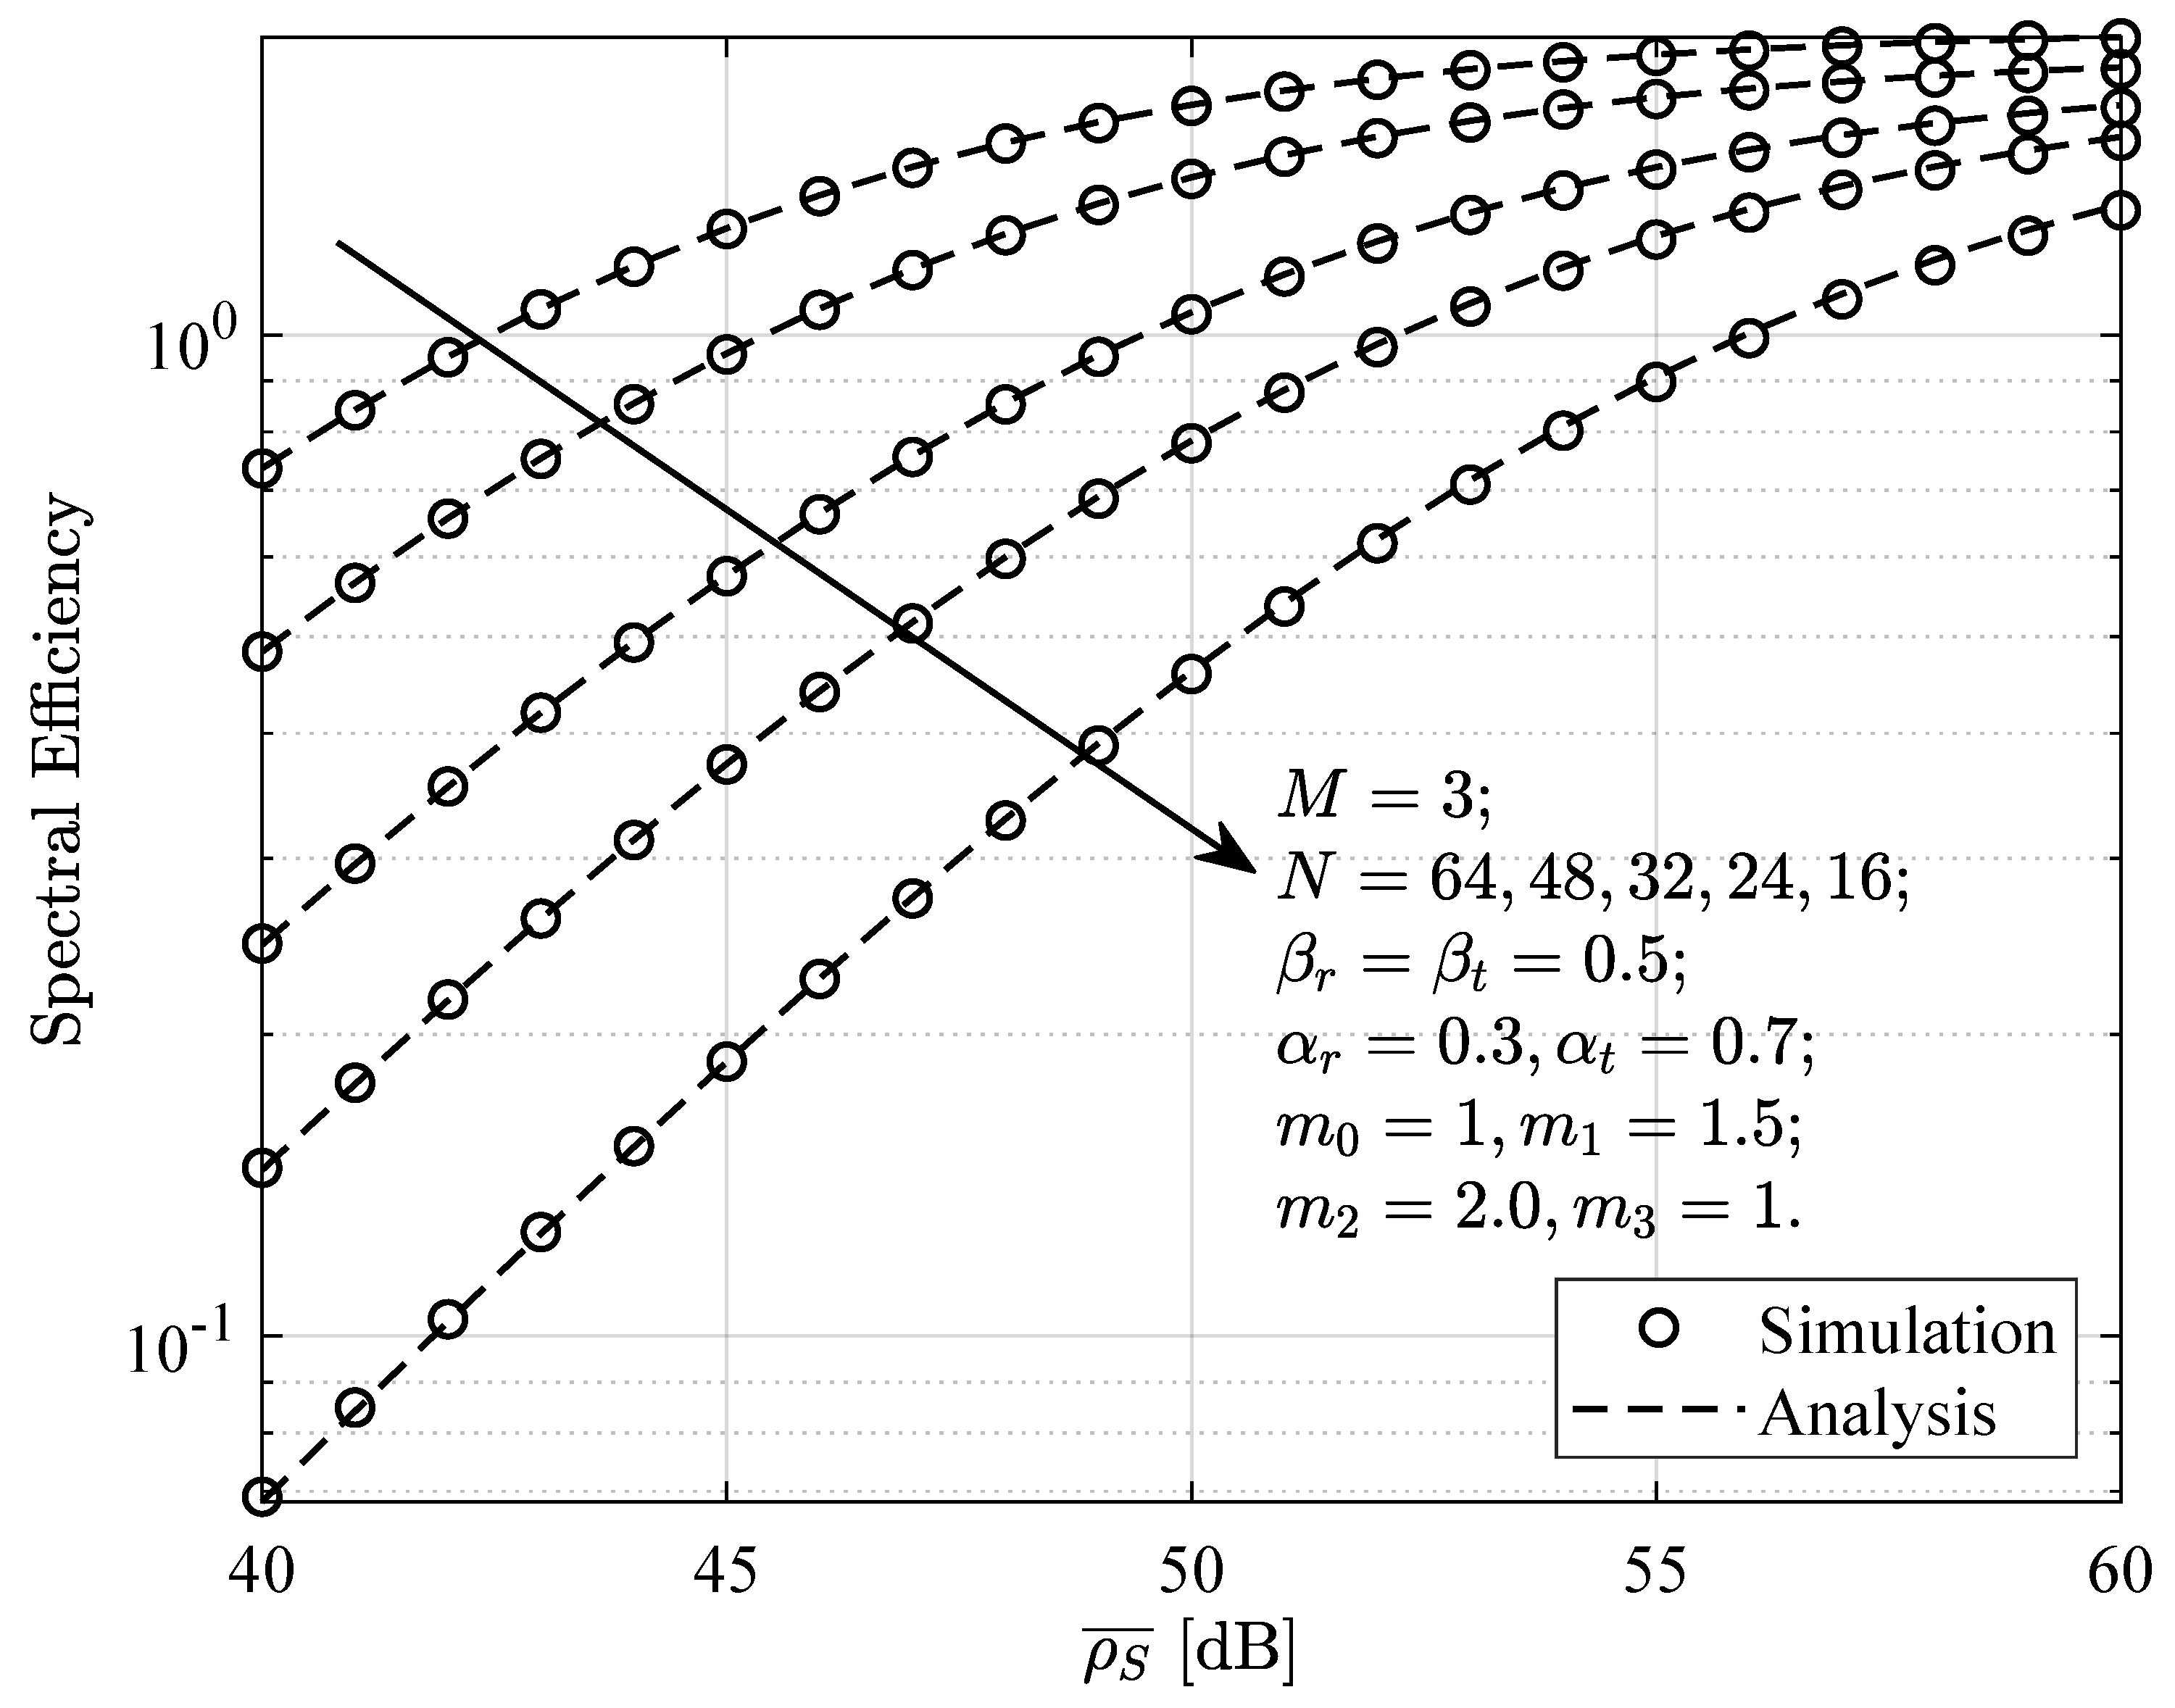
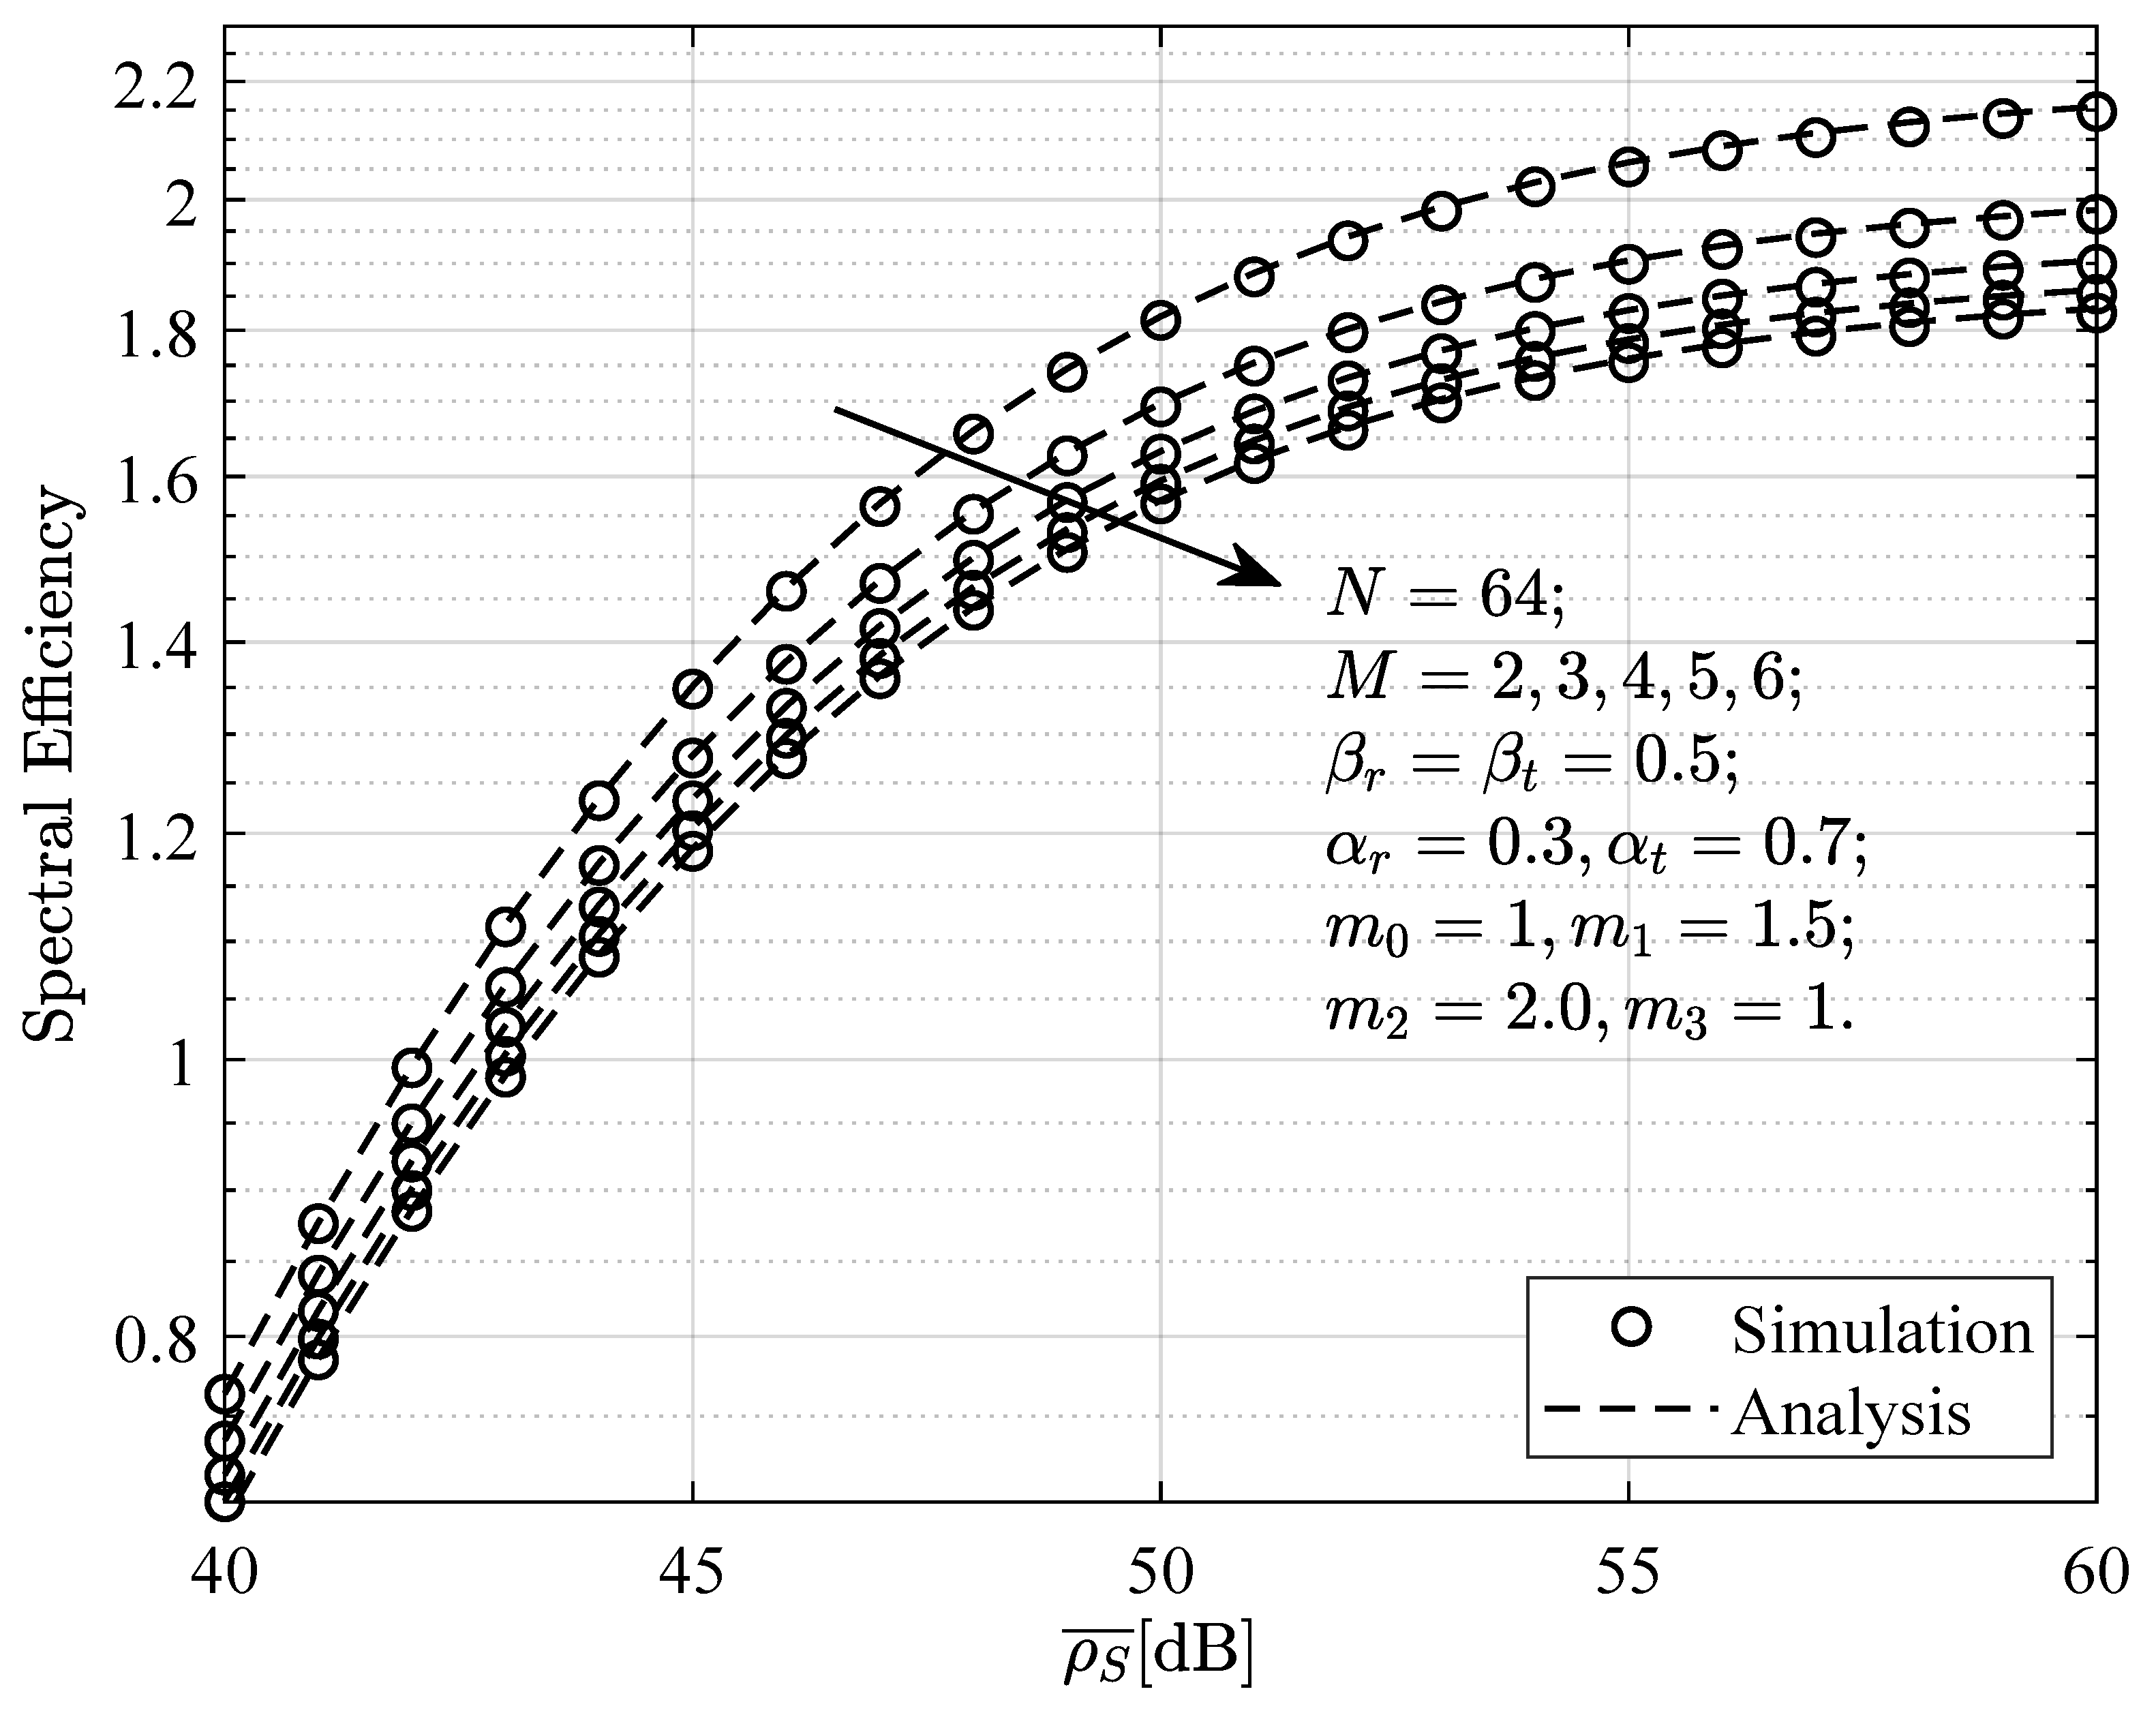
Figure 12 and
Figure 13 represent the relationship between the system spectral efficiency and average SNR under different values of
N or
M. The relevant simulation parameters are shown in the figures. From the figures, it can be observed that the spectral efficiency increases as the SNR increases. Additionally, the spectral efficiency improves with the increase in the number of elements in the STAR-RIS. However, when the number of interference devices increases, the spectral efficiency decreases. This result further demonstrates that the number of STAR-RIS elements and the interference sources at the near-end device significantly impact the system’s spectral efficiency. When the number of interference sources is fixed, increasing the number of STAR-RIS elements can effectively enhance the system’s spectral efficiency.
8. Conclusions
This study provides a detailed analysis of the performance of a STAR-RIS-assisted NOMA wireless education network, considering factors such as interference devices and distance. Specifically, in the STAR-RIS-assisted NOMA wireless education network the, STAR-RIS employs the ES protocol with symmetric and asymmetric transmission and reflection coefficient allocation. A detailed analysis of the SINR for both near-end and far-end devices is presented, with particular focus on the SINR conditions of the near-end device under different scenarios, such as the existence of a direct communication link between the base station and the near-end device, and the presence of interference devices near the near-end device. Based on the SINR of both near-end and far-end devices, closed-form approximate expressions for the outage probability and spectral efficiency were derived and obtained. Subsequently, all analytical results were validated through simulations. Notably, since the near-end device needs to account for the impact of the direct communication link, a Gamma distribution was used to approximate the square of the composite channel amplitude between the base station and the near-end device, and simulation results were provided. This method can also be applied to approximate the square of the channel amplitude between the base station and the far-end device. The simulation results indicate that the power allocation of the base station, the allocation of the transmission and reflection coefficients of STAR-RIS, the number of STAR-RIS elements, and the interference devices all significantly impact the communication performance of the receiving devices, and increasing the number of the STAR-RIS elements can effectively improve the overall performance of the system.
Although this study provides an in-depth analysis of the performance of a STAR-RIS-assisted NOMA wireless education network under multiple interference devices and offers valuable insights, certain limitations remain. Future research will further explore the performance of STAR-RISs in more complex environments, such as dynamically varying wireless channels, imperfect channel state information, and multi-user interference, particularly considering the effects of mobility and multi-antenna techniques. Additionally, the potential of optimization algorithms and deep-learning methods in enhancing system performance deserves further investigation. Moreover, the cooperative effects of multi-network integration based on STAR-RISs will be a significant direction for future research.
