Abstract
To enhance the maintenance efficiency and operational stability of rolling bearings, this work establishes a methodology for bearing life prediction, employing digital twin systems to evaluate the remaining useful life of rolling bearings. A comprehensive digital twin-integrated model for the entire lifecycle of rolling bearings is constructed using the Modelica language. This model generates sufficient and reliable lifecycle twin data for the bearings. Due to the symmetrical physical structure of the bearings, the generated twin data also have symmetry. Based on this characteristic of bearings, a remaining useful life (RUL) prediction algorithm is developed using a recurrent neural network (RNN), specifically an improved gated recurrent unit (GRU) model. An optimization algorithm is employed to adjust the hyperparameters and determine the initial fault point of the bearing. A multi-feature dataset is constructed, effectively enhancing the precision and reliability of lifespan estimation. Based on existing measured data of the bearing’s entire lifecycle, the rolling bearing’s digital twin-integrated model parameters are updated. Through the parameter degradation component of the twin, the lifecycle twin data of the rolling bearing are generated. By combining twin data with actual measurement data, this method addresses the limitations of traditional approaches in situations where complete lifecycle data of bearings are scarce, providing reliable technical support for the intelligent maintenance and optimization of rolling bearings.
1. Introduction
Rolling bearings, one of the critical components widely used in mechanical equipment, play a vital role in ensuring their safe, reliable, and efficient operation. The accurate assessment and prediction of rolling bearing conditions can prevent equipment failures, reduce downtime, and optimize maintenance strategies. The methods for predicting the remaining service life of rolling bearings generally fall into three main groups: physics-based approaches, data-driven approaches, and hybrid approaches.
1.1. Physics-Based Model Methods
Physics-based model methods typically rely on failure mechanism models or empirical models of critical components to describe their degradation behavior, thereby predicting the remaining useful life of these components. In 2008, Lung proposed an effective degradation model that integrates operational conditions, maintenance behaviors, and health monitoring [1]. In 2015, Fan B proposed a general prediction framework for particle filters based on degradation rate tracking. It moved away from the fitted model and predicted the degradation process of the system [2]. In 2017, Qian YN developed a multi-time scale method combining enhanced phase space warping and a revised Paris model for bearing defect monitoring and RUL estimation [3]. In 2018, Peng YF introduced a new method-based approach for rolling bearing RUL prediction [4]. Gao Xudong predicted the RUL of subsea pipelines in 2020 by calculating stress intensity factors, simulating the fatigue process using finite element software, and combining the results with the Paris–Erdogan model [5]. Qu Xiaogang conducted a simulation study on the RUL of bridge cranes in 2022 using the Paris–Erdogan model combined with the periodic sample cycling method [6]. However, some external conditions have not yet been effectively integrated into these models. Given the complexity of equipment functions, the variability in operating conditions, and the complexity or uncertainty of the degradation mechanisms of critical components, directly constructing physics-based models for the degradation process is challenging. As a result, the application of physics-based model methods for RUL prediction is somewhat limited.
1.2. Data-Driven Methods
Data-driven methods are models that utilize historical lifecycle data to map system states and predict the remaining useful life. In 2010, Chen constructed a time-series model for the occurrence of faults and used time-series analysis techniques to predict the timing of the following fault [7]. In 2012, Tobon employed a Gaussian mixture hidden Markov model to study the RUL of aircraft engine gears [8]. In 2020, Wu Q developed a cascade CNN-LSTM network for enhanced bearing RUL prediction, addressing single-sensor data instability issues [9]; to mitigate mechanical failures from abrupt bearing malfunctions, PAN ZZ developed a dual-phase predictive model [10]. In 2021, Zhao HM introduced a data-driven approach utilizing a Fitting Curve Derivative Method for Maximum Power Spectrum Density, enhancing the precision of the RUL prediction model [11]; in 2022, Sun Shiyan proposed an RUL prediction method based on time-series data augmentation and a Long Short-Term Memory (LSTM) network [12]. In 2023, Wang Fengfei introduced a system RUL prediction method that integrates prior degradation information and prior failure life data. This method employs a nonlinear Wiener process that considers individual differences to model system degradation [13].
Data-driven techniques require extracting key features from extensive historical data and using data analysis and processing to uncover hidden health indicators and performance degradation characteristics in equipment data. However, these models do not incorporate actual physical properties, which limits their adaptability to some extent.
1.3. Hybrid Model-Based Methods
To enhance the accuracy of remaining useful life prediction, some scholars have begun exploring methods that combine different models. These approaches include integrating physics-based models with data-driven models, as well as fusing multiple data-driven models. In 2021, Cao YD introduced an innovative deep learning model capable of extracting both time–frequency and temporal features from signal data [14]. In 2022, Zhuang JC introduced metric adversarial domain adaptation (MADA), a metric adversarial domain adaptation method for assessing bearing RUL across diverse operational conditions [15], while Eknath KG developed a time-efficient approach by integrating a Dynamic Convolutional Neural Network (DCNN) with a bidirectional GRU [16]. After 2023, some hybrid models began to be applied. In 2023, Guo JY introduced a CNN-BiLSTM (Bidirectional Long Short-Term Memory)–Bootstrap approach for RUL estimation, addressing prediction uncertainty in mechanical systems [17]. In 2024, Han Y developed a new neural network model to enhance the accuracy of RUL prediction for motor rolling bearings [18]. Cao HJ proposed a hybrid data- and model-driven rolling bearing modeling method, which provides a new idea for bearing life prediction based on hybrid models [19]. In 2025, Zhang YZ proposed a data-driven method to improve RUL prediction accuracy [20].
The aforementioned studies have made progress in the remaining useful life prediction methods of rolling bearings under limited and small sample sizes. However, the accuracy of RUL prediction still needs further improvement. Therefore, this paper proposes a method for predicting the remaining useful life of rolling bearings based on digital twin technology. It demonstrates that, in cases of insufficient or missing data, twin signals can not only serve as an effective alternative but also provide strong support for the RUL prediction of rolling bearings. This offers a new approach and solution for addressing the issue of insufficient bearing data in practical engineering applications while also laying a solid foundation for the application of digital twin technology in RUL prediction.
2. Construction of the Rolling Bearing Remaining Useful Life Prediction System
2.1. Establishment of the Rolling Bearing Digital Twin System
Constructing a digital twin for rolling bearings is a prerequisite for RUL prediction. The digital twin system has five key dimensions: the physical entity, digital twin model, twin data, data connectivity, and application layer. The RUL prediction is implemented as an application within the entire digital twin system. The preset RUL function is performed by receiving information from the digital twin system and utilizing deep neural network algorithms. The established digital twin system for rolling bearings is shown in Figure 1.
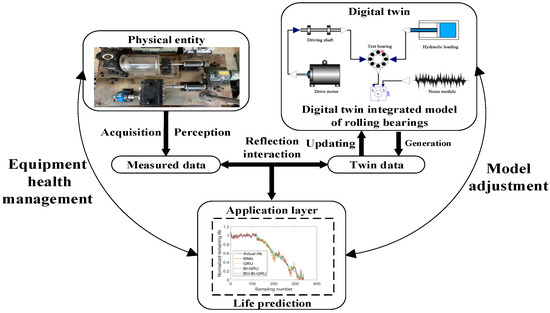
Figure 1.
Construction scheme of digital twin system for rolling bearings.
2.2. Integration of Digital Twin Model and Prediction Algorithm
During the operation of mechanical equipment, vibrations, noise, temperature variations, and internal mechanical system interactions are inevitably generated. The relevant, measurable parameters for rolling bearings and their associated components include bearing vibration signals, bearing temperature signals, shaft speed/motor speed, and drive motor current. Currently, fault diagnosis methods based on vibration signals have reached a high level of maturity, enabling the extraction of various bearing fault features. When compiled into a complete lifecycle dataset, the collected vibration signals can further be utilized for the RUL. An effective lifespan model can be established by analyzing the features and trends within the vibration signals. This enhances the reliability of equipment operation and improves overall production efficiency.
The full-lifecycle digital twin-integrated model for rolling bearings updates parameters through the degradation component of the twin model, generating comprehensive lifecycle twin data for rolling bearings. By integrating twin data with actual measured data, this approach overcomes the limitations of traditional methods, which often suffer from insufficient full-lifecycle data for bearings. This integration provides reliable technical support for intelligent maintenance and optimization, improving the practicality of prognostic outcomes. The fusion method is depicted in Figure 2.
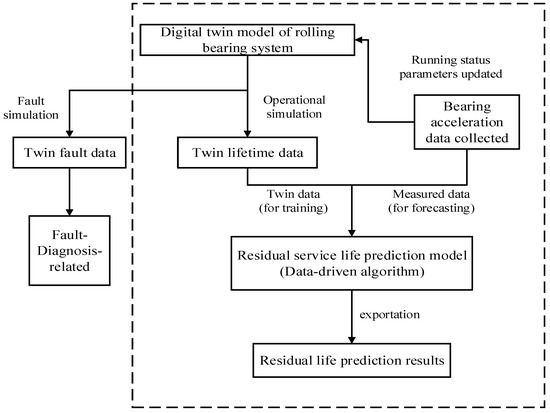
Figure 2.
Technical approach for twin model- and data-driven fusion.
3. Remaining Useful Life Prediction of Rolling Bearings
3.1. Modeling of the Rolling Bearing Digital Twin System
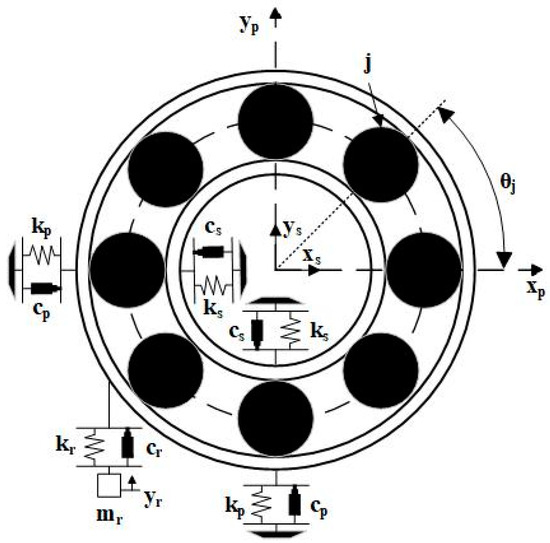
Figure 3.
Five-degree-of-freedom rolling bearing model.
The dynamic differential equations of the 5-DOF (degree-of-freedom) model are as follows:
In the equations, represent the masses of the inner ring, outer ring, and resonant transducer, respectively; represent the damping coefficients of the inner ring, outer ring, and resonant transducer; represent the stiffness values of the inner ring, outer ring, and resonant transducer; represents the displacement in each degree of freedom; and represent the contact forces in the x-axis and y-axis; and represents the external load.
In the equation, represents the deformation of the j-th rolling element, and represents the angular position of the j-th rolling element, which the following equation can determine.
Due to the difference in curvature radii between the inner and outer rings, the same defect spanning angle results in different defect widths. The angular width of defects on the inner and outer rings can be calculated using the following equations:
In the equations, represents the pitch circle diameters. and represent the inner and outer diameters.
When the deformation caused by the defect occurs only in the defective rolling element (the k-th rolling element), the defective rolling element’s deformation is expressed as a function of curvature.
The full-lifecycle digital twin-integrated model for rolling bearings consists not only of the bearing digital twin model but also includes a drive component, a loading component, and a random noise component. The drive component uses a DC motor-shaft system, while the loading component is modeled using a hydraulic system. The hybrid noise component in the full-lifecycle digital twin-integrated model of rolling bearings is modeled using a combination of Gaussian and band-limited white noise.
3.2. Digital Twin Parameter Update and Degradation Signal Generation
Based on digital twin technology, a full-lifecycle digital twin-integrated model for rolling bearings is developed using 6205 as an example. The computer hardware configuration is Intel® Core™ i7-13700H CPU, 16 GB memory, and NVIDIA GeForce RTX 4060 Laptop GPU with GDDR6 @ 8 GB (128 bits). The Modelica modeling approach establishes digital twin models, including a healthy state, inner ring defect, outer ring defect, and rolling element defect. Digital twin model sets for the motor-shaft, hydraulic, and random noise components have also been developed. The model generates signals for both healthy and outer ring fault conditions of rolling bearings [23]. The defect parameters are updated using a fitted degradation curve, enabling the generation of fault and full-lifecycle degradation data.
As shown in Figure 4, during the degradation process, the vibration amplitude of the generated full-lifecycle digital twin signal for the rolling bearing gradually increases. This trend aligns with the bearing degradation process’s physical characteristics, reflecting the increasing fluctuation in acceleration values as degradation progresses.
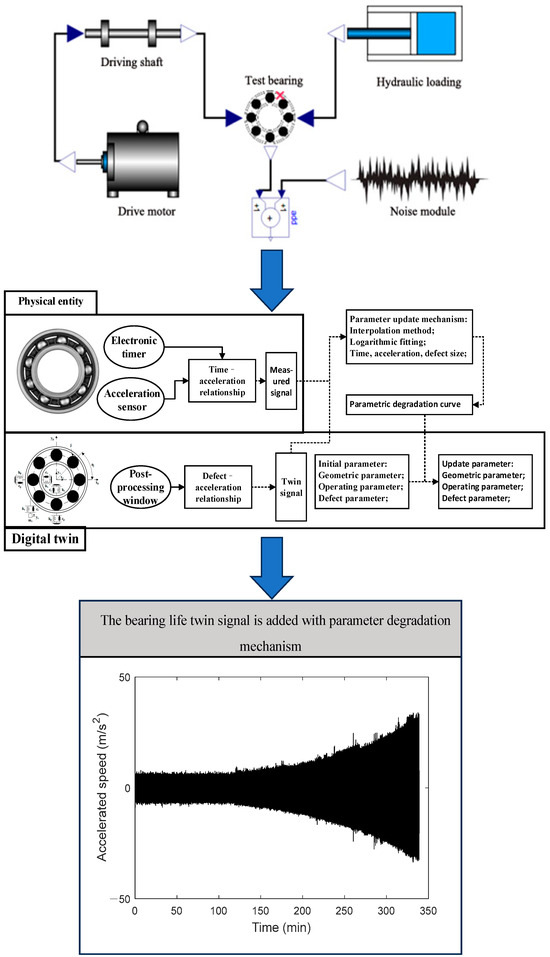
Figure 4.
Bearing life twin signal with parameter degradation mechanism.
The RUL is one of the key applications within the digital twin application layer. This study implements the RUL prediction of rolling bearings as an application within the digital twin system. A machine learning-based intelligent network algorithm is developed for RUL prediction. The XJTU-SY rolling bearing accelerated life test dataset from Xi’an Jiaotong University is selected for experimentation, and the chosen neural network algorithms are analyzed.
3.3. Establishment of the Rolling Bearing Remaining Useful Life Prediction Model
3.3.1. Determination of the First Fault Point
In the full-lifecycle operation of rolling bearings, accurately determining the number of degradation states, defining degradation boundaries, and identifying the first fault point are crucial for bearing degradation state recognition and interval lifespan estimation.
As the equipment operates over time, initial manufacturing defects or external random factors may cause the bearing to experience its first failure, marking the onset of the degradation process and the transition into the degradation phase. During this period, the severity of faults and degradation gradually intensifies. As degradation progresses, the bearing continuously adapts to the fault condition until the degradation severity sharply increases, leading to the failure phase; at this point, the bearing can no longer function properly and requires component replacement.
The criterion is used to determine the first fault point. Under normal operating conditions, the vibration signal data usually conform to the criterion. However, in a fault state, the vibration signal deviates from the normal distribution, producing anomalous data points that exceed the confidence interval. Therefore, the first occurrence of an outlier beyond the regular interval can be used to distinguish the healthy state from the fault state, serving as the starting point of rolling bearing degradation.
3.3.2. BO-BI-GRU Modeling Steps
Regarding network architecture, the BO-BI-GRU (Bayesian optimization–bidirectional gated recurrent unit) model includes four main components: input layer, bidirectional GRU layer, fully connected layer, and output layer. The input layer is responsible for receiving multi-dimensional time-series signal data. A feature extraction algorithm is applied to derive 16-dimensional feature vectors. The BI-GRU layer extracts and integrates sequential features using forward and backward GRU units. The fully connected layer further processes the extracted features. Finally, the output layer generates the remaining useful life prediction results [24,25].
The predictive model’s BI-GRU architecture incorporates a single input layer, three hidden layers, and one output layer. The ReLU activation function is used, and Adam is selected as the optimization algorithm. To optimize model parameters, Bayesian optimization is applied to determine the optimal number of neurons in each hidden layer, dropout rate after each hidden layer, batch size, learning rate of the Adam optimizer, and number of training iterations. The model’s performance is evaluated using a combination of the Root Mean Square Error (RMSE) and Mean Absolute Error (MAE) as evaluation metrics [26,27].
The algorithmic steps of the BO-BI-GRU network model for RUL prediction are illustrated in Figure 5.
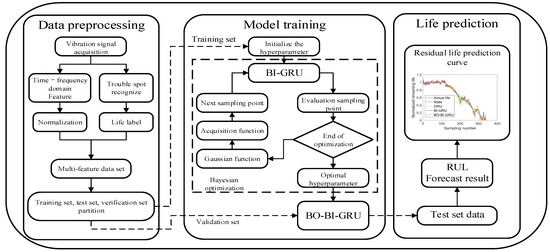
Figure 5.
Modeling procedure of BO-BI-GRU.
3.4. Ablation Study on Rolling Bearing Remaining Useful Life Prediction
Multiple models are used for comparative experiments to verify the effectiveness of the BO-BI-GRU model for RUL prediction, and an ablation study is conducted.
3.4.1. Dataset Selection
The specific structure of the bearing test rig is shown in Figure 6.
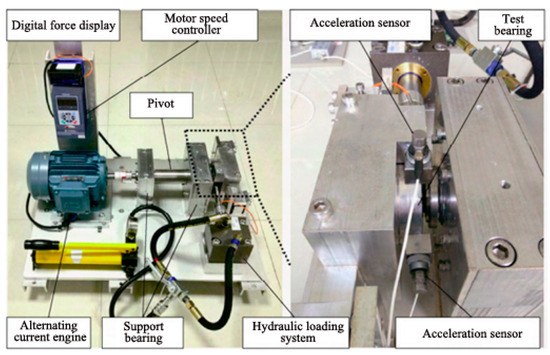
Figure 6.
Structure of XJTU-SY bearing test device.
The LDK UER-204 (LYC Bearing Corporation, Luoyang, Henan Province, China) bearing model was tested, with its parameters detailed in Table 1. Vibration signals throughout the bearing’s lifecycle were gathered using two PCB352C33 (PCB Piezotronics, Depew, NY, USA) single-axis accelerometers positioned horizontally and vertically on the bearing. A DT9837 (Data Translation, Marlborough, MA, USA) portable device recorded the signals, sampling every minute for 1.28 s at 25.6 kHz. The experiment included three operational scenarios, each testing five bearings. This section will use the full-lifecycle vibration signals from bearings under the second operating condition for remaining useful life prediction.

Table 1.
LDK UER-204 bearing parameters.
3.4.2. First Fault Point Identification
Taking the full-lifecycle data of bearing 2_5 under 37.5 Hz and 11 kN loading conditions from the XJTU-SY bearing dataset as an example, the first fault point identification process was conducted. The y-direction vibration acceleration signal is shown in Figure 7.
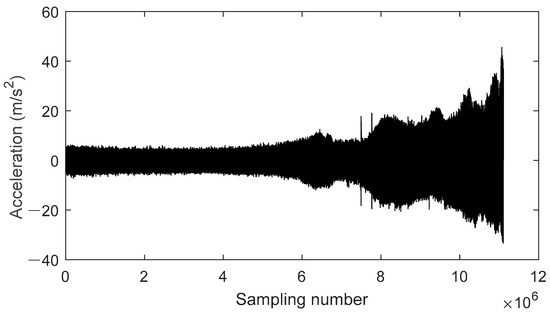
Figure 7.
Bearing life signal of bearing 2_5.
In total, 339 experimental datasets were collected from the normal operating state to complete failure, with the final failure mode identified as an outer ring fault.
By analyzing the root mean square (RMS) feature and kurtosis feature of the raw vibration signal of the bearing, the feature of bearing 2_5 is shown in Figure 8. It can be observed that there is an upward trend between file groups 110 and 130. Similarly, the kurtosis feature of bearing 2_5, shown in Figure 9, exhibits a significant deviation.
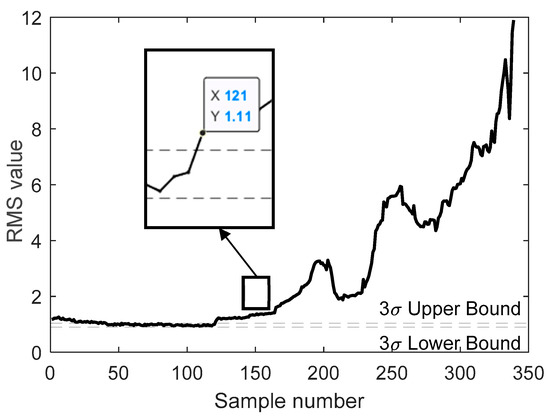
Figure 8.
Root mean square characteristics of bearing 2_5.
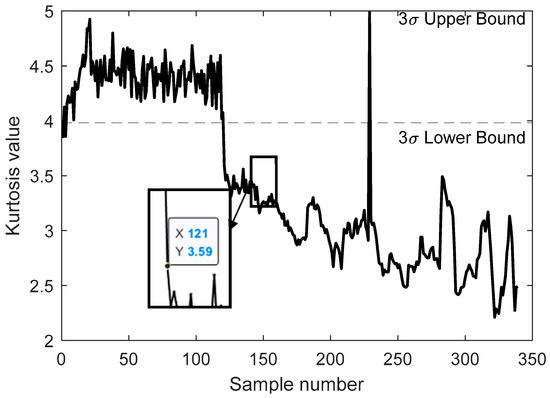
Figure 9.
Kurtosis characteristics of bearing 2_5.
From this analysis, it can be inferred that the first fault point of bearing 2_5 occurs approximately between file groups 110 and 130.
Figure 8 and Figure 9 show that the RMS and kurtosis features remain very stable between file groups 50 and 100, indicating that the bearing is healthy during this period. To prevent the influence of initial operating condition instability and other factors on the data, the first 49 groups of data are excluded from further analysis.
According to the criterion, the RMS feature values of the data from group 50 to group 100 have an average value of 0.9880 and a standard deviation of 0.0235. The RMS distribution range is (0.9175, 1.0585). The RMS values for near-degradation data groups (118, 119, and 120) were calculated as 0.9391, 0.9822, and 0.9941. These values conform to the criterion distribution, indicating that the rolling bearing remains stable and usually operates at this stage.
Similarly, for the kurtosis feature values from group 50 to group 100, the average value is 4.3984, and the standard deviation is 0.1374, resulting in a kurtosis distribution range of (3.9862, 4.8106). The kurtosis values for near-degradation data groups (118, 119, and 120) were calculated as 4.5960, 4.0191, and 4.0749, respectively, also conforming to the criterion distribution. This confirms that the rolling bearing operates stably and generally during this stage.
Upon further calculation, the RMS value of group 121 is 1.1104, and the kurtosis value is 3.5897. Both values exceed the upper limit compared to the previously established distribution range. Multiple values in the subsequent data groups exceed this upper threshold, indicating that the rolling bearing has experienced its initial failure. This failure disrupts its previously stable operation, leading to a deviation in the bearing data distribution from the standard normal distribution.
It can be preliminarily determined that group 121 marks the occurrence of the first fault. Figure 8 and Figure 9 confirm this conclusion, confirming group 121 as the fault initiation point. From this point onward, the rolling bearing enters its degradation phase, continuing until its final failure.
The remaining useful life data before group 121 (i.e., groups 1 to 120) are labeled with an RUL of 1, indicating that no degradation has occurred and the bearing’s remaining useful life is 100%. In group 121, the bearing officially enters degradation. At group 339, the bearing reaches complete failure, and its RUL drops to 0%. Thus, the RUL labels for data from group 120 to group 339 are set to decrease linearly from 1 to 0.
3.4.3. Data Processing and Feature Extraction
Sixteen time–frequency characteristics were derived from bearing lifetime signals through time- and frequency-domain analysis. The extracted features are listed in Table 2.

Table 2.
The 16 time–frequency-domain features extracted.
The extracted degradation features are structured into a time-series feature matrix with dimensions [16 × 339]. The labeled time-series data matrix, incorporating the RUL, serves as the bearing prognostic model’s input.
3.4.4. Analysis of Prediction Results
Comparative experiments are conducted with other methods to verify the proposed method’s effectiveness and applicability. The methods compared include the backpropagation (BP) neural network, the Support Vector Regression (SVR) method, the CNN-BI-GRU model, and the proposed method. Method (1): BP neural network: A classical BP neural network, one of the fundamental network models, is used. The network has three hidden layers with 128, 64, and 32 units. The learning rate is set to 0.001, and the Adam optimization algorithm is applied. Method (2): Support Vector Regression (SVR): the radial basis function (RBF) kernel is used to enhance the SVR model’s nonlinear fitting ability. Method (3): CNN-BI-GRU model: CNN is employed to extract deep features, while BI-GRU is used to learn temporal sequence characteristics to predict rolling bearing RUL. The network consists of one convolutional layer and two BI-GRU layers. Method (4): the proposed BO-BI-GRU model: BI-GRU is used to learn temporal sequence characteristics. The network consists of three hidden layers, with Bayesian optimization applied to select optimal hyperparameters for improved RUL prediction accuracy adaptively. The results of all methods are illustrated in Figure 10.
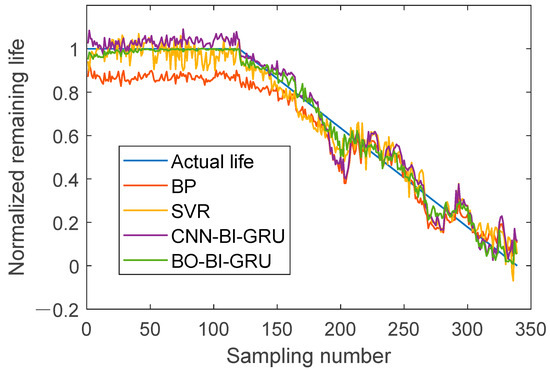
Figure 10.
Prediction results of different models.
All network parameters to be trained are initialized using the same distribution. Each method is tested on the same time-period test data and repeated 10 times to ensure consistency. Three metrics are used to evaluate each method’s performance: Root Mean Square Error (RMSE), Mean Absolute Error (MAE), and coefficient of Determination (R2). The comparison results of these performance metrics are presented in Table 3.

Table 3.
Evaluation indexes of prediction results of different models.
The RUL prediction results based on the BO-BI-GRU network exhibit a trend consistent with the experimental data. In the experiment’s early stages, the bearing’s unstable operation during the running-in process causes fluctuations in the initial data. However, these fluctuations quickly disappear, and the data return to a stable state, indicating healthy bearing operation with the RUL remaining around 100%. Around data group 121, the predicted RUL values decline, marking the official onset of bearing degradation. Between data groups 180 and 220, the prediction results exhibit significant fluctuations. During this phase, the rolling bearing transitions from mild to moderate degradation, causing a sharp decline in the RUL. However, as the operation continues, the bearing condition stabilizes, though degradation remains an ongoing process. The overall degradation level deepens over time, exhibiting some degree of fluctuation. At data group 330, the predicted RUL values fluctuate with increasing amplitude, signaling that the bearing is approaching failure. To further validate the effectiveness of the proposed BO-BI-GRU model, an ablation study is designed to compare performance with other methods. Table 4 presents the RMSE, MAE, and R2 values for the prediction results of different methods. The ablation results are shown in Figure 11.

Table 4.
Evaluation index of ablation results.
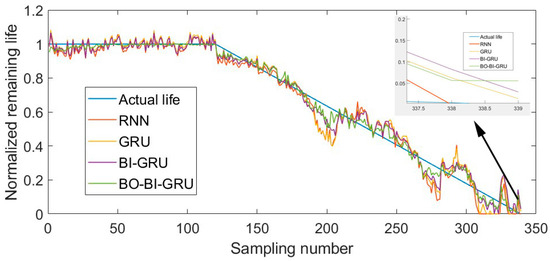
Figure 11.
Ablation results.
The experimental results show that the traditional RNN model exhibits the most significant prediction error, with an RMSE of 0.3953 and an MAE of 0.4285. RNNs often face gradient dissipation issues with extended sequential data, limiting their ability to model long-range temporal relationships.
In contrast, the GRU model, which incorporates a gating mechanism, improves prediction performance, reducing the RMSE to 0.3112. However, certain limitations remain. With the introduction of BI-GRU, the prediction performance improves further, demonstrating that bidirectional information flow plays a positive role in capturing sequential features.
Building upon this, the BO-BI-GRU model, which automatically tunes hyperparameters using Bayesian optimization, achieves the best prediction performance. The error is significantly reduced, and the model outperforms all other models regarding the RMSE, MAE, and R2 metrics. The BO-BI-GRU model demonstrates enhanced precision in forecasting the remaining useful life (RUL) of rolling bearings, demonstrating a clear advantage in handling complex sequential data.
4. Digital Twin Signals for Rolling Bearing RUL Prediction Experiments
4.1. Experimental Data and Experimental Setup
The experimental data used in this section are from the same dataset as that used in the full-lifecycle signal analysis, namely, the XJTU-SY bearing dataset. The measured signal data from bearings 1_3 and 3_1 are selected as the test signals for the experiment. The digital twin full-lifecycle signals corresponding to these two bearings are shown in Figure 12, where Figure 12a represents the bearing 1_3 signal, and Figure 12b represents the bearing 3_1 signal; since the overall runtime of bearing 3_1 is longer, and its degradation phase starts later, only the data after 2000 min are extracted for the experiment.
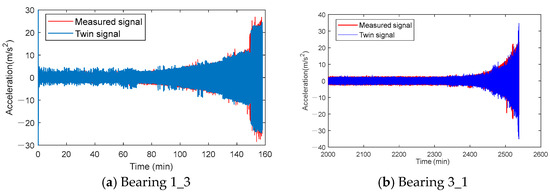
Figure 12.
Comparison between twin signals and measured signals.
This section uses two experimental scenarios to simulate real-world application scenarios.
First training scenario: The training set consists of digital twin data with lifespan labels and real measured data with lifespan labels. The validation set comprises unlabeled real-world measurements, enabling RUL prediction across the entire dataset. This approach assesses the efficacy of digital twin data in augmenting limited real-world data for RUL estimation.
Second training scenario: The training set consists only of digital twin data with lifespan labels, with no actual measured data included. The validation set consists of actual measured data without lifespan labels, and the model predicts the RUL of the entire actual measured dataset. The purpose of this scenario is to evaluate the effectiveness of using only digital twin data for model training when actual measured data are difficult to obtain. These two experimental setups simulate and address a common challenge in engineering applications, where full-lifecycle bearing data are often insufficient or missing.
Three different training data compositions are used to analyze performance further: 100% digital twin data, 50% actual measured data + 50% digital twin data, and 100% actual measured data. The trained models are then evaluated on the validation set to assess the RUL prediction performance.
4.2. Experimental Results and Analysis
The experimental results are illustrated in Figure 13 and Figure 14, comparing RUL prediction performance under different data combinations. Figure 13 shows the predicted RUL vs. actual lifespan curves for bearing 1_3 under three data compositions. Figure 14 presents the predicted RUL results over a longer time range for bearing 3_1 under different data combinations.
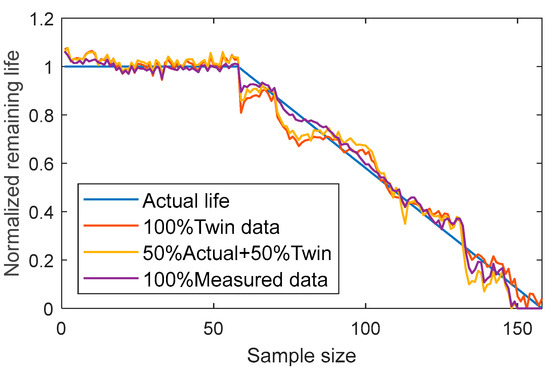
Figure 13.
Normal time life prediction results of bearing 1_3.
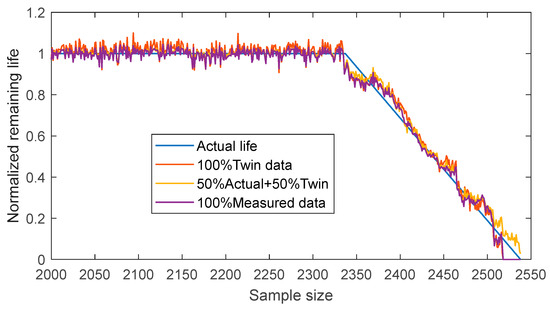
Figure 14.
Long time life prediction results of bearing 1_3.
The first data combination trains the model entirely using digital twin data. The results indicate that the model trained with 100% digital twin data can effectively capture the overall declining trend of the RUL. However, a noticeable discrepancy exists between the predicted and actual RUL trajectories.
The digital twin data successfully simulate the bearing degradation process, but due to limitations in modeling accuracy, they cannot fully reflect the real-life degradation characteristics. This discrepancy is particularly noticeable during the rapid decline phase of the RUL, where the model’s prediction exhibits a slight lag.
This phenomenon suggests that relying solely on digital twin data may limit the model’s ability to handle complex degradation processes, especially in scenarios where rapid RUL decay occurs.
The second data combination uses a 50% actual measured data + 50% digital twin data mix for training. The experimental results show that this data combination enhances the model’s prediction accuracy, with the predicted RUL curve aligning more closely with the actual lifespan curve. This indicates that digital twin data effectively supplement the degradation information missing from actual measured data, allowing the model to better capture full-lifecycle variations.
The incorporation of digital twin data not only reduces the dependence on large amounts of real measured data but mitigates the impact of data scarcity to some extent. This finding suggests that a well-balanced combination of real measured and digital twin data can optimize the trade-off between data acquisition cost and model prediction accuracy, providing a practical solution for handling data insufficiency in real-world applications.
To further validate the effectiveness of digital twin data, a model is trained using 100% real measured data. The results indicate that the model trained solely on real measured data produces the most accurate prediction curve, closely matching the actual lifespan curve. This demonstrates that real measured data carry more accurate degradation information, improving the model’s ability to predict complex degradation behaviors.
However, obtaining complete real measured data in real-world engineering applications is often time-consuming and costly. While a model trained entirely on real measured data achieves the best performance, it may lack general applicability due to practical constraints on data availability.
Table 5 presents the RMSE, MAE, and R2 values for different data combination methods, highlighting their respective prediction performances.

Table 5.
Prediction results of different models.
The experiment validated digital twin signals’ feasibility and application value in predicting rolling bearing remaining useful life. While the prediction performance of digital twin data alone is slightly inferior to that of real measured data, the combination of real measured data and digital twin data provides accurate predictions, making it suitable for practical engineering applications.
The results demonstrate that digital twin signals can serve as an alternative solution when real measured data are insufficient while introducing a new data source for RUL prediction. This approach effectively addresses data scarcity or missing lifecycle data issues in real-world applications.
5. Discussion
To address the issue of low accuracy in predicting the remaining useful life (RUL) of rolling bearings under small or limited sample conditions, a method for the RUL prediction of rolling bearings based on digital twin technology is proposed.
Using the Modelica method, a digital twin-integrated model for the full lifecycle of rolling bearings is established. The accuracy of the model is verified through fault characteristic frequencies, generating sufficient and reliable twin data for the bearing’s full lifecycle. Subsequently, an RUL prediction model is developed based on a recurrent neural network (RNN), achieving a model–data fusion-based RUL prediction approach.
For each component of the digital twin model, including the bearing, drive system, loading system, and noise module, theoretical models are established. The twin models of each component are then constructed based on Modelica, with interfaces established and debugged to integrate the components into a unified model, enabling information transfer. A full-lifecycle digital twin-integrated model of rolling bearings is built on a vibration signal monitoring platform, and the operation and updating of the twin model are analyzed to generate twin fault signals and degradation signals.
An improved RNN-based RUL prediction model is developed for the application layer of the digital twin, and its usability is validated using the XJTU-SY bearing dataset. The experimental results demonstrate that the proposed BO-BI-GRU network is effective in processing time-series features for prediction tasks, achieving high accuracy in RUL prediction for rolling bearings. This confirms the applicability of the model as part of the digital twin application layer.
The feasibility and application value of digital twin signals in RUL prediction for rolling bearings is verified through experiments. Although the prediction performance using twin data alone is slightly inferior to that of measured data, the combination of measured data and twin data provides relatively accurate predictions, meeting practical engineering requirements. The experimental results show that digital twin signals can not only serve as an alternative solution in cases of insufficient data but also provide a new data source for RUL prediction, effectively addressing the issue of insufficient or missing lifecycle data.
6. Conclusions
This study focuses on digital twin technology and rolling bearing RUL prediction, proposing a rolling bearing digital twin system combined with data-driven methods to predict bearing remaining useful life. The key conclusions are as follows:
- (1)
- Development of a digital twin-based RUL prediction system. The full-lifecycle digital twin-integrated model uses Modelica as the digital twin entity. Acceleration vibration signals of rolling bearings are selected as the data source for RUL prediction. A hybrid approach is proposed to integrate digital twin technology and data-driven RUL prediction methods.
- (2)
- Establishment of an improved recurrent neural network-based RUL prediction model. An enhanced gated recurrent unit (GRU) model is utilized, with Bayesian optimization applied to fine-tune network hyperparameters. The BO-BI-GRU network is developed as the application-layer prediction model. The model is validated using the XJTU-SY rolling bearing accelerated life dataset from Xi’an Jiaotong University, and both comparative and ablation experiments confirm its effectiveness. The results indicate that the proposed model effectively identifies degradation states in sequential features, enabling accurate RUL prediction for rolling bearings.
- (3)
- Verification of digital twin efficacy in RUL estimation. Comprehensive testing on Paderborn University and XJTU-SY bearing datasets demonstrates the system’s functionality and twin data applicability. The experimental results show that the twin signals exhibit high similarity to actual signals regarding time-domain waveforms and fault characteristic frequencies. A well-balanced combination of actual measured and digital twin data in RUL prediction can optimize data acquisition costs while maintaining model prediction accuracy.
This study confirms the practical feasibility of digital twin technology in RUL prediction, providing a viable solution for handling data scarcity in real-world applications.
Author Contributions
Conceptualization, J.F., L.Z. and M.L.; formal analysis, J.F.; funding acquisition, J.F.; investigation, J.F. and L.Z. All authors have read and agreed to the published version of the manuscript.
Funding
This work was supported by the National Natural Science Foundation of China (Grant No. 51674134), and the Fundamental Research Funds for the Universities of Liaoning Province (Grant Nos. LJKQZ20222448, LJ212410144076, LJ232410144074).
Data Availability Statement
The raw data supporting the conclusions of this article will be made available by the authors on request.
Acknowledgments
We have ensured that all individuals listed in this section have agreed to this acknowledgment; we thank the anonymous reviewers for their valuable comments and suggestions.
Conflicts of Interest
The authors declare no conflicts of interest.
References
- Lung, B.; Monnin, M.; Voisin, A. Degradation state model-based prognosis for proactively maintaining product performance. CIRP Ann.-Manuf. Technol. 2008, 57, 49–52. [Google Scholar] [CrossRef][Green Version]
- Fan, B.; Hu, L.; Hu, N.Q. Remaining useful life prediction of rolling bearings by the particle filter method based on degradation rate tracking. J. Vibroengineering 2015, 17, 743–756. [Google Scholar]
- Qian, Y.N.; Yan, R.Q.; Gao, R.X. A multi-time scale approach to remaining useful life prediction in rolling bearing. Mech. Syst. Signal Process. 2017, 83, 549–567. [Google Scholar] [CrossRef]
- Peng, Y.F.; Cheng, J.S.; Liu, Y.F. An adaptive data-driven method for accurate prediction of remaining useful life of rolling bearings. Front. Mech. Eng. 2018, 13, 301–310. [Google Scholar] [CrossRef]
- Gao, X.D.; Shao, Y.B.; Xie, L.Y. Prediction of fatigue crack propagation of X56 steel submarine pipelines in corrosive environment. Mater. Rep. 2020, 34, 2123–2130. [Google Scholar]
- Qu, X.G.; Zhang, X.K.; Jiao, S.Y. Numerical simulation research on residual life of bridge crane based on fracture mechanics. J. Saf. Environ. 2022, 22, 1284–1290. [Google Scholar] [CrossRef]
- Chen, M.Z.; Zhou, D.H.; Liu, G.P. A new particle predictor for fault prediction of nonlinear time-varying systems. Dev. Chem. Eng. Miner. Process. 2010, 13, 379–388. [Google Scholar] [CrossRef]
- Tobon-Mejia, D.A.; Medjaher, K.; Zerhouni, N. A data-driven failure prognostics method based on mixture of Gaussians hidden Markov models. IEEE Trans. Reliab. 2012, 61, 491–503. [Google Scholar] [CrossRef]
- Wu, Q.; Zhang, C.S. Cascade fusion convolutional long-short time memory network for remaining useful life prediction of rolling bearing. IEEE Access 2020, 8, 32957–32965. [Google Scholar] [CrossRef]
- Pan, Z.Z.; Meng, Z.; Chen, Z.J. A two-stage method based on extreme learning machine for predicting the remaining useful life of rolling-element bearings. Mech. Syst. Signal Process. 2020, 144, 106899. [Google Scholar] [CrossRef]
- Zhao, H.M.; Liu, H.D.; Jin, Y. Feature extraction for data-driven remaining useful life prediction of rolling bearings. IEEE Trans. Instrum. Meas. 2021, 70, 3511910. [Google Scholar] [CrossRef]
- Sun, S.Y.; Zhang, G.; Liang, W.G.; She, B.; Tian, F.Q. Remaining useful life prediction method of rolling bearing based on time series data augmentation and BLSTM. Syst. Eng. Electron. 2022, 44, 1060–1068. [Google Scholar] [CrossRef]
- Wang, F.F.; Tang, S.J.; Sun, X.Y.; Qi, S.; Yu, C.Q.; Si, X.S. Remaining useful life prediction based on multi-source information with considering random effects. J. Beijing Univ. Aeronaut. Astronaut. 2023, 49, 3075–3085. [Google Scholar] [CrossRef]
- Cao, Y.D.; Ding, Y.F.; Jia, M.P. A novel temporal convolutional network with residual self-attention mechanism for remaining useful life prediction of rolling bearings. Reliab. Eng. Syst. Saf. 2021, 215, 107813. [Google Scholar] [CrossRef]
- Zhuang, J.C.; Jia, M.P.; Zhao, X.L. An adversarial transfer network with supervised metric for remaining useful life prediction of rolling bearing under multiple working conditions. Reliab. Eng. Syst. Saf. 2022, 225, 108599. [Google Scholar] [CrossRef]
- Eknat, K.G.; Diwakar, G. Prediction of remaining useful life of rolling bearing using hybrid DCNN-BiGRU model. J. Vib. Eng. Technol. 2023, 11, 997–1010. [Google Scholar] [CrossRef]
- Guo, J.Y.; Wang, J.; Wang, Z.Y. A CNN-BiLSTM-Bootstrap integrated method for remaining useful life prediction of rolling bearings. Qual. Reliab. Eng. Int. 2023, 39, 1796–1813. [Google Scholar] [CrossRef]
- Han, Y.; Song, X.P.; Shi, J.M. KPCA-WPHM-SCNs-based remaining useful life prediction method for motor rolling bearings. Trans. Inst. Meas. Control 2024, 46, 973–991. [Google Scholar] [CrossRef]
- Cao, H.J.; Xiao, W.; Sun, J. A hybrid data- and model-driven learning framework for remaining useful life prognostics. Eng. Appl. Artif. Intell. 2024, 135, 108557. [Google Scholar] [CrossRef]
- Zhang, Y.Z.; Zhao, X.Q.; Xu, R.R. A dual-stream temporal convolutional network for remaining useful life prediction of rolling bearings. Meas. Sci. Technol. 2025, 36, 016206. [Google Scholar] [CrossRef]
- Qin, Y.; Liu, H.; Mao, Y. Faulty rolling bearing digital twin model and its application in fault diagnosis with imbalanced samples. Adv. Eng. Inform. 2024, 61, 102513. [Google Scholar] [CrossRef]
- Cui, L.; Xiao, Y.; Liu, D.; Han, H. Digital twin-driven graph domain adaptation neural network for remaining useful life prediction of rolling bearing. Reliab. Eng. Syst. Saf. 2024, 245, 109991. [Google Scholar] [CrossRef]
- Lei, Y.G.; Han, T.Y.; Wang, B. XJTU-SY rolling element bearing accelerated life test datasets: A tutorial. J. Mech. Eng. 2019, 55, 1–6. [Google Scholar] [CrossRef]
- Li, N.P.; Wang, M.Y.; Si, X.S. Remaining useful life prediction of lithium-ion battery with nonparametric degradation modeling and incomplete data. Reliab. Eng. Syst. Saf. 2025, 256, 110721. [Google Scholar] [CrossRef]
- Wang, Y.; Lei, Y.G.; Jiang, J.Z. A multimodal dynamic parameterized bilinear factorized framework for remaining useful life prediction under variational data. Reliab. Eng. Syst. Saf. 2024, 245, 110025. [Google Scholar] [CrossRef]
- Bharatheedasan, K.; Maity, T.; Durairaj, M. Enhanced fault diagnosis and remaining useful life prediction of rolling bearings using a hybrid multilayer perceptron and LSTM network model. Alex. Eng. J. 2025, 115, 355–369. [Google Scholar] [CrossRef]
- Zhang, Z.H.; Zhang, W.; Cai, J. Remaining life prediction of rolling bearings based on unsupervised anomaly detection and STA-BiLSTM. IEEE Sens. J. 2024, 24, 41659–41674. [Google Scholar] [CrossRef]
Disclaimer/Publisher’s Note: The statements, opinions and data contained in all publications are solely those of the individual author(s) and contributor(s) and not of MDPI and/or the editor(s). MDPI and/or the editor(s) disclaim responsibility for any injury to people or property resulting from any ideas, methods, instructions or products referred to in the content. |
© 2025 by the authors. Licensee MDPI, Basel, Switzerland. This article is an open access article distributed under the terms and conditions of the Creative Commons Attribution (CC BY) license (https://creativecommons.org/licenses/by/4.0/).