Abstract
Statistically significant multiple sequence alignment construction is an important task that has many biological applications. We applied the method for multiple alignments of highly divergent sequences (MAHDS) to construct multiple sequence alignments (MSAs) for 490 protein families with less than 20% identity between family members. The method uses random symmetric position–weight matrices (PWMs) and a genetic algorithm to construct a multiple alignment. PWM symmetry is essential because it makes PWMs comparable and recoverable at all steps of the MAHDS algorithm, which reduces the optimal MSA search task to a PWM optimization task. A Monte Carlo method is applied to assess the statistical significance of the resulting alignments. The statistical significance of the constructed MSAs was compared with that of MSAs obtained using T-Coffee and MUSCLE algorithms. The results showed that for 476 of the 490 families, the MAHDS method created much more statistically significant MSAs than T-Coffee and MUSCLE, whereas for 138 families, only MAHDS could construct statistically significant MSAs. These findings indicate that MAHDS calculate statistically significant alignments in cases when the other methods create purely random MSAs and are, therefore, the most appropriate method to construct MSAs for families of proteins with weak sequence similarities for amino acid annotation.
1. Introduction
Conserved amino acid motifs and protein domains may often have important biological functions; the identification of such evolutionarily preserved regions is important to predict the functional activity of proteins and determine their structural and phylogenetic relatedness [1,2]. Multiple sequence alignment (MSA) is a universal approach for the detection of conserved nucleotide and amino acid sequences; however, it remains one of the most challenging tasks in computational biology [3]. Nonetheless, existing mathematical methods for calculating MSAs have now been successfully used to predict protein structures in AlphaFold 2. Protein structure prediction using AlphaFold relies heavily on coevolution information extracted from MSAs [4,5].
Currently, several bioinformatics methods have been developed for calculating MSAs [6,7,8]. Among them, the most popular ones are those that use different variations of the progressive algorithm [9,10,11,12,13] which can reduce NP-completeness of MSA construction [14] through multidimensional dynamic programming. The progressive algorithm includes sequential pairwise sequence comparison, the calculation of a matrix of distances between the sequences, the construction of a matrix-based guide tree, and the merging of pairwise alignments of the most similar sequences into a common MSA [15,16]. However, insertions and deletions (indels) in paired alignments incorporated in the MSA significantly affect the final result, especially if the alignment is constructed for weakly similar sequences, which has led to the development of correction methods based on iterative procedures [17]. Nevertheless, even the corrected MSA could be far from optimal. To reduce the influence of the initial paired alignments included in the MSA and to improve its quality, various optimization algorithms have been introduced [18,19,20]. However, the problem has not been completely solved.
Another disadvantage of the previously developed methods is the difficulty of calculating multiple alignments for weakly similar sequences. The methods can construct it, but it may be statistically insignificant. This is especially relevant for sequences with an average pairwise similarity of less than 20%. Here, for convenience, an x value is introduced, which indicates the average number of substitutions per amino acid between the sequences for which we construct multiple alignments. It was shown for model sequences that all previously developed methods can create a multiple alignment if x ≤ 2.4 [21]. At the same time, the methods cannot construct a statistically significant alignment for the interval x between 2.4 and 4.8. This means that alignment of protein families with weakly similar sequences may be non-optimal or statistically insignificant.
Recently, a new method for multiple alignment of highly divergent sequences (MAHDS) has been developed. The method is based on a genetic algorithm and two-dimensional dynamic programming rather than pairwise equalization, thus allowing to avoid the problems in the MSA calculation mentioned above [21]. The objective of this paper is to demonstrate, on a set of protein families, that multiple alignments for protein families with low similarity should be calculated by means of MAHDS. When the MAHDS method was applied to construct alignments of 21 protein families comprising weakly similar members, in most cases, it could build more statistically significant MSAs than previously developed algorithms. However, to conclude that the MAHDS is more effective than the other methods for the alignment of weakly similar amino acid sequences, it should be tested in a larger number of protein families. Therefore, in this study we applied MAHDS to analyze 490 protein families with less than 20% sequence identity within the family and compared its performance with those of the Tree-based Consistency Objective Function for Alignment Evaluation (T-Coffee) [10] and MUltiple Sequence Comparison by Log-Expectation (MUSCLE) [22]. T-Coffee is a progressive multiple alignment algorithm that builds a library of pairwise alignments, which is then used to construct multiple alignments. MUSCLE is an iterative algorithm for constructing multiple alignments. It is improved over progressive methods because it uses more accurate distances to estimate the connectivity between two sequences. We compare MAHDS with T-Coffee and MUSCLE because they can find a statistically significant multiple alignment up to x ≤ 2.4, which is the best result among the known methods [21]. The results indicated that for 476 families, the MAHDS method constructed a much more statistically significant MSA than T-Coffee and MUSCLE, and that for 138 families, only MAHDS could build statistically significant MSAs. Thus, it can be concluded that to align families of weakly similar proteins (sequence identity < 20%) and avoid creation of random, insignificant MSAs, MAHDS should be the preferred method.
2. Materials and Methods
2.1. Overview of the MAHDS Algorithm
In this section, a summary of the MAHDS algorithm is given [21]; the detailed description of particular steps is provided below. MAHDS could eliminate strong influence of primary pairwise alignments as it calculates the MSA by optimizing MSA images (MSAr) constructed for random sequences (Qr sets). The purpose of this optimization is to create an MSAr image that best fitted the aligned sequences from set Q. Let us denote the length of each sequence in set Q as Li, where i varies from 1 to N and N is the number of sequences. To construct an MSAr for random sequences, a simple arrangement of sequences below each other can be used (Figure 1, step 1). The MSAr image is represented by a position–weight matrix (PWMr), in which the rows are the amino acids and the columns are the positions in multiple alignment; the number of columns is L. The fd function is used to calculate a PWM from an MSA (Figure 1, step 2), and the fb function is used to recreate the MSA from a PWM and sequences of set Qr or Q (Figure 1, step 4). Function fb is an algorithm based on two-dimensional dynamic programming, which makes it possible to switch from multidimensional dynamic programming to two-dimensional programming during MSA construction [21,23].
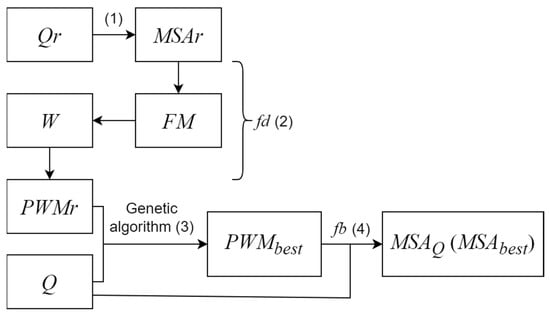
Figure 1.
General algorithm of creating multiple alignments of sequences from set Q using MAHDS. Steps 1–4 are described in detail in Section 2.2, Section 2.3, Section 2.4 and Section 2.5.
Then, we calculate the best PWM denoted as PWMbest, which, after application of function fb to sequences from set Q, should create the most statistically significant MSA (Figure 1, step 3). The statistical significance of the created MSA, denoted as Z, is estimated as described earlier [21,23,24,25] and has an approximately normal distribution (Section 2.6). To calculate PWMbest, PWMr is optimized for sequences from set Q using a genetic algorithm (Section 2.3), and set M is created, which contains a certain number of PWMr considered as organisms for which some mutations have been introduced. As an objective function in the genetic algorithm, we use the sum of the values from the similarity function FS (described in detail in Section 2.4). The task of the genetic algorithm is to maximize FS; PWMr with a maximal FS is considered as PWMbest.
Since the length L of the created MSA is not known beforehand, we perform the calculations shown in Figure 1 for the PWMr with the number of columns (L) from Lmin to Lmax, which are the minimum and maximum lengths, respectively, of sequences from set Q (or some given values close to the mean sequence length). As a result, we obtain PWMbest(L) matrices and choose PWMbest(Lbest) with the maximum Z value. From PWMbest(Lbest), we can easily create MSA of set Q sequences (Figure 1, step 4). The details of steps 1–4 shown in Figure 1 are provided below.
2.2. The Algorithm for Creating MSAr and PWMr
To obtain function fd for the construction of PWMr from MSAr, we first created a set of random sequences Qr, all of which had the same length L and average amino acid frequencies calculated from the Swiss-Prot database [26]. All amino acids were numbered in an arbitrary way from 1 to 20 and denoted as Num(i), where i is the number of an amino acid in the Num(i) array.
The number of sequences (Nr) in set Qr was 200; by arranging these sequences below each other, we obtained L columns each containing Nr amino acids. Let us denote the sequences as Sr(k, j), where Sr(k, j) shows the amino acid with number k in column j. Next, we created the frequency matrix FM containing 20 rows that corresponded to 20 amino acids numbered in an arbitrary manner and column numbers that corresponded to those of the MSAr columns; as a result, the matrix FM(i,j), where i varied from 1 to 20 and j varied from 1 to L, was created. We initialized the matrix with zero values and then filled it as follows: FM(Num(Sr(k,j)), j) = FM(Num(Sr(k,j)), j) + 1, where k varied from 1 to Nr and j from 1 to L. Next, the matrix W(i,j) was calculated as follows:
Here, = X(i)Y(j)/NrL, , , and D(FM(i,j)) = NrLP(1 − P), where P = X(i)Y(j)/(NrL)2.
However, the obtained matrix W could not be considered as a PWM because a PWM must be symmetrical. The symmetry is represented by two invariants: sum of squares of PWM elements () and mathematical expectation of PWM elements (). The requirement to keep these invariants for PWM comparability and recoverability was introduced in [24]. The special normalization presented below is performed after any operation that transforms or creates a PWM in the MAHDS algorithm.
In order to use W(i,j) as PWMr and compare FS values for different PWMr (Section 2.4), the matrix W(i,j) was modified as follows. First, we calculated and , where p(i,j) = p1(i)p2(j), p1(i) is the probability of finding the amino acid i in set Qr and p2(j) = 1/L. Then, we transformed the matrix W(i,j) so that R = R0 and Kd = K0. In a previous study, it has been shown that K0 = −1 and R0 = 100L are optimal for the alignment of very diverged amino acid sequences [21]. The PWM conversion method is presented in [24]. After this transformation, the matrix W(i,j) was used as PWMr.
2.3. PWMr Optimization Using Set Q
In order to create PWMbest from PWMr, we applied a genetic algorithm in which PWMr matrices were treated as organisms. For this, we generated 400 sets of Qr and created 400 corresponding PWMrs denoted as set M. The general similarity function FS (Section 2.4) was used as the target function whose value depended on the aligned sequences and PWM. We ranked the matrices from set M in a descending order of their FS and created a List.
The PWM with the highest FS value (FSmax) was remembered, and 5% of the matrices at the bottom of the List were replaced with “descendants” constructed from the top 95% matrices of the List. To do this, two random matrices were selected among the top 95% so that the probability of choosing a particular matrix was directly proportional to its FS value. In these two matrices, row i and column j were randomly chosen, and each matrix was divided into 4 rectangles. Then, a randomly selected rectangle in one matrix was exchanged with that of the other matrix, and one of the resulting matrices was randomly chosen to replace one of the bottom 5% of matrices excluded from the List. In addition, random mutations were introduced into 10% of the randomly chosen matrices (except for the created “descendants”) by replacing one random element in the matrix with a random value uniformly distributed over the interval [−10, 10]. All 5% of the matrices at the bottom of the List and the matrices with the introduced mutations were transformed as described in Section 2.2 so that they had set values of R2 and Kd.
Then, we recalculated FS for all the changed matrices and redefined the List. The procedure was repeated while FSmax was increasing and stopped if during the last 50 iterations there was no FSmax increase. As a result of this algorithm, we obtained the PWM with FSmax and considered it as PWMbest. The genetic algorithm is described in more detail in [23].
Empirically, it was found that the number of genetic algorithm iterations required to maximize FSmax is almost always in the range from 150 to 200. The Qr cardinality is a parameter, so it can also be considered as a constant value and, therefore, the sorting complexity in this context is reduced to . Thus, the computational complexity of the genetic algorithm is asymptotically equal to the computational complexity of the FS calculation, which requires an alignment of each sequence in Q (Section 2.4 and Section 2.5). This leads to linear dependence on the number of sequences and quadratic dependence on the average sequence length. Despite the fact that this estimate is rather rough, it perfectly matches the results of the MAHDS performance test shown in [21].
2.4. Calculation of F(Li, L) for Sequence S of Set Q with Length Li and PWM with Length L
The similarity function F was calculated using the Needleman–Wunsch algorithm [27]. Let us take sequence Sk of set Q with length Lk and PWM with length L; then, we obtained F(Lk, L) for Sk and PWM by sequentially calculating F(i,j) (i = 1, …, Lk, j = 1, …, L) according to the following formula:
where d and e are gap opening and gap extension penalties, respectively, and Sk(i) is the element of sequence Sk at position i.
We have previously shown that d = 40 and e = 1 should be used to align very diverged amino acid sequences [21]. The zero row and zero column were F(0,j) = −dj and F(i,0) = −di, respectively, where i varied from 0 to Lk and j varied from 0 to L. F(Lk, L) was calculated based on the iterative procedure in Equation (2).
As a similarity measure of set Q sequences aligned using a given PWM, we applied FS = , which could be considered as a function with arguments Q and PWM.
2.5. Calculation of MSAQ
To construct multiple alignments of sequences from set Q based on PWMbest (Section 2.3), we simultaneously filled in the matrix F(i,j) (i = 1, …, Li, j = 1, …, L) and the matrix of inverse transitions Fb(i,j) (i = 1, …, Li, j = 1, …, L); in each cell (k, j) of the latter, we wrote down the number of the cell from which we came according to Formula (2). The matrix Fb allows the calculation of two-dimensional global alignment between PWMbest and sequence Si (i = 1, …, N) from set Q [23]. As a result, in global alignment we had two sequences: the first was that of columns from PWMbest and the second was the sequence Si. Let us denote the sequence of columns as S0 and the global alignment as Ai; its elements s0(l) were equal to l = 1, …, L. In addition to numbers and amino acids in a single-letter format, alignment Ai also contained ‘-’ characters indicating the deletion of an amino acid in sequence Si or of a PWM column number in S0. To create an MSA, we wrote the sequence Si as it was performed in alignment Ai. However, we skipped amino acids opposite to the symbol ‘-’ in Ai, so the length of the recorded sequence was equal to L; such sequences were denoted as Smi. The procedure was repeated for all N sequences from set Q.
Next, in alignments Ai we determined the maximum insertion length in sequences Si, which could be found after number s0(l) for all l from 1 to L, and made insertions in sequence Smi, which were equal to the found maximum length and were marked as ‘-’. If we made a deletion earlier after s0(l), the deleted bases were returned. As a result, we obtained MSAQ of sequences Si from set Q aligned relative to set PWMbest.
2.6. Assessment of the Statistical Significance of MSAs
The criterion of statistical significance of MSAQ could be Z, which shows the deviation of FSmax (Section 2.3) from the average value divided by standard deviation σmax for normalization [28]. Z was estimated using the Monte Carlo method, for which 300 sets of random sequences R were generated by randomly mixing amino acids within the sequences of set Q. For each set R, FSmax was calculated (Section 2.2) using PWMbest and applied to estimate and σmax, and then . Next, we introduced a threshold value Z0 determined as in [21]. Briefly, Z was calculated for MSA of sets of random sequences, and the mathematical expectation and were estimated; then, Z0 was determined by the three-sigma rule as Z0 = + 3. For highly diverged amino acid sequences, Z0 = 11, and MSAQ was considered statistically significant if Z > Z0.
In addition, our approach could be used to assess the statistical significance of arbitrary MSA regardless of the method used for the alignment. To make it possible, we removed the MSA columns for which the number of amino acids was less than half of that of the sequences included in MSA and calculated PWM as described in Section 2.2 for PWMr from MSAr. The resulting symmetric PWM was considered as PWMbest, for which Z. was calculated as described above in this section.
2.7. Software Used
MSA can be constructed using the MAHDS algorithm, and the statistical significance of the arbitrary MSA can be evaluated on the website http://victoria.biengi.ac.ru/mahds (accessed on 4 February 2024).
We have upgraded the software described in [21] as follows. (1) If the denominator in Formula (1) is equal to zero, the corresponding elements of matrix W are assigned the same smallest value equal to 2Emin if Emin < 0 (or −E in other cases); Emin is the minimum value among the other elements of W. This is a way to ensure that zero values in FM lead to the lowest values in W and PWM after all conversions described in Section 2.1. Therefore, position and character pairs which had no occurrences in Qr are the least likely to match in alignments obtained using PWMr. (2) The genetic algorithm described in Section 2.3 requires 400 PWMrs, but during initialization we created such matrices sequentially 100,000 times and replaced one of the first 400 matrices with a new one, if such a replacement increased the minimum Euclidean distance between the matrices of the set. This approach allows for the execution of the genetic algorithm with a more variable PWMr, thus increasing the probability of finding a more optimal PWMbest. (3) The created PWMr sets are stored in a database, which makes it possible to avoid re-generation of sets with the same dimensions. Such permanent caching saves time when creating similar PWMr sets, which compensates for the increased complexity of the PWMr selection approach described in (2).
3. Results
In this study, we selected a large number of protein families with a low average percentage of sequence identity in the full alignment and constructed MSAs using the MAHDS, T-Coffee, and MUSCLE methods, which have shown the best results in previous tests [21]. The data were extracted from the Pfam database and are available on the InterPro website at https://www.ebi.ac.uk/interpro/entry/pfam (accessed on 16 January 2024).
The criteria for selecting sequences were the average sequence identity in the full alignment ≤ 20% according to Pfam estimation, the number of sequences in MSA < 500, and the file size of the sequences less than 1 Mb. The last two limitations are purely technical and related to EMBL-EBI services (https://www.ebi.ac.uk/jdispatcher/msa, accessed on 1 February 2024) which provide the T-Coffee and MUSCLE methods. Duplicate sequences found in some of the selected families were removed. The final set of sequences selected for the MSA consisted of all Pfam families meeting the criteria, the number of which was equal to 490; the list is presented in the fams.zip file.
For each of the 490 families, we constructed alignments using MAHDS, T-Coffee, and MUSCLE and compared their statistical significance Z calculated as described in the Methods (Section 2.6). The MSAs obtained by each algorithm are presented in files mahds.zip, muscle.zip, and tcoffee.zip. The results shown in Table 1 indicate that MSAs constructed by the MAHDS method were in general considerably superior to those created by the other two methods in terms of statistical significance. Of the 490 MSAs obtained using MAHDS, 476 were most significant (Z > Z0 = 11.0, Section 2.6); among them, 138 MSAs could be created only by MAHDS.

Table 1.
Statistical comparison of MSAs performed using MAHDS, MUSCLE, and T-Coffee.
Histograms of the Z value distributions for the 490 MSAs show that the MSAs obtained by MAHDS were biased towards higher Z values compared with those created by MUSCLE and T-Coffee methods (Figure 2).
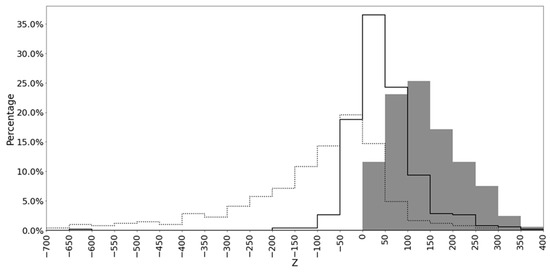
Figure 2.
Distribution of Z values for MSAs produced by MAHDS (shaded area), MUSCLE (solid line), and T-Coffee (dotted line).
Let us consider as an example the logo graph [29,30] for the PF16302 family, which was made based on sequences Smi arranged one below the other (Section 2.5). Such a reduced MSA without insertions contained 152 columns, whereas the full MSA of this family contained 216 columns. PF16302 was chosen because only MAHDS could build a statistically significant MSA for this family: Z = 16.26 compared with Z = 8.35 by MUSCLE and Z = 1.59 by T-Coffee. Furthermore, the average length of sequences included in PF16302 was short, which is convenient for visual analysis.
Figure 3 shows that most columns contained several dominant amino acids, indicating the creation of a statistically significant alignment despite weak similarity of amino acid sequences included in the family. The MSA for this protein family built with the MAHDS algorithm is shown in the PF16302_mahds.zip file.
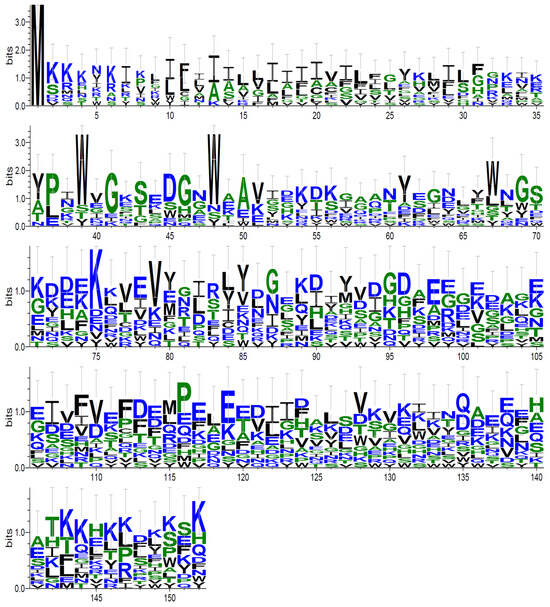
Figure 3.
A logo graph for the PF16302 family. The graph was made for Smi sequences arranged one below the other (Section 2.5) using the Logo program [29] (the first two rows have larger Y-axis scale).
Also, the reproducibility of the MSAs obtained by means of the MAHDS method was experimentally estimated. An arbitrary statistically significant MSA was selected and the corresponding protein family (PF14430) was aligned 100 times without PWMr caching. All the method`s parameters, including Lbest, were similar to those that were used previously during alignment of the 490 protein families. The similarity function FSmax value which best characterizes MSA in case of fixed parameters turned out to be very stable: E[FSmax] = 87.90, σ = 0.23.
The performance of the updated software has been tested using the parameters that could affect the speed of MSA construction: the number of R sets equal to 100 (Section 2.6) and ∆ = Lmax − Lmin = 11 (Section 2.1). The results indicate that the software calculated the alignment of 100 random amino acid sequences with 600 characters in 1 min 26 s, whereas 40 sequences with 900 characters, 40 sequences with 300 characters, and 20 sequences with 600 characters were aligned in 3 min 17 s. In a previous study, we have shown that the time required for MAHDS to build an alignment is in linear dependence on the number of sequences and in quadratic dependence on the sequence length [21], explaining why, despite the same average length and number of sequences, the second set took longer to align.
4. Discussion
The MAHDS method differs significantly from all previously existing algorithms for MSA construction, because it does not build multiple alignments of sequences from set Q but optimizes random alignments. In the process, random alignments are transformed into MSA images in the form of PWMs, which are then improved using two-dimensional dynamic programming and a genetic algorithm to better match the studied sequences. After finding the optimal PWM (PWMbest, Section 2.3), one can move from the MSA image to the actual MSA and build multiple alignments (Section 2.5). However, this method of MSA construction has a drawback, because the calculated PWMbest may not be the most statistically significant, i.e., we may not find the PWM with the largest Z (Section 2.6) for sequences from set Q (Section 2.1). However, our results show that even in a relatively short time, MAHDS can calculate much more statistically significant MSAs (with greater Z value) than the other algorithms. Another advantage of the MAHDS method in comparison with progressive alignment is the possibility of avoiding the considerable influence of primary indels in the final MSA and, thus, skipping additional corrective steps.
The procedure of PWM optimization (Section 2.3) can be conceptually considered as symmetric to the procedure of statistical significance assessment described in (Section 2.6). In the first case, “perfect sequence set” (Q) is aligned with random PWMs to find PWMbest, which fits the sequences and corresponds to MSAbest with the highest similarity score FS. In the second case, randomly shuffled sequence sets are being aligned with “perfect PWM” (PWMbest). We suppose that an optimization procedure such as genetic algorithm with the same objective function FS can be applied to recover correct order of characters in shuffled sequences of the set Q if PWMbest is known.
In an earlier study, we have tested the MAHDS method on three types of amino acid sequences: those from the reference dataset BAliBASE [31,32], artificial sequences with a given number of indels and substitutions, and real protein families from the Pfam and HOMSTRAD databases (19 and 2 items, respectively) [21]. Our findings have revealed that MAHDS can build statistically significant alignments of protein families, for which the other known methods (MUSCLE, T-Coffee, etc.) could not deliver statistically significant results. Here, we compared the performance of MAHDS with that of MUSCLE and T-Coffee in calculating MSAs for a much larger number (490) of protein families comprising sequences with the average similarity less than 20%. The results show that for almost all studied protein families (476 out of 490), MAHDS could construct much more statistically significant MSAs than MUSCLE and T-Coffee (6 and 0, respectively). Moreover, only MAHDS could calculate significant alignments for 138 families, whereas MUSCLE and T-Coffee could do so for 2 and 0 families, respectively.
Thus, our results indicate that the MAHDS algorithm should be the method of choice to build MSA for families of proteins with very weak similarity (<20%). In the future, it is possible to improve MAHDS method by taking into account correlations between neighboring amino acids, as we previously did for nucleotide sequences [23]. However, in this case, the number of lines in the PWM will be 400, which may cause some difficulties in optimization.
5. Conclusions
In this paper, we applied the MAHDS method to construct multiple alignments for 490 protein families. These families were selected from the Pfam database (available on the InterPro) so that the average similarity between family members was less than 20%. Previously [21], it was shown on model sequences that all previously developed methods can calculate a statistically significant multiple alignment if the average number of substitutions per amino acid between sequences (x) is less than or equal to 2.4. At the same time, the MAHDS method was able to calculate such an alignment for up to x < 4.8. This means that for protein families where the average similarity between sequences is less than 20%, the existing methods may not correctly calculate multiple alignment. As a result, we were able to show that for 476 out of 490 protein families MAHDS calculated more statistically significant MSAs than MUSCLE and T-Coffee. Moreover, only MAHDS could calculate significant alignments for 138 families, whereas MUSCLE and T-Coffee could do so for 2 and 0 families, respectively. Our study shows that for highly diverged protein families MSA is better calculated using MAHDS.
Supplementary Materials
The following supporting information can be downloaded at https://www.mdpi.com/article/10.3390/sym17030408/s1. The archive containing all the data referenced in the manuscript is supplementary_info.zip.
Author Contributions
Conceptualization, E.K.; methodology, D.K., M.K. and E.K.; software, D.K.; validation, D.K., M.K. and E.K.; formal analysis, D.K., M.K. and E.K.; investigation, D.K.; resources, D.K. and M.K.; data curation, D.K., M.K. and E.K.; writing—original draft preparation, D.K.; writing—review and editing, E.K.; visualization, D.K.; supervision, E.K.; project administration, E.K. All authors have read and agreed to the published version of the manuscript.
Funding
This research received no external funding.
Data Availability Statement
Data is contained within the article or Supplementary Material.
Conflicts of Interest
The authors declare no conflicts of interest.
Abbreviations
The following abbreviations are used in this manuscript:
| MSA | Multiple sequence alignment |
| PWM | Position–weight matrix |
References
- Thompson, J.D.; Linard, B.; Lecompte, O.; Poch, O. A Comprehensive Benchmark Study of Multiple Sequence Alignment Methods: Current Challenges and Future Perspectives. PLoS ONE 2011, 6, e18093. [Google Scholar] [CrossRef] [PubMed]
- Kemena, C.; Notredame, C. Upcoming Challenges for Multiple Sequence Alignment Methods in the High-Throughput Era. Bioinformatics 2009, 25, 2455–2465. [Google Scholar] [CrossRef] [PubMed]
- Chatzou, M.; Magis, C.; Chang, J.-M.; Kemena, C.; Bussotti, G.; Erb, I.; Notredame, C. Multiple Sequence Alignment Modeling: Methods and Applications. Brief. Bioinform. 2016, 17, 1009–1023. [Google Scholar] [CrossRef] [PubMed]
- Jumper, J.; Evans, R.; Pritzel, A.; Green, T.; Figurnov, M.; Ronneberger, O.; Tunyasuvunakool, K.; Bates, R.; Žídek, A.; Potapenko, A.; et al. Highly Accurate Protein Structure Prediction with AlphaFold. Nature 2021, 596, 583–589. [Google Scholar] [CrossRef]
- Abramson, J.; Adler, J.; Dunger, J.; Evans, R.; Green, T.; Pritzel, A.; Ronneberger, O.; Willmore, L.; Ballard, A.J.; Bambrick, J.; et al. Accurate Structure Prediction of Biomolecular Interactions with AlphaFold 3. Nature 2024, 630, 493–500. [Google Scholar] [CrossRef]
- Chowdhury, B.; Garai, G. A Review on Multiple Sequence Alignment from the Perspective of Genetic Algorithm. Genomics 2017, 109, 419–431. [Google Scholar] [CrossRef]
- Paruchuri, T.; Kancharla, G.R.; Dara, S.; Yadav, R.K.; Jadav, S.S.; Dhamercherla, S.; Vidyarthi, A. Nature Inspired Algorithms for Solving Multiple Sequence Alignment Problem: A Review. Arch. Computat Methods Eng. 2022, 29, 5237–5258. [Google Scholar] [CrossRef]
- Ibrahim, M.; Yusof, U.; Eisa, T.; Nasser, M. Bioinspired Algorithms for Multiple Sequence Alignment: A Systematic Review and Roadmap. Appl. Sci. 2024, 14, 2433. [Google Scholar] [CrossRef]
- Edgar, R.C. MUSCLE: Multiple Sequence Alignment with High Accuracy and High Throughput. Nucleic Acids Res. 2004, 32, 1792–1797. [Google Scholar] [CrossRef]
- Notredame, C.; Higgins, D.G.; Heringa, J. T-Coffee: A Novel Method for Fast and Accurate Multiple Sequence Alignment. J. Mol. Biol. 2000, 302, 205–217. [Google Scholar] [CrossRef]
- Higgins, D.G.; Sharp, P.M. CLUSTAL: A Package for Performing Multiple Sequence Alignment on a Microcomputer. Gene 1988, 73, 237–244. [Google Scholar] [CrossRef] [PubMed]
- Lassmann, T.; Sonnhammer, E.L. Kalign—An Accurate and Fast Multiple Sequence Alignment Algorithm. BMC Bioinform. 2005, 6, 298. [Google Scholar] [CrossRef]
- Katoh, K.; Misawa, K.; Kuma, K.; Miyata, T. MAFFT: A Novel Method for Rapid Multiple Sequence Alignment Based on Fast Fourier Transform. Nucleic Acids Res. 2002, 30, 3059–3066. [Google Scholar] [CrossRef]
- Wang, L.; Jiang, T. On the Complexity of Multiple Sequence Alignment. J. Comput. Biol. 1994, 1, 337–348. [Google Scholar] [CrossRef]
- Feng, D.-F.; Doolittle, R.F. Progressive Sequence Alignment as a Prerequisitetto Correct Phylogenetic Trees. J. Mol. Evol. 1987, 25, 351–360. [Google Scholar] [CrossRef] [PubMed]
- Hogeweg, P.; Hesper, B. The Alignment of Sets of Sequences and the Construction of Phyletic Trees: An Integrated Method. J. Mol. Evol. 1984, 20, 175–186. [Google Scholar] [CrossRef]
- Hirosawa, M.; Totoki, Y.; Hoshida, M.; Ishikawa, M. Comprehensive Study on Iterative Algorithms of Multiple Sequence Alignment. Comput. Appl. Biosci. 1995, 11, 13–18. [Google Scholar] [CrossRef] [PubMed]
- Notredame, C.; O’Brien, E.A.; Higgins, D.G. RAGA: RNA Sequence Alignment by Genetic Algorithm. Nucleic Acids Res. 1997, 25, 4570–4580. [Google Scholar] [CrossRef]
- Kim, J.; Pramanik, S.; Chung, M.J. Multiple Sequence Alignment Using Simulated Annealing. Comput. Appl. Biosci. 1994, 10, 419–426. [Google Scholar] [CrossRef]
- Althaus, E.; Caprara, A.; Lenhof, H.-P.; Knut, R. A Branch-and-Cut Algorithm for Multiple Sequence Alignment. Math. Program. 2006, 105, 387–425. [Google Scholar] [CrossRef]
- Korotkov, E.V.; Kostenko, D.O. Application of the MAHDS Method for Multiple Alignment of Highly Diverged Amino Acid Sequences. Int. J. Mol. Sci. 2022, 23, 3764. [Google Scholar] [CrossRef]
- Edgar, R.C. MUSCLE: A Multiple Sequence Alignment Method with Reduced Time and Space Complexity. BMC Bioinform. 2004, 5, 113. [Google Scholar] [CrossRef] [PubMed]
- Korotkov, E.V.; Suvorova, Y.M.; Kostenko, D.O.; Korotkova, M.A. Multiple Alignment of Promoter Sequences from the Arabidopsis Thaliana L. Genome. Genes 2021, 12, 135. [Google Scholar] [CrossRef] [PubMed]
- Pugacheva, V.; Korotkov, A.; Korotkov, E. Search of Latent Periodicity in Amino Acid Sequences by Means of Genetic Algorithm and Dynamic Programming. Stat. Appl. Genet. Mol. Biol. 2016, 15, 381–400. [Google Scholar] [CrossRef]
- Korotkov, E.; Suvorova, Y.; Kostenko, D.; Korotkova, M. Search for Dispersed Repeats in Bacterial Genomes Using an Iterative Procedure. Int. J. Mol. Sci. 2023, 24, 10964. [Google Scholar] [CrossRef] [PubMed]
- Boutet, E.; Lieberherr, D.; Tognolli, M.; Schneider, M.; Bairoch, A. UniProtKB/Swiss-Prot. Methods Mol. Biol. 2007, 406, 89–112. [Google Scholar] [CrossRef]
- Needleman, S.B.; Wunsch, C.D. A General Method Applicable to the Search for Similarities in the Amino Acid Sequence of Two Proteins. J. Mol. Biol. 1970, 48, 443–453. [Google Scholar] [CrossRef]
- Comet, J.P.; Aude, J.C.; Glémet, E.; Risler, J.L.; Hénaut, A.; Slonimski, P.P.; Codani, J.J. Significance of Z-Value Statistics of Smith-Waterman Scores for Protein Alignments. Comput. Chem. 1999, 23, 317–331. [Google Scholar] [CrossRef]
- Crooks, G.E.; Hon, G.; Chandonia, J.-M.; Brenner, S.E. WebLogo: A Sequence Logo Generator. Genome Res. 2004, 14, 1188–1190. [Google Scholar] [CrossRef]
- Schneider, T.D.; Stephens, R.M. Sequence Logos: A New Way to Display Consensus Sequences. Nucleic Acids Res. 1990, 18, 6097–6100. [Google Scholar] [CrossRef]
- Thompson, J.D.; Plewniak, F.; Poch, O. BAliBASE: A Benchmark Alignment Database for the Evaluation of Multiple Alignment Programs. Bioinformatics 1999, 15, 87–88. [Google Scholar] [CrossRef] [PubMed]
- Thompson, J.D.; Koehl, P.; Ripp, R.; Poch, O. BAliBASE 3.0: Latest Developments of the Multiple Sequence Alignment Benchmark. Proteins 2005, 61, 127–136. [Google Scholar] [CrossRef] [PubMed]
Disclaimer/Publisher’s Note: The statements, opinions and data contained in all publications are solely those of the individual author(s) and contributor(s) and not of MDPI and/or the editor(s). MDPI and/or the editor(s) disclaim responsibility for any injury to people or property resulting from any ideas, methods, instructions or products referred to in the content. |
© 2025 by the authors. Licensee MDPI, Basel, Switzerland. This article is an open access article distributed under the terms and conditions of the Creative Commons Attribution (CC BY) license (https://creativecommons.org/licenses/by/4.0/).