1. Introduction
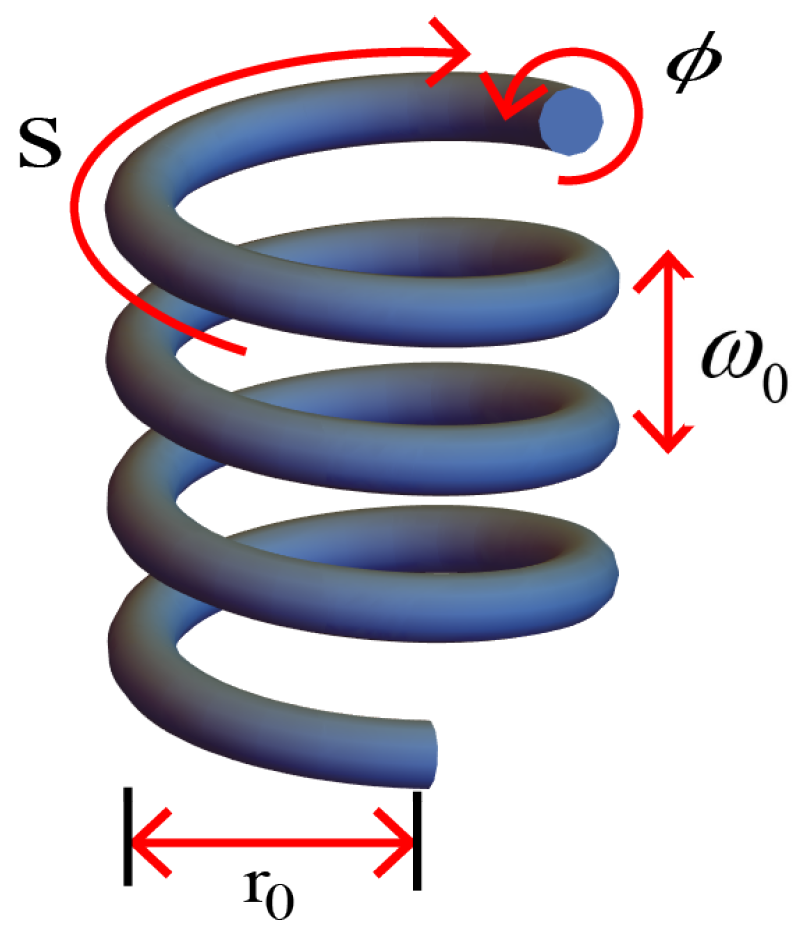
Carbon nanotube (CNT) springs are helically coiled CNT structures. They have attracted significant attention due to their exceptional mechanical and electrical properties. Initially introduced by Ihara [
1,
2] and Dunlap [
3], the helically coiled CNT was later experimentally realized by Zhang [
4], who successfully synthesized coiled carbon nanotubes and fibers. Hernadi [
5] explored the influence of catalyst preparation on coil formation and proposed the mechanisms underlying their helical structures, providing further insights into the growth mechanisms and microstructural properties of helically coiled CNTs. These structures are defined by the coil diameter and pitch, which are determined by the periodic incorporation of pentagon and heptagon pairs into the hexagonal carbon lattice. This geometric modification results in positively and negatively curved surfaces, significantly enhancing the mechanical and electronic properties. As a result, CNT springs exhibit remarkable tensile strength and energy density [
6], making them ideal for applications that require compact and lightweight energy storage solutions. Graphene is a two-dimensional carbon nanomaterial that exhibits exceptional electrical and mechanical properties. Its hexagonal lattice structure enables massless Dirac fermion behavior, high carrier mobility, and strain-induced electronic modifications. Mechanical strain in graphene can generate pseudo-gauge fields, altering its band structure and transport properties [
7]. These effects provide the basis for an understanding of the curvature-induced electronic properties in helically coiled CNTs, where the strain and curvature are inherently linked. Furthermore, CNT springs, which can be regarded as a type of CNT yarn, provide a versatile platform for the analysis of specific applications, particularly those where their unique electromechanical coupling enables the generation of an electrical current under strain. CNT springs can function as electromechanical transducers, capable of generating electrical signals in response to mechanical deformation; this makes them ideal for energy harvesting and wearable electronics. Recent studies have also explored how the curvature in low-dimensional carbon systems influences the electronic properties, providing insights into the electronic band modifications in CNT springs [
8].
CNT springs have been used in various applications, including thermoelectric textiles that harvest heat energy from temperature gradients, achieving high power densities of 51.5 mW/m². This makes them suitable for wearable electronics and healthcare monitoring [
9]. Ferritin biscrolled CNT yarns were shown to enhance the energy harvesting capabilities in biofluid environments, making them excellent candidates for implantable medical devices [
10]. Strain sensors based on CNT/polymer composites exhibited stretchability exceeding
, enabling precise motion capture and real-time feedback for robotics and wearable devices [
11]. Artificial muscles based on CNT achieved strains of up to
and generated stresses that were more than 20 times greater than those of human skeletal muscle, making them suitable for intelligent robotics, actuators, and clamping devices [
12]. High-temperature annealed CNT yarns exhibited enhanced electrical conductivity, reaching values of 1680 S/cm due to improved graphitization, enabling them to support energy storage and thermal management systems [
13]. The hierarchical structure in a biological system designed with ester bond cross-linkages showed enhanced toughness and multifunctionality, and they are ideal for smart textiles and advanced wearable technologies [
14]. Furthermore, CNT springs have enabled the development of highly sensitive sensors that are capable of detecting environmental changes such as pressure, temperature, and strain changes, providing precise measurements for structural health monitoring and wearable technology applications [
15,
16,
17,
18].
Beyond their mechanical applications, CNT springs have unique electromechanical coupling properties. When subjected to strain, they can generate an electrical current, aligning with experimental observations of their behavior under deformation [
19,
20]. This strain-induced current generation highlights their potential for energy harvesting [
21,
22,
23,
24] and sensing technologies [
25,
26]. Recent studies have demonstrated that CNT-based yarn harvesters can efficiently convert mechanical energy, such as tensile or torsional forces, into electrical energy without requiring an external bias. These systems exhibit dynamic responses, such as significant changes in capacitance and the open-circuit voltage under strain [
27], underscoring their efficiency and potential in energy conversion applications. For example, CNT harvesters exhibit a time-dependent open-circuit voltage (OCV) [
28], which is the potential difference between two terminals when no external load is applied. They also show short-circuit current (SCC) characteristics, as demonstrated in a coiled cone-spun harvester subjected to 1 Hz sinusoidal stretches to
, displaying asymmetric electrical responses. The SCC is the measured current when the output terminals of a device are directly connected, excluding the external resistance. When stretched to 30% strain, the harvester’s capacitance decreased by
, while its OCV increased by 140 mV, highlighting its dynamic response and efficiency in energy conversion applications. Despite these advancements, there is limited theoretical research exploring the mechanisms of current flow and the reasons behind the asymmetric nature of these electrical responses. Such asymmetric electrical responses—characterized by asymmetric current generation and power output during stretching and compression cycles—were observed in Kim’s work on CNT yarn harvesters, where strain-induced charge transport exhibited non-linear behavior. Similarly, Kim, H. et al. [
10] demonstrated the harvesting of electrical energy from ferritin CNT yarns, reporting noticeable asymmetries in the SCC and OCV under cyclic strain. Wang, Z [
23] et al. also reported pronounced asymmetries in the electrical outputs of CNT yarn energy harvesters, further highlighting the need for a comprehensive theoretical framework to explain these phenomena.
Strain-induced modifications to the electronic properties of CNT springs arise from pseudo-vector potentials and fictitious gauge fields, as illustrated in related studies on 2D materials such as graphene [
29,
30,
31]. Graphene’s electronic behavior under mechanical stress, characterized by phenomena such as Aharonov–Bohm interference [
32,
33] and strain-induced vector potentials, demonstrates the profound interaction between structural deformation and electronic properties. Similarly, CNT springs exhibit strain-dependent electrical behavior, with mechanical deformation influencing the current flow and transport characteristics. Despite these promising experimental advancements, the theoretical mechanisms underlying current generation and the observed asymmetric electrical responses in strained CNT springs remain underexplored. Recent studies indicate that strain on 2D materials [
34,
35] can induce current generation without an electric bias, suggesting parallels with the behavior of CNT springs. However, a comprehensive theoretical framework that explains these mechanisms is lacking.
The aim of this study was to bridge the gap between experimental observations and the theoretical understanding of the mechanisms underlying current flow in CNT springs under strain—particularly the reasons behind their asymmetric electrical responses. This work is organized as follows: In
Section 2.1, the properties of an electron gas confined to the curved surface of a CNT spring are analyzed using the (2 + 1)-dimensional Dirac equation. The curvature of the CNT springs generates periodic scalar and pseudo-gauge potentials; along with the coupling between the circumference and axial motion, this significantly influences the electron dynamics. In
Section 2.2, the effect of strain on the CNT spring is described, incorporating time-dependent variations in the Lamé coefficient and curvature parameter to explore the system’s response. A time-dependent Hamiltonian is constructed, and instantaneous eigenstates are determined to characterize the strain-induced electronic behavior.
Section 2.3 focuses on the conservation of charge, relating mechanical strain to the electronic dynamics and providing an equivalent circuit model to explain the observed current and charge distributions. Finally,
Section 3 presents the energy band structures and current generation mechanisms, highlighting the asymmetric electrical responses arising from the curvature and strain effects. This work provides theoretical insights that correspond to experimental observations, and it demonstrates the potential of CNT springs for energy harvesting and sensing applications.
3. Results
In this study, we investigate the generated current in CNT springs under varying strain through a theoretical approach based on the Dirac equation in curved spacetime. In our model, the generated current is calculated using the continuity equation (Equation (
31)). This equation represents the foundation from which we describe the dynamics of CNT springs under a specific strain; it is equivalent to the circuit model of the system demonstrated in
Figure 3. This model can be divided into two cases. The first case is the charging of the capacitor. When the CNT spring is subjected to strain, the time-dependent current source generates an electrical current. This current is divided into two main components. One part corresponds to the term related to the capacitive current, reflecting the mechanism of charge redistribution within the CNT spring and indicating the increase in charge as it responds to the applied strain. This term signifies that part of the current is stored in the capacitance, as illustrated in the equivalent circuit. The other part of the current is the output current. This is the current flowing out of the CNT springs; meanwhile, the remainder is the capacitive current stored within the system as charge in the capacitance, as demonstrated in
Figure 3b. In the second case, during discharging, the stored charge in the capacitor is released back into the system, resulting in a decrease in the total charge within the CNT spring. As the strain is applied, the charge redistribution process is reversed, and the current is released from the capacitor. This released current combines with the current from the time-dependent current source to form the total output current that flows out of the system. Furthermore, the time-dependent current source, the relative total charge, and the output current—as shown in
Figure 4,
Figure 5, and
Figure 7a, respectively—exhibit asymmetric behavior. This is indicated by the fact that the upper and lower portions of the graphs are not symmetric. In particular, the asymmetry observed in the time-dependent current source and time-dependent power output aligns with the experimental findings reported in Kim’s work [
28], which documented a similar phenomenon in strained CNT springs.
In our numerical calculations, we utilize the parameters
= 21.23
m,
= 90
m and
= 10 nm, derived from the experimental data analysis in Kim’s work [
28]. Further details can be found in
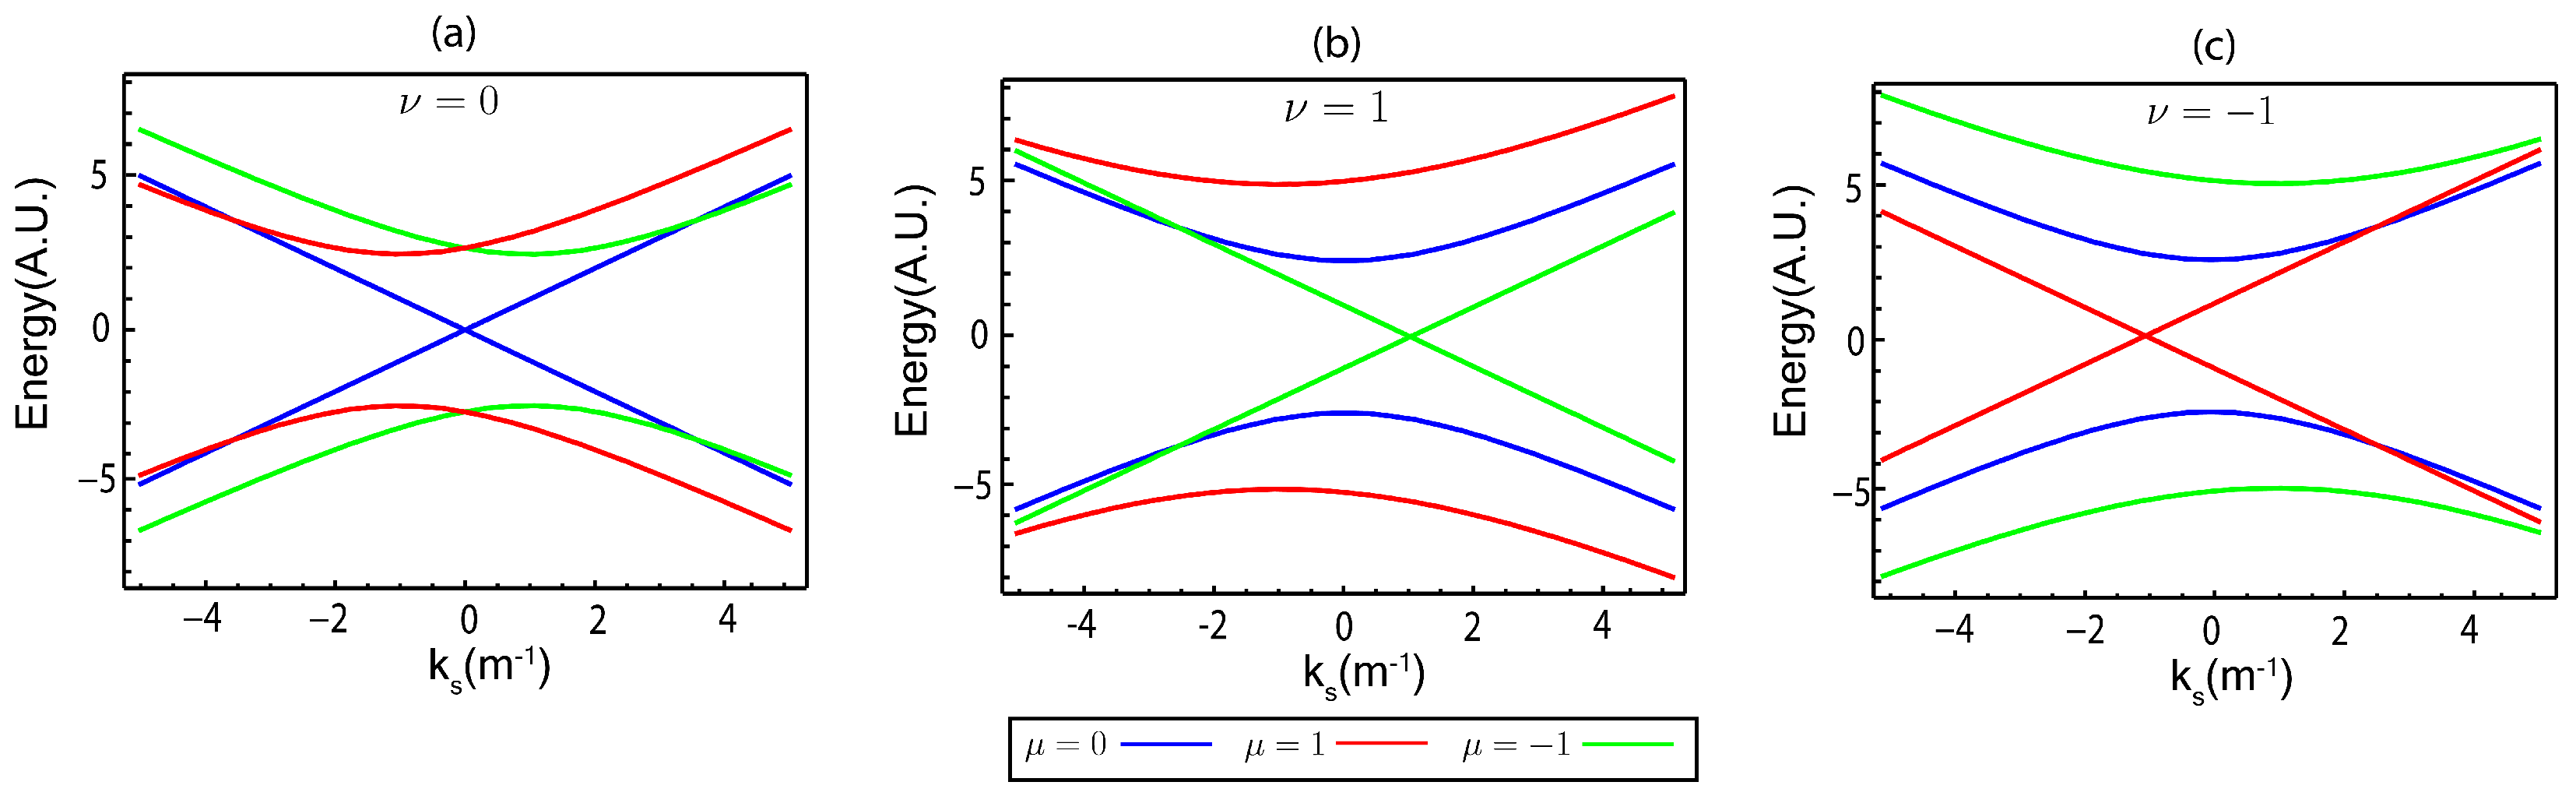
Supplementary Note S1. Based on these parameters, it is possible to calculate the curvature parameter within the range of contour 2, as described in the work of Thiti Thitapura. In this contour, there are three Dirac points, which result in superlattice numbers of
, as illustrated in
Figure 2. Therefore, the calculation of the instantaneous eigenstate in Equation (
21) is based on the energy–momentum dispersion relation in contour 2, as described in Thiti Thitapura’s research [
36].
Figure 4,
Figure 5 and
Figure 6 illustrate the characteristics of the time-dependent current source and the relative total charge under varying strain conditions. In contrast,
Figure 7a illustrates the time-dependent power output,
Figure 7b presents the peak power, and
Figure 7c depicts the absolute maximum charge. These analyses reflect a
variation in the parameter
in Equation (
17). This investigation considers the band structure of the CNT spring for different superlattice numbers (
) and quantum azimuthal numbers (
). The results across these cases are compared and analyzed. The graphs in
Figure 4,
Figure 5,
Figure 6 and
Figure 7 share a consistent period of 2.5 s, matching the period of strain application on the CNT spring, as shown in the inset of
Figure 3a. The phase of the strain graph within the interval 0 to
represents the extension phase of the CNT spring, while the phase between
and
corresponds to the compression phase. This periodic strain cycle aligns with the computational results illustrated in
Figure 4,
Figure 5,
Figure 6 and
Figure 7. The analysis highlights the electrical responses of the CNT spring under the described strain conditions, emphasizing the role of the superlattice and azimuthal configurations in shaping the current, charge characteristics, and electrical properties, including the power output, peak power, and OCV, as demonstrated in
Figure 7. These findings provide valuable insights into the CNT spring’s dynamic behavior and its electronic performance.
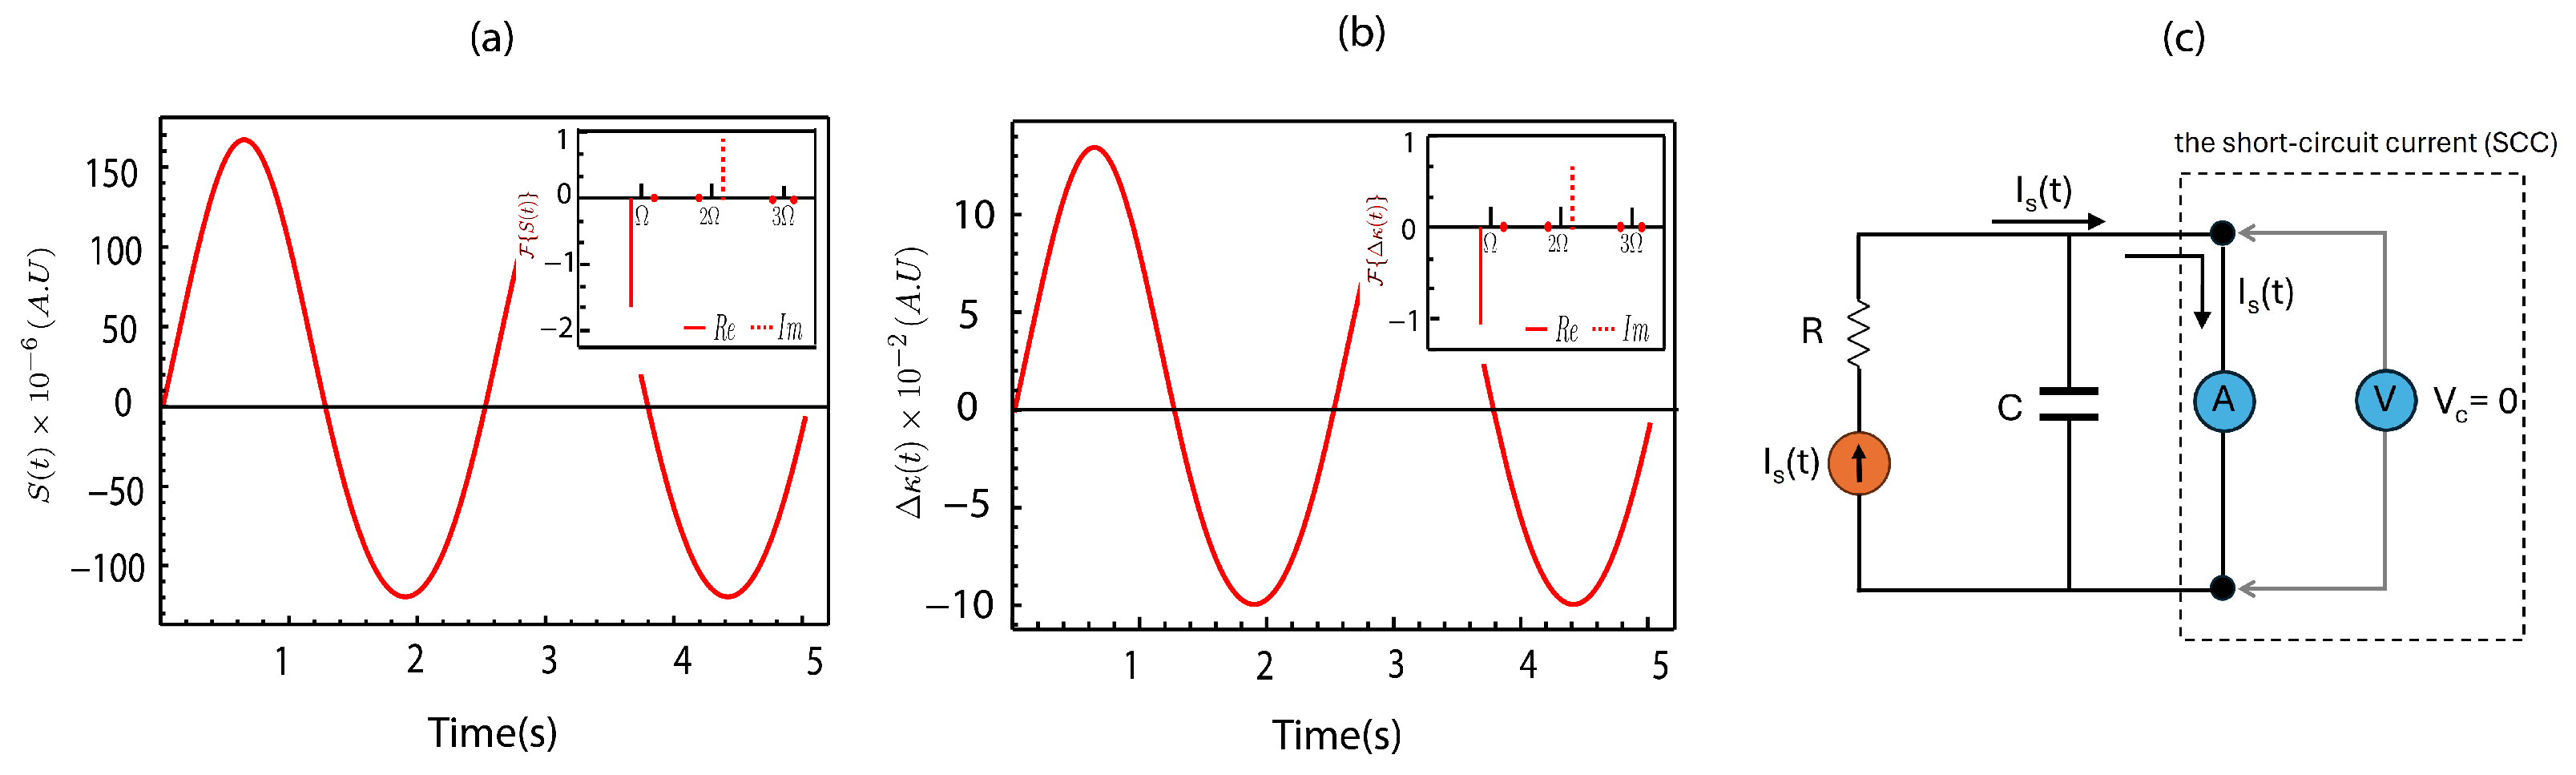
Figure 4.
(
a) The time-dependent current source simulated with the following parameters: helical radius
= 21.23
m, pitch width
= 90
m, nanotube radius
= 10 nm, applied strain amplitude
(
) and vibration frequency
. The inset shows the Fourier coefficients corresponding to the time-dependent current source derived under the applied strain. (
b) displays
, the time-dependent change in the curvature parameter caused by strain, using the same simulation parameters as in
Figure 4. The inset includes the Fourier coefficients of
. (
c) represents the equivalent circuit model of the system when detecting the short-circuit current (SCC).
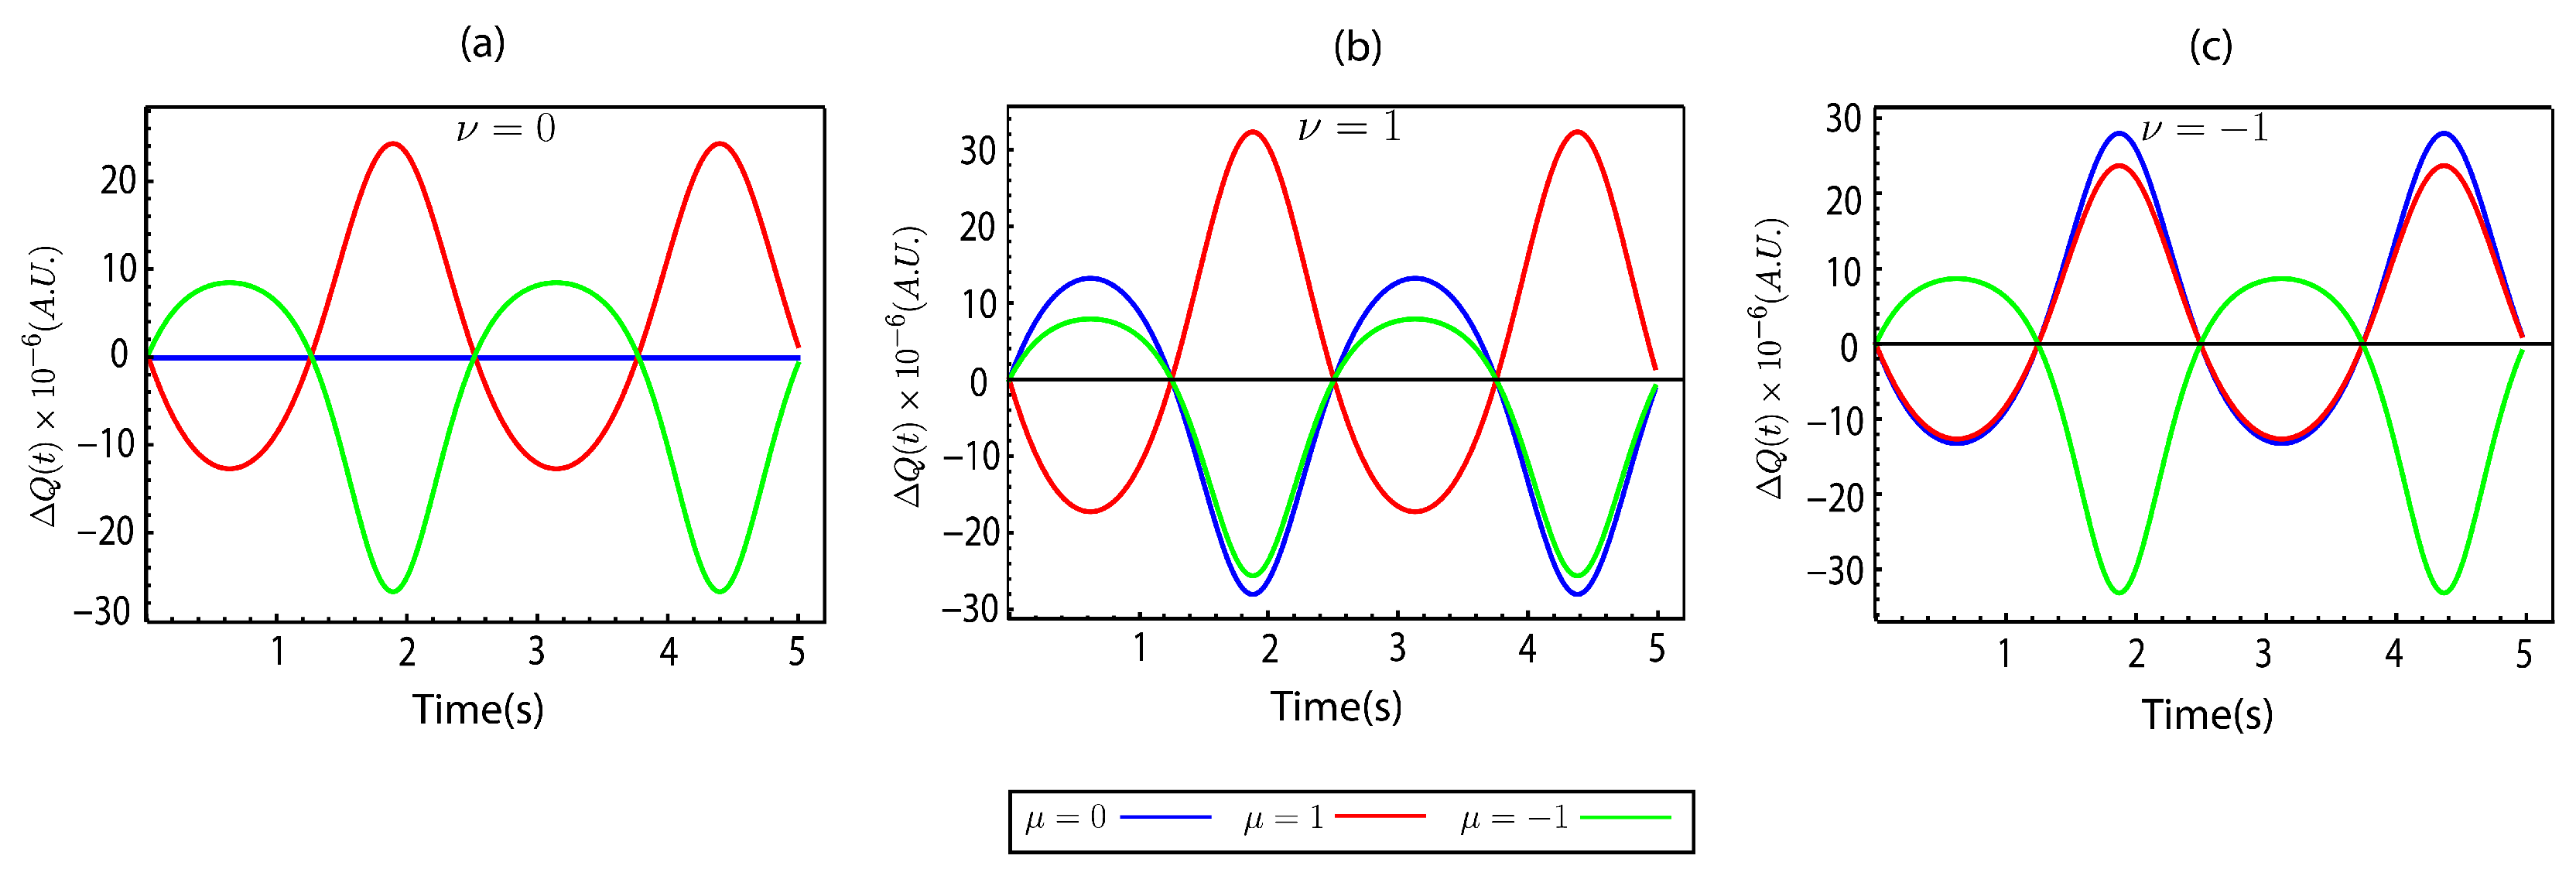
Figure 5.
Results for the relative total charge, with red, blue, and green lines representing the superlattice numbers
, respectively, calculated under the same simulation conditions and parameters as in
Figure 4. (
a) Relative total charge for
. (
b) Relative total charge for
. (
c) Relative total charge for
.
Based on the calculations of the time-dependent current source in Equation (
30) for each energy band structure, as shown in
Figure 2, we find that the time-dependent current source is identical across all energy band structures, with the exception of the band structure with band index
. This band index’s time-dependent current source is absent, meaning that the current does not appear. This behavior is illustrated in
Figure 4a, where the plotted data directly correspond to the time-dependent current source derived from Equation (
30). This is attributed to the symmetric nature of the band structure around both positive
and negative
, which results in the elimination of the time-dependent current source for this particular band. Similar characteristics are observed when comparing the results to
, as shown in
Figure 4b. This figure shows the time-dependent curvature parameter calculated from Equation (
19). In the phase interval between 0 and
, a peak is evident, corresponding to the stretching phase of the CNT spring, during which the amplitude is larger compared to the phase interval between
and
, when the CNT spring is compressed. However, as shown in the inset of
Figure 3a, the strain applied to the CNT spring is equivalent during both the stretching (
) and compression (
) phases. This discrepancy arises from the non-linear dependence of the Lamé coefficient, as described in Equation (
18), on the pitch length of the CNT spring. Consequently, the time-dependent current source and
exhibit different magnitudes during stretching and compression, despite the strain being identical. This implies that the vector potential induced by strain is also asymmetric, with a greater magnitude during stretching than compression, even under the same applied strain. Additionally, the Fourier coefficients of the time-dependent current source and
, shown in the inset graphs, reveal the presence of two frequency components:
, which represents the primary frequency, and
, which corresponds to the harmonic or secondary frequency. These components are out of phase by
in the imaginary part. The presence of both primary and harmonic frequencies indicates the occurrence of complex oscillatory behavior in the system. This dual-frequency composition significantly affects the time-dependent current source and
, leading to non-linear interactions between the stretching and compression phases. As a result, these interactions contribute to the observed asymmetry in the electrical responses. In
Figure 4c, the current flowing out of the equivalent circuit under short-circuit conditions is depicted. This figure shows the SCC derived directly from the time-dependent current source using Equation (
30). We ensure that the total voltage drop across the equivalent circuit is zero, and there is no current flow into or out of the capacitor (
). As a result, the output current from the circuit corresponds directly to the time-dependent current source. Thus, the SCC under these conditions equals the time-dependent current source, as illustrated in
Figure 4c. A similar trend is observed when comparing the calculated SCC to the experimental results reported by Kim [
28]. Additionally, similar SCC behaviors under strain have been reported in the works of Kim, H. et al. [
10] and Mun, T.J. et al. [
23]. The SCC lacks symmetry between the
and
phases. Specifically, the SCC amplitude during the
phase is more significant than that during the
phase.
Figure 5a–c depict the relative total charge, defined as
. Here, the relative total charge is calculated using the continuity equation (Equation (
30)), which relates the time-dependent current to the charge distribution within the CNT spring. When examining the relative total charge at the band index
, as shown in
Figure 5a, no change in the total charge is observed. This is consistent with the absence of a current source generated at this band index. For the band index
, a decrease in the relative total charge is observed during the phase interval between 0 and
(corresponding to the stretching phase of the CNT spring). This indicates that, during this phase, the capacitor undergoes discharge. Conversely, the relative total charge increases during the phase interval between
and
(the compression phase of the CNT spring), suggesting that the equivalent capacitor recharges during this phase. In contrast, for the band index
, also shown in
Figure 5a, the relative total charge increases during the
phase, indicating the charging of the capacitor; meanwhile, during the
phase, the relative total charge decreases, corresponding to the discharging of the capacitor.
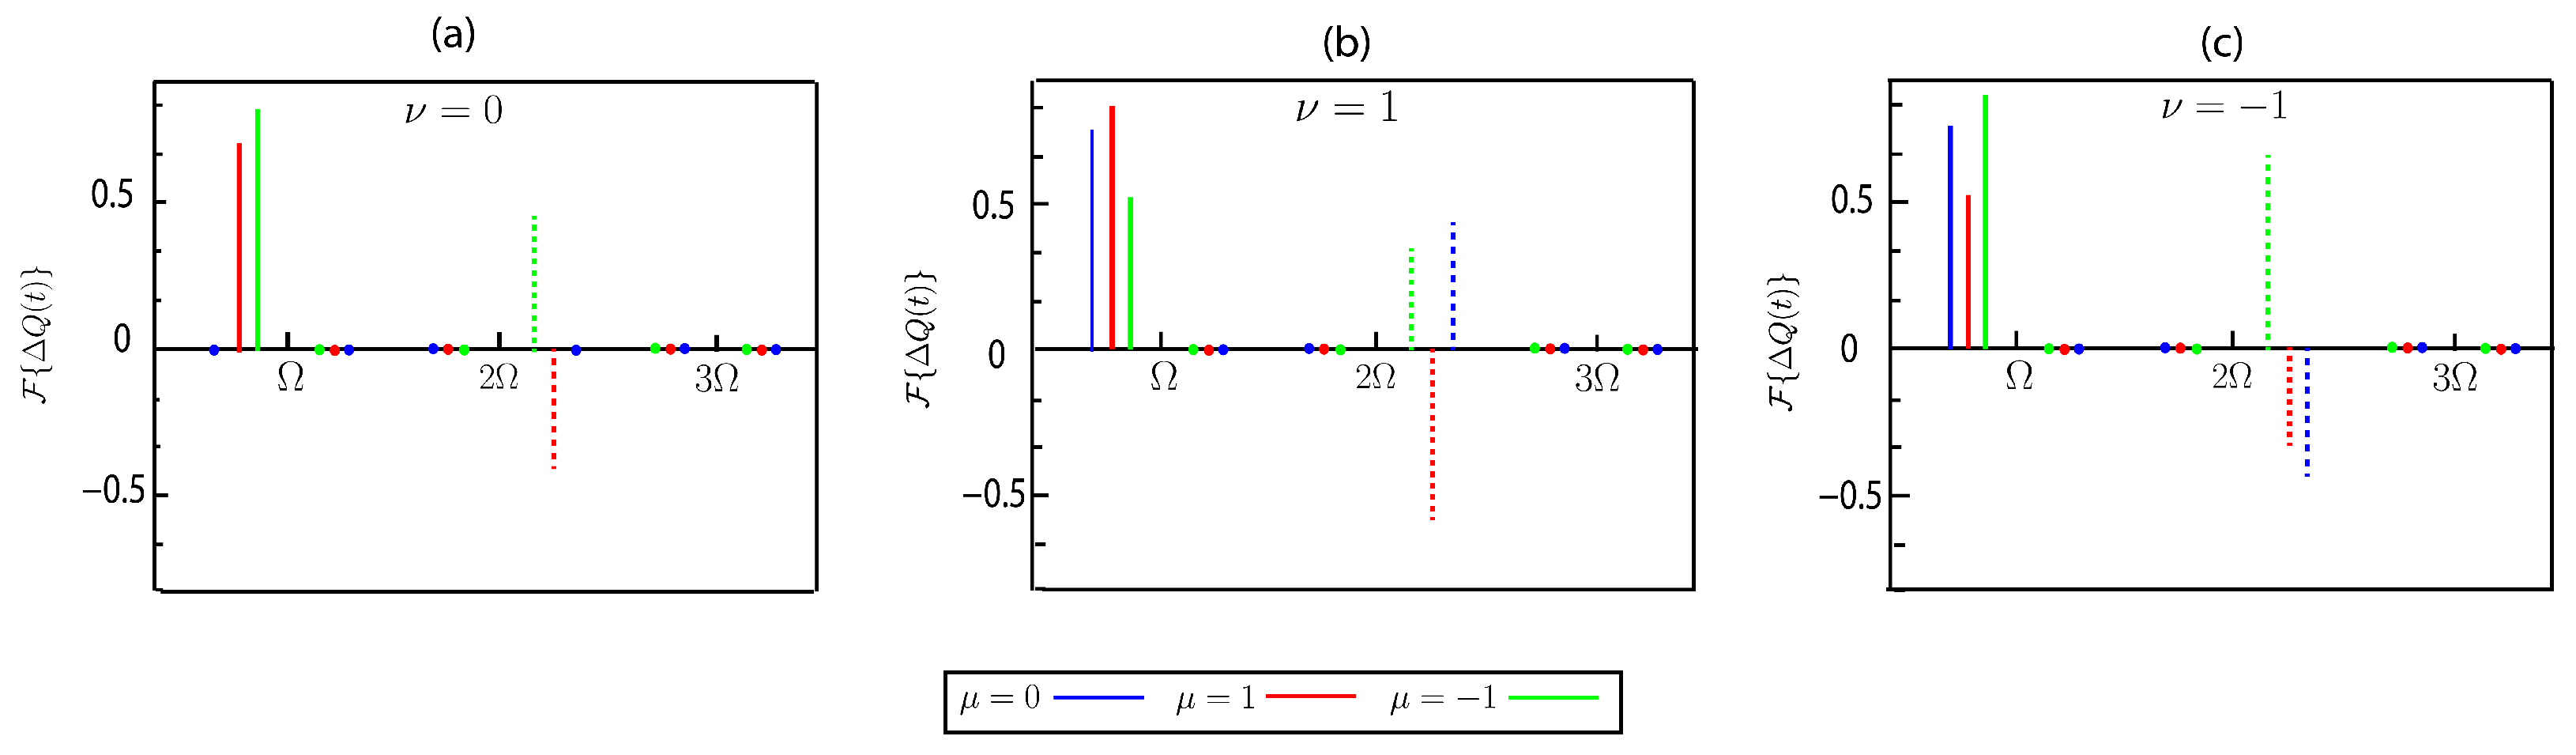
The differences in the relative total charge behavior are further analyzed through the Fourier coefficients, which are derived from the charge dynamics governed by Equation (
30). The Fourier coefficients are depicted in
Figure 6a. At frequency
, the Fourier coefficients of the two band indices exhibit a phase difference of
. Specifically, for the band index
, the Fourier coefficient at
has a positive value for the imaginary parts, consistent with the phase of the relative total charge at this band index. In contrast, for
, the Fourier coefficient at
has a negative value for the imaginary part, which aligns with the phase of the relative total charge in this band index. These Fourier coefficients, calculated based on Equation (
30), provide insights into the frequency components of the charge distribution under strain. This phase relationship and the Fourier analysis enable a comprehensive understanding of the observed charge dynamics and their correlations with the stretching and compression of the CNT spring.
A similar analysis can be applied to other band indices to explain the behavior of the relative total charge and the charging and discharging processes during the stretching or compression phases. As shown in
Figure 5b,c, this relationship holds consistently across all band indices, where the phases of the relative total charge align with the Fourier coefficients shown in
Figure 6b,c, respectively. This agreement reinforces the validity of using Fourier coefficient analysis to interpret the attributes of the relative total charge in the system under various band indices.
Changes in the relative total charge and associated charging or discharging processes can also be analyzed by considering the changes at the bottom of the energy band structures shown in
Figure 2. For instance, in
Figure 2a, at the band index
, the bottom of the energy band structure is perfectly centered and unshifted. As a result, there is no change in the relative total charge for this band index. In contrast, for the band index
, the bottom of the energy band structure is shifted toward a positive
. This causes the overall charge within the CNT spring to increase during the stretching phase (
), while, during the compression phase (
), the overall charge within the CNT spring tends to decrease. This behavior contrasts that observed for the band index
, where the bottom of the energy band structure is shifted toward a negative
. In this case, the total charge within the CNT spring decreases during the stretching phase (
) and increases during the compression phase (
); these dynamics are illustrated in
Figure 5a. This analysis of the shifts at the bottom of the energy band structure can be extended to explain the changes in the relative total charge observed in
Figure 5b,c. These changes are consistent with the shifts in the bottom of the energy band structures shown in
Figure 2b,c.
Figure 6.
Fourier coefficients of the relative total charge for different superlattice numbers
, derived from simulations using the same parameters as in
Figure 4 and represented by red, blue, and green lines, respectively. The solid lines denote the real parts, while the dashed lines represent the imaginary parts of the Fourier coefficients. (
a) Relative total charge for
. (
b) Relative total charge for
. (
c) Relative total charge for
.
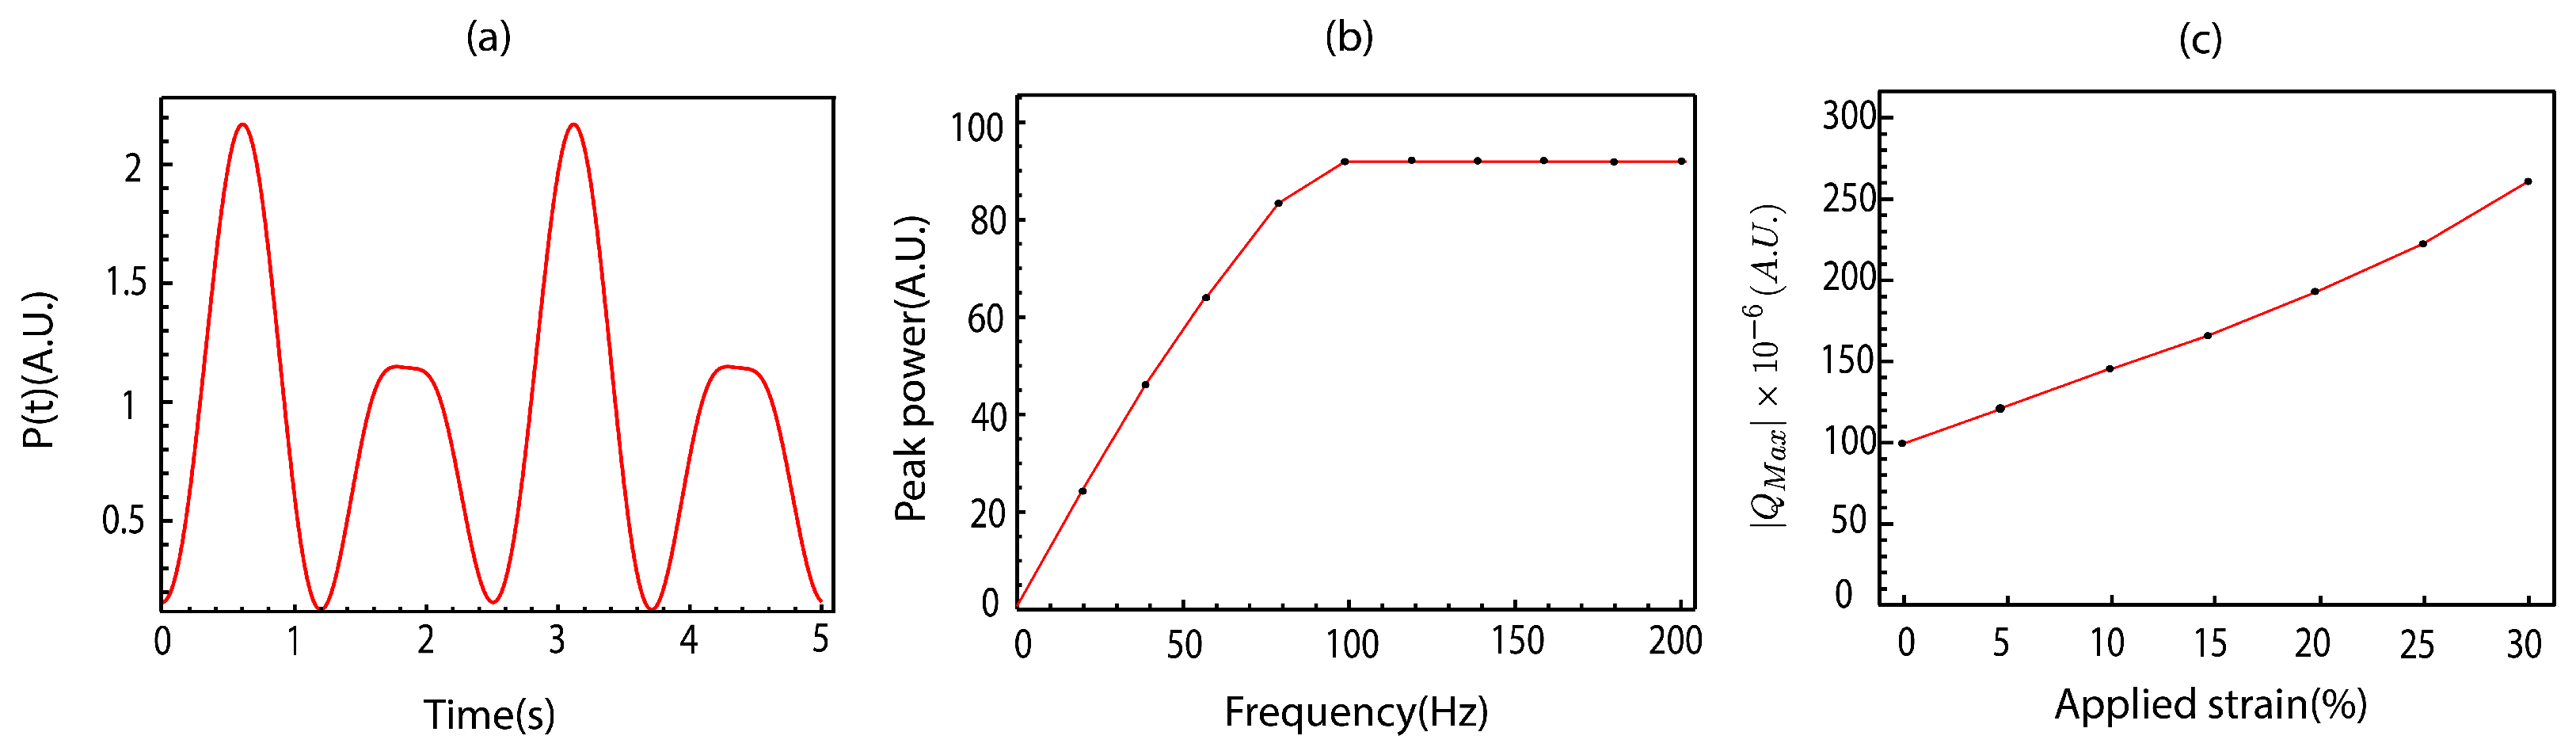
Figure 7.
(a) Time-dependent power output at with simulation parameters = 21.23 m, = 90 m, = 10 nm, and . (b) Peak power across various frequencies. (c) Absolute maximum charge under different applied strains.
Figure 7.
(a) Time-dependent power output at with simulation parameters = 21.23 m, = 90 m, = 10 nm, and . (b) Peak power across various frequencies. (c) Absolute maximum charge under different applied strains.
Figure 7a illustrates the time-dependent power output at a frequency of 0.4 Hz. The power output shown here is calculated using Equation (
33), which defines the power output in terms of the square of the output current in the equivalent circuit model. The time-dependent power output is measured by connecting the load in an equivalent circuit with the external resistance, as calculated using Equation (
33). This time-dependent power output represents the combined contribution of all band indices. According to Equation (
33), the time-dependent power output is directly proportional to
. At
, when the load is connected, a
current flows out of the circuit, resulting in an initial time-dependent power output of approximately 0.05. This initial value arises from the induced pseudo-vector potential in the CNT spring structure, as described in the work of Thiti [
36]. The calculations reveal that, during the extension phase of the CNT spring (
), the amplitude of the time-dependent power output is higher compared to the compression phase (
), illustrating the asymmetric electrical response under these strain conditions. This asymmetry in the time-dependent power output is attributed to the unequal response of
to the applied strain during the extension and compression phases. Moreover, this asymmetry in the plotted power output is a direct result of the strain-induced variations in the curvature parameter
calculated from Equation (
19). Specifically,
exhibits a higher amplitude during the extension phase than during compression. These calculated results align with the experimental findings reported by Kim [
28], highlighting similar asymmetric electrical responses in terms of the power output in strained CNT springs. In addition to Kim’s work, similar asymmetric behaviors have also been observed in the study by Mun, T.J. et al. [
23].
Figure 7b shows the peak power values at different frequencies. The peak power values shown here are derived from the time-dependent power output calculations based on Equation (
33), which relates the power output to the square of the output current in the equivalent circuit model. The peak power is defined as the maximum value of the time-dependent power output within one cycle, where one cycle corresponds to one complete extension and compression cycle of the CNT spring. The calculated peak power values represent the contributions of all band indices. The results indicate that the peak power increases with the frequency, reaching a maximum value of approximately 92 at a frequency of around 100 Hz. Beyond this frequency, the peak power remains constant and does not increase further. This frequency-dependent behavior is a direct result of the current dynamics governed by Equation (
33). This behavior is consistent with the experimental observations reported in Kim’s study. Additionally, similar frequency-dependent peak power behavior has been observed in the works of Kim, H. et al. [
10,
28], Wang, Z. et al. [
27], and Mun, T.J. et al. [
23].
Figure 7c presents the absolute maximum charge at different levels of applied strain. The maximum charge shown here is calculated using the voltage–charge relationship from Equation (
32), where the charge is proportional to the capacitor voltage in the equivalent circuit. The absolute maximum charge is calculated as the maximum charge contribution across all band indices. Moreover, the absolute maximum charge is directly proportional to
, and, from the equivalent circuit, it can be observed that the total voltage drop across the circuit is equal to
. The charge values in this figure reflect the strain-induced charge accumulation described by Equation (
32). Therefore, the results of the absolute maximum charge can effectively describe the behavior of the OCV. Specifically, the results indicate that, as the applied strain increases, the absolute maximum charge also increases proportionally. Thus, our calculations imply that the OCV will increase with the applied strain, which is consistent with the experimental measurements of the OCV reported in Kim’s work [
28], where a similar trend was observed. Additionally, Mun, T.J. et al. [
23] reported comparable strain-induced increases in the OCV in CNT-based systems.
4. Conclusions
In this study, we established a comprehensive theoretical framework to elucidate the curvature-induced electrical properties of a two-dimensional electron gas confined in carbon nanotube CNT springs. By employing the Dirac equation in curved spacetime, we demonstrated how geometric deformation influenced the electronic behavior, revealing the interplay between the mechanical strain and electronic responses. These results validate and extend previous experimental observations, offering key insights into the mechanisms of strain-induced current generation in CNT-based systems.
The key findings highlight the asymmetric time-dependent current behavior during the stretching and compression cycles of CNT springs, driven by curvature-dependent variations in the Lamé coefficient and induced vector potentials. Non-linear changes in these parameters led to differences in the magnitudes of the time-dependent current and charge redistribution, with more pronounced effects during stretching than compression. These findings align closely with the experimental data, where the electrical responses display clear asymmetry over a full mechanical cycle, reinforcing the validity of our theoretical model.
The Fourier analysis allowed us to identify two key frequencies, namely, the primary and harmonic frequencies, phase-shifted by in the imaginary part. These frequencies, derived from the Fourier coefficients of the time-dependent current source and , highlight the system’s complex oscillatory behavior. Their interplay drove non-linear interactions between the stretching and compression phases, contributing to asymmetries in the electrical responses, such as in the power output and charge redistribution. These findings deepen our understanding of the ways in which strain modulates the curvature and electronic dynamics, providing a strong theoretical basis that is consistent with experimental observations.
The charge redistribution patterns were found to depend on the energy band indices, with specific band structures exhibiting contrasting charging and discharging behaviors during stretching and compression. Shifts in the energy band structure’s bottom part significantly influenced charge redistribution, linking the quantum-level properties to macroscopic strain effects. These results deepen our understanding of the ways in which curvature and strain govern the electronic dynamics in CNT springs. Additionally, the curvature-induced vector potential generated higher power outputs during stretching than during compression, attributed to greater variations in the curvature parameter. The peak power output was observed at ∼100 Hz, with the performance stabilizing beyond this frequency, highlighting the optimal range for energy harvesting. The strain analysis confirmed the proportional relationship between the applied strain and maximum charge storage, consistent with the OCV trends observed in the experiments.
Addressing the existing challenges could enable significant advancements in this field. Innovations in CNT synthesis, structural optimization, and hybrid nanomaterials are critical for enhanced performance and durability. This study contributes to these efforts by providing a framework that supports the design of more efficient CNT-based devices, including implantable bioelectronics, stretchable supercapacitors, and motion sensors. Future research should focus on integrating CNT springs into multifunctional systems for soft robotics, sustainable energy solutions, and next-generation flexible electronics, expanding their applicability in diverse technological fields.

