Article

A Methodology for Contrast Enhancement in Laser Speckle Imaging: Applications in Phaseolus vulgaris and Lactuca sativa Seed Bioactivity

by
Edher Zacarias Herrera
1,2,
Julio César Mello-Román
3,*,
Joel Florentin
4,
José Palacios
4,
Gustavo Eduardo Mereles Menesse
1,
Jorge Antonio Jara Avalos
1,
Marcos Franco
1,
Fernando Méndez
1,
Miguel García-Torres
5,
José Luis Vázquez Noguera
3,*,
Pastor Pérez-Estigarribia
3,6,
Sebastian Grillo
7 and
Horacio Legal-Ayala
3,4
1
Facultad de Ciencias Exactas y Naturales, Universidad Nacional de Asunción, San Lorenzo 111421, Paraguay
2
Brazilian Center for Research in Physics, Rio de Janeiro 22290-180, Brazil
3
Department of Computer Engineer, Universidad Americana, Asunción 1206, Paraguay
4
Digital Image Processing Research Group, Facultad Politécnica, Universidad Nacional de Asunción, San Lorenzo 111421, Paraguay
5
Data Science and Big Data Lab, Pablo de Olavide University, ES-41013 Seville, Spain
6
Facultad de Ciencias de la Salud, Universidad Sudamericana, Pedro Juan Caballero 1206, Paraguay
7
Facultad de Ciencias y Tecnologías, Universidad Autónoma de Asunción, Asunción 1255, Paraguay
*
Authors to whom correspondence should be addressed.
Symmetry 2025, 17(12), 2029; https://doi.org/10.3390/sym17122029
Submission received: 14 September 2025 / Revised: 3 November 2025 / Accepted: 13 November 2025 / Published: 27 November 2025
(This article belongs to the Special Issue Symmetry and Its Applications in Image Processing)

Abstract

Laser Speckle Imaging (LSI) is a non-invasive optical technique used to assess biological activity by detecting dynamic variations in speckle patterns. These patterns exhibit statistical symmetry in static regions, while biological activity induces symmetry breaking that can be captured through the Graphic Absolute Value of Differences (GAVD), producing the activity map I G A V D . This work evaluates the effect of four contrast enhancement algorithms: Histogram Equalization (HE), Contrast Limited Adaptive Histogram Equalization (CLAHE), Multiscale Morphological Contrast Enhancement (MMCE), and Multiscale Top-Hat Transform with an Open-Close Close-Open (OCCO) filter, applied to intermediate LSI images, with the final activity map used for quantitative evaluation. Each method represents a distinct enhancement paradigm: HE and CLAHE are histogram-based techniques for global and local contrast adjustment, whereas MMCE and OCCO-MTH are morphological approaches that emphasize structural preservation and local detail enhancement. The dataset consisted of images of Phaseolus vulgaris (SP) and Lactuca sativa (SL) seeds. Evaluation was conducted through expert visual inspection and quantitative analysis using contrast, entropy, spatial frequency (SF), structural similarity index (SSIM), peak signal-to-noise ratio (PSNR), and contrast improvement ratio (CIR). All metrics were computed on I G A V D activity maps, which reflect bioactivity through the disruption of statistical symmetry. Non-parametric statistical tests (Friedman, aligned Friedman, and Quade) revealed that CLAHE and MMCE significantly improved image quality compared to the original images ( p < 0.05 ). Among the evaluated algorithms, CLAHE increased global contrast by approximately 25% and entropy by 6% relative to the original speckle frames, enhancing the visibility of bioactive regions. MMCE achieved the highest bioactivity contrast ratio (CIR = 0.64), while OCCO-MTH provided the best structural fidelity (SSIM = 0.91) and noise suppression (PSNR = 30.7 dB). These results demonstrate that suitable contrast enhancement can substantially improve the interpretability of LSI activity maps without altering acquisition hardware. This finding is particularly relevant for experimental applications aiming to maximize information quality without modifying acquisition hardware.

1. Introduction

LSI is an optical technique based on the formation of a granular interference pattern, known as speckle, when a coherent light beam strikes a rough surface or a sample with microscopic structural variations. This pattern is highly sensitive to dynamic changes in the sample, allowing its use in various scientific and technological applications. When speckle is used to analyze biological activity, such as cell dynamics, blood circulation, or structural changes in tissues and plants, the technique is referred to as Laser Speckle Imaging. In these cases, fluctuations in the speckle pattern reflect biophysical and biochemical processes in real time, providing information about the metabolic and structural activity of biological systems [1,2].
In the context of LSI applied to seeds, bioactivity is inferred from the temporal fluctuations of the speckle pattern, which reflect underlying metabolic and structural changes. The Graphic Absolute Value of the Differences (GAVD) is widely used as an activity map in biospeckle analysis: regions undergoing active biological processes (e.g., radicle or plumule development) typically exhibit higher temporal intensity variation than static background or seed coat. This physical basis supports the use of GAVD as a proxy for bioactivity in both visual inspection and quantitative evaluation [1,2].
Laser speckle is a granular interference pattern formed when coherent light, such as that from a laser, is scattered by a rough surface or a heterogeneous medium. In biological samples, temporal fluctuations in the speckle pattern are primarily caused by microscopic motion and changes in refractive index, which are linked to metabolic or structural activity [1,2]. By capturing time-resolved speckle images, it is possible to quantify these fluctuations and infer bioactivity. In this work, GAVD is used as an activity map that proxies bioactivity: regions undergoing metabolic or structural change are expected to exhibit higher temporal intensity variation than static background or seed coat. This assumption is consistent with prior LSI biospeckle literature and underpins the use of GAVD for visual and metric evaluation [1].
LSI is a non-invasive technique widely used to inspect the quality and safety of food products [3,4]. It enables monitoring of slight changes and measuring activity in biological samples [1]. Moreover, it is used in other fields such as medicine [2]. This technique relies on the analysis of sequential images of the speckle pattern. For this analysis, both graphical and numerical methods well established in the literature are employed [5]. Graphical methods generate an output image from the sequence, which is generally interpreted as an activity map. Numerical methods are adopted when the goal is to measure the level of change in a speckle pattern over time, resulting in a numerical value known as the activity level. They are also based on the creation of an interference pattern produced by light reflected or scattered from a rough surface. This pattern, known as speckle, is statistically random and characterized by intensity variations relative to the mean intensity. The fundamental theory of LSI lies in analyzing these variations to obtain information about the dynamic and structural properties of different objects and tissues [6,7].
The LSI technique can be applied to different fields of science and engineering due to its versatility and the variety of samples it can analyze. In recent years, numerous scientific articles and applications have been published in which objects at both macro and microscopic scales are analyzed by coupling optical systems to microscopes [8,9].
In the medical field, LSI is widely used for non-invasive monitoring of blood flow. This method exploits the changing nature of speckle patterns caused by blood movement in tissues. It is particularly useful for monitoring retinal blood flow and assessing skin microcirculation. Furthermore, it has proven effective in tracking thermally induced changes in blood flow and tumor microvessels, providing crucial data for cancer research and treatment optimization [10,11].
In technological and industrial applications, speckle velocimetry has been used for objective velocity measurements in autonomous vehicles, thus improving autonomous navigation. Additionally, the statistics of dynamic speckle produced by a rotating diffuser have been applied to evaluate paint drying processes, demonstrating the industrial applicability of speckle analysis [12].
In biological and botanical applications, LSI fluctuations have been used as a detection test in holographic measurement of plant motion and growth, allowing detailed study of botanical specimen activities [13]. Several studies have proposed analyzing the physical state of seeds using the biospeckle technique. For example, biospeckle can be used to evaluate fungal infections in stored seeds [14] and damage during seed germination [15]. Seed vigor assessment is a particularly important application, as the biospeckle technique can detect viable or non-viable seeds at an early stage [16,17]. The use of biospeckle in bisected seeds allows detection of areas of high and low seed activity [18]. However, the use of biospeckle to assess seed vigor is still considered a developing technology and shows promise for evaluating how initial water content affects germination [19]. The technique also shows potential for highly accurate seed classification [20]. In this regard, the technique has not yet been adapted to industrial scale and has only been evaluated in a small number of species [21].
The main issues in speckle pattern images can be classified into three categories: saturation, low contrast, and lack of homogeneity. These can be mitigated through digital image processing techniques [22].
Recent advances in general image enhancement have also explored physics-based and learning-based models, such as dehazing-inspired frameworks for low-light conditions [23] and domain adaptation networks for robust low-light enhancement [24], which provide useful insights for improving contrast and preserving structural details in LSI contexts.
Recent deep-learning approaches such as content–style contrastive networks for underwater image enhancement [25] further demonstrate how domain adaptation and style control can improve visibility in challenging imaging conditions.
Beyond seed bioactivity analysis, the proposed methodology has broader applicability in other biological imaging domains such as tissue perfusion [7], plant physiology [13], and biomedical flow monitoring [6]. By improving speckle contrast and preserving dynamic patterns, it provides a generalizable framework for visualizing subtle bio-optical activity across different experimental contexts.
This work presents a methodology to correct and enhance details in the output image of Laser Speckle Imaging using image processing techniques. Although the contrast enhancement algorithms applied have been previously developed, their evaluation in the specific context of dynamic speckle images of seeds represents a relevant and necessary contribution. This work proposes a systematic analysis strategy that combines image processing, visual validation, and statistical analysis, with potential applicability to other experimental configurations.
The main contributions of this work are threefold: (i) it presents a systematic evaluation of classical and morphological contrast enhancement algorithms applied to Laser Speckle Imaging of seeds, (ii) it combines objective metrics and expert visual assessment to validate enhancement performance, and (iii) it establishes a methodological framework adaptable to real-time implementation and future learning-based extensions.

2. Material and Methods

This section describes the methodology applied to evaluate the performance of contrast enhancement algorithms on Laser Speckle Imaging (LSI) data. The study was conducted using dynamic speckle images of seeds, where the enhancement algorithms were applied to intermediate speckle frames obtained during the acquisition process. The evaluation was based on activity maps computed from the processed images, using both objective image quality metrics and visual validation by experts. Throughout this section, the terms image enhancement techniques and contrast enhancement algorithms are used in a complementary manner. The former refers to general processing approaches applied to biospeckle images, whereas the latter specifically denotes the computational implementations evaluated in this study.

2.1. LSI Image Dataset

The hardware used in the experimental setup for biospeckle image acquisition corresponds to the Holmarc HO-ED-INT-15 system, equipped with a He–Ne laser (5 mW, 632.8 nm) as the coherent light source, together with a precision spectral filter that selects this wavelength with a tolerance of ±0.2 nm. The optical configuration includes a polarizer, a spatial filter with a 15 µm pinhole, and lenses with a focal length of 25 mm, as well as a manually adjustable diaphragm with a 1/16 aperture. Additionally, mirrors and an optical bench with a passive vibration-damping system were used to stabilize the setup and minimize optical noise during image acquisition.
Image acquisition was performed using a 5 MP digital camera with a charge-coupled device (CCD) sensor, operated through the OpenCV Python package, enabling real-time visualization and post-processing of the biospeckle patterns. All components were mounted on a 1200 × 900 mm optical table with vibration-isolation support, which minimizes external mechanical disturbances and enhances speckle stability during acquisition.
Figure 1 shows the experimental setup used to obtain laser speckle images. In Figure 1a, a photograph of the actual setup on an anti-vibration optical table is shown, while Figure 1b presents a simplified diagram of the system. This includes the laser illumination source, the sample, a CCD used to capture the images, and a computer responsible for recording and processing the acquired data.
Currently, there is no standardized configuration for Laser Speckle Imaging (LSI) acquisition, leading to the use of various optical setups depending on available resources and components. In this study, the experimental setup was mounted on an anti-vibration optical table to minimize mechanical interference and ensure stability during data acquisition.
Sample illumination was achieved through a spatially filtered laser beam, generated by focusing the beam through a micrometric aperture using a converging lens. This allowed for obtaining a Gaussian intensity profile, reducing illumination irregularities and ensuring uniform excitation of the sample.
Different configurations were tested by varying optical filters and polarizers. The aim was to identify the setup that yields the best results when combined with image enhancement algorithms. Table 1 shows the optical configurations used, whose effects were evaluated through quantitative metrics.
The dataset used in this study consists of 24 data packs, including 20 of Phaseolus vulgaris (SP) and 4 of Lactuca sativa (SL), both seed types selected for their different geometries and sizes. Each data pack contains a dynamic speckle sequence of approximately 500 images, totaling around 12,000 speckle pattern images. The packs were labeled using a code combining the seed identifier with the corresponding experimental configuration. All data packs generated in this work are publicly available for research and validation purposes [26].
Although sufficient for algorithmic evaluation, future datasets will balance species representation and incorporate inter-frame registration to ensure consistent motion estimation and improved comparability across configurations.
Each data pack, denoted as datapack D, is defined as an ordered sequence of images acquired from a specific sample:
D = { I i i { 1 , 2 , , n } } ,
where n represents the total number of images and I i denotes the i-th image in the sequence.
To illustrate the type of information obtained through the dynamic speckle technique, an activity map was generated, corresponding to the output image I G A V D produced by the Graphic Absolute Value of the Differences (GAVD) method. This procedure identifies regions with greater or lesser temporal variation in speckle pattern intensity.
The GAVD method is formally defined as [5]:
I G A V D ( x , y ) = GAVD ( D ) ( x , y ) = 1 n 1 i = 1 n 1 I i ( x , y ) I i + 1 ( x , y ) .
where I G A V D ( x , y ) is the value of pixel ( x , y ) in the output image (activity map) and GAVD ( D ) represents the operation applied to the datapack D.
In this work, I G A V D ( x , y ) is used as an activity map that proxies bioactivity: regions undergoing metabolic or structural change are expected to exhibit higher temporal intensity variation than static background or seed coat. This assumption is consistent with prior LSI biospeckle literature and underpins the use of I G A V D for visual and metric evaluation [5]. In static regions (without activity), the differences are small, and the statistical symmetry of the background is preserved [27]. In contrast, in active regions (metabolism, germination), the intensities fluctuate, the statistical symmetry is broken, and the I G A V D ( x , y ) reflects this breaking as higher values [5].
In Figure 2, a grayscale image sequence corresponding to the P1_F1 experimental configuration is shown (Figure 2a), along with the activity map I G A V D obtained from that sequence (Figure 2b). The values indicated in the color bar are expressed in arbitrary units (a.u.), since no physical calibration of the intensity was performed.
In Figure 3, the background (BG) should not exhibit bright speckle patterns, as it theoretically corresponds to static structures with no surface variations.
In Figure 3a, corresponding to SP, areas of expected activity or intensity can be observed, especially in regions of new tissue growth, such as the radicle and the plumule. In the seed coat, lower activity is expected due to the growth processes involved.
In Figure 3b, corresponding to SL, the background (BG) again shows low intensity, while regions covered by the seed coat present minimal intensity. In contrast, the new growth areas, referred to as the plumule, exhibit the highest expected biological activity and intensity.
Across the figures, the optical configuration and data flow are represented schematically, and the regions of interest (ROI), corresponding to the radicle, plumule, and background, are indicated and discussed in the text for biological interpretation.

2.2. Image Enhancement Techniques

Histogram-based algorithms are very popular. A classical algorithm is Histogram Equalization (HE) [28], which is easy to implement and improves overall contrast [29,30], and is also used as preprocessing in recognition systems [31]. Another well-known algorithm is Contrast-Limited Adaptive Histogram Equalization (CLAHE) [32], which performs local enhancements on different types of images.
In [33], contrast enhancement algorithms such as CLAHE were applied to ultrasound speckle images to improve the accuracy of the speckle image velocimetry (SIV) measurement method. They concluded that combining the SIV method with a contrast enhancement algorithm allows for the quantification of instantaneous information on the velocity field of blood flow without introducing exogenous tracers. Furthermore, the use of enhancement techniques minimizes errors found in ultrasound SIV measurement.
In [34], the resolution of speckle images acquired with mobile phone cameras was improved using contrast enhancement techniques. They proposed a combination of two-dimensional discrete wavelet transform, image interpolation, and a morphological operation to improve speckle image resolution and enhance blood flow image visualization.
There are also algorithms based on mathematical morphology. These are relatively recent and have proven to be efficient for improving the visual quality of different types of images [35,36], enhancing contrast [37,38,39,40,41], removing noise from images [42,43], among other applications [44,45,46,47].
The image enhancement algorithms used in this work were: HE, CLAHE, Multiscale Morphological Contrast Enhancement (MMCE) [39], and the Multiscale Top-Hat Transform with OCCO filter (OCCO-MTH) [41].
The selection of CLAHE, HE, MMCE, and OCCO-MTH was based on their relevance and complementarity for contrast enhancement in laser speckle images. CLAHE and HE are histogram-based techniques: HE performs a global equalization of the entire image, while CLAHE applies adaptive equalization at a local level, enabling contrast enhancement in specific regions and reducing noise over-amplification. On the other hand, MMCE and OCCO-MTH are morphological methods that allow fine detail enhancement while preserving relevant structures in speckle images. This combination enables evaluating the performance of traditional histogram-based approaches and morphological approaches in the same experimental dataset, identifying strengths and limitations of each according to different image quality metrics.
The algorithms were developed using Python 3.7 and OpenCV 4.5.0, and executed on a laptop with Windows 10 Home, an Intel Core i7 8750 h processor, 16 GB RAM, and an Nvidia GTX 1060 M GPU. The parameters used in each algorithm were empirically selected based on prior literature and visual optimization tests. For CLAHE, a tile size of [ 8 × 8 ] and a clip limit of 2.5 were employed to enhance local contrast while minimizing over-amplification. MMCE used an initial square structuring element of 3 × 3 pixels with n = 3 iterations, balancing edge preservation and detail enhancement. OCCO-MTH was applied with the same structuring element and iteration count, and a contrast adjustment weight of ω = 1 , ensuring consistency across morphological operations.
The novelty of this work lies in the systematic and comparative application of these enhancement algorithms at the frame-by-frame level prior to GAVD computation. This configuration enables quantitative evaluation of the impact of contrast enhancement on dynamic activity mapping, which, to our knowledge, has not been previously reported in LSI biospeckle analysis.

2.3. Applied Methodology

The methodology consists of the following steps: given a datapack (D), for each image ( I i ) in the pack, a computational implementation of contrast enhancement ( A M ) is applied; then, the GAVD graphical method is applied to the set of modified images to finally obtain the activity map ( I G A V D ). A general scheme of the procedure is shown in Algorithm 1 (The dataset used in this study is available at https://zenodo.org/records/10976513, accessed on 13 September 2025, while the source code and implementation scripts are available at https://github.com/Joel132/contrast-improvement-biospecke-images, accessed on 13 September 2025).
Algorithm 1 Methodology for Laser Speckle Image Processing.
Require: 
Data pack D = { I 1 , I 2 , , I n } , Enhancement Algorithm A M
Ensure: 
Resulting activity map image I G A V D
  1:
Initialize list of enhanced images D
  2:
for each image I i in D do
  3:
    Apply enhancement algorithm: I i A M ( I i )
  4:
    Add I i to D
  5:
end for
  6:
Compute activity map: I G A V D GAVD ( D )
  7:
return  I G A V D
To further improve robustness, future implementations can include optional background masking and inter-frame alignment modules. These additions would minimize motion-induced artifacts and ensure that temporal variations in GAVD truly represent biological activity rather than acquisition drift.
The specific computational implementation used for contrast enhancement, denoted A M , was applied individually to each image in the sequence to investigate its effect on the Graphic AVD method. In this way, it emulates capturing each image with higher-quality hardware.
Applying contrast enhancement to each image before computing the activity map allows simulating improvements in the image acquisition hardware and preserving subtle dynamic variations that might otherwise be lost. This approach ensures that the benefits of enhancement propagate appropriately during GAVD computation.
The adopted methodology does not focus on developing new algorithms but on critically evaluating existing techniques to improve the sensitivity of dynamic analysis using GAVD. This approach allows comparing practical alternatives from a concrete and reproducible experimental perspective.
Although this study compares four algorithms, the proposed framework can be easily extended to other enhancement techniques, allowing systematic cross-method evaluation under unified metrics.

2.4. Evaluation Metrics

Six metrics were used to objectively evaluate the results; these image processing metrics were applied to the images I G A V D :
  • Contrast (C) [48], provides the overall contrast of the output laser speckle image. It is defined as:
    C ( I ) = u = 0 M 1 v = 0 N 1 ( B M ( I ) I ( u , v ) ) 2 M × N ,
    where M × N are the dimensions of the image I, I ( u , v ) is the grayscale intensity at pixel ( u , v ) , and B M ( I ) is the mean brightness of the image, given by:
    B M ( I ) = k = 0 L 1 p ( k ) × k ,
    where L is the number of grayscale levels (256 in this case) and p ( k ) is the probability of occurrence of level k in the image. The contrast value of the resulting image must be higher than that of the original image to be considered an improvement.
  • Entropy (E) [37,49], measures the richness of detail in the resulting image:
    E ( I ) = k = 0 L 1 p ( k ) l o g 2 ( p ( k ) ) .
    Higher entropy indicates greater richness of detail.
  • Structural Similarity Index (SSIM) [50], measures structural similarity between two images. Calculated in blocks, given two image windows I u and T v , SSIM is expressed as:
    SSIM ( I u , T v ) = ( 2 μ I u μ T v + C 1 ) ( 2 σ I u T v + C 2 ) ( μ I u 2 + μ T v 2 + C 1 ) ( σ I u 2 + σ T v 2 + C 2 ) , SSIM [ 0 , 1 ] ,
    where μ I u and μ T v are average intensities, σ I u 2 and σ T v 2 are intensity variances, σ I u T v is covariance, and C 1 = K 1 L 2 , C 2 = K 2 L 2 are constants for stabilization.
  • Contrast Improvement Ratio (CIR) [49,51], measures local contrast improvement in the processed image:
    CIR ( I , I E ) = ( u , v ) D | w ( u , v ) w ˜ ( u , v ) | 2 ( u , v ) D w ( u , v ) 2 ,
    where w is local contrast of the original image I, w ˜ is local contrast of the enhanced image I E , and D is the domain. w is defined as:
    ω ( u , v ) = | ρ ι | | ρ + ι | ,
    where ρ is the central pixel and ι is the mean of its 3 × 3 neighborhood.
  • Spatial Frequency (SF) [49,52], quantifies spatial detail in the image:
    SF ( I ) = RF ( I ) 2 + CF ( I ) 2 ,
    where:
    RF ( I ) = 1 M × N u = 1 M 1 v = 0 N 1 ( I ( u , v ) I ( u 1 , v ) ) 2 ,
    CF ( I ) = 1 M × N u = 0 M 1 v = 1 N 1 ( I ( u , v ) I ( u , v 1 ) ) 2 .
  • Peak Signal-to-Noise Ratio (PSNR) [39,53], quantifies distortion introduced during enhancement:
    PSNR ( I , I E ) = 10 × l o g 10 ( L 1 ) 2 MSE ( I , I E ) ,
    where the mean squared error (MSE) is:
    MSE ( I , I E ) = 1 M × N u = 0 M 1 v = 0 N 1 ( I ( u , v ) I E ( u , v ) ) 2 .
The selected metrics were chosen to quantify both perceptual and structural improvements directly associated with the detection of biological activity. Contrast and entropy highlight the visibility of active regions; SSIM and PSNR measure structural fidelity to preserve speckle dynamics; while SF and CIR assess the spatial sharpness and local contrast essential for distinguishing active versus static areas. Together, these metrics support the objective of improving LSI-based bioactivity visualization without altering acquisition hardware.
Additional metrics such as the Contrast-to-Noise Ratio (CNR) for active versus background regions and task-level indicators (e.g., ROC-AUC or PR-AUC) can be integrated in future analyses to better quantify discriminative capability.

2.5. Visual Validation and Perspective

The goal of the visual validation is to evaluate how enhancement algorithms affect the output images of dynamic speckle from a specialist’s perspective. For this purpose, 24 datapacks were collected and processed using HE, CLAHE, MMCE, and OCCO-MTH. The output images of each technique for each datapack were presented to a group of three specialists for qualitative evaluation. The processed images were evaluated against the original output images of the datapacks. For each processed image, a score was assigned according to the following scale: 0 (worse than the original), 1 (no variation), and 2 (better than the original). Therefore, 4 algorithms were applied to 24 output images, yielding a total of 96 images evaluated per specialist. Finally, the average was calculated to obtain a single result per datapack for each algorithm.
We clarified how the chosen image quality metrics relate to bioactivity detection. Specifically, in biospeckle analysis, contrast and entropy are linked to the visibility of dynamic regions, which in turn are proxies for bioactivity. Higher contrast-to-background ratios and entropy values in I G A V D maps can improve the discernibility of metabolically active areas (e.g., radicle or plumule) without amplifying static background artifacts [2,18]. Evaluators were instructed to focus on whether biologically active regions (e.g., radicle/plumule) became more discernible in I G A V D without artificial amplification of the static background, consistent with the expected dynamics of biospeckle
Although the number of evaluators was limited to three and a simple three-point scale was used, the consistency and statistical significance of the results were later validated using non-parametric tests (Friedman, Aligned Friedman, and Quade), as described in the following section. This reinforces the reliability of the visual evaluation results.

3. Results and Discussion

In order to validate the proposed methodology, two main objectives were established:
  • Quantify the performance of the proposed methodology in terms of improving the activity map images generated by the GAVD method, based on the application of different contrast enhancement algorithms. To quantify the numerical results obtained, six objective metrics were applied to the output images I G A V D .
  • Analyze the visual impact of the contrast enhancement algorithms. This analysis was carried out through a visual evaluation conducted by specialists, who examined a representative sample of the obtained results.

3.1. Numerical Results

According to the methodology described in Section 2.3, quantitative metrics were calculated on the I G A V D images resulting from applying the GAVD graphical method to each set of images previously enhanced with different contrast enhancement algorithms. This procedure makes it possible to evaluate the impact of enhancement on the final result of dynamic analysis.
Quantitative evaluation was performed on a total of 24 laser speckle images processed with each of the algorithms. Table 2 presents the average values of six metrics: contrast, entropy, spatial frequency (SF), structural similarity index (SSIM), peak signal-to-noise ratio (PSNR), and contrast improvement ratio (CIR).
The row corresponding to the original image (Original) serves as a reference for interpreting the enhancement effects produced by each algorithm. SSIM, PSNR, and CIR metrics are not computed for the original image, as they are based on comparisons with itself.
Based on Table 2, the following can be inferred:
  • The CLAHE algorithm showed the best performance in terms of overall contrast and detail richness, reaching the highest values of 36.88 for contrast and 6.12 for entropy.
  • The MMCE algorithm stood out for its ability to preserve spatial information and improve local contrast. This is reflected in its highest values for SF (12.44) and CIR (0.640). Although MMCE improved certain aspects of image contrast, it also tended to amplify background noise, which may hinder the identification of subtle bioactivity patterns. This effect suggests that future work could explore background suppression techniques or region-specific contrast control strategies to mitigate such artifacts while preserving relevant speckle structures.
  • The OCCO-MTH algorithm achieved the best results in terms of structural similarity preservation and lowest introduced distortion, with the highest SSIM value (0.906) and highest PSNR (30.71) among the analyzed methods.
  • The original image, without enhancement techniques applied, showed a contrast value of 29.51 and an entropy of 5.76, serving as a reference to evaluate the effects generated by the algorithms. SSIM, PSNR, and CIR metrics were not computed for this condition, as they are based on comparisons with the original image.
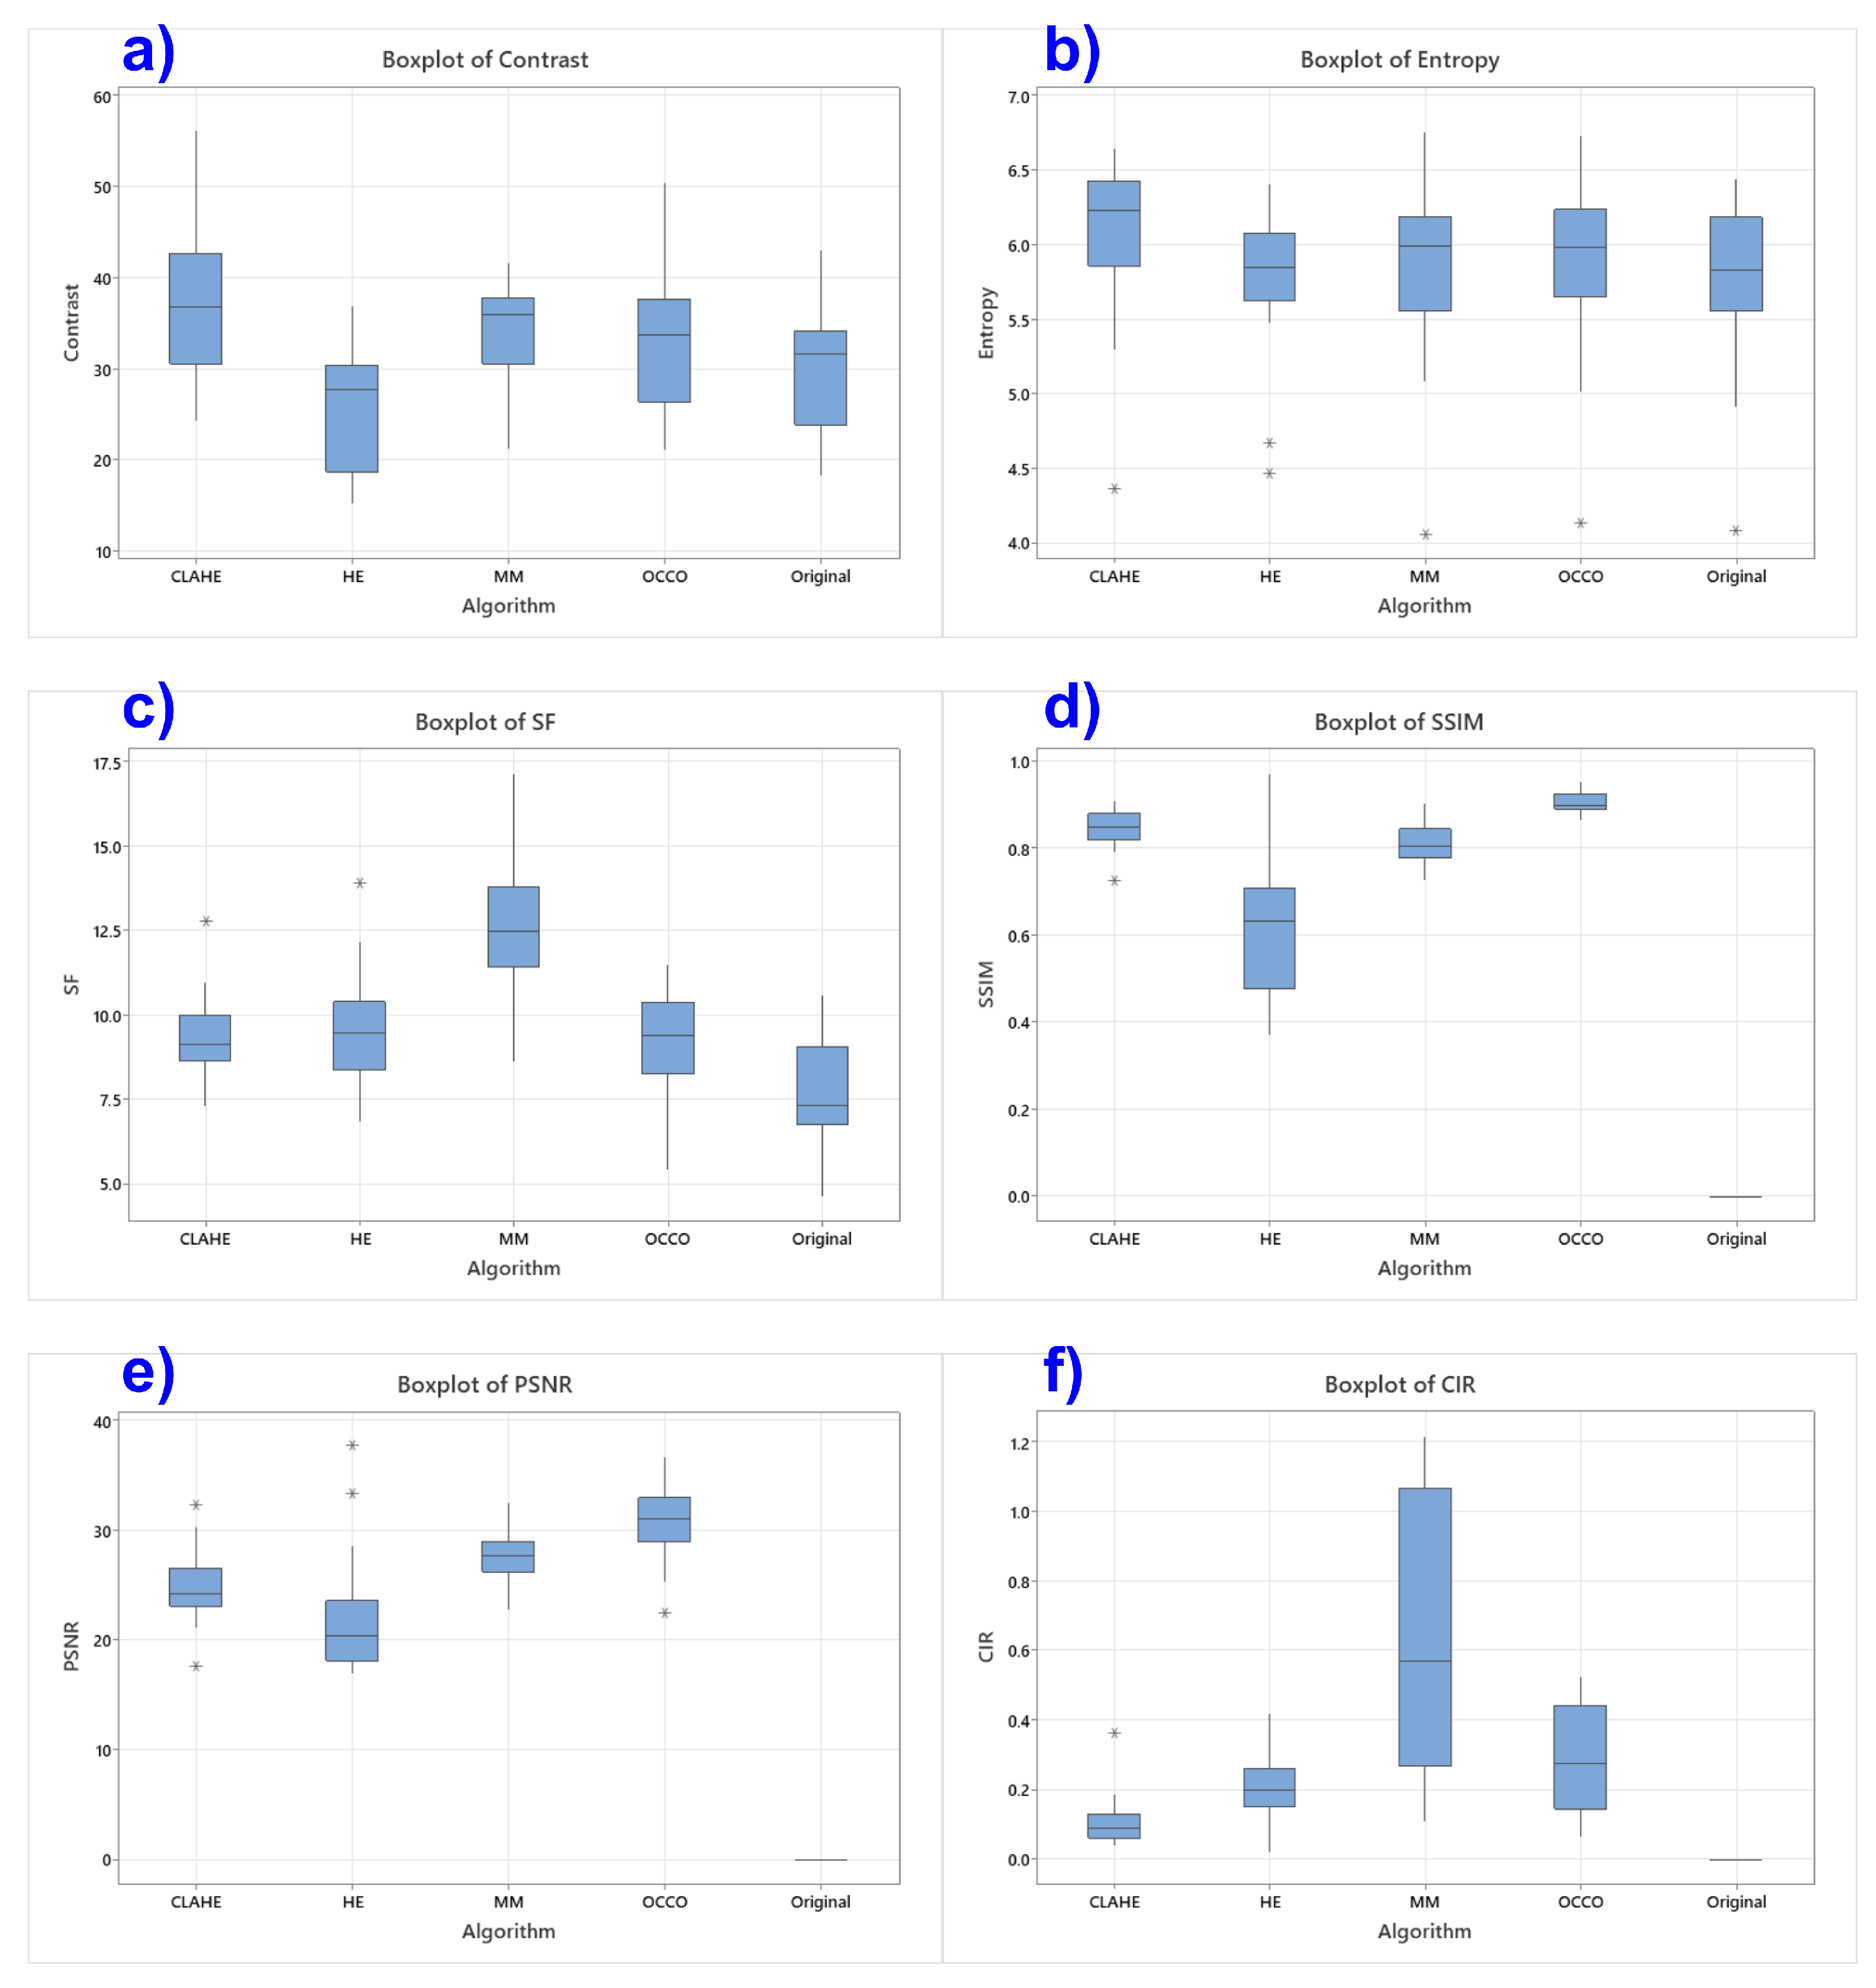
Figure 4 shows the boxplots for the evaluated metrics. The overall Contrast and Entropy metrics present similar dispersion among all methods, suggesting relatively uniform behavior in terms of detail richness and tonal variability (Figure 4a,b).
The SF metric shows greater dispersion for MMCE, with a slight advantage over the other algorithms, reinforcing its ability to highlight spatial details in processed images (Figure 4c).
In the case of SSIM, the MMCE, OCCO-MTH, and CLAHE algorithms present consistently high values with little dispersion, indicating good structural preservation in most cases. In contrast, HE shows lower values, suggesting less ability to preserve original structures in some images (Figure 4d).
Regarding PSNR, the observed values indicate that HE tends to introduce more distortion compared to the original image than the other methods (Figure 4e).
Finally, the CIR metric, morphological algorithms, especially MMCE, show greater dispersion, indicating that in several cases they achieve significant local contrast improvements, albeit with higher variability between images (Figure 4f).

3.2. Visual Analysis

3.2.1. Statistical Analysis

The sample statistic was the mean of the visual evaluations of the four algorithms, plus the original image I, which represents an ideal method that does not modify the image. The normality test (Shapiro-Wilk) and the equality of variance test (Levene) were statistically significant ( p < 0.05 in both cases), confirming that a parametric test could not be applied. In view of this, the non-parametric Friedman, Aligned Friedman, and Quade tests were used to verify that there is a significant difference between the medians of the samples. The statistical analysis was performed using a tool developed in [54].
Given the current sample size, non-parametric tests were selected. Future studies with larger datasets will include effect size estimation (e.g., Kendall’s W), multiple-comparison correction (BH-FDR), and inter-rater agreement measures (Fleiss’ κ ) to ensure statistical robustness.
The Friedman, Aligned Friedman, and Quade tests were all statistically significant ( p < 0.05 ). Table 3 shows that only CLAHE and MMCE obtained statistically significant values compared to the original images. Therefore, it is concluded that both MMCE and CLAHE significantly improve the original image.

3.2.2. Visual Evaluation

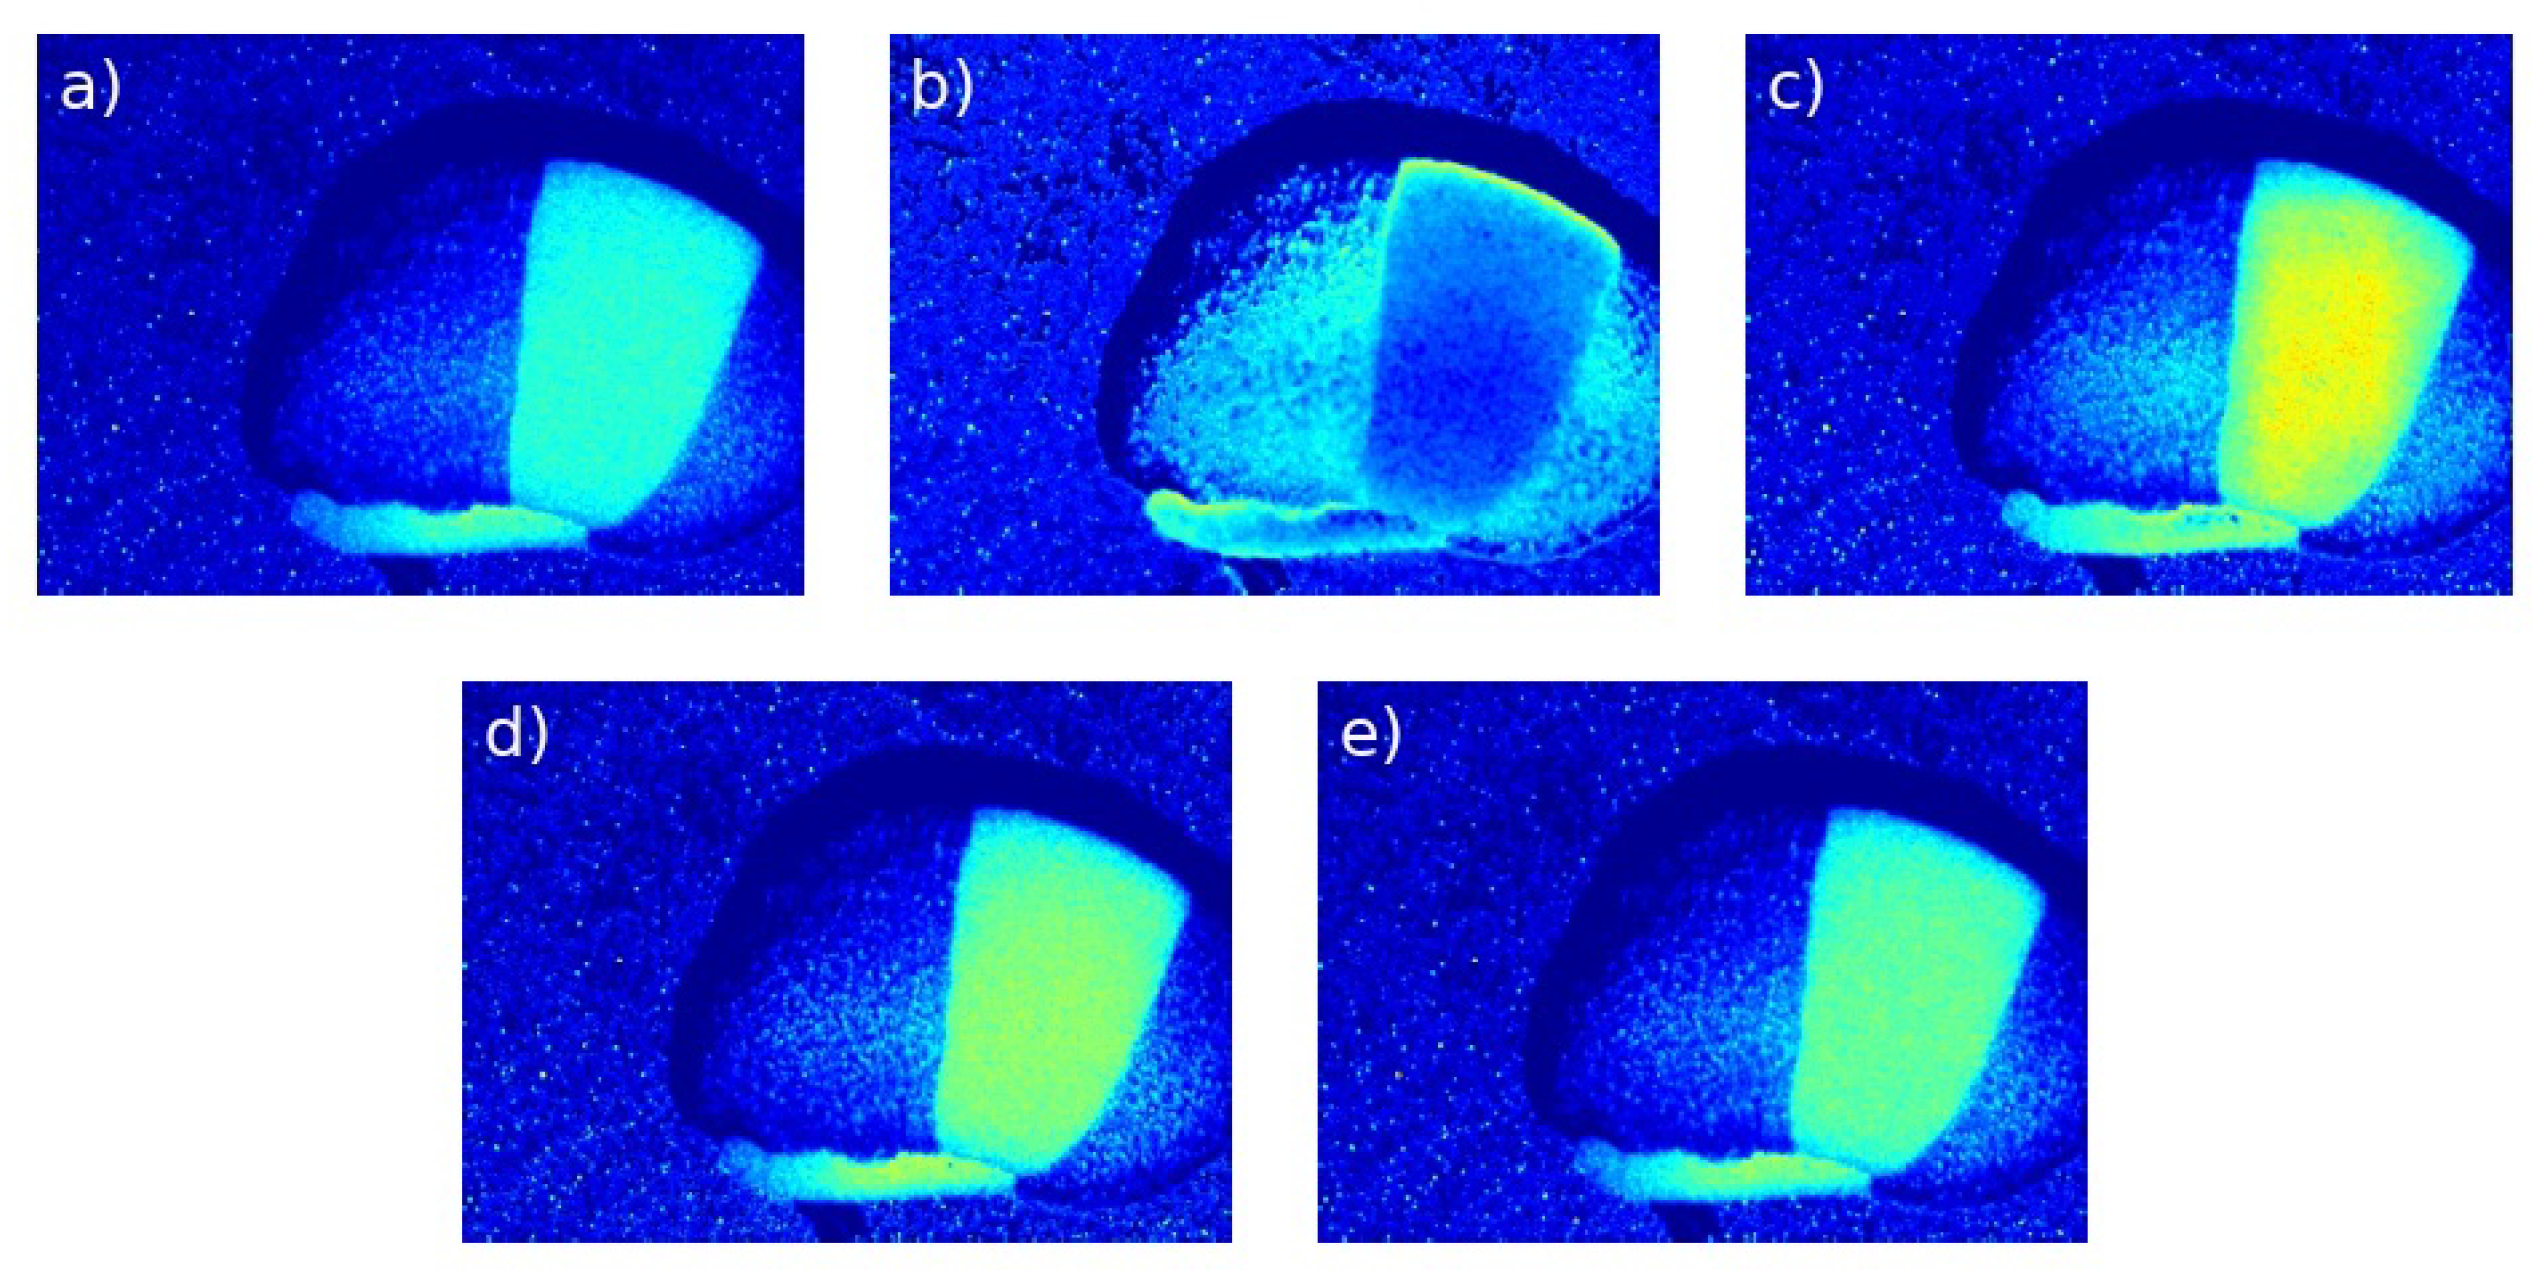
Figure 5 and Figure 6 show examples of activity maps I G A V D obtained for SP and SL images. These maps correspond to the final output of the process described in the Section 2, in which the contrast enhancement algorithms were previously applied to the intermediate images.
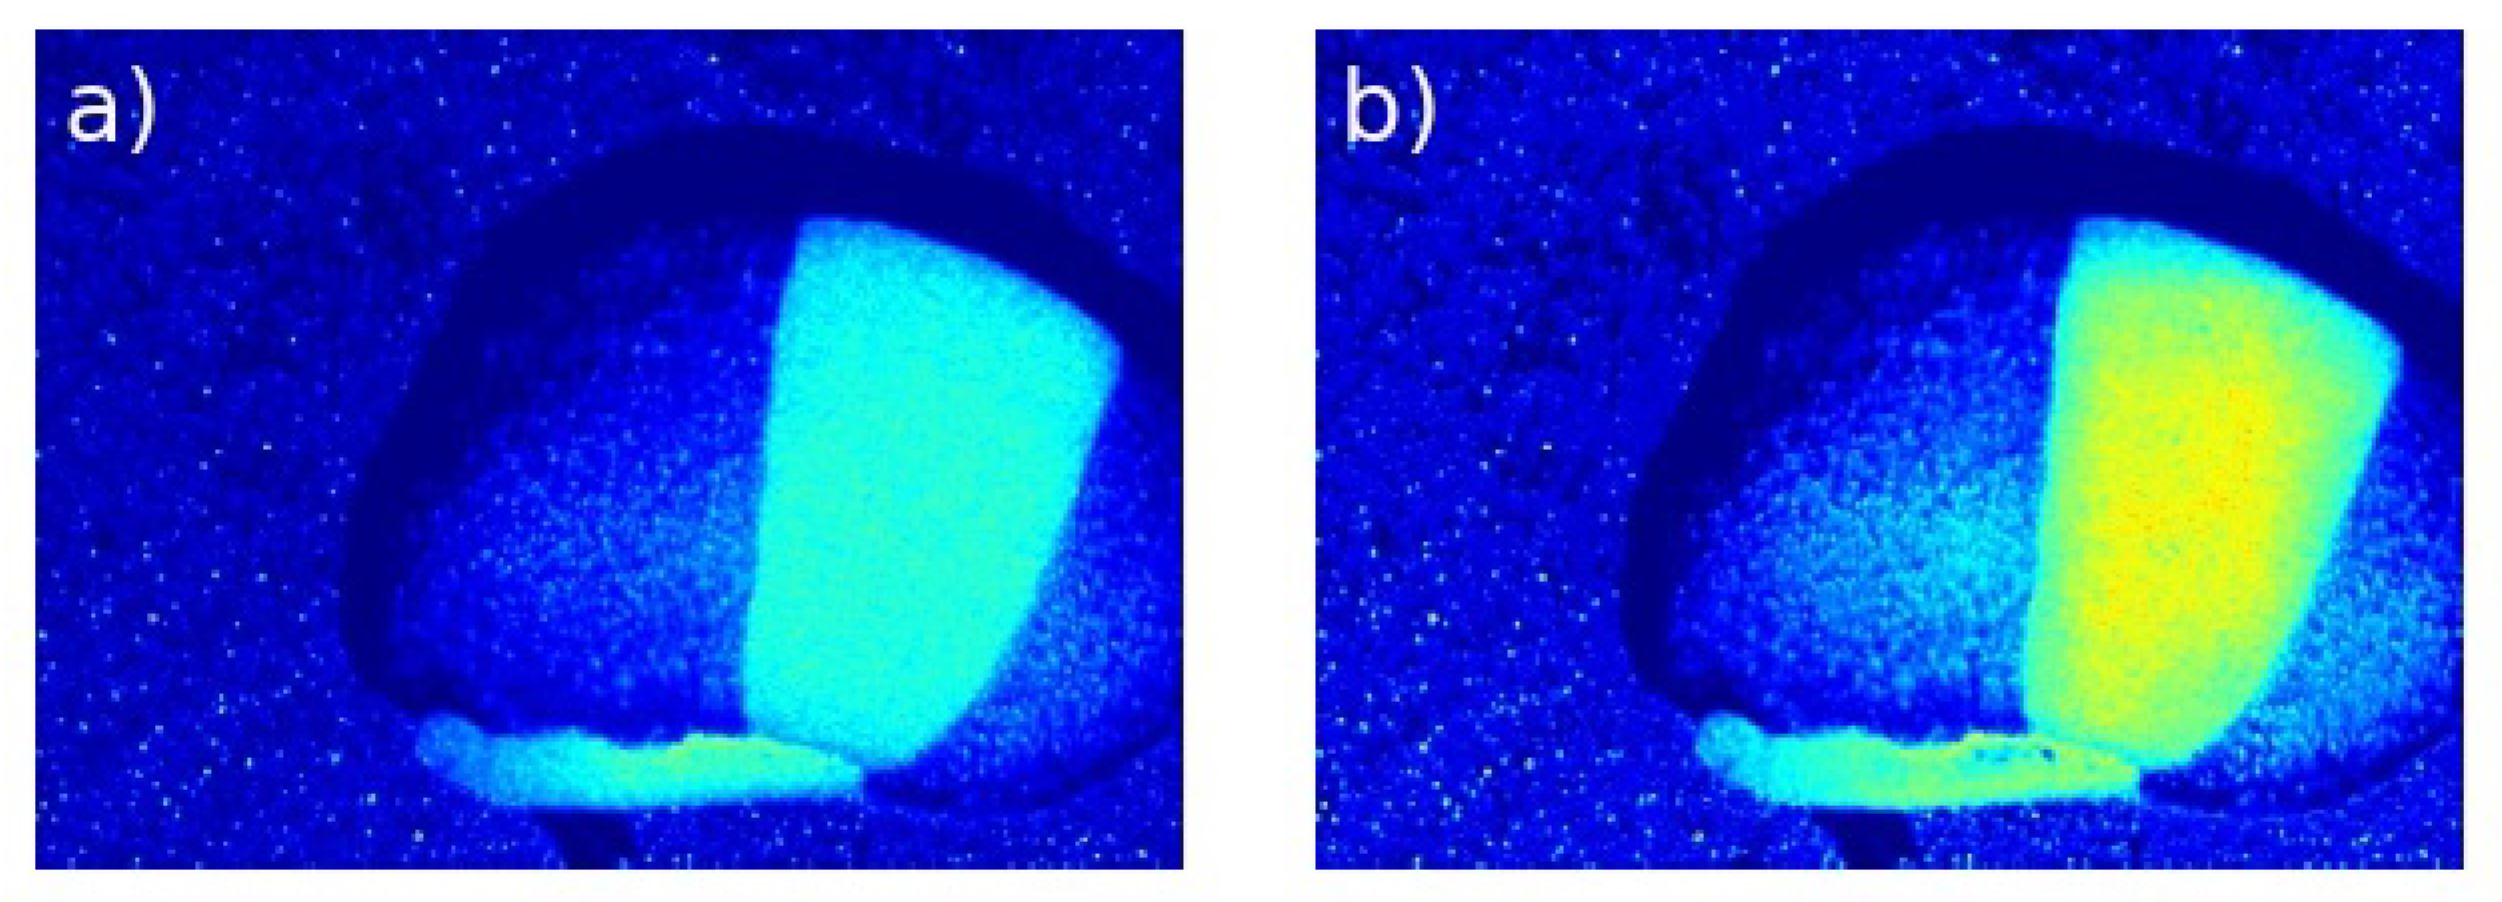
Figure 7 shows an SP image processed with the CLAHE algorithm, one of the two methods (along with MMCE) that, according to statistical analysis, showed significant improvements over the original image. The active region is reflected with good contrast, maintaining its shape unaltered compared to the original. In the background, average intensities remain uniform.
Figure 8 shows an SL image processed with the MMCE algorithm. This sample, unlike SP, has a more distant capture, resulting in smaller grain size. As in the previous case, the active region is more visible and with better contrast, while the inactive part preserves the original image’s intensity. In the background, noise is amplified and less intense grains become visible, especially in the central region.

3.2.3. Computational Efficiency and Practical Implications

The evaluated algorithms exhibited efficient execution using conventional computing resources, demonstrating that the proposed methodology can be applied without the need for specialized hardware. Although morphological approaches such as MMCE and OCCO-MTH required slightly longer processing times due to their multiscale operations, all methods remain suitable for offline and near-real-time analysis. This efficiency reinforces the feasibility of integrating the framework into low-cost LSI systems for automated seed viability and bioactivity monitoring. Future benchmarking will include quantitative timing (ms per frame) across CPU/GPU configurations.

4. Conclusions

This work evaluated and compared several contrast enhancement algorithms applied frame by frame to intermediate images obtained via the Laser Speckle Imaging (LSI) technique, prior to computing activity maps ( I G A V D ) using the Graphic Absolute Value of Differences (GAVD) method. The enhancement methods analyzed included HE, CLAHE, MMCE, and OCCO-MTH, using the original image as reference. From the enhanced frames, the corresponding I G A V D activity maps were generated and assessed through both objective metrics and expert visual evaluation. I G A V D was employed as a proxy for bioactivity under the assumption supported by biospeckle literature that regions undergoing metabolic or structural changes exhibit higher temporal intensity variation than static background or seed coat. Objective metric results showed that:
  • CLAHE achieved the highest global contrast and entropy, improving the visibility of biologically active regions.
  • MMCE excelled in local contrast and edge enhancement, improving the definition of active regions in I G A V D .
  • OCCO-MTH provided the best structural preservation and lowest distortion, maintaining the underlying speckle pattern.
Non-parametric statistical analysis of expert visual evaluations ( p < 0.05 ) identified CLAHE and MMCE as the only methods that significantly enhanced the perception of active regions in the original I G A V D without introducing background artifacts.
Although no new algorithms were proposed, the results indicate that appropriate selection and implementation of enhancement methods can markedly improve the detection of subtle dynamic patterns in speckle-based activity maps, optimizing interpretation without altering acquisition hardware.
Overall, the findings highlight the methodological value of applying suitable contrast enhancement techniques to Laser Speckle Imaging for improving bioactivity interpretation. The proposed framework contributes to more reliable visualization of dynamic patterns and establishes a foundation for subsequent advances in quantitative biospeckle analysis.

5. Limitations and Future Work

Although this study provides a systematic evaluation of classical and morphological enhancement algorithms for Laser Speckle Imaging, it presents certain limitations. The experimental validation was limited to two species (Phaseolus vulgaris and Lactuca sativa) under controlled laboratory conditions, which may restrict the generalization of the results.
Future work will focus on expanding the analysis to a broader range of biological samples and acquisition setups, incorporating temporal speckle statistics and adaptive learning-based methods to optimize enhancement dynamically. Future experiments will explore alternative pipelines such as post-enhancement after GAVD and background-masked MMCE to quantify how the enhancement stage influences bioactivity sensitivity. Future work will also integrate biological endpoints (e.g., germination and vigor) to directly correlate enhanced activity indices with biological performance. Subsequent research will correlate IGAVD metrics (e.g., CNR median, IGAVD95) with germination and vigor indices to establish a biological bridge. Moreover, a decision matrix based on computational cost and enhancement performance will be developed to guide algorithm selection for specific applications. Additionally, computational efficiency and real-time applicability will be investigated to enable integration of this methodology into low-cost systems for automated seed viability assessment and plant physiology monitoring.

Author Contributions

Conceptualization, E.Z.H.; methodology, E.Z.H.; software, J.F. and J.P.; validation, G.E.M.M., J.A.J.A., M.F.; formal analysis, J.F. and J.P.; investigation, J.F. and J.P.; resources, E.Z.H. and J.C.M.-R.; data curation, J.F., J.P. and G.E.M.M.; writing—original draft preparation, J.F., J.P., E.Z.H., J.C.M.-R.; writing—review and editing, E.Z.H., F.M., M.G.-T., J.L.V.N., H.L.-A., P.P.-E., S.G. and J.C.M.-R.; visualization, G.E.M.M., J.A.J.A., M.F., E.Z.H., M.G.-T., J.L.V.N., H.L.-A., P.P.-E., S.G. and J.C.M.-R.; supervision, J.C.M.-R.; project administration, J.C.M.-R.; funding acquisition, J.C.M.-R. All authors have read and agreed to the published version of the manuscript.

Funding

This research was funded by the CONACYT, Paraguay, under project Grant PINV01-910.

Data Availability Statement

The data is available at [26].

Acknowledgments

During the preparation of this work, the authors used the Grammarly tool to correct spelling errors and improve writing clarity. After using this tool, the authors reviewed and edited the content as needed and take full responsibility for the final version of the publication.

Conflicts of Interest

The authors declare no conflict of interest.

References

  1. Rabal, H.; Braga, R. Dynamic Laser Speckle and Applications; CRC Press: Boca Raton, FL, USA, 2008. [Google Scholar] [CrossRef]
  2. Zdunek, A.; Adamiak, A.; Pieczywek, P.M.; Kurenda, A. The biospeckle method for the investigation of agricultural crops: A review. Opt. Lasers Eng. 2014, 52, 276–285. [Google Scholar] [CrossRef]
  3. Ali, M.M.; Hashim, N.; Aziz, S.A.; Lasekan, O. Emerging non-destructive thermal imaging technique coupled with chemometrics on quality and safety inspection in food and agriculture. Trends Food Sci. Technol. 2020, 105, 176–185. [Google Scholar] [CrossRef]
  4. Pandiselvam, R.; Mayookha, V.; Kothakota, A.; Ramesh, S.; Thirumdas, R.; Juvvi, P. Biospeckle laser technique—A novel non-destructive approach for food quality and safety detection. Trends Food Sci. Technol. 2020, 97, 1–13. [Google Scholar] [CrossRef]
  5. Pujaico, F.; Braga, R.; Moreira, J. A Practical Guide to Biospeckle Laser Analysis: Theory and Software; Editora UFLA: Lavras, Brazil, 2016. [Google Scholar]
  6. Briers, D.; Duncan, D.D.; Hirst, E.; Kirkpatrick, S.J.; Larsson, M.; Steenbergen, W.; Stromberg, T.; Thompson, O.B. Laser speckle contrast imaging: Theoretical and practical limitations. J. Biomed. Opt. 2013, 18, 066018. [Google Scholar] [CrossRef]
  7. Heeman, W.; Steenbergen, W.; van Dam, G.M.; Boerma, E.C. Clinical applications of laser speckle contrast imaging: A review. J. Biomed. Opt. 2019, 24, 080901. [Google Scholar] [CrossRef]
  8. Shimizu, M.; Sawano, H.; Yoshioka, H.; Shinno, H. Multi-dimensional assessment of nano/micro scale surface texture using laser speckle pattern analysis. J. Adv. Mech. Des. Syst. Manuf. 2015, 9, JAMDSM0011. [Google Scholar] [CrossRef]
  9. Lee, B.; Sosnovtseva, O.; Sørensen, C.M.; Postnov, D.D. Multi-scale laser speckle contrast imaging of microcirculatory vasoreactivity. Biomed. Opt. Express 2022, 13, 2312–2322. [Google Scholar] [CrossRef]
  10. Konovalov, A.; Gadzhiagaev, V.; Grebenev, F.; Stavtsev, D.; Piavchenko, G.; Gerasimenko, A.; Telyshev, D.; Meglinski, I.; Eliava, S. Laser speckle contrast imaging in neurosurgery: A systematic review. World Neurosurg. 2023, 171, 35–40. [Google Scholar] [CrossRef] [PubMed]
  11. Golubova, N.; Potapova, E.; Seryogina, E.; Dremin, V. Time–frequency analysis of laser speckle contrast for transcranial assessment of cerebral blood flow. Biomed. Signal Process. Control 2023, 85, 104969. [Google Scholar] [CrossRef]
  12. Kumar, N.; Nirala, A. A novel computational method for dynamic laser speckle and its application to analyze water activity during photosynthesis in papaya leaf. Optik 2023, 274, 170518. [Google Scholar] [CrossRef]
  13. Xu, Z.; Joenathan, C.; Khorana, B.M. Temporal and spatial properties of the time-varying speckles of botanical specimens. Opt. Eng. 1995, 34, 1487–1502. [Google Scholar] [CrossRef]
  14. Singh, P.; Chatterjee, A.; Rajput, L.S.; Rana, S.; Kumar, S.; Nataraj, V.; Bhatia, V.; Prakash, S. Development of an intelligent laser biospeckle system for early detection and classification of soybean seeds infected with seed-borne fungal pathogen (Colletotrichum truncatum). Biosyst. Eng. 2021, 212, 442–457. [Google Scholar] [CrossRef]
  15. Sutton, D.B.; Punja, Z.K. Investigating biospeckle laser analysis as a diagnostic method to assess sprouting damage in wheat seeds. Comput. Electron. Agric. 2017, 141, 238–247. [Google Scholar] [CrossRef]
  16. Singh, P.; Chatterjee, A.; Bhatia, V.; Prakash, S. Application of laser biospeckle analysis for assessment of seed priming treatments. Comput. Electron. Agric. 2020, 169, 105212. [Google Scholar] [CrossRef]
  17. Braga, R.A.; Dal Fabbro, I.M.; Borem, F.M.; Rabelo, G.; Arizaga, R.; Rabal, H.J.; Trivi, M. Assessment of seed viability by laser speckle techniques. Biosyst. Eng. 2003, 86, 287–294. [Google Scholar] [CrossRef]
  18. Passoni, I.; Dai Pra, A.; Rabal, H.; Trivi, M.; Arizaga, R. Dynamic speckle processing using wavelets based entropy. Opt. Commun. 2005, 246, 219–228. [Google Scholar] [CrossRef]
  19. Xing, M.; Long, Y.; Wang, Q.; Tian, X.; Fan, S.; Zhang, C.; Huang, W. Physiological alterations and nondestructive test methods of crop seed vigor: A comprehensive review. Agriculture 2023, 13, 527. [Google Scholar] [CrossRef]
  20. Thakur, P.S.; Tiwari, B.; Kumar, A.; Gedam, B.; Bhatia, V.; Krejcar, O.; Dobrovolny, M.; Nebhen, J.; Prakash, S. Deep transfer learning based photonics sensor for assessment of seed-quality. Comput. Electron. Agric. 2022, 196, 106891. [Google Scholar] [CrossRef]
  21. Braga, R.A., Jr.; Contado, J.L.; Ducatti, K.R.; da Silva, E.A.A. Analysis of Seed Vigor Using the Biospeckle Laser Technique. AgriEngineering 2024, 7, 3. [Google Scholar] [CrossRef]
  22. Zhu, J.; Cai, J.; Sun, B.; Xu, Y.; Lu, F.; Ma, H. Inspection and classification of wheat quality using image processing. Qual. Assur. Saf. Crop. Foods 2023, 15, 43–54. [Google Scholar] [CrossRef]
  23. Wang, W.; Yin, B.; Li, L.; Li, L.; Liu, H. A Low Light Image Enhancement Method Based on Dehazing Physical Model. Comput. Model. Eng. Sci. (CMES) 2025, 143, 1595–1616. [Google Scholar] [CrossRef]
  24. Wang, J.; He, Y.; Li, K.; Li, S.; Zhao, L.; Yin, J.; Zhang, M.; Shi, T.; Wang, X. MDANet: A multi-stage domain adaptation framework for generalizable low-light image enhancement. Neurocomputing 2025, 627, 129572. [Google Scholar] [CrossRef]
  25. Wang, Z.; Tao, H.; Zhou, H.; Deng, Y.; Zhou, P. A content-style control network with style contrastive learning for underwater image enhancement. Multimed. Syst. 2025, 31, 60. [Google Scholar] [CrossRef]
  26. Herrera, E.Z.; Mereles Menesse, G.E.; Mello Román, J.C.; Vazquez Noguera, J.L.; Méndez Gaona, F.J. Biospeckle Images Dataset—SEEDS; Zenodo: Geneva, Switzerland, 2024. [Google Scholar] [CrossRef]
  27. Goodman, J.W. Speckle Phenomena in Optics: Theory and Applications; Roberts and Company Publishers: Greenwood Village, CO, USA, 2007. [Google Scholar]
  28. Gonzalez, R.C.; Woods, R.E. Intensity Transformations and Spatial Filtering. In Digital Image Processing; Pearson: London, UK, 2018. [Google Scholar]
  29. Menotti, D.; Najman, L.; Facon, J.; Araujo, A.D.A. Multi-Histogram Equalization Methods for Contrast Enhancement and Brightness Preserving. IEEE Trans. Consum. Electron. 2007, 53, 1186–1194. [Google Scholar] [CrossRef]
  30. Brizuela Pineda, I.A.; Medina Caballero, R.D.; Cáceres Silva, J.J.; Mello Román, J.C.; Vázquez Noguera, J.L. Quadri-histogram equalization using cutoff limits based on the size of each histogram with preservation of average brightness. Signal Image Video Process. 2019, 13, 843–851. [Google Scholar] [CrossRef]
  31. Chatterjee, A.; Bhatia, V.; Prakash, S. Anti-spoof touchless 3D fingerprint recognition system using single shot fringe projection and biospeckle analysis. Opt. Lasers Eng. 2017, 95, 1–7. [Google Scholar] [CrossRef]
  32. Zuiderveld, K. Contrast Limited Adaptive Histogram Equalization. In Graphics Gems; Elsevier: Amsterdam, The Netherlands, 1994; pp. 474–485. [Google Scholar] [CrossRef]
  33. Yeom, E.; Nam, K.H.; Paeng, D.G.; Lee, S.J. Improvement of ultrasound speckle image velocimetry using image enhancement techniques. Ultrasonics 2014, 54, 205–216. [Google Scholar] [CrossRef] [PubMed]
  34. Kong, P.; Xu, H.; Li, R.; Huang, G.; Liu, W. Laser Speckle Contrast Imaging Based on a Mobile Phone Camera. IEEE Access 2021, 9, 76730–76737. [Google Scholar] [CrossRef]
  35. Soille, P. Morphological Image Analysis; Springer: Berlin/Heidelberg, Germany, 2004. [Google Scholar] [CrossRef]
  36. Maragos, P. Morphological Filtering for Image Enhancement and Feature Detection. In Handbook of Image and Video Processing; Elsevier: Amsterdam, The Netherlands, 2005; pp. 135–156. [Google Scholar] [CrossRef]
  37. Mello Román, J.; Vázquez Noguera, J.; Legal-Ayala, H.; Pinto-Roa, D.; Gomez-Guerrero, S.; García Torres, M. Entropy and Contrast Enhancement of Infrared Thermal Images Using the Multiscale Top-Hat Transform. Entropy 2019, 21, 244. [Google Scholar] [CrossRef]
  38. Mukhopadhyay, S.; Chanda, B. A multiscale morphological approach to local contrast enhancement. Signal Process. 2000, 80, 685–696. [Google Scholar] [CrossRef]
  39. Bai, X.; Zhou, F.; Xue, B. Image enhancement using multi scale image features extracted by top-hat transform. Opt. Laser Technol. 2012, 44, 328–336. [Google Scholar] [CrossRef]
  40. He, Y.; Kang, S.; Li, W.; Xu, H.; Liu, S. Advanced enhancement technique for infrared images of wind turbine blades utilizing adaptive difference multi-scale top-hat transformation. Sci. Rep. 2024, 14, 15604. [Google Scholar] [CrossRef]
  41. Román, J.C.M.; Noguera, J.L.V.; García-Torres, M.; Benítez, V.E.C.; Matto, I.C. Retinal Image Enhancement via a Multiscale Morphological Approach with OCCO Filter. In Information Technology and Systems; Springer International Publishing: Berlin/Heidelberg, Germany, 2021; pp. 177–186. [Google Scholar] [CrossRef]
  42. Aptoula, E.; Lefèvre, S. A comparative study on multivariate mathematical morphology. Pattern Recognit. 2007, 40, 2914–2929. [Google Scholar] [CrossRef]
  43. Bai, X.; Zhou, F.; Xue, B. Noise-suppressed image enhancement using multiscale top-hat selection transform through region extraction. Appl. Opt. 2012, 51, 338. [Google Scholar] [CrossRef]
  44. Roman, J.C.M.; Legal-Ayala, H.; Noguera, J.L.V. Applications of Multiscale Mathematical Morphology to Contrast Enhancement and Images Fusion. In Proceedings of the 2020 15th Iberian Conference on Information Systems and Technologies (CISTI), Seville, Spain, 24–27 June 2020; IEEE: Piscataway, NJ, USA, 2020; pp. 1–7. [Google Scholar] [CrossRef]
  45. Herrera-Arellano, M.; Peregrina-Barreto, H.; Terol-Villalobos, I. Visible-NIR Image Fusion Based on Top-Hat Transform. IEEE Trans. Image Process. 2021, 30, 4962–4972. [Google Scholar] [CrossRef]
  46. Arhami, M.; Desiani, A.; Yahdin, S.; Putri, A.I.; Primartha, R.; Husaini, H. Contrast enhancement for improved blood vessels retinal segmentation using top-hat transformation and otsu thresholding. Int. J. Adv. Intell. Inform. 2022, 8, 210. [Google Scholar] [CrossRef]
  47. Roy, M.; Mukhopadhyay, S. Infrared and Visible Image Fusion Using Morphological Reconstruction Filters and Refined Toggle-Contrast Edge Features. In Computer Vision and Machine Intelligence; Lecture Notes in Networks and Systems; Springer Nature: Singapore, 2023; pp. 641–654. [Google Scholar] [CrossRef]
  48. Moulden, B.; Kingdom, F.; Gatley, L.F. The Standard Deviation of Luminance as a Metric for Contrast in Random-Dot Images. Perception 1990, 19, 79–101. [Google Scholar] [CrossRef]
  49. Román, J.C.M.; Fretes, V.R.; Adorno, C.G.; Silva, R.G.; Noguera, J.L.V.; Legal-Ayala, H.; Mello-Román, J.D.; Torres, R.D.E.; Facon, J. Panoramic Dental Radiography Image Enhancement Using Multiscale Mathematical Morphology. Sensors 2021, 21, 3110. [Google Scholar] [CrossRef]
  50. Wang, Z.; Bovik, A.; Sheikh, H.; Simoncelli, E. Image Quality Assessment: From Error Visibility to Structural Similarity. IEEE Trans. Image Process. 2004, 13, 600–612. [Google Scholar] [CrossRef] [PubMed]
  51. Wang, Y.P.; Wu, Q.; Castleman, K.; Xiong, Z. Chromosome image enhancement using multiscale differential operators. IEEE Trans. Med. Imaging 2003, 22, 685–693. [Google Scholar] [CrossRef] [PubMed]
  52. Shapley, R.; Lennie, P. Spatial Frequency Analysis in the Visual System. Annu. Rev. Neurosci. 1985, 8, 547–581. [Google Scholar] [CrossRef] [PubMed]
  53. Hore, A.; Ziou, D. Image Quality Metrics: PSNR vs. SSIM. In Proceedings of the 2010 20th International Conference on Pattern Recognition, Istanbul, Turkey, 23–26 August 2010; IEEE: Piscataway, NJ, USA, 2010. [Google Scholar] [CrossRef]
  54. Derrac, J.; García, S.; Molina, D.; Herrera, F. A practical tutorial on the use of nonprametric statistical tests as a methodology for comparing evolutionary and swarm intelligence algorithm. Swarm Evol. Comput. 2011, 1, 3–18. [Google Scholar] [CrossRef]
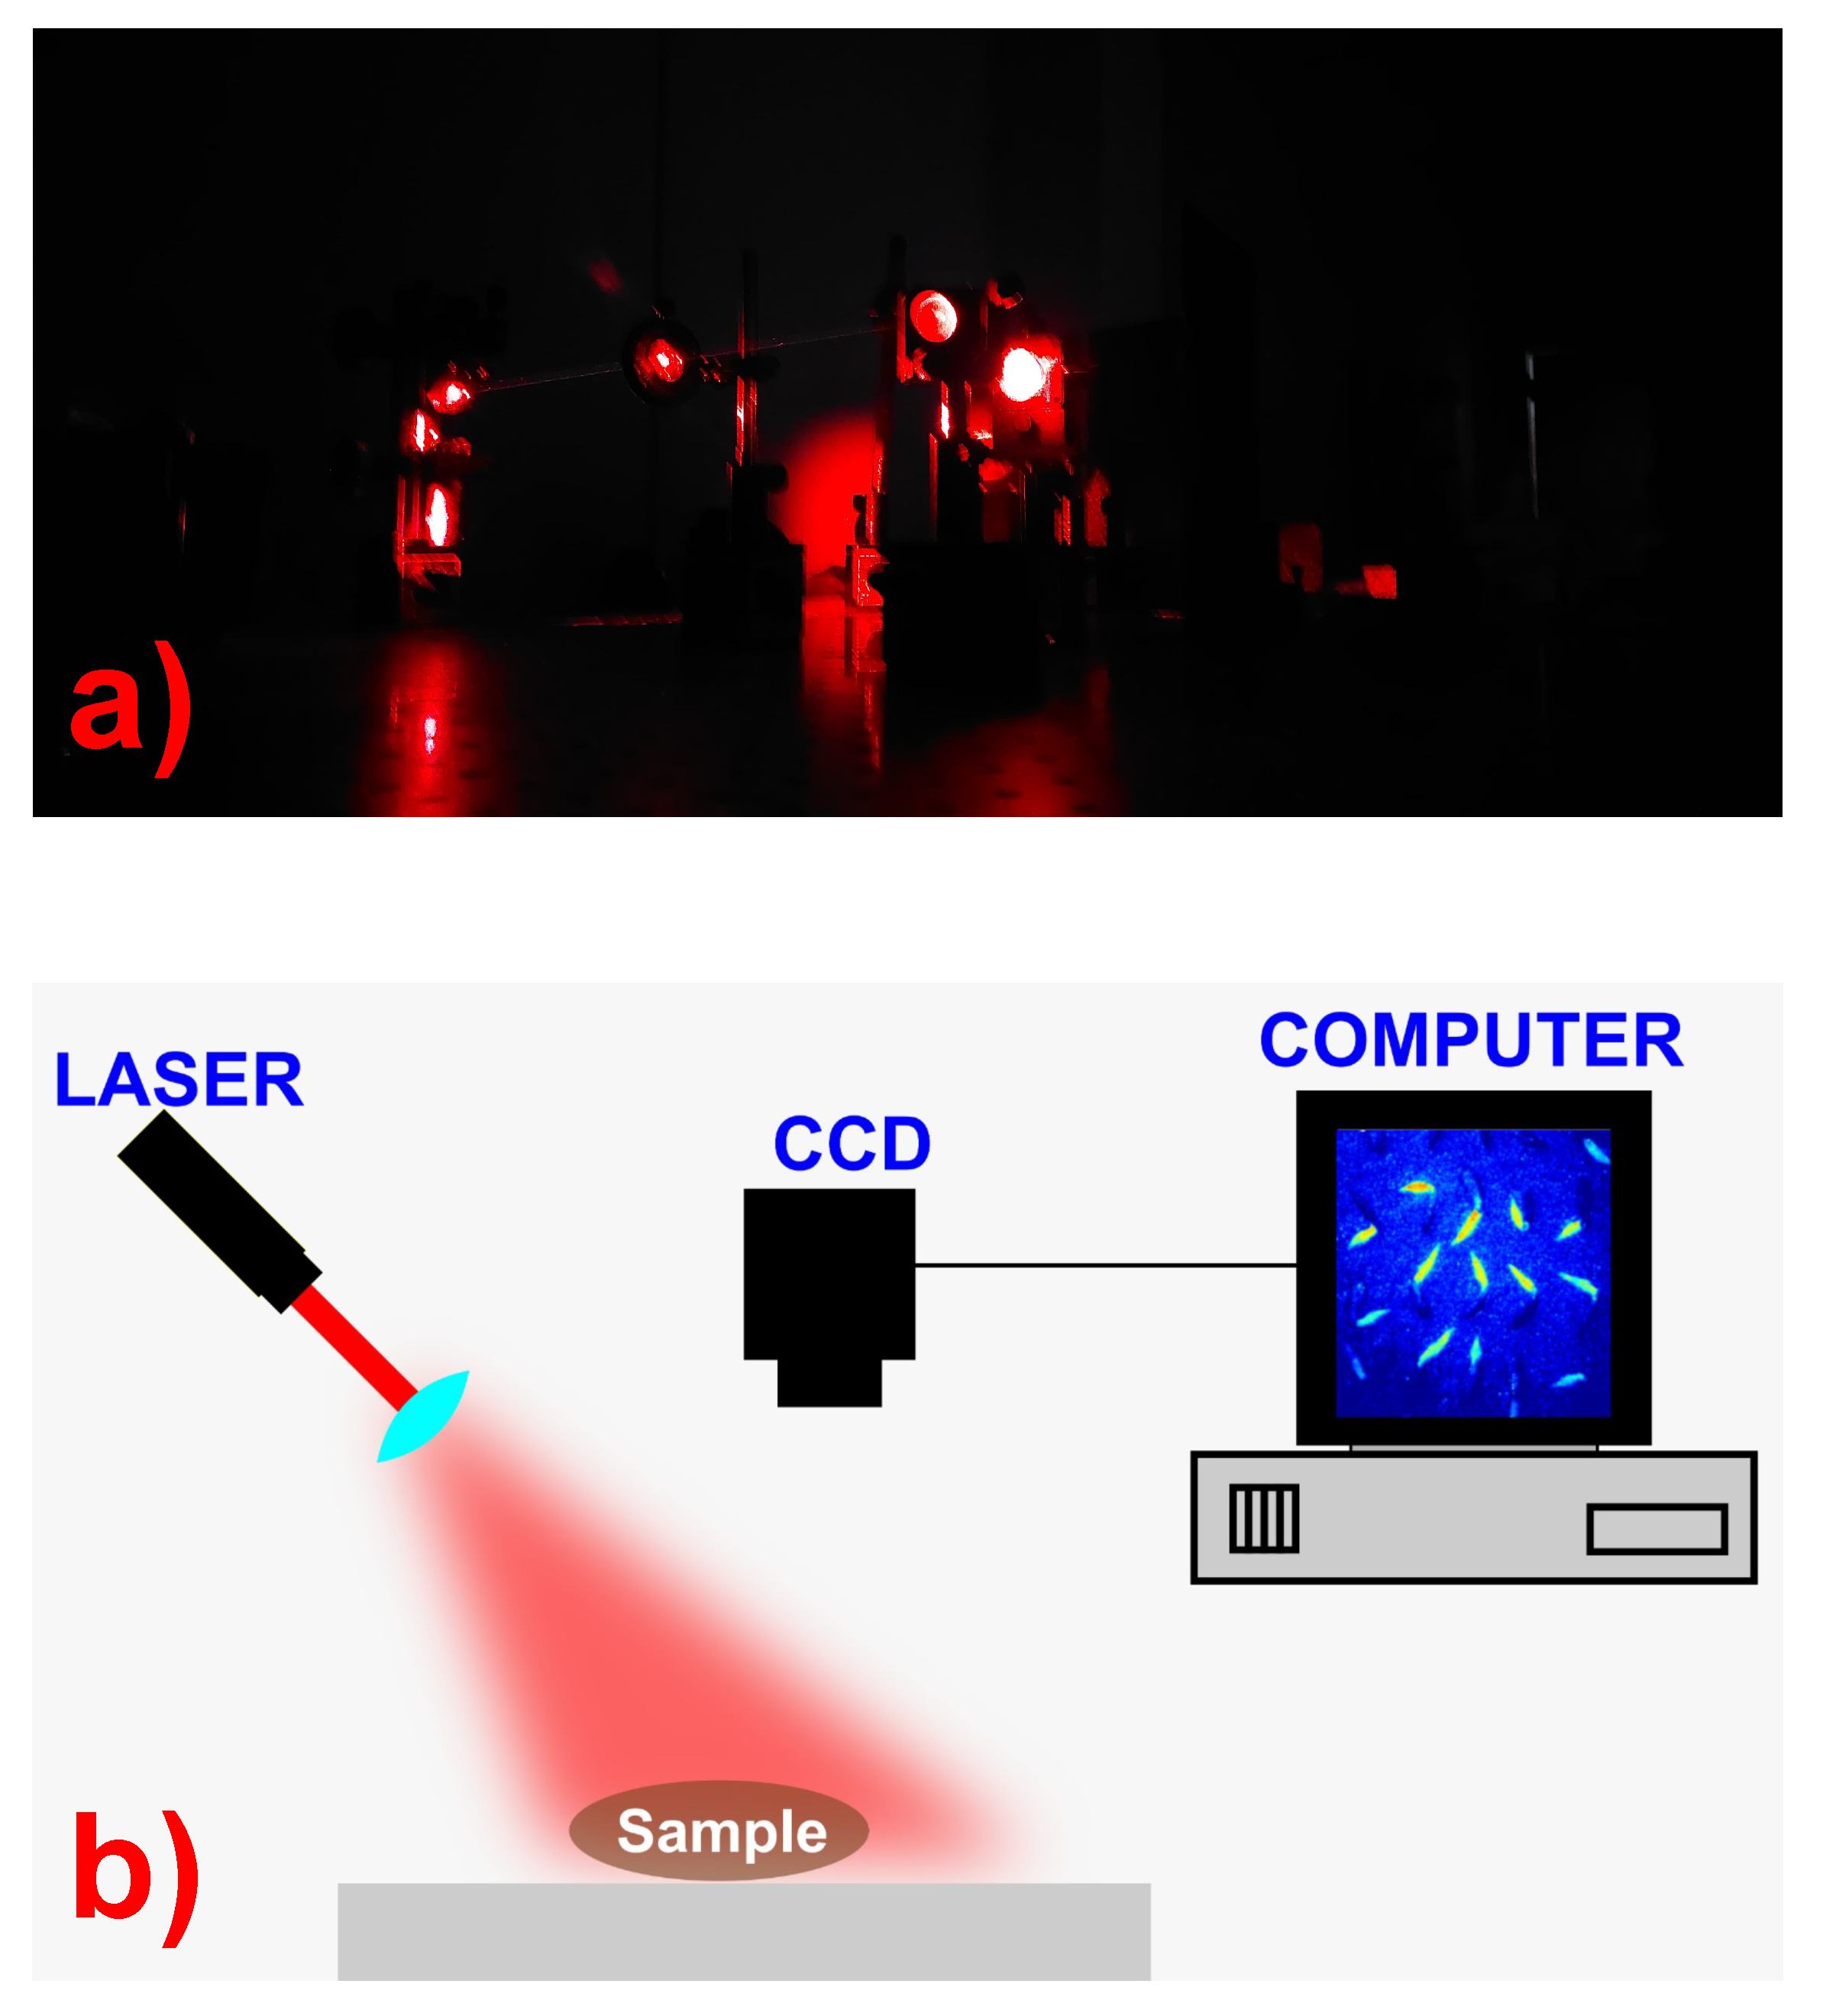
Figure 1. (a) Data acquisition using Laser Speckle Imaging. (b) Diagram of the illumination and imaging system. The lens acts as a spatial filter, generating a Gaussian beam to illuminate the sample. The schematic also illustrates the optical configuration and data flow from illumination to image capture, as described in the methodology section.
Symmetry 17 02029 g001
Figure 2. Laser speckle images of SL. (a) Illustration of the frame sequence corresponding to the P1_F1 experimental configuration (with polarizer and spectral filter enabled). (b) I G A V D image (activity map) generated by the GAVD method. The color scale represents intensity in arbitrary units (a.u.). The figure illustrates the image acquisition output and the corresponding activity map.
Symmetry 17 02029 g002
Figure 3. Example of activity maps I GAVD for two data types: (a) SP and (b) SL. In both cases, the background (BG) shows low intensity, while new growth regions, such as the radicle and the plumule, exhibit higher biological activity. The labeled regions of interest (ROI)—radicle, plumule, seed coat, and background—illustrate areas of differing biological activity and are used for visual validation of enhancement performance.
Symmetry 17 02029 g003
Figure 4. Boxplots of the metrics in Table 2. (a) Contrast, (b) Entropy, (c) SF, (d) SSIM, (e) PSNR, and (f) CIR.
Symmetry 17 02029 g004
Figure 5. I G A V D of an SP sample captured with the P 1 _ F 0 configuration. (a) Original output image, (b) Image enhanced with HE, (c) Image enhanced with CLAHE, (d) Image enhanced with MMCE, and (e) Image enhanced with OCCO-MTH.
Symmetry 17 02029 g005
Figure 6. I G A V D of an SL sample captured with the P 1 _ F 1 configuration. (a) Original output image, (b) Image enhanced with HE, (c) Image enhanced with CLAHE, (d) Image enhanced with MMCE, (e) Image enhanced with OCCO-MTH.
Symmetry 17 02029 g006
Figure 7. I G A V D of an SP sample captured with the P 1 _ F 0 configuration. (a) Original output image, (b) Image enhanced with CLAHE.
Symmetry 17 02029 g007
Figure 8. I G A V D of an SL sample captured with the P 1 _ F 1 configuration. (a) Original output image, (b) Image enhanced with MMCE.
Symmetry 17 02029 g008
Table 1. Experimental configurations used to obtain the dataset.
CodePolarizerSpectral Filter
P0_F0NoNo
P0_F1NoYes
P1_F0YesNo
P1_F1YesYes
Table 2. Quantitative metrics for contrast enhancement algorithms applied to speckle images, averaged over all experimental configurations.
AlgorithmContrastEntropySFSSIMPSNRCIR
CLAHE36.886.129.350.84724.690.104
HE26.035.779.620.61821.990.020
MMCE34.325.8712.440.81327.450.640
OCCO-MTH32.795.889.300.90630.710.287
Original29.515.767.82
Table 3. Non-parametric statistical test of the specialists’ evaluation.
AlgorithmsSampleMeanStd. Dev.Ranking (Friedman)p-Value (Shaffer) vs. I
I241.0000.0003.713-
HE240.2500.5044.6650.101
CLAHE241.4030.7422.0350.042
MMCE241.5690.3472.0890.007
OCCO-MTH241.4170.4082.4970.055
Disclaimer/Publisher’s Note: The statements, opinions and data contained in all publications are solely those of the individual author(s) and contributor(s) and not of MDPI and/or the editor(s). MDPI and/or the editor(s) disclaim responsibility for any injury to people or property resulting from any ideas, methods, instructions or products referred to in the content.