Abstract
This study investigates the fatigue behavior of pressurized pipelines under cyclic internal pressure, focusing on the influence of elastic and elastoplastic material responses on crack propagation. The Extended Finite Element Method (XFEM), implemented in Abaqus 2002, is used to model crack initiation and propagation without remeshing. The analysis first considers elastic behavior to estimate maximum stresses and stress intensity factors (SIFs) at crack tips, and then introduces an elastoplastic model to account for local plastic deformation in regions of high stress concentration, improving fatigue life prediction accuracy. The numerical approach is coupled with the Basquin and Manson–Coffin fatigue models and supported by a test matrix varying internal pressure amplitudes to systematically evaluate parameter interactions. The novelty of this work lies in the systematic study of the interaction between internal pressure, material nonlinearity, plastic zone evolution, crack closure, and fatigue life estimation. Unlike previous studies, the analysis includes detailed comparisons with analytical predictions and validated experimental data from the literature, ensuring the reliability of the model. The results show significant differences between the elastic and elastoplastic regimes: under 12 MPa, the maximum stress reached 352.5 MPa and fatigue life was 1639 cycles, while under 28 MPa, stress increased to 850 MPa and life dropped to a single cycle. These findings highlight the critical role of plastic deformation in fatigue crack growth and demonstrate that neglecting plasticity can greatly overestimate pipeline durability, providing a more realistic assessment of structural integrity in pressurized systems.
1. Introduction
Pressurized pipelines are vital components in various industrial sectors, including oil and gas, chemical processing, and water distribution, ensuring the safe and efficient transport of fluids over long distances [1]. Maintaining their structural integrity and long-term reliability is therefore a major engineering concern. Among the principal degradation mechanisms, fatigue failure is particularly critical, as it develops progressively and often remains undetected until reaching an advanced stage, potentially leading to catastrophic ruptures with severe economic, environmental, and safety consequences [2]. Pipelines are continuously subjected to cyclic loading due to fluctuations in internal pressure, thermal variations, and operational conditions, which promote the initiation and propagation of microcracks. The primary objective of this study is to evaluate the impact of these cyclic loading conditions on the fatigue life of pressurized pipelines [3], with explicit consideration of the differences between elastic and elastoplastic material responses, local plastic deformation, and stress concentration effects at crack tips. Several analytical and numerical models have been proposed to estimate pipeline fatigue life under operational stresses, including the Paris–Erdogan, Forman, and plasticity-based models [4], as well as numerical approaches such as the Extended Finite Element Method (XFEM). Simplified elastic–plastic analyses provide efficient strain-based fatigue evaluations, while Finite Element Analysis (FEA) is commonly employed to assess structural response and stress concentration factors (SCF) in the presence of defects such as dents or notches [5,6]. Advanced methods like phase-field modeling further enhance fatigue simulations by incorporating elastic–plastic fracture energy, offering improved accuracy in crack growth prediction [7]. Nevertheless, significant challenges persist in accurately representing material behavior, defect geometry, and environmental effects such as corrosion, all of which strongly influence crack growth and overall structural integrity [8,9]. From an applied standpoint, fatigue studies contribute to the optimization of predictive models, maintenance planning, and design strategies, with approaches such as linear elastic fracture mechanics and reinforcement techniques—like steel sleeve repair—providing practical insights into long-term durability [10,11]. In this context, the present work employs XFEM implemented in Abaqus, coupled with a linear elastic model and a Von Mises plasticity formulation incorporating isotropic hardening, to capture local plastic effects and crack closure phenomena [12]. A multiaxial fatigue model under variable amplitude loading, based on the Manson–Coffin–Basquin law, is also introduced to simulate realistic operating conditions. This integrated numerical framework provides a comprehensive assessment of elastoplastic fatigue behavior, crack propagation, and pipeline lifespan under service conditions [13,14], thereby clarifying the study’s specific aims and its practical relevance to structural integrity evaluation.
2. XFEM Formulation
Traditionally, the analysis of cracking in pressurized pipelines has relied on the classical Finite Element Method (FEM), where the mesh must conform to the crack geometry, positioning the crack along element boundaries and aligning the crack tip with a mesh node [15]. Near the crack tip, the stress field theoretically tends to infinity according to fracture mechanics, which complicates numerical convergence and can be physically unrealistic. To address this, conventional FEM often requires local mesh refinement and remeshing around the crack tip. However, remeshing is computationally expensive, difficult to control, and may introduce numerical errors. The Extended Finite Element Method (XFEM) was developed to overcome these limitations by introducing enrichment functions that capture discontinuities and singularities without modifying the underlying mesh [16]. XFEM extends the standard finite element approximation by adding extra degrees of freedom to nodes affected by the crack. Two main types of enrichment functions are used: (i) the Heaviside function, which represents the displacement jump across the crack faces, allowing cracks to propagate within elements without remeshing, and (ii) near-tip asymptotic functions, which accurately reproduce the singular stress and displacement fields at the crack tip. This approach enables XFEM to model arbitrary crack geometries and complex propagation paths efficiently, while maintaining mesh independence and improving computational accuracy. XFEM has been successfully applied to pipelines with various crack profiles, including three-dimensional elliptical and rectangular cracks, capturing crack initiation, growth, and coalescence effectively. The method was initially developed by Babuška and Milenk and later refined by Nash, Gifford, and Atluri for both stationary and propagating cracks. Subsequent contributions by Méos, Belytschko, and Dolbow enhanced the method’s accuracy, convergence, and robustness, making it suitable for simulating complex fracture phenomena in structural components. Commercial implementations, such as in Abaqus, allow XFEM to simulate crack propagation without remeshing, automatically compute stress intensity factors via the J-integral, and support analyses under elastic, elastoplastic, and cyclic loading conditions. Table 1 summarizes the evolution and key milestones of XFEM from its inception to the present.

Table 1.
Chronological development of the XFEM.
The fundamental principle of XFEM is to incorporate enrichment functions close to the expected answer into the base function that is used to estimate the issue [17].
The locally enforced discontinuities are described by improving the approximate local standard finite element approximation within the XFEM. As a result, stresses can be handled, particularly at a particular node (). The displacement U approximation is displayed as follows [18]:
where H(x): the Heaviside enrichment function ; ψ(x): Enrichment functions near the crack front; N: Interpolation function of finite element; : Number of nodes enriched with Heaviside function; : Number of knots enriched near the crack front.
Figure 1 illustrates the difference between the standard FEM and the XFEM approach. In XFEM, the original element with nodes A–D is enhanced by adding extra degrees of freedom at nodes A–D*. The Heaviside function H(x) is used to represent discontinuities, while the crack-tip functions ψ(x) capture the high stress concentrations near the tip of the crack.

Figure 1.
(a) Standard FEM; (b) *—XFEM enrichment.
The extended finite element method (XFEM) has gradually evolved since its early development, driven by both theoretical advances and practical applications. To provide a clear overview of this progress, Table 1 summarizes the key milestones in the development of XFEM, highlighting significant improvements, methodological refinements, and important applications in fracture mechanics and crack modeling.
To simulate a variable-amplitude loading scenario with a single cycle in Abaqus using XFEM, the pipeline geometry is first defined, and the initial crack is introduced using the XFEM framework. Material properties are assigned according to the desired constitutive behavior, either elastic or elastoplastic with isotropic hardening, to capture local plastic effects at the crack tip. The variable-amplitude loading is applied through a time-dependent amplitude, defining the internal pressure variation over the cycle. XFEM enhances the classical finite element approximation by enriching the displacement field with specific functions that allow accurate modeling of discontinuities and singularities. Nodes whose support is intersected by the crack are enriched with the Heaviside function, which introduces a displacement jump across the crack faces, while nodes near the crack tip are enriched with near-tip asymptotic functions to capture the singular stress field and reproduce the square-root stress intensity behavior predicted by linear elastic fracture mechanics. These enrichments introduce additional degrees of freedom at the enriched nodes, which are automatically handled by Abaqus, and numerical integration in elements cut by the crack is performed using sub-triangulation to account for the discontinuity, with blending elements corrected to avoid spurious oscillations. The J-integral is activated to extract stress intensity factors (SIF), and multiple integration contours are employed to ensure accurate computation. Crack propagation criteria are defined based on stress intensity factors and material fatigue properties, allowing XFEM to simulate crack growth automatically without remeshing. Finally, key results such as crack opening displacement, stress distribution, SIF evolution, and fatigue life predictions are extracted and analyzed, providing a detailed assessment of pipeline behavior under realistic variable-amplitude loading conditions.
3. Methodological Approach
3.1. Material and Geometry
The fatigue behavior of pipelines primarily depends on three key factors: the structural characteristics, the applied loading, and the failure mode. In this study, these factors were incorporated into numerical simulations using a generic 3D model of a pressurized pipeline. The pipeline features a longitudinal crack with a rectangular profile, extending to the outer surface and positioned along the symmetry plane. This symmetric arrangement allows for a precise analysis of stress distribution and crack propagation, enabling consistent evaluation of stress intensity factors and plastic deformation along the longitudinal direction while reducing computational complexity. Although semi-elliptical cracks are generally considered more realistic representations of fatigue cracks, a rectangular crack geometry was chosen here for its simplicity, computational efficiency, and practical relevance. This shape closely resembles certain longitudinal defects commonly observed in pipelines, such as weld flaws or wear-induced cracks, and facilitates numerical implementation within the XFEM framework. Previous studies support this modeling choice: Ref. [19] compared the effect of discontinuity geometry on fatigue behavior by considering cracks of various shapes (rectangular, elliptical, hexagonal, etc.); Ref. [20] examined the influence of crack shape, including rectangular forms, on stress intensity factors for cracks near a biomaterial interface; and Ref. [21] employed the Heaviside function to model planar cracks in multilayered structures without remeshing, demonstrating the advantages of simplified shapes in certain contexts. Based on these findings, adopting a rectangular crack in this work offers a balanced compromise between computational simplicity and physical relevance, providing a solid basis for understanding crack growth behavior in pressurized pipelines (Figure 2).
Uy (x, y, z) = 0 pour tout (x, y, z) ∊ ∂Ω.
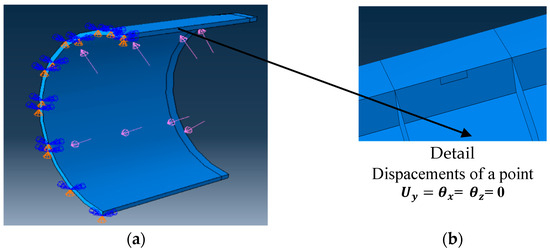
Figure 2.
(a) Geometry and boundary conditions; (b) Detail of the fracture.
The analysis is conducted under the assumption of a plane strain state. This assumption is justified by the previously imposed boundary conditions, which lead to a negligible normal strain in the longitudinal direction ( ≈ 0), corresponding to a typical plane strain situation. In this context, although the deformation along the longitudinal axis is minimal, the associated stress component remains significant and must be accounted for in the analysis. This assumption is particularly valid for thick-walled cylindrical structures, such as pipelines, where the wall thickness is large relative to the crack depth. Under such conditions, out-of-plane deformations are constrained by the surrounding material, and the stress distribution near the crack front closely resembles a plane strain state. The plane strain approximation ensures that the computed stress intensity factors accurately reflect the structural response, particularly in regions near the crack tip where three-dimensional effects are limited. This approach has been widely adopted in fracture mechanics studies of pressurized cylinders (with the dimensions presented in Table 2) and thick-walled components [22] the strain tensor is given by:

Table 2.
Geometry properties of the structure [23].
For this study, The P264GH material is used and its mechanical and chemical characteristics are described in Table 3 and Table 4, respectively:

Table 3.
Mechanical characteristics of P264GH steel [23].

Table 4.
Chemical composition of P264GH steel %.
3.2. Mesh Selection
In the Extended Finite Element Method (XFEM), the mesh is designed to represent discontinuities, such as cracks, without the need for specific mesh refinement around them [24]. Unlike the conventional finite element method, XFEM employs enriched shape functions that enable the crack to propagate through elements by introducing additional degrees of freedom at the relevant nodes [25]. This approach effectively captures crack singularities and openings without requiring local mesh adjustments, thereby enhancing computational efficiency and reducing overall costs (Figure 3).
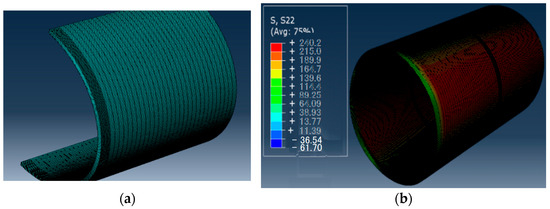
Figure 3.
(a) Finite element mesh of the pipeline with local refinement at the crack tip; (b) longitudinal stress distribution for P = 12 MPA.
The elements used for this simulation in Abaqus/Standard are C3D8R (8-node linear hexahedral elements with reduced integration). This choice was primarily based on the excellent agreement between numerical and analytical results. The numerical result in Abaqus for the longitudinal stress σ22 is 240.2 MPa, whereas the analytical value computed for a pressure of 12 MPa is 237.84 MPa (Figure 4). The 2 MPa deviation is attributed to the tube’s distortion following pressure application.
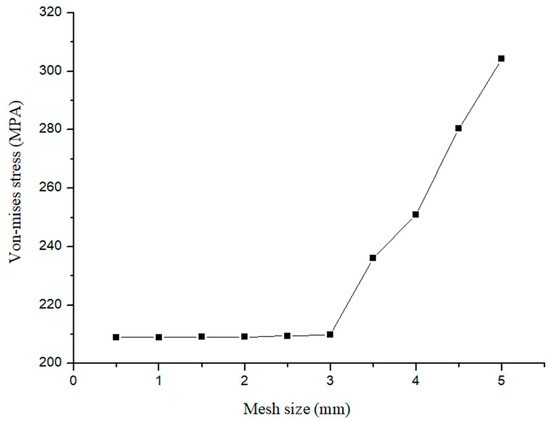
Figure 4.
Variation in Von-Mises stress with the mesh size for a = 1 mm.
The accuracy of numerical results strongly depends on the mesh size and quality. In this study, the area around the crack was finely meshed with 1.5 mm elements, while the rest of the model was meshed more coarsely with 10 mm elements. The mesh quality was checked using Jacobian and aspect ratio criteria, with a minimum element quality of 0.5 to avoid distortion. To ensure reproducibility, ABAQUS automatically generated a random seed value of 51,972, which kept the same node distribution in all repeated simulations. A mesh convergence study was carried out using a model with an initial crack length of 1 mm under an internal pressure of 10 MPa. The theoretical stress was 209 MPa, and an error indicator was calculated to assess the accuracy of each mesh configuration. The error indicator was defined as the relative difference between the Von Mises stress obtained for the current mesh and the reference stress from the finest mesh (209 MPa), expressed as a percentage:
The final model contained about 777,500 elements and 1874,256 nodes. Progressive refinement was applied until the results stabilized. Convergence was reached with a global mesh size of about 2 mm, while maintaining a finer mesh of 1.5 mm near the crack tip to accurately capture local stress variations Table 5).

Table 5.
Von Mises stress for a= 1 mm with a pressure of 10MPA.
3.3. Test Tables
In the field of structural fatigue, test matrices are particularly useful for conducting numerical simulations. Numerous critical parameters influence the fatigue life of pipelines, such as the amplitude of the applied load, ambient temperature, and crack geometry, among others [25]. Test matrices allow for the systematic variation in these factors to optimize fatigue life while minimizing the number of physical experiments required [26]. They also enable the exploration of a wide range of variables with a limited number of simulations, thereby facilitating the identification of complex interactions among influencing parameters.
In this study, a test matrix was designed to account for several critical parameters affecting pipeline fatigue. It includes ten simulations in which the applied internal pressure was systematically varied. The specific pressure values were selected based on numerical tests conducted in a previous study [25], which provided representative operational conditions for pipelines. The main objective is to evaluate the effect of internal pressure on the elastic and elastoplastic behavior of the pipeline. For this reason, the initial crack length was fixed at 1 mm, with an angular orientation of 0° relative to the outer surface of the tube. This configuration was chosen to represent a practical defect scenario and to reflect the influence of different applied load amplitudes under realistic operational conditions (Table 6).

Table 6.
Test table.
4. Results and Discussion
4.1. Model Validation
A thorough comparison with existing studies provides a solid basis for validating the XFEM model developed in this work. Key parameters, including longitudinal and hoop stresses, were compared with both analytical solutions and previously published results. Our findings are in close agreement with the longitudinal stresses reported by S. Montassir [23], who studied semi-elliptical cracks in pressurized pipes using XFEM, with relative differences of less than 2%. Similarly, the stress levels predicted by our simulations closely match those reported by H. Moustabchir [26], whose results are based on experimental measurements and validated through conventional finite element analyses, with relative differences within 3%. This comparison confirms that our XFEM model reliably reproduces the stress distribution observed in experimental studies while maintaining consistency with validated numerical predictions. The comparison was made by calculating the relative difference between the XFEM results and the reference values from analytical or literature data, expressed as a percentage. This quantitative assessment demonstrates that our model accurately captures both the magnitude and distribution of stresses around the crack. The strong agreement with previous studies reinforces the credibility of the proposed XFEM model and supports its application to more complex pipeline configurations and crack geometries (Table 7).

Table 7.
Comparison of Hoop stress.
4.2. Fatigue Behavior in Elastic Regime
This section presents a mechanical modeling of materials under a linear elastic regime, valid within the domain of small deformations, and based on the assumptions of Hooke’s law. In the absence of any plastic behavior, the material response remains proportional to the applied loads, allowing for an accurate assessment of stress distributions, particularly near geometric discontinuities Stress Intensity Factors (SIFs) are computed to characterize the stress field at the crack tips. Crack propagation is then evaluated using the framework of Linear Elastic Fracture Mechanics (LEFM), relying on fracture criteria, including Von-mises criterion and the critical stress intensity factor to define the onset of unstable crack growth. The stress intensity factors (SIFs) were determined from the J-integral, calculated using the contour integration method implemented in Abaqus/XFEM. Several successive contours were employed to verify the stability of the results and ensure the reliability of the procedure. The convergent values of the J-integral were then used to derive the corresponding SIFs (Figure 5).
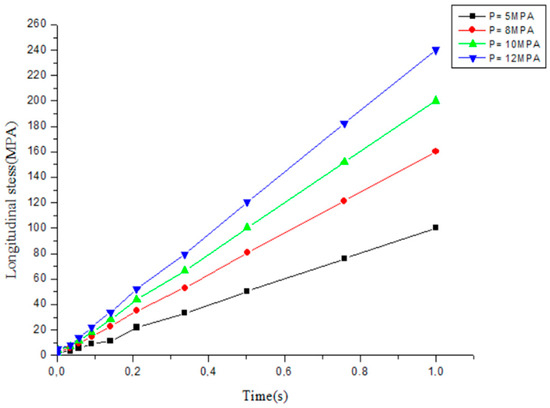
Figure 5.
Evolution of longitudinal stress for different Pressure in elastic regime.
The numerical procedure in Abaqus was carried out in five main steps: (i) defining the crack with XFEM enrichment, either through a partitioned zone or a crack line; (ii) enabling the J-integral calculation in the Fracture Mechanics Interaction module; (iii) specifying the number of integration contours; (iv) extracting the results; and (v) verifying the stability of the J values before computing the associated SIFs.
Because of the uniform distribution of mechanical stresses throughout the structure and the lack of noticeable fracture start, the stress levels are still quite low. The stress exhibits an exponential trend and rises quickly with time, especially up to T = 0.0912. This behavior suggests that the slow accumulation of stress close to the fracture tips could be caused by micro-defects. The propagation enters an unstable phase, which is probably related to the material’s local yielding, once the stress component exceeds the critical value of 40.18 MPa (Figure 6). Further crack extension and structural deterioration are encouraged by this shift to plastic deformation.
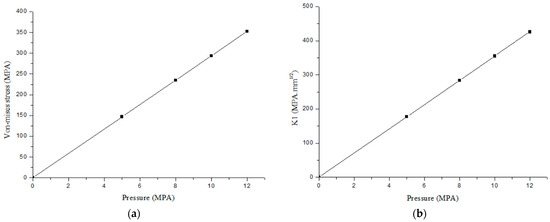
Figure 6.
(a) Von Mises stress distribution along the thickness of the pipeline under different pressures; (b) Stress intensity factor distribution along the thickness of the pipeline under different pressures.
The Mises stress increases in an almost linear fashion; however, once P reaches 5 MPA, the stress begins to increase progressively and significantly with pressure. This suggests that the material is subjected to an escalating multiaxial stress state during this phase, and crack propagation has commenced [27].
In light of this, it can be said that the material enters a localized plastic regime. As internal pressure P increases, the stress intensity factor K1 shows a quasi-linear increase. According to the basic ideas of fracture mechanics, this pattern shows a noticeable dependence of K1 on the applied pressure. It has been determined that the pre-existing crack in the tube starts to initiate at a critical pressure of 12 MPA (Figure 7). Beyond this point, a steady rise in the applied pressure may cause the crack to spread significantly, endangering the material’s structural stability.
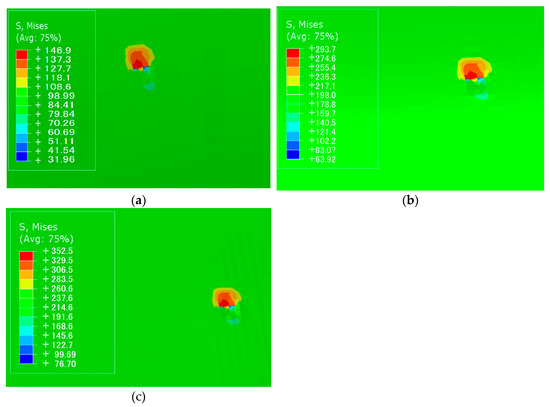
Figure 7.
(a) Crack opening profile under Mode I loading for P = 5 MPA; (b) Crack opening profile under Mode I loading for P = 10 MPA; (c) Crack opening profile under Mode I loading for P = 12 MPA.
The results of the numerical simulation reveal that despite the progressive increase in the applied pressure, no significant crack opening is observed. This can be attributed to the elastic nature of the material, where deformations remain reversible and internal stresses are uniformly distributed around the crack [28].
The absence of crack opening suggests that the applied stress remains below the critical threshold required to initiate crack propagation. Higher pressures or greater faults would be needed to start cracking, according to this analysis, which also highlights the need for elastic modeling during the early phases of loading. A strong basis for assessing the development of crack resistance in structures exposed to mild pressures, where plasticity may be disregarded, is provided by its capacity to anticipate the stability or expansion of pre-existing flaws under cyclic loading.
4.3. Fatigue Behavior in Elastoplastic Regime
Energy dissipation mechanisms and their impact on crack formation can be better understood by examining elastoplastic behavior with strain hardening. In fact, strain hardening, which is a crucial phenomenon in forecasting the spread of fatigue cracks, represents the rise in a material’s resistance after many plastic deformations [29]. A 3D model that incorporates a failure criterion and an elastoplastic material behavior while accounting for the particular plasticity model of the material under study was used to investigate the effects of plasticity, and, in particular, strain hardening, on crack propagation under cyclic loading in pipelines.
The ABAQUS 2022 software employs the following plasticity model for the analysis of material plastic behavior.
where : is the Initial yield stress and H is the isotropic hardening modulus (determined from the slope of the plastic portion of the stress–strain curve).
Pressurized pipelines work by keeping their internal pressure high and comparatively constant. These structures do, however, experience cyclic loads in practice, with varying amplitudes throughout time. Analyzing the many forms of cyclic loading that these pipelines may encounter is crucial to understanding their fatigue behavior. To represent various loading circumstances in this context, such as asymmetric loading, random internal pressure changes, and constant amplitude loading, a numerical simulation was conducted. The pipeline’s reaction to a positively asymmetric cyclic internal pressure was first simulated using an elastoplastic material model with isotropic hardening (Figure 8 and Figure 9).
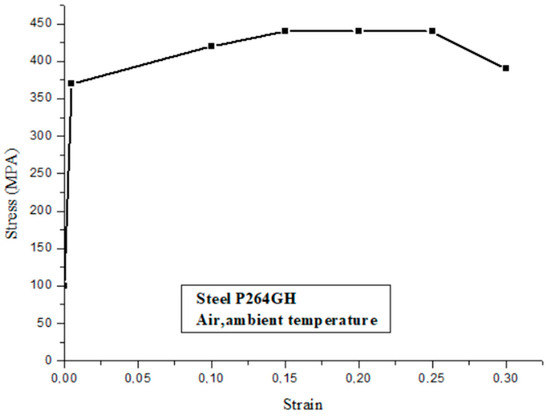
Figure 8.
Typical stress–strain diagram of steel P264GH.
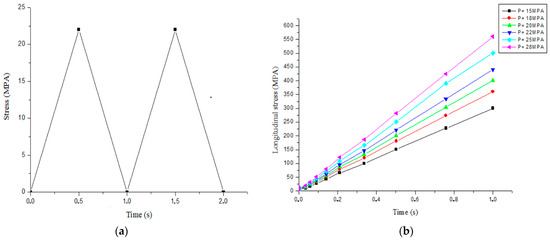
Figure 9.
(a) Positive asymmetric cyclic loading over multiple number of cycles to failure; (b) evolution of longitudinal stress for different pressure in plastic regime with time variation.
A linear increase in longitudinal stress with time is observed for each applied pressure level, indicating a stable plastic response of the material during loading. The progressive rise in stress with increasing pressure demonstrates the direct influence of internal loading on the longitudinal stress field [30]. For a given duration, the stress values become significantly higher as the pressure increases, reaching approximately 550 MPA at 1 s for a pressure of 28 MPA, compared to around 300 MPA for 20 MPA.
This confirms a proportional relationship between internal pressure and longitudinal stress. The behavior reflects an intensification of stress near the crack front, which promotes crack propagation. In the plastic regime, the crack tends to open further under high longitudinal stresses, increasing the stress concentration at the crack tip. This can lead to either stable or unstable crack growth, depending on the loading intensity and the material properties.
The Von Mises stress reaches approximately 850 MPa at an internal pressure of 28 MPa. This behavior indicates that the equivalent stress field, which characterizes the three-dimensional state of the material, is strongly influenced by the increase in internal loading. In the plastic regime, this stress reflects not only the intensity of the applied load but also the potential for local damage initiation, particularly near stress concentrators such as cracks. As the Von Mises stress rises, the likelihood of exceeding the material’s yield strength increases, which may lead to crack propagation through plastic deformation at the crack tip. To further quantify this effect, the plastic zone radius was estimated using both the numerical results from the equivalent plastic strain field and Irwin’s analytical expression. The values vary between 0.13 mm as the minimum and 0.45 mm as the maximum. The calculated plastic zone size increases from approximately 0.12 mm in the elastic regime to 0.85 mm under elastoplastic loading, confirming a significant expansion of the plastically deformed region with rising internal pressure. This enlargement enhances crack-tip shielding and induces crack closure during the unloading phase of each pressure cycle. The residual plastic zone acts as a compressive layer that partially closes the crack, reducing the effective stress intensity range experienced by the crack tip. Consequently, the fatigue crack growth rate decreases temporarily. However, as the plastic zone accumulates and the material undergoes cyclic softening, the crack closure effect diminishes, leading to accelerated crack propagation and a notable reduction in fatigue life. Similarly, the Mode I stress intensity factor increases with pressure, reaching approximately 950 MPa. This trend confirms that the effect of internal pressure on crack severity is both direct and proportional, indicating a stronger singularity field at the crack tip and a higher susceptibility to failure [31]. The quantitative correlation between plastic zone size, crack closure, and fatigue life provides a clearer understanding of the degradation mechanism observed in pressurized pipelines and highlights the critical role of crack closure in modulating the effective stress intensity and delaying early-stage fatigue crack growth (Figure 10).
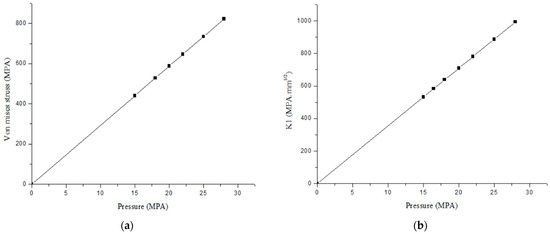
Figure 10.
Effect of internal pressure on (a) von Mises stress and (b) stress intensity factor K1 [MPa√mm], illustrating the link between plastic deformation, crack closure, and fatigue life in pressurized pipelines.
The significant mechanical energy concentration near the crack front enhances the driving force for crack propagation, whether stable or unstable, thereby increasing the risk of damage through fracture mechanisms.
The distribution of equivalent plastic strain (PEEQ) in the pipeline was analyzed for internal pressures of 18, 20, and 22 MPA. In all figures, the plastic strain is mainly concentrated around the crack tip, which is consistent with the expected behavior: stress concentration at the crack tip causes local hardening of the material. The maximum PEEQ values, shown in red, indicate the regions with the highest plastic deformation. These areas are the most vulnerable parts of the structure, as they undergo cumulative damage that can initiate or accelerate crack propagation. At 18 MPA, the material locally transitions from elastic to elastoplastic behavior, meaning it no longer behaves purely elastically and its fatigue resistance is reduced in these regions. The simulation highlights the direct effect of increasing internal pressure on the pipeline: higher pressure expands the plastified zone and increases the risk of rapid crack growth (Figure 11). These results emphasize the importance of considering local plasticity when predicting fatigue life and planning inspections and maintenance strategies.
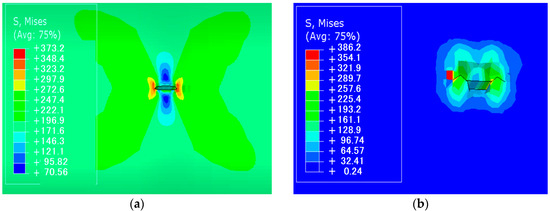
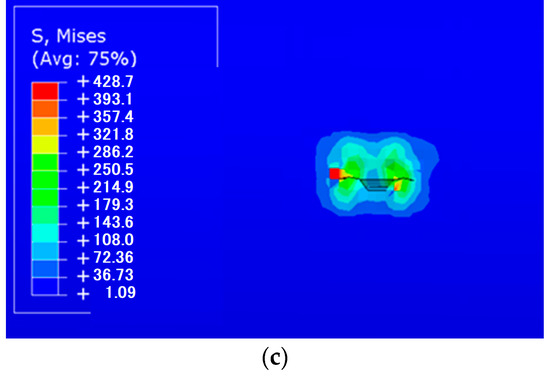
Figure 11.
(a) Crack opening profile under Mode I loading for P = 18MPa; (b) Crack opening profile under Mode I loading for P = 20 MPa; (c) Crack opening profile under Mode I loading for P = 22 MPa.
4.4. Fatigue Life Estimation in the Elastic and Plastic Regimes
Both elastic and plastic deformation regimes were used to evaluate the pipeline’s fatigue life. Basquin’s law was used in the elastic regime, when the material behavior stays inside the linear elastic domain. The following equation [32] expresses this empirical relationship between the stress amplitude and the number of cycles to failure in the high-cycle fatigue domain (Figure 12):
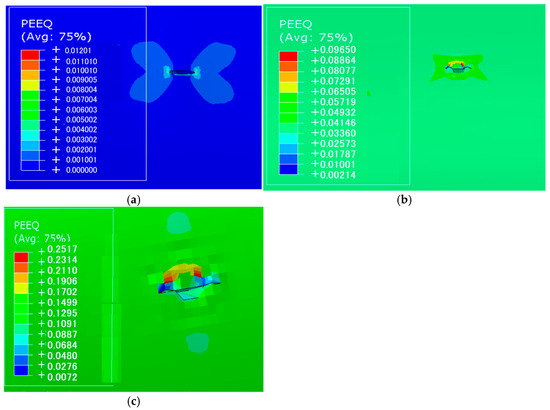
Figure 12.
(a) equivalent plastic strain (PEEQ) distribution around the crack for a pressure of 18 MPA; (b) equivalent plastic strain (PEEQ) distribution around the crack for a pressure of 20 MPA; (c) equivalent plastic strain (PEEQ) distribution around the crack for a pressure of 22 MPA.
When the loading conditions lead to plastic deformation, the fatigue life was estimated using the Manson-Coffin-Basquin law, which accounts for both elastic and plastic strain components. The general form of the equation is [33]:
: is the stress amplitude. : is the total strain amplitude. : is the fatigue strength coefficient (stress at failure in fatigue). : is the fatigue ductility coefficient (plastic strain at failure). : is the total number of reversals to failure (half-cycles). E: is Young’s modulus. b: is the fatigue strength exponent (slope of the S–N curve in log-log scale). C: is the fatigue ductility exponent (typically negative).
Combining the two models allowed for a thorough estimate of the pipeline’s fatigue life through the analysis of numerical findings (Figure 13). By addressing both high-cycle fatigue (elastic regime) and low-cycle fatigue (plastic regime) situations, this dual-approach offers a greater understanding of the durability of pressurized pipelines [34]. Since P264GH steel is a low-alloy mild steel, these values were derived from literature results for this material category in the lack of experimental data for the Basquin and Manson–Coffin model coefficients (Table 8).
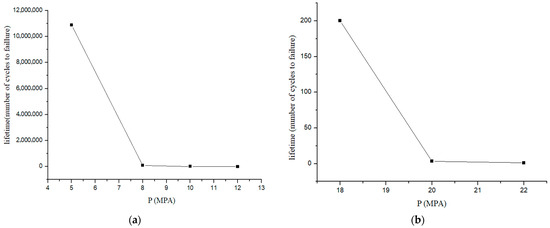
Figure 13.
(a) Fatigue life evolution in the elastic regime with pressure variation; (b) Fatigue life evolution in the plastic regime with pressure variation.

Table 8.
Typical parameters for low-carbon P264GH steel.
In the elastic regime, a sharp decrease in the number of cycles to failure is observed between 5 and 7 MPA, where the fatigue life drops from approximately one million cycles to fewer than 100,000. This trend reflects the high sensitivity of the material to increasing internal pressure, even under elastic loading conditions. Such behavior is well described by Basquin’s law, which states that the fatigue life decreases exponentially with increasing stress amplitude. Beyond 7 MPA, the curve reaches a plateau, suggesting that further increases in pressure result in a relatively smaller reduction in fatigue life. This phenomenon can be attributed to the acceleration of both crack initiation and propagation phases, driven by the rise in cyclic mechanical stresses experienced by the material.
For the plastic regime a dramatic reduction in fatigue life between 18 MPA and 20 MPA, where the number of cycles to failure drops from approximately 200 to fewer than 10. This sharp decrease highlights the material’s high sensitivity to cyclic loading in the plastic deformation regime, where behavior is governed by permanent, localized strain rather than the linear and reversible response observed in the elastic domain.
Because plasticity greatly reduces the material’s resistance to fracture, cyclic plastic strain builds up close to stress concentrators, especially around crack tips, in these circumstances, causing fatigue cracks to initiate quickly and spread more quickly. The Manson-Coffin-Basquin equation, which includes both elastic and plastic strain components, provides a good description of this fatigue behavior. The rapid crack growth with each cycle, caused by high strain amplitudes and decreased crack growth resistance, is shown in the steep fall in life-time. The fatigue life remains critically short and practically constant above 20 MPA, as seen by the flattening curve (Table 9 and Table 10). This suggests that fracture propagation is the dominant failure mode, with cracks leading to rupture very quickly after initiation.

Table 9.
Number of cycles to failure in the elastic regime for different pressures.

Table 10.
Number of cycles to failure in the plastic regime for different pressures.
5. Conclusions
This study explored the fatigue behavior of pipelines under cyclic internal pressure, focusing on how elastic and elastoplastic material responses influence crack propagation. Under purely elastic conditions, stress levels and stress intensity factors (SIF) remained moderate, leading to a relatively high estimated fatigue life. For instance, at 12 MPa, the maximum Von Mises stress reached 352.5 MPa, the SIF was 450 MPa·√mm, and the predicted fatigue life was approximately 1639 cycles. When elastoplastic behavior was considered, local plastic deformation around the crack tip significantly increased stresses and the size of the plastic zone. This resulted in enhanced crack-tip shielding and induced crack closure during unloading, temporarily reducing the effective stress intensity and slowing early-stage crack growth. However, under higher pressures such as 28 MPa, the maximum Von Mises stress rose to 850 MPa, the SIF reached 950 MPa·√mm, and the predicted fatigue life dropped to a single cycle, highlighting the strong influence of plasticity on crack propagation and fatigue resistance. A quantitative comparison with analytical solutions and previous studies confirmed the accuracy of the XFEM model. Our results closely match the longitudinal and hoop stresses reported by S. Montassir [23] and the experimental and numerical findings of H. Moustabchir [26], with relative differences below 3%. This agreement validates the model and demonstrates its reliability in predicting stress distribution and crack behavior under realistic operating conditions.
Overall, the study emphasizes the critical role of material plasticity, internal pressure, and crack closure in determining fatigue life. Neglecting these factors can lead to significant overestimation of pipeline durability. These findings provide a clear framework for assessing pipeline integrity and illustrate the effectiveness of XFEM in modeling complex crack geometries under cyclic loading.
Author Contributions
Conceptualization, A.B., M.E.M. and H.M.; Methodology, A.B., M.E.M. and H.M.; Software, A.B.; Validation, A.B., M.E.M., H.M., S.V. and M.L.S.; Formal analysis, A.B., S.V. and M.L.S.; Investigation, A.B., M.E.M. and H.M.; Resources, A.B. and M.E.M.; Data curation, A.B. and M.E.M.; Writing—original draft, A.B.; Writing—review and editing, S.V. and M.L.S.; Visualization, M.E.M., H.M., S.V. and M.L.S.; Supervision, H.M., S.V. and M.L.S.; Project administration, H.M.; Funding acquisition, S.V. and M.L.S. All authors have read and agreed to the published version of the manuscript.
Funding
The APC was funded by Transilvania University of Brasov HBS 2025/3452.
Data Availability Statement
The original contributions presented in the study are included in the article; further inquiries can be directed to the corresponding authors.
Conflicts of Interest
The authors declare no conflicts of interest.
References
- Hu, J.; Wang, Q.; Zhang, Y.; Meng, Z.; Zhang, J.; Fan, J. Numerical and Experimental Study on the Process of Filling Water in Pressurized Water Pipeline. Water 2023, 15, 2508. [Google Scholar] [CrossRef]
- Wu, J.; Wan, L.; Liu, H.; Liu, H.; Liang, B.; Ai, S.; Long, M. Fatigue Life Simulation of High-Pressure Injection-Production Pipeline Based on nCode DesignLife. Steel Res. Int. 2025, 96, 2400624. [Google Scholar] [CrossRef]
- Zhang, L.; Jiang, B.; Zhang, P.; Yan, H.; Xu, X.; Liu, R.; Tang, J.; Ren, C. Methods for fatigue-life estimation: A review of the current status and future trends. Nanotechnol. Precis. Eng. 2023, 6, 2. [Google Scholar] [CrossRef]
- Bencherif, N.; Slamene, A.; Hamza, B.; Trari, I.I.; Boudaib, I.; Mokhtari, M. Predictive plasticity unveiled: XFEM modeling of cyclic failure in pressurized straight pipelines under three-point bending. Mech. Based Des. Struct. Mach. 2025, 53, 3547–3571. [Google Scholar] [CrossRef]
- Kim, J.-S.; Kim, J.-Y. An efficient simplified elastic–plastic analysis procedure using engineering formulae for strain-based fatigue assessment of nuclear safety class 1 piping system subjected to severe seismic loads. Int. J. Fatigue 2021, 151, 106390. [Google Scholar] [CrossRef]
- Sager, R.; Curiel, F.; Holliday, C. Key Considerations for Elastic Finite-Element Modeling of Pipeline Dents for Fatigue Assessments. In Proceedings of the International Pipeline Conference, American Society of Mechanical Engineers, Calgary, AB, Canada, 26–30 September 2022. [Google Scholar]
- Wang, Z.; He, W.; Li, X.; Lu, T.; Chen, S.; Li, D.; Zheng, H. Phase field modelling of elastic-plastic fatigue fracture of oil and gas pipeline. Mater. Res. Express 2024, 11, 085504. [Google Scholar] [CrossRef]
- Bartaula, D.; Li, Y.; Koduru, S.; Adeeb, S. Simulation of fatigue crack growth using XFEM. In Proceedings of the Pressure Vessels and Piping Conference, American Society of Mechanical Engineers, Virtual, 3 August 2020. [Google Scholar]
- Gholami, H.; Shahrooi, S.; Shishehsaz, M. Strain-based fatigue life analysis of pipelines with external defects under cyclic internal pressure. J. Strain Anal. Eng. Des. 2021, 56, 313–326. [Google Scholar] [CrossRef]
- Mansor, N.I.I.; Abdullah, S.; Ariffin, A.K.; Syarif, J. A review of the fatigue failure mechanism of metallic materials under a corroded environment. Eng. Fail. Anal. 2014, 42, 353–365. [Google Scholar] [CrossRef]
- Joseph, S.H.; Leevers, S. Failure mechanics of uPVC cyclically pressurized water pipelines. J. Mater. Sci. 1985, 20, 237–245. [Google Scholar] [CrossRef]
- Kim, W.S. Fatigue Life Evaluation for the Repair Methods of High Pressure Gas Pipeline. In Proceedings of the International Conference on Offshore Mechanics and Arctic Engineering, American Society of Mechanical Engineers, Glasgow, UK, 9–14 June 2019. [Google Scholar]
- Wang, Y.; Javadi, A.A.; Fidelibus, C.; Liang, H. Improvements for the solution of crack evolution using extended finite element method. Sci. Rep. 2024, 14, 26924. [Google Scholar] [CrossRef] [PubMed]
- Deng, Q.-Y.; Zhu, S.-P.; He, J.-C.; Li, X.-K.; Carpinteri, A. Multiaxial fatigue under variable amplitude loadings: Review and solutions. Int. J. Struct. Integr. 2022, 13, 349–393. [Google Scholar] [CrossRef]
- Alshoaibi, A.M.; Fageehi, Y.A. A computational framework for 2D crack growth based on the adaptive finite element method. Appl. Sci. 2022, 13, 284. [Google Scholar] [CrossRef]
- Salmi, H.; Hachim, A.; El Bhilat, H.; El Had, K. Crack influence on a pipe with double slope under internal pressure: Numerical simulation with XFEM. IIUM Eng. J. 2020, 21, 266–283. [Google Scholar] [CrossRef]
- Merle, R.; Dolbow, J. Solving thermal and phase change problems with the extended finite element method. Comput. Mech. 2002, 28, 339–350. [Google Scholar] [CrossRef]
- Rahman, S.; Ghadiali, N.; Wilkowski, G.M.; Moberg, F.; Brickstad, B. Crack-opening-area analyses for circumferential through-wall cracks in pipes—Part III: Off-center cracks, restraint of bending, thickness transition and weld residual stresses. Int. J. Press. Vessel. Pip. 1998, 75, 397–415. [Google Scholar] [CrossRef]
- Kanth, S.A.; Harmain, G.A.; Jameel, A. Investigation of fatigue crack growth in engineering components containing different types of material irregularities by XFEM. Mech. Adv. Mater. Struct. 2022, 29, 3570–3587. [Google Scholar] [CrossRef]
- Yue, J.; Noda, N.; Ono, K. Effect of Cracks Shape on the Stress Intensity Factor for Cracks near a Bimaterial Interface. J.-Soc. Mater. Sci. Jpn. 2005, 54, 1060. [Google Scholar] [CrossRef]
- Li, Y.; Nagashima, T.; Nagai, M.; Shinko, T.; Miura, N. Fatigue crack propagation analysis using XFEM for cladded C (T) specimens and its validation. Mech. Eng. J. 2024, 11. [Google Scholar] [CrossRef]
- Kim, N.H.; Oh, C.S.; Kim, Y.J.; Kim, J.S.; Jerng, D.W.; Budden, J. Limit loads and fracture mechanics parameters for thick-walled pipes. Int. J. Press. Vessel. Pip. 2011, 88, 403–414. [Google Scholar] [CrossRef]
- Montassir, S.; Yakoubi, K.; Moustabchir, H.; Elkhalfi, A.; Rajak, D.K.; Pruncu, C.I. Analysis of crack behaviour in pipeline system using FAD diagram based on numerical simulation under XFEM. Appl. Sci. 2020, 10, 6129. [Google Scholar] [CrossRef]
- Yakoubi, K.; Montassir, S.; Moustabchir, H.; Elkhalfi, A.; Pruncu, C.I.; Arbaoui, J.; Farooq, M.U. An extended finite element method (XFEM) study on the elastic t-stress evaluations for a notch in a pipe steel exposed to internal pressure. Mathematics 2021, 9, 507. [Google Scholar] [CrossRef]
- Barkaoui, A.; El Moussaid, M.; Moustabchir, H. Numerical modelling and comparison of SIF in pipelines exposed to internal pressure with longitudinal crack using XFEM method. Appl. Comput. Sci. 2025, 21, 31–43. [Google Scholar] [CrossRef]
- Moustabchir, H.; Pruncu, C.I.; Azari, Z.; Hariri, S.; Dmytrakh, I. Fracture mechanics defect assessment diagram on pipe from steel P264GH with a notch. Int. J. Mech. Mater. Des. 2016, 12, 273–284. [Google Scholar] [CrossRef]
- Yu, M.-C.; Pan, W.-F. Failure of elliptical tubes with different long–short axis ratios under cyclic bending in different directions. Metals 2023, 13, 1891. [Google Scholar] [CrossRef]
- Wang, L.-X.; Wen, L.-F.; Tian, R.; Feng, C. Improved XFEM (IXFEM): Arbitrary multiple crack initiation, propagation and interaction analysis. Comput. Methods Appl. Mech. Eng. 2024, 421, 116791. [Google Scholar] [CrossRef]
- Khan, M.A.; Singh, S.S.K.; Abdullah, S.; Arifin, A.; Bashir, M. Fatigue life characterisation of API X65 steel pipeline for internal vibrational loads under sea water condition. Appl. Ocean. Res. 2025, 155, 104454. [Google Scholar] [CrossRef]
- Khakifirooz, M.; Fathi, M.; Lee, I.-C.; Tseng, S.-T. Neural ordinary differential equation for sequential optimal design of fatigue test under accelerated life test analysis. Reliab. Eng. Syst. Saf. 2023, 235, 109242. [Google Scholar] [CrossRef]
- Atanasiu, C.; Sorohan, Ş. Researches on the distribution of stresses in a wall girder with geometrical discontinuities. IOP Conf. Ser. Mater. Sci. Eng. 2020, 997, 012095. [Google Scholar] [CrossRef]
- Steinhoff, S.; Röscher, S.; Knobloch, M. Towards an advanced fatigue assessment of welded steel joints with multiaxial stress states. Ce/papers 2023, 6, 2589–2594. [Google Scholar] [CrossRef]
- McMeeking, R.M. Finite deformation analysis of crack-tip opening in elastic-plastic materials and implications for fracture. J. Mech. Phys. Solids 1977, 25, 357–381. [Google Scholar] [CrossRef]
- Cheng, L.; Yu, Z.; Liu, X. Elastoplastic Constitutive Model for Energy Dissipation and Crack Evolution in Rocks. Appl. Sci. 2025, 15, 4179. [Google Scholar] [CrossRef]
Disclaimer/Publisher’s Note: The statements, opinions and data contained in all publications are solely those of the individual author(s) and contributor(s) and not of MDPI and/or the editor(s). MDPI and/or the editor(s) disclaim responsibility for any injury to people or property resulting from any ideas, methods, instructions or products referred to in the content. |
© 2025 by the authors. Licensee MDPI, Basel, Switzerland. This article is an open access article distributed under the terms and conditions of the Creative Commons Attribution (CC BY) license (https://creativecommons.org/licenses/by/4.0/).