Article

Hyperparameter-Optimized RNN, LSTM, and GRU Models for Airline Stock Price Prediction: A Comparative Study on THYAO and PGSUS

1
Department of Industrial Engineering, Faculty of Engineering, Istanbul University-Cerrahpaşa, 34320 Istanbul, Turkey
2
Department of Educational Sciences, Hasan Ali Yucel Faculty of Education, Istanbul University-Cerrahpaşa, 34500 Istanbul, Turkey
3
Department of Engineering Science, Faculty of Engineering, Istanbul University-Cerrahpaşa, 34320 Istanbul, Turkey
*
Author to whom correspondence should be addressed.
Symmetry 2025, 17(11), 1905; https://doi.org/10.3390/sym17111905
Submission received: 13 October 2025 / Revised: 3 November 2025 / Accepted: 5 November 2025 / Published: 7 November 2025
(This article belongs to the Section Mathematics)

Abstract

Accurate stock price forecasting is crucial for supporting informed investment decisions, effective risk management, and the identification of profitable market opportunities. Financial time series present considerable challenges for prediction due to their complex, nonlinear dynamics and sensitivity to a wide range of economic factors. Although various statistical methods have been developed to model the multidimensional relationships inherent in such datasets, advancements in big data technologies have greatly facilitated the recording, analysis, and interpretation of large-scale financial data, thereby accelerating the adoption of deep learning (DL) algorithms in this domain. In the present study, RNN-, LSTM-, and GRU-based models were developed to forecast the closing prices of two airline stocks, with hyperparameter optimization conducted via the Bayesian optimization algorithm. The dataset consisted of daily closing prices of THYAO and PGSUS stocks obtained from Yahoo Finance. Comparative analysis demonstrated that the GRU model yielded the highest accuracy for THYAO stock price prediction, achieving a MAPE of 3.05% and an RMSE of 3.195, whereas for PGSUS, the model achieved a MAPE of 3.97% and an RMSE of 3.232. Beyond its empirical contribution, this study also emphasizes the conceptual relevance of symmetry in financial forecasting. The proposed deep learning framework captures the balanced relationships and nonlinear interactions inherent in stock market behavior, reflecting both symmetry and asymmetry in market responses to economic factors.

1. Introduction

The stock market serves as a crucial financial mechanism through which companies can raise capital and distribute dividends by offering their shares to the public [1]. Both individual and institutional investors participate in this market by purchasing stocks of companies they deem reliable and promising. The primary objective of these investors is to identify equities with the highest potential return and to formulate their investment strategies accordingly. The nonlinear and highly volatile nature of the stock market makes it very difficult to forecast prices or trends [2]. While proponents of the Efficient Market Hypothesis argue that past data can be used to predict future prices, views based on the Random Walk Theory argue that past data cannot provide meaningful predictions for the future.
Researchers and analysts conduct assessments to predict the future trends and values of stocks. These analyses generally fall into two main categories: fundamental analysis and technical analysis [3]. Fundamental analysis assesses a company’s financial health and long-term potential by examining data such as its financial statements, economic indicators, asset position and market share. Technical analysis, on the other hand, focuses on the past and current movements of share prices and aims to predict future price movements based on price, trading volume and supply-demand dynamics.
Stock market forecasts should take into account both market dynamics and the financial development potential of companies [4]. Technical indicators such as opening and closing prices, highs and lows, and trading volume are the most commonly used parameters to assess market performance. In order to assess the company’s growth potential, various financial indicators such as profitability, indebtedness, liquidity and growth rates derived from financial statements come to the fore. These indicators help investors predict a company’s long-term performance. Today, these analyses are supported by artificial intelligence and machine learning algorithms to provide more accurate and faster predictions.
The stock market’s complex structure, nonlinear relationships and high volatility make it difficult to make reliable forecasts. The aviation sector is subject to significant external risk factors such as oil-price and currency fluctuations, making airline stock returns particularly challenging to forecast [5]. Turkish evidence further shows that the long-term performance of airline shares is strongly influenced by macroeconomic variables such as energy prices and exchange rates [6]. Additionally, the sector’s exposure to global shocks such as geopolitical tensions, pandemics, and fuel market volatility makes its stock price behavior particularly dynamic and difficult to predict.
Before machine learning technologies became widespread, investors generally relied on fundamental and technical analysis methods [7]. However, with the increasing use of artificial intelligence-based applications in the financial field, neural network models based on deep learning have come to the forefront in stock forecasting [8,9]. These developments have made it possible to perform forecasting processes faster, automatically and with high accuracy. Today, forecasting models range from linear structures developed with traditional statistical methods to more flexible neural network-based models. Deep learning, in particular, has shown superior performance in capturing complex and hidden patterns in price movements thanks to its multilayer architecture. Time series specific models such as Long Short-Term Memory (LSTM) and Gated Recurrent Unit (GRU) significantly improve forecasting performance by learning long-term dependencies in historical data.
Machine learning models are generally based on two basic components: model parameters and hyperparameters [10]. Model parameters refer to the weights and bias values that are learned and updated from the data during the training process. Hyperparameters, on the other hand, are exogenous settings determined prior to training that directly affect the architecture of the model and the learning process. These hyperparameters can be kept constant during training or dynamically updated with strategies such as early stopping or learning rate reduction. In order to build an effective and generalizable machine learning model, it is critical to set the hyperparameters optimally.
Air transport, one of the strategic sub-components of the transportation sector, has gained significant momentum in recent years [11]. This growth is considered to be a reflection of countries’ economic development levels and social modernization processes on a global scale. Airline stocks not only reflect the performance of the transportation industry, but are also directly related to macroeconomic indicators such as economic growth, tourism activity, and trade volume. Therefore, the stock market performance of airlines serves as an important economic signal for investors and policymakers. Accurate prediction models improve the accuracy of investment decisions while also facilitating the management of sector-specific risks.
In this study, deep learning-based time series modeling approaches such as Recurrent Neural Network (RNN), Long Short-Term Memory and Gated Recurrent Unit are used to predict the closing prices of Turkish Airlines and Pegasus Airlines stocks. The models are trained with historical stock price data and future forecasts are generated on the allocated test dataset. For each method, hyperparameter optimization was performed and model configurations were adjusted to provide the best performance. The performance of the models was compared based on metrics such as accuracy, error rate and generalizability. In this context, the main contribution of this study is to systematically reveal the effects of different RNN architectures and hyperparameter optimization on airline stock price prediction performance. In addition, the findings provide empirical evidence to the literature on the effectiveness of deep learning and optimization techniques in financial time series prediction.
This article is structured as follows: Following the introduction, Section 2 (Related Works) reviews the literature on stock price prediction models, with a particular focus on studies related to airline stock forecasting. Section 3 (Materials and Methods) presents the proposed prediction models, dataset, and methodological framework, including relevant mathematical formulations. In Section 4 (Results and Analysis), the forecasting performance of the models applied to THYAO and PGSUS stock prices is evaluated and compared through tables and graphical representations. Finally, Section 5 (Conclusions) summarizes the key findings and provides concluding remarks regarding this study.

2. Related Works

A review of the literature reveals that there is a wealth of diverse studies in the field of financial data forecasting. Some of these studies evaluate the forecasting problem in terms of input–output relationships, while others approach the process in the context of time series analysis, taking into account time-dependent dependencies between data. These differences in approach significantly affect the types of models used and the nature of the results obtained. Chang et al. [12] conducted an analysis of price forecasting using stock time series data from Apple, Amazon, Google, and Microsoft. In the study, complex patterns within economic datasets were analyzed through modeling based on data from large technology companies. In another study, a multi-step time series forecasting model was applied using data from the National Stock Exchange and Bombay Stock Exchange for the oil drilling and exploration and refinery sectors [13]. In an input–output-based study, stock price predictions were made using data obtained from the Chinese (SSEC), Hong Kong (HSI), and US (S&P 500, DJI) stock exchanges. The prediction model used various technical indicators as inputs, including price change, relative strength index, moving average convergence divergence, stochastic oscillator, directional movement index, ultimate oscillator, time series forecast, on-balance volume, variance, beta coefficient, and some double exponential moving averages [14]. In a study conducted in 2021, gold and crude oil price indicators were used as input variables to predict the stock prices of the S&P 500 index [15].
A review of studies on stock price forecasting reveals that researchers have adopted different methodological approaches. Some studies use traditional statistical methods for forecasting, while others use machine learning algorithms. Mashadihasanli [16] used the Autoregressive Integrated Moving Average (ARIMA) model to predict the Istanbul stock market price index for the period 2009–2021. The model proposed in this study showed a prediction performance of 5.7% for static forecast and 11.6% for dynamic forecast in terms of Mean Absolute Percentage Error (MAPE) values. In another study using statistical methods, Facebook Prophet and SARIMA models were applied using Indonesian stock price data from different sectors [17]. According to the comparison results, the seasonal ARIMA (SARIMA) model outperformed the Prophet model in terms of prediction performance. In a regression-based study conducted in 2018, a support vector regression (SVR) model was applied to predict stock prices in Brazil, the United States, and China [18]. The study compared different kernel functions; according to the results obtained, the linear kernel showed higher prediction performance compared to the radial basis and polynomial kernel functions. There are two main approaches commonly used in machine learning models: tree-based methods and neural network-based methods. These methods are preferred for their advantages depending on different data structures and prediction problems. In their work, Gorde and Borkar [19] used the Random Forest (RF) regression model to predict S&P 500 and NIFTY 50 stocks. The findings revealed that the RF-based model performed better than LSTM, while the linear regression model provided superior prediction accuracy compared to both models. In another study aimed at predicting closing prices, the Extreme Gradient Boosting (XGBoost) regression model, one of the gradient boosting algorithms, was used [20]. This model stands out for its ability to learn complex data patterns and its high prediction accuracy. Ecer et al. [21] employed the Multilayer Perceptron (MLP) method to predict the movements of the Borsa Istanbul 100 (BIST100) index. The model, enhanced with a metaheuristic optimization technique, achieved a Root Mean Squared Error (RMSE) of 0.732 and a MAPE of 28.16%. In another stock price forecasting study, a neural network model was employed in combination with fuzzy logic to handle uncertainty in the data [22]. Using Type-2 fuzzy time series models, the researchers achieved a MAPE value below 2%, indicating high predictive accuracy under uncertain conditions.
In recent years, there has been an increasing trend toward using DL methods to better model the nonlinear and dynamic structure of financial time series. In their 2020 study, Sunny et al. [23] conducted a stock price forecasting analysis using Google stock market data. By applying the LSTM method with varying numbers of layers, they achieved a remarkably low RMSE value, significantly below 0.001, demonstrating the model’s high predictive accuracy. In another stock price forecasting study, LSTM and GRU architectures were compared in terms of predictive performance [24]. The GRU model outperformed the LSTM, achieving a lower RMSE value of 0.022. Some researchers have employed DL hybrid models to enhance the accuracy and robustness of stock price forecasting. In a study conducted in 2020, a hybrid Convolutional Neural Network–Long Short-Term Memory (CNN–LSTM) model was employed for stock price forecasting [25]. According to the results, the proposed hybrid architecture outperformed both standalone LSTM and Convolutional Neural Network (CNN) models in terms of Mean Absolute Error (MAE), RMSE, and Coefficient of Determination (R2) evaluation metrics. In another study utilizing a hybrid model, an integrated architecture combining CNN, Bidirectional Long Short-Term Memory (BiLSTM), and an attention mechanism was proposed [26]. The model demonstrated superior performance compared to individual methods when applied to stock price data from three different Chinese indexes. Moreover, recent Transformer-based approaches have also shown strong performance in financial forecasting, such as the Linear Transformer with multiplex attention proposed by [27] and the multi-perspective Transformer framework developed by [28].
In this study, deep learning-based models were employed for stock price forecasting. To provide a broader context and highlight the relevance of the proposed approach, a comprehensive review of recent studies in this domain was conducted. The findings from these studies, which reflect the latest developments and methodological advancements in deep learning-driven financial forecasting, are summarized in Table 1.
Hyperparameter optimization plays a critical role in enhancing the predictive performance and generalization capability of deep learning models. Several studies have specifically focused on hyperparameter-tuned architectures, demonstrating that models with optimized configurations often outperform their default counterparts. In their study, Singh et al. [43] compared Randomized Search, Grid Search, and Bayesian Optimization algorithms for hyperparameter tuning of a deep learning model developed for forecasting various stock prices. In another study, the hyperparameters of an RNN-based model developed for forecasting the Nifty 50 index movements were optimized using the Particle Swarm Optimization (PSO) algorithm [44]. In their study, Chung and Shin [45] utilized a metaheuristic approach by employing a Genetic Algorithm to optimize an LSTM model for forecasting the Korea Stock Price Index (KOSPI).

3. Materials and Methods

3.1. Deep Learning-Based Stock Price Prediction Model

In this study, stock price forecasting was performed using time series data for Turkish Airlines (THY) and Pegasus Airlines (PY) shares. The dataset was created from the daily closing prices of THY and PY shares traded on the Istanbul Stock Exchange between 1 January 2020, and 31 December 2022. A total of 743 trading days were observed during this three-year period. The dataset was divided into three parts: 70% for training, 10% for validation, and 20% for testing, while the testing set was used to evaluate the prediction performance during the testing phase.
During the model training phase, a supervised learning approach was employed, whereby the time series data were segmented into rolling windows of 10 consecutive days to generate input–output pairs for predicting the 11th day. For instance, the closing price on day 11 was forecasted based on data from days 1 to 10, while the closing price on day 12 was predicted using data from days 2 to 11. In this configuration, each model was trained using a sliding window of historical observations and evaluated on subsequent unseen periods, ensuring realistic trading dynamics and avoiding look-ahead bias. The 10-day configuration provided a balanced trade-off between sensitivity to short-term fluctuations and overall prediction stability, consistent with prior financial forecasting studies [46,47]. The trained prediction model, developed using this sliding-window framework, was subsequently evaluated over the remaining 149-day test period beginning from day 595.
Three different deep learning-based artificial neural network architectures were used to model the dynamic structure of time series data: Recurrent Neural Network, Gated Recurrent Unit, and Long Short-Term Memory. These models aim to provide effective prediction performance on financial data thanks to their ability to learn sequential dependencies. The stock price prediction model is as shown in Figure 1.
The baseline architectures for the RNN, GRU, and LSTM models consisted of an input layer, followed by a hidden layer with 50 units, a Dropout layer with a rate of 0.2, a second hidden layer with 50 units, and another Dropout layer with a rate of 0.2. The Adam optimizer was employed for training, and the Rectified Linear Unit (ReLU) function was used as the activation function.

3.2. RNN

Recurrent Neural Networks (RNNs) are a class of neural networks specifically designed to model sequential data with temporal dependencies, such as time series, speech, or natural language [48]. Unlike feed-forward networks, RNNs incorporate both current and past inputs to capture contextual information over time. Depending on the task, different input–output structures are used. For time series forecasting, many-to-many or many-to-one configurations are commonly preferred, where input and output sequence lengths often differ based on the prediction horizon.
Figure 2 illustrates the learning mechanism of RNNs, where weight updates across time steps introduce complexity and long-term dependencies. As shown in Equations (1) and (2), the recurrent structure with self-feedback connections allows RNNs to model sequential data by updating the hidden state ht based on both the current input xt and the previous hidden state ht−1. The output ot is then computed as a function of ht, enabling the network to capture temporal relationships more effectively than traditional feed-forward models [49].
h t = σ ( W x t + U h t 1 + b )
o t = V h t
here, W represents the input-to-hidden weight matrix connecting the current input xt to the hidden state ht, U denotes the hidden-to-hidden recurrent weight matrix connecting the previous hidden state ht−1 to the current hidden state, and V corresponds to the hidden-to-output weight matrix that maps ht to the output ot, b is the bias term, and σ is the activation function.

3.3. LSTM

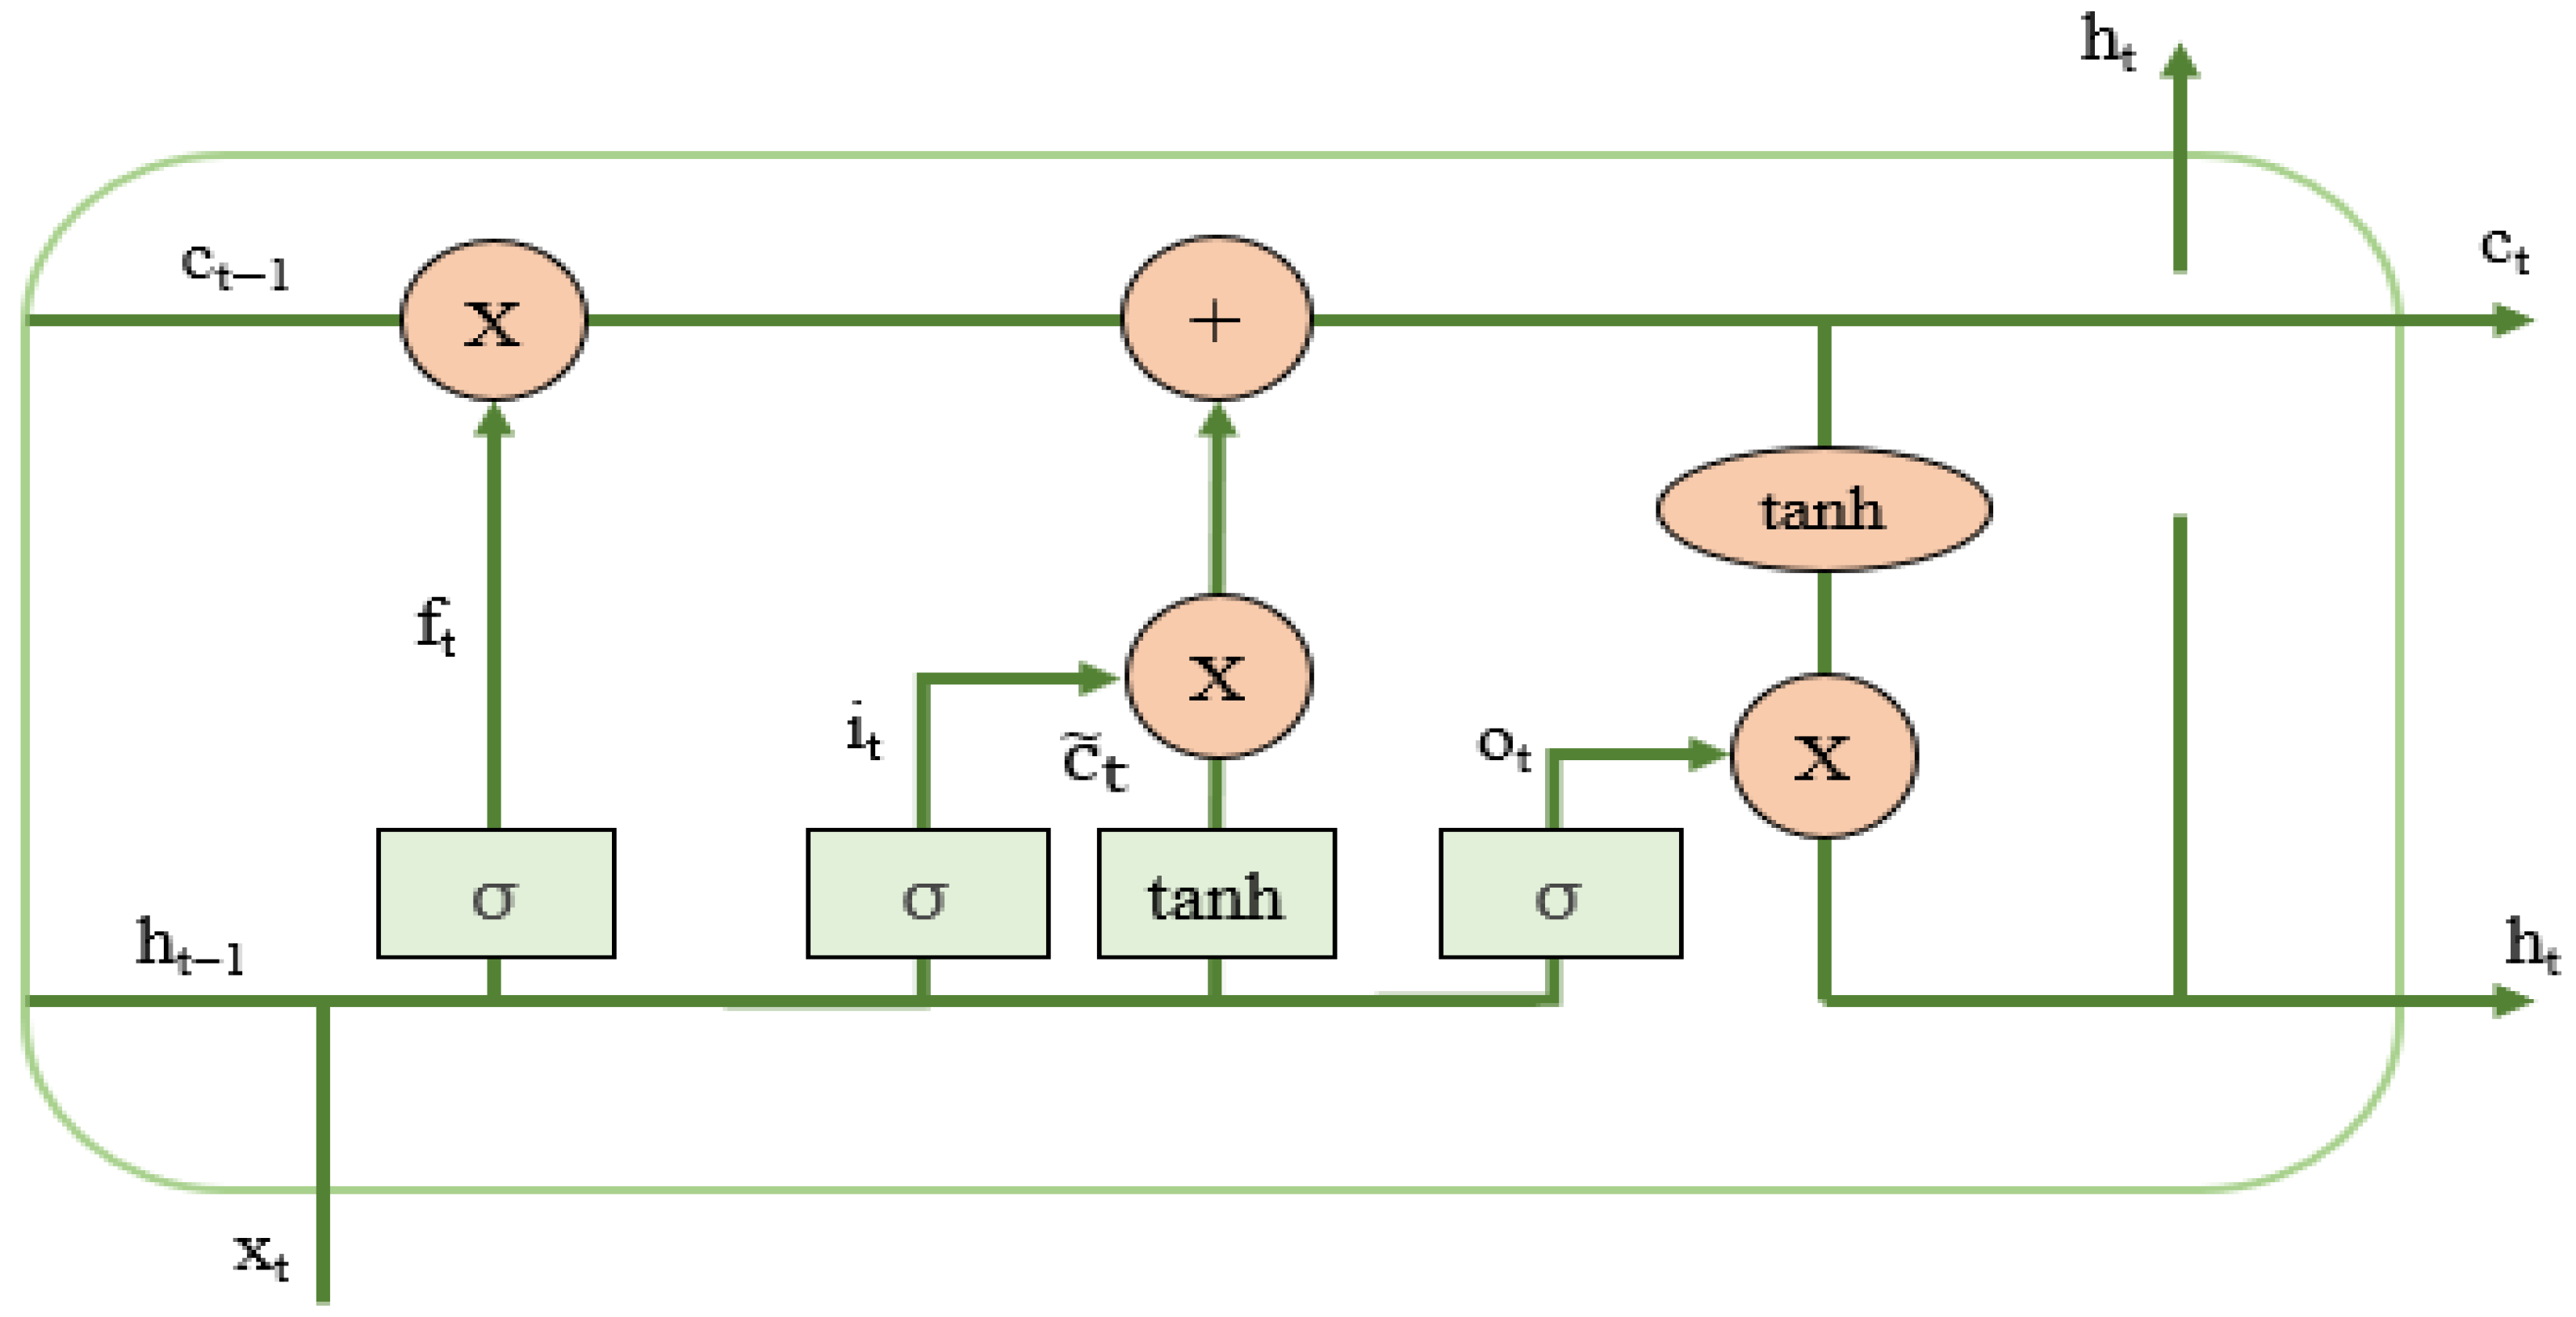
Among various RNN architectures, the Long Short-Term Memory network stands out for its ability to effectively capture long-term dependencies in time series data through its specialized memory cells [50]. Originally proposed by Hochreiter and Schmidhuber [51], LSTM addresses the vanishing gradient problem inherent in standard RNNs when modeling extended temporal contexts. This is achieved by maintaining constant error flow via gated mechanisms—input, output, and forget gates—that regulate the preservation or update of information within the network. Consequently, LSTM enhances conventional RNNs by enabling more accurate modeling of dependencies with substantial temporal gaps. The LSTM model architecture is as shown in Figure 3.
At time step t, xt represents the LSTM input, ht−1 is the previous hidden state, ct is the current cell state, and ht is the current hidden state. The computation proceeds as follows [52]:
  • Candidate Cell State:
c ~ t = t a n h   ( W c h t 1 , x t + b c )
2.
Input Gate: Controls how much of the candidate cell state is added:
i t = σ   ( W i h t 1 , x t + b i )
3.
Forget Gate: Regulates how much of the previous cell state is retained:
f t = σ   ( W f h t 1 , x t + b f )
4.
Cell State Update:
c t = f t c t 1 + i t c ~ t
5.
Output Gate: Determines the hidden state output:
o t = σ   ( W o h t 1 , x t + b o )
6.
Hidden State Calculation:
h t = o t t a n h   ( c t )
This architecture enables LSTMs to selectively store, update, and output information over long sequences, effectively mitigating the vanishing gradient problem.

3.4. GRU

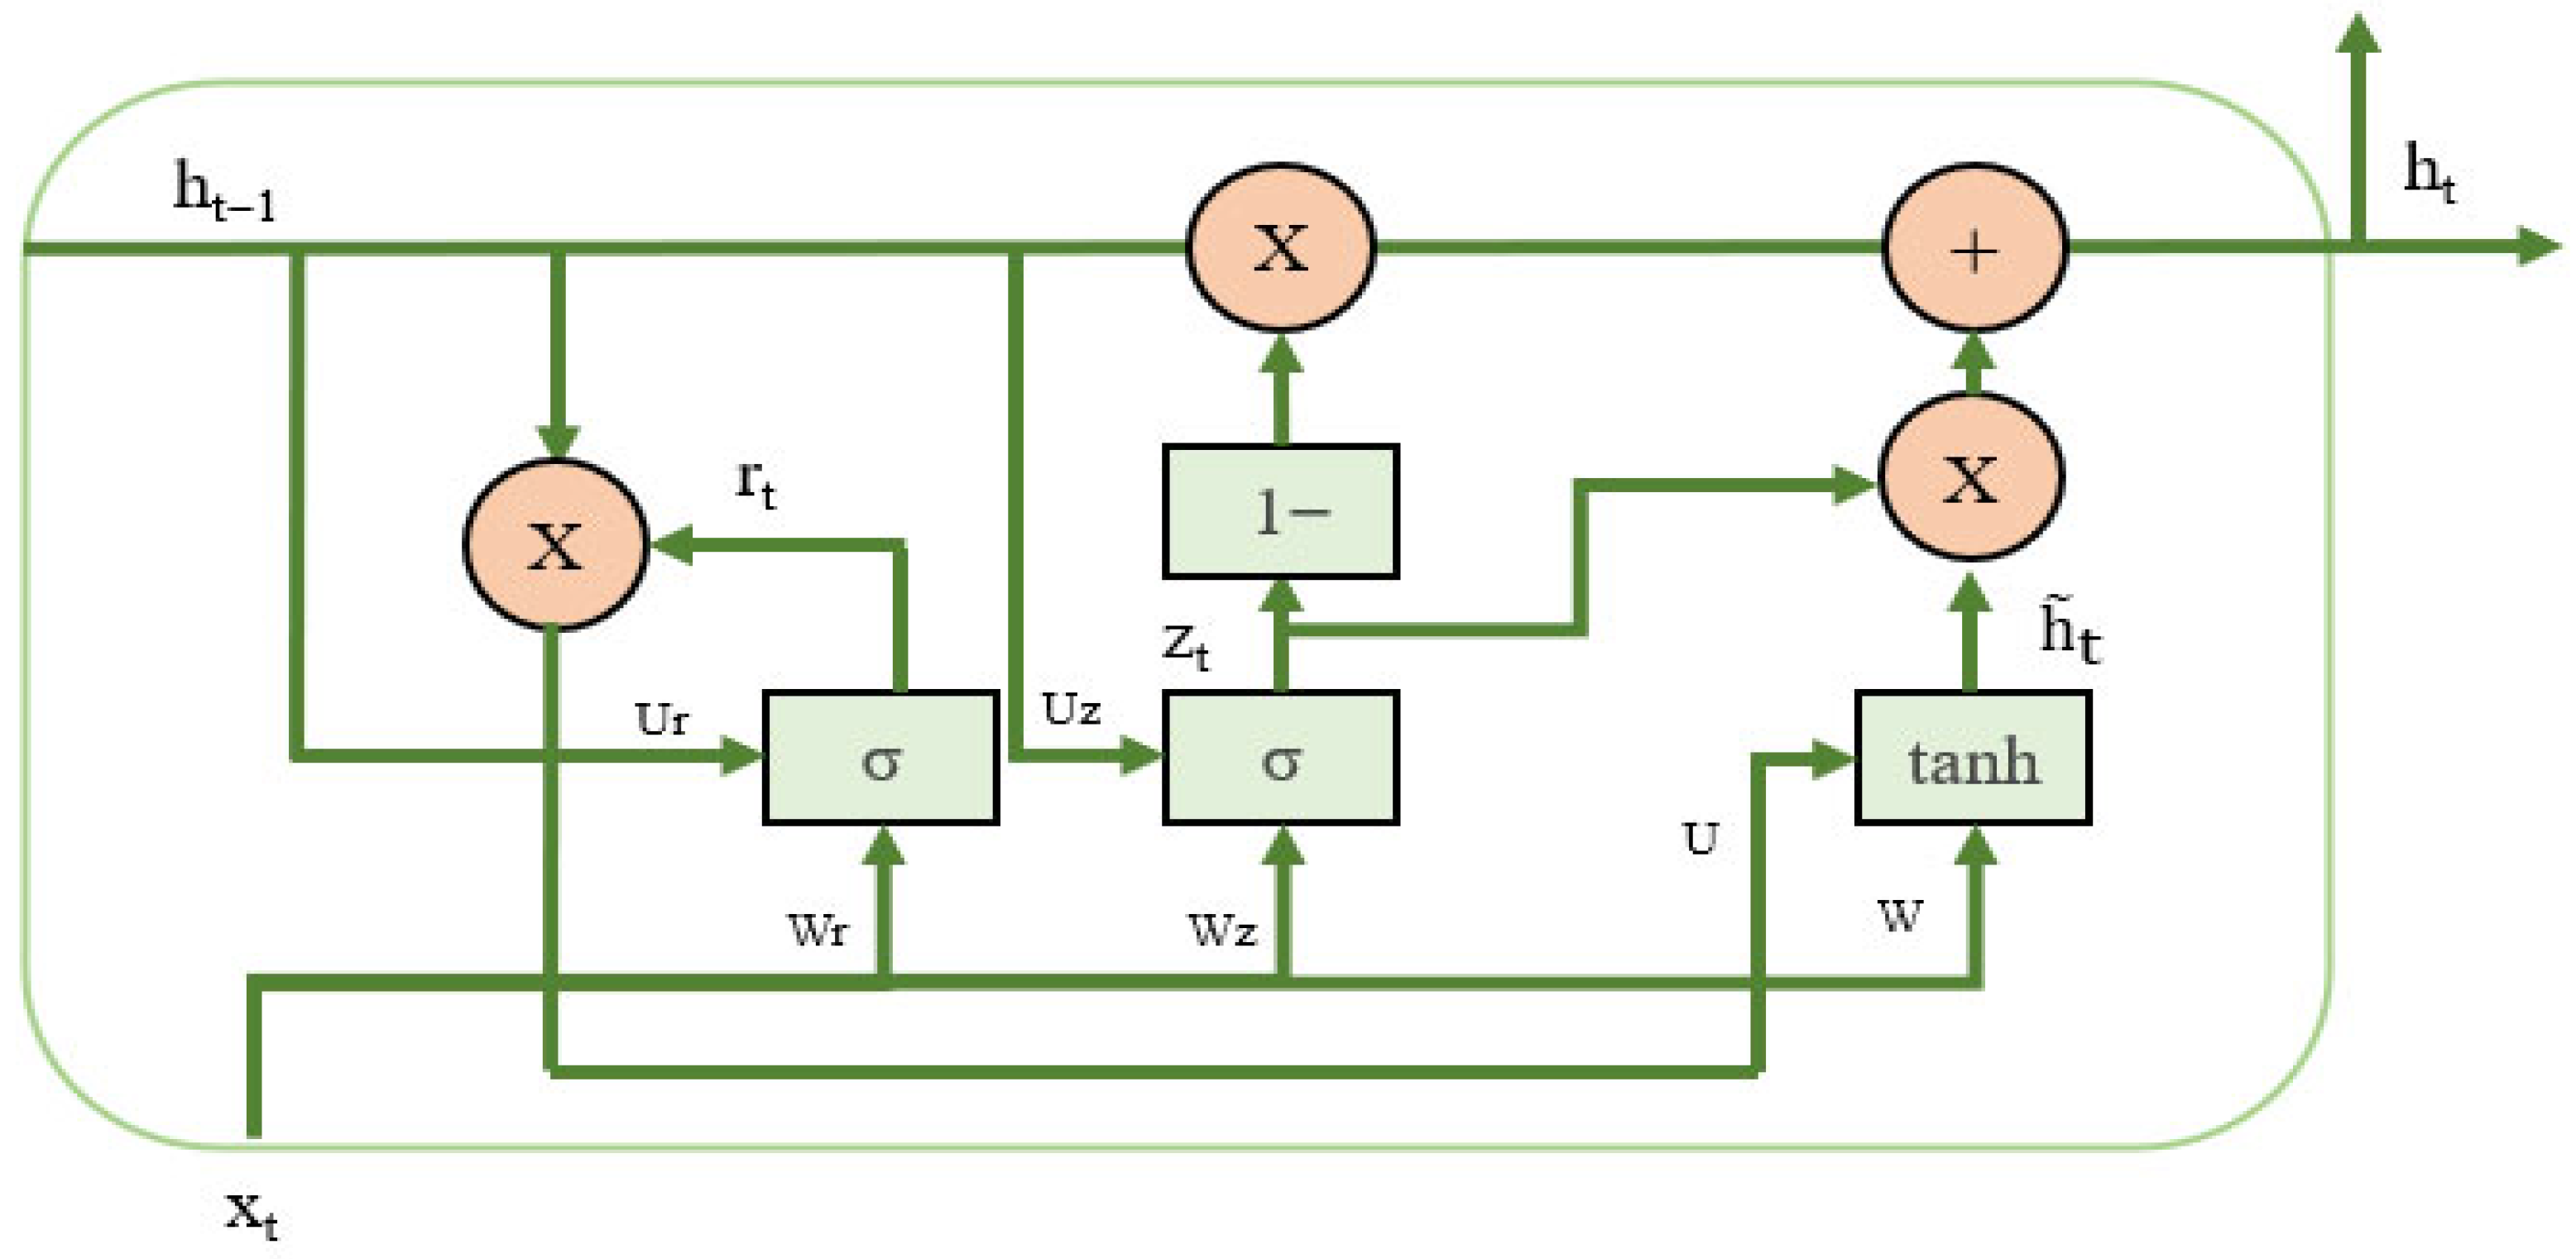
The Gated Recurrent Unit is a widely used enhancement of the RNN, designed as a streamlined alternative to LSTM architecture [53]. Structurally similar to LSTM, the GRU merges the input and forget gates into a single update gate, which regulates the retention of past information in the current state. Alongside, the reset gate determines how much of the previous information is combined with the current input. Unlike LSTM, the GRU integrates the cell state and hidden state into a single representation, reducing the number of parameters. This reduction improves computational efficiency and accelerates convergence, often without compromising predictive accuracy making GRUs an attractive choice in practical applications [54]. The GRU model architecture is as illustrated in Figure 4.
The functioning of a GRU cell is governed by the following equations [55]:
z t = σ ( x t W z + h t 1 U z + b z )
r t = σ ( x t W r + h t 1 U r + b r )
h ~ t = t a n h   ( ( r t h t 1 ) U + x t W + b )
h t = 1 z t h ~ t + z t h t 1
here, Wz, Wr, and W denote the weight matrices for the input vector, while Uz, Ur, and U correspond to the weight matrices for the previous hidden state. bz, br, and b are bias terms, σ is the sigmoid activation function, and h ~ t is the candidate hidden state. The update gate zt regulates the balance between preserving past information and incorporating new input, whereas the reset gate rt determines the degree of dependency on prior hidden states.

3.5. Hyperparameter Optimization

The performance of deep learning models depends largely on correctly defined hyperparameters. Hyperparameters such as the number of layers, learning rate, batch size, activation functions, and dropout rate directly affect both the learning capacity and generalizability of the model. Hyperparameters that are not properly optimized can lead to problems such as overfitting, underfitting, or inefficient progress during the training process. Therefore, hyperparameter optimization plays a critical role in improving the performance metrics of deep learning models, such as accuracy, training time, and stability. Today, various methods such as grid search [56], random search [57], Bayesian optimization [58], and genetic algorithms [59] are used for automatic hyperparameter optimization, significantly improving model performance.
In this study, Bayesian Optimization (BO) was employed to efficiently tune the hyperparameters of RNN, GRU, and LSTM models. The optimization process evaluated multiple two-layer model configurations, and the one achieving the lowest validation loss was selected as the best-performing architecture. BO adaptively updates its search strategy based on prior results, allowing faster convergence to promising hyperparameter regions. The search was conducted using the Keras Tuner framework, with a maximum of 30 trials defined to explore the search space and identify the optimal configuration for each model.
A review of the relevant literature shows that dropout rates are generally used within similar ranges, whereas the number of hidden units varies across studies [46,60,61]. Considering both computational efficiency and consistency with prior research, specific unit values were selected to define the search space presented in Table 2. The listed values correspond to categorical choices, and the optimization solver was applied globally.
Bayesian Optimization (BO) is a widely used iterative method for hyperparameter optimization (HPO) problems. It selects the next evaluation points based on previously observed results, using a surrogate model and an acquisition function [62]. The surrogate model fits the current observations to the objective function, while the acquisition function balances exploration and exploitation to guide the search. Through this balance, BO explores unvisited regions of the search space while also refining the most promising areas, aiming to efficiently identify optimal configurations. BO algorithm is shown in Algorithm 1, where D1:t1 denotes the training dataset consisting of t–1 samples of function f [63].
Algorithm 1: Bayesian Optimization
for t = 1,2,3…
Determine xt by optimizing the acquisition function u on function f:
               x t = arg max x   u ( x | D 1 : t 1 )
yt = f(xt)
Augment the data D1:t = {D1:t−1, (xt,yt)} and update the posterior of function f
End for

3.6. Evaluation Metrics

In comparing the base models and the models obtained after hyperparameter optimization, various error measurement metrics were used due to the adoption of a regression-based approach. In this context, Mean Squared Error (MSE), Root Mean Squared Error (RMSE), Mean Absolute Error (MAE), Median Absolute Error (MedAE), and Mean Absolute Percentage Error (MAPE) were selected as performance evaluation criteria. MAE and MedAE, in particular, reduce the impact of outliers and reflect central error trends in a more balanced manner; RMSE, on the other hand, assigns higher weights to large errors, thereby accurately highlighting critical deviations in the model’s predictions. MAPE facilitates comparisons between datasets of different scales by presenting the error rate as a percentage. The mathematical expressions for these error metrics are presented in Equations (13)–(17).
M S E = 1 n i = 1 n ( a i p i ) 2
R M S E = 1 n i = 1 n ( a i p i ) 2
M A E = 1 n i = 1 n a i p i
M e d A E = m e d i a n ( a 1 p 1 ,   a 2 p 2 ,   ,   a n p n )
M A P E = 100 % n i = 1 n a i p i a i
where ai denotes the actual value, pi represents the predicted value, and n refers to the total number of observations.

4. Results and Analysis

In this study, recurrent neural network-based prediction models were developed to predict the closing stock prices of THYAO and PGSUS. In this study, the basic RNN, LSTM, and GRU models were compared with their hyperparameter-optimized versions using the Bayesian optimization algorithm. The performance of the models was evaluated using the MSE, RMSE, MAE, MedAE, and MAPE metrics.
The model was implemented using Python (version 3.11.5) on the Ubuntu 22.04.5 operating system. The hardware configuration included an Intel Core i5-10400F processor with a 12 MB cache and 24.0 GB of system memory. All computations were performed on the CPU. For the neural network implementation, the TensorFlow library (version 2.17.0) was utilized, while performance metrics were computed using the Scikit-learn library (version 1.5.2).
As a result of hyperparameter optimization performed for THYAO stock prediction, the most suitable layer structures, activation functions, dropout rates, and optimization algorithms were determined for the RNN, LSTM, and GRU models. The RNN model demonstrated the best performance using the Adam optimization algorithm, with a two-layer architecture consisting of 50 and 64 neurons, respectively, using the ReLU activation function and dropout rates of 0.2 and 0.4. The LSTM model achieved optimal performance with 96 and 128 neurons in the first and second layers, both using the tanh activation function, dropout rates of 0.3 and 0.4, and the Adam optimizer. Finally, the GRU model yielded the best results with two layers of 128 neurons, both employing the tanh activation function and dropout rates of 0.2, optimized using the Adam algorithm.
Similarly, in the optimization process for the PGSUS stock prediction, the RNN model achieved the best results with a two-layer structure consisting of 50 and 64 neurons, both using the ReLU activation function, dropout rates of 0.2 and 0.4, and the Adam optimizer. The LSTM model performed optimally with two layers of 128 neurons, both employing the tanh activation function, dropout rates of 0.4, and the Adam optimization algorithm. The GRU model also provided effective results with 50 and 128 neurons in the first and second layers, respectively, using the tanh activation function, dropout rates of 0.2 and 0.4, and the Adam optimizer. These results indicate that the choice of model architecture and hyperparameter configuration has a decisive influence on forecasting performance for both stocks.
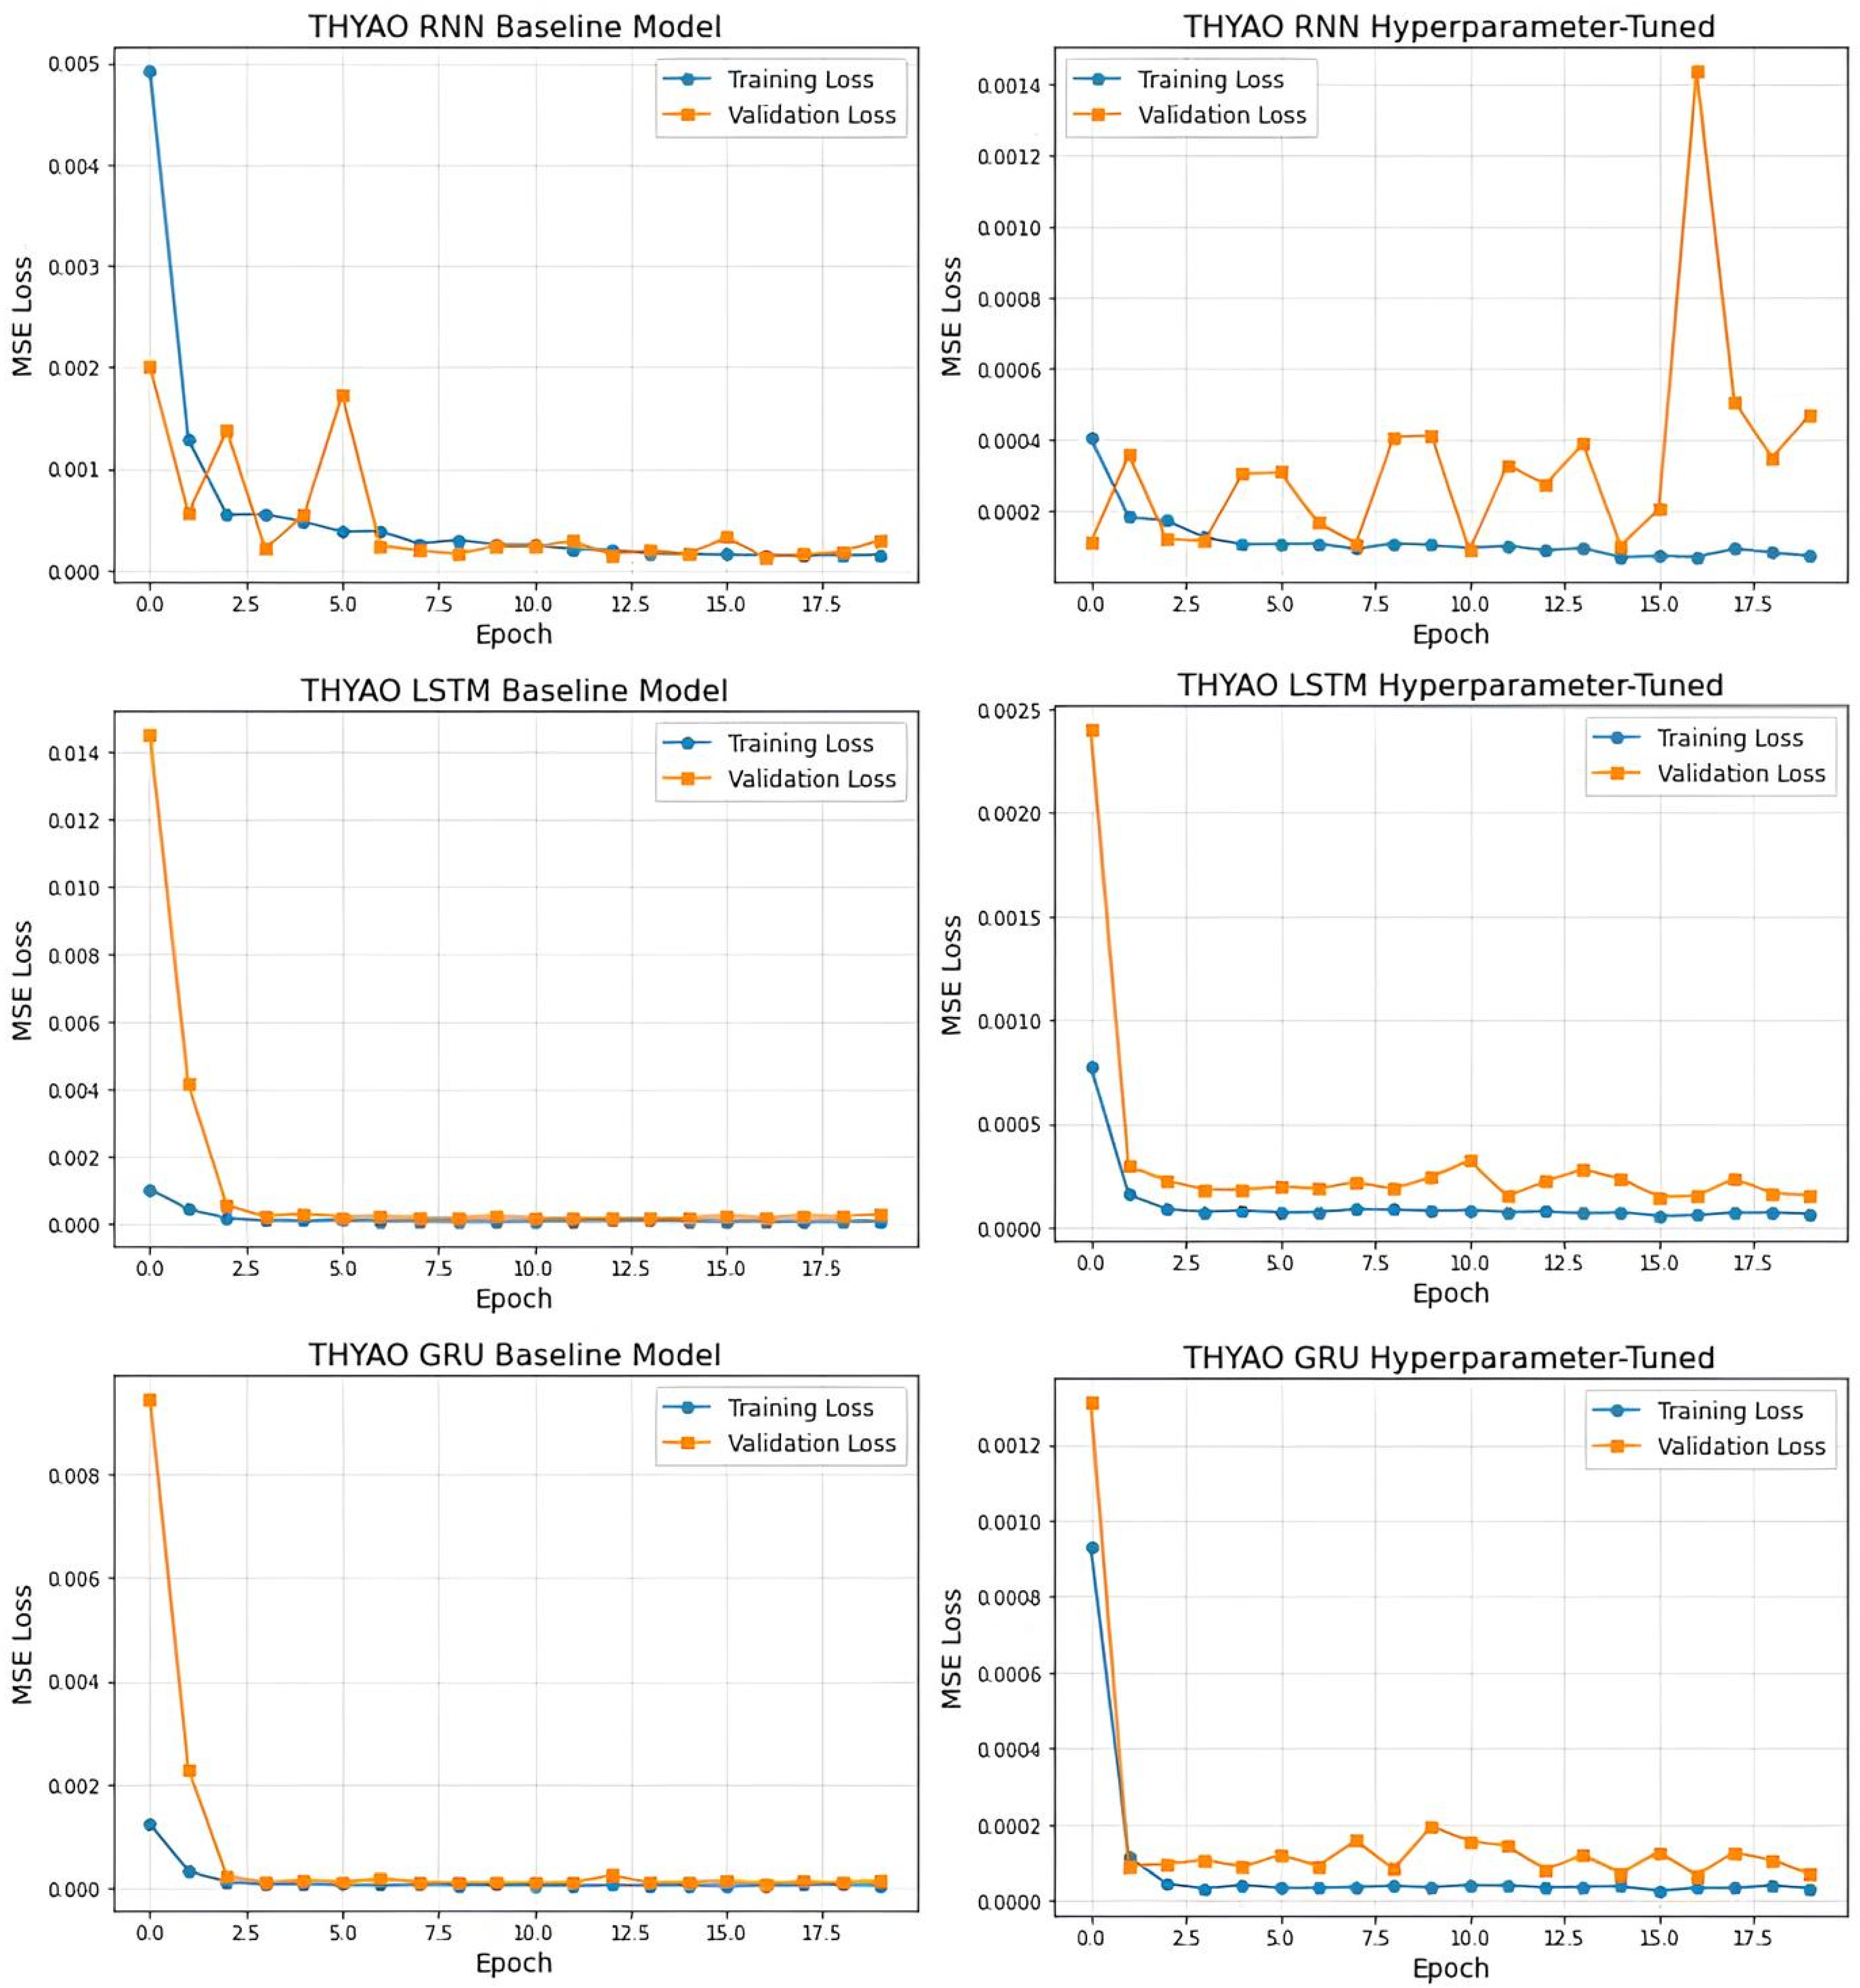
The stock closing price prediction dataset for THYAO and PGSUS is split into 70% training, 10% validation, and 20% testing. According to the loss–epoch graphs of baseline and hyperparameter-optimized models, as seen in Figure 5 and Figure 6, baseline models generally performed more consistently and with lower losses. Specifically, in the basic versions of GRU and LSTM, training and validation losses rapidly decreased after a few epochs and stabilized at a consistent level. In contrast, periodic fluctuations were observed in the validation losses of hyperparameter-optimized models, indicating that the model was more sensitive to the validation data. Nevertheless, overall loss levels remained low, and GRU models demonstrated the most reliable performance in terms of both convergence speed and validation loss stability across both datasets.
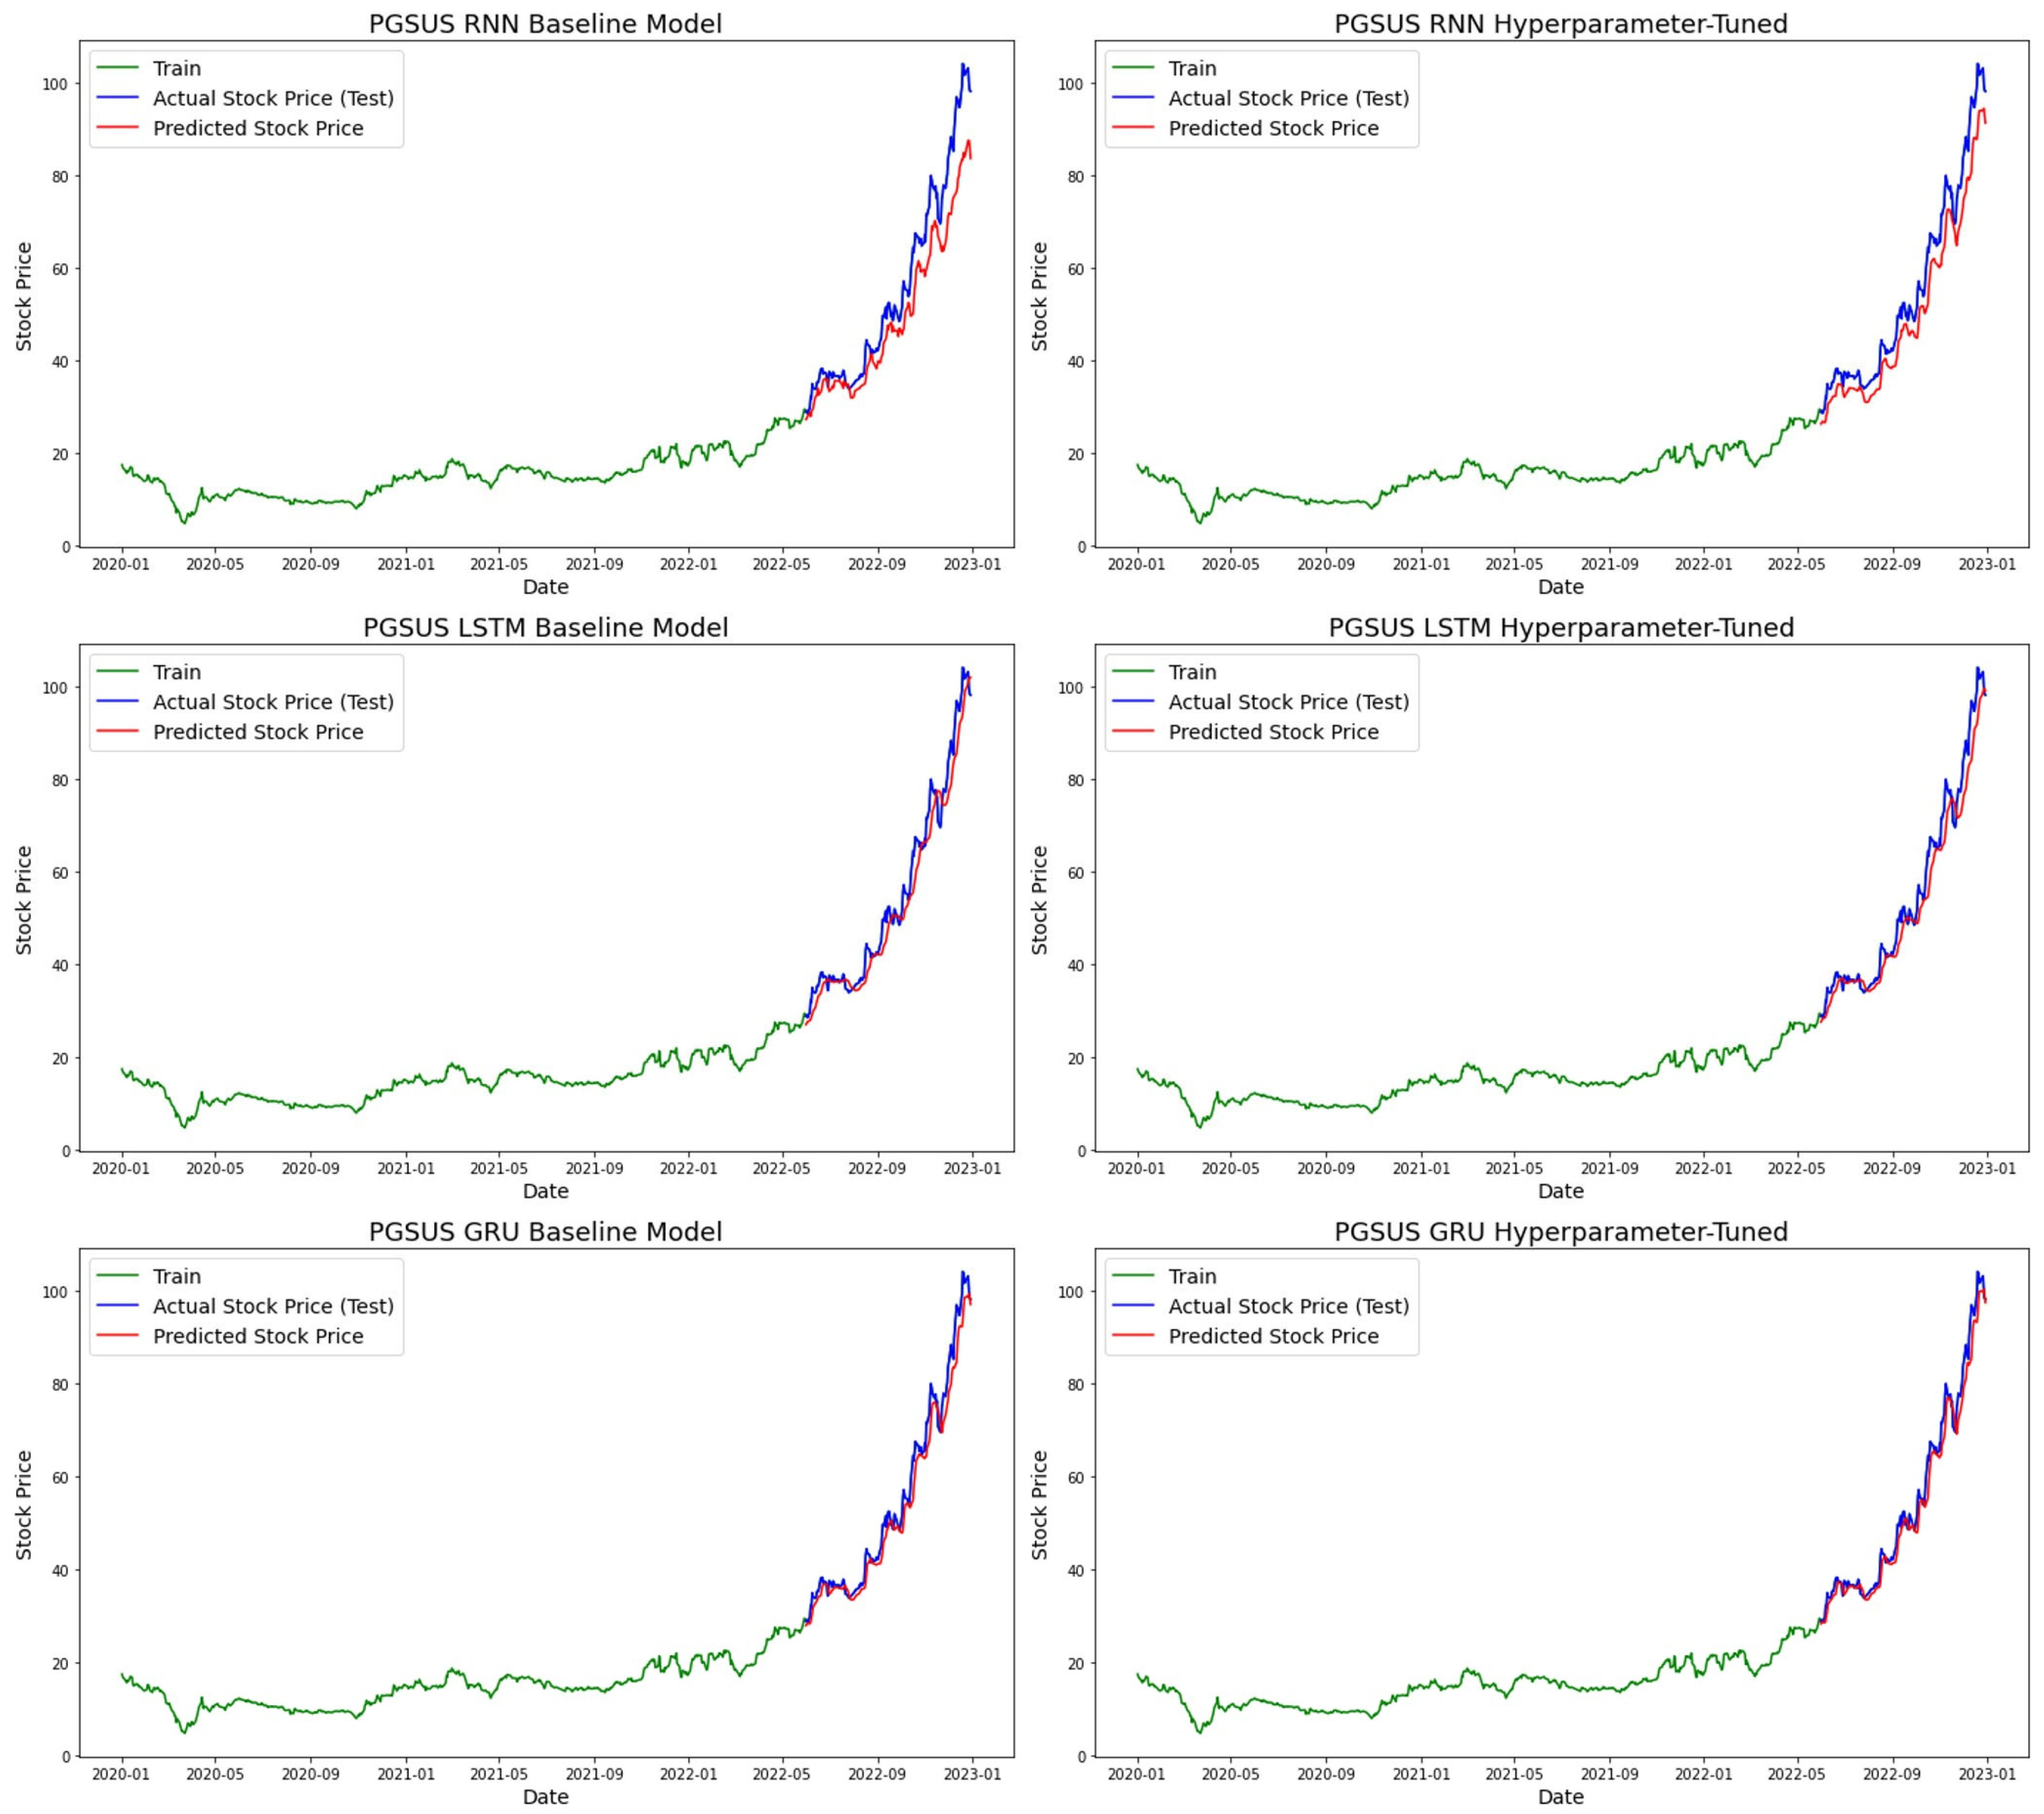
Stock closing price prediction results are presented in Figure 7 and Figure 8. According to the graphs, all models successfully captured the general trend, but the prediction performance of LSTM and GRU models showed higher accuracy compared to RNN. In particular, the GRU model was the fastest to react to trend changes by closely tracking the actual values for both THYAO and PGSUS stocks. The LSTM model similarly exhibited high adaptive capacity, while the RNN models showed partial delays in capturing the trend peaks in certain periods. These results indicate that GRU and LSTM architectures can capture sequential patterns and short-term dependencies in time series more effectively than RNN.
Table 3 summarizes the performance of baseline and hyperparameter-tuned RNN, LSTM, and GRU models in predicting THYAO stock prices, evaluated using MSE, RMSE, MAE, MedAE, and MAPE. The results show that hyperparameter tuning improved the performance of all models. For the RNN model, RMSE decreased from 10.956 to 8.712, MAE from 8.653 to 7.614, MedAE from 6.031 to 6.552, and MAPE from 9.390% to 9.060%. In the LSTM model, tuning led to a consistent reduction in errors, lowering RMSE from 4.630 to 3.933, MAE from 3.396 to 2.973, MedAE from 2.363 to 2.297, and MAPE from 4.200% to 3.650%. The GRU model achieved the best overall performance after hyperparameter tuning, with RMSE reduced to 3.195, MAE to 2.432, MedAE to 1.878, and MAPE to 3.050%. These findings indicate that GRU was the most accurate and stable model for THYAO stock price prediction, while hyperparameter optimization further enhanced the generalization capability across all architectures.
Table 4 presents the performance of baseline and hyperparameter-tuned RNN, LSTM, and GRU models for PGSUS stock price prediction. For the RNN model, hyperparameter tuning led to a clear improvement, reducing RMSE from 8.123 to 6.073 and MAPE from 9.790% to 9.270%. The LSTM model showed comparable performance across configurations, with a slight change in RMSE (from 4.135 to 4.380) and MAPE (from 5.560% to 5.460%). The GRU model achieved the best results overall in its hyperparameter-tuned configuration, yielding the lowest RMSE of 3.232 and MAPE of 3.970%. These findings confirm that GRU provided the most accurate and stable forecasts for PGSUS stock prices, while tuning offered moderate yet consistent performance gains across all architectures.
The results presented in Table 5 and Table 6 show the statistical comparisons of 10 repeated experiments conducted with the same random seed. In the comparisons, the Wilcoxon Signed-Rank test, a nonparametric method, was applied because the data did not meet the assumptions of parametric tests. In this context, the null hypothesis (H0) was defined as “there is no significant difference between the two models in terms of performance metrics,” and the alternative hypothesis (H1) was defined as “there is a significant difference between the two models in terms of performance metrics”.
According to the results obtained for the THYAO data, the Tuned GRU model demonstrated significantly better performance in terms of MAPE and RMSE values compared to both the LSTM (Tuned) and RNN (Tuned) models (p < 0.05). In this case, the H0 hypothesis was rejected, and the H1 hypothesis was accepted. That is, there is a statistically significant difference between the Tuned GRU model and the other models in terms of performance metrics. However, when comparing the GRU (Baseline) model with the GRU (Tuned) model, p > 0.05 was calculated; therefore, the H0 hypothesis was accepted. This result indicates that there is no significant difference in performance between the two GRU variations and that hyperparameter optimization provided limited improvement in the current dataset.
Similarly, in the PGSUS data, the Tuned GRU model achieved significantly lower error rates compared to the LSTM (Tuned) and RNN (Tuned) models (p < 0.05). For this case, the H0 hypothesis was rejected, and the H1 hypothesis was accepted. However, the difference between the GRU (Baseline) model and the GRU (Tuned) model was not found to be significant (p > 0.05), and in this case, the H0 hypothesis was accepted.
Overall, the Tuned GRU model exhibited superior predictive performance for both THYAO and PGSUS stocks compared to the other deep learning architectures. The results indicate that the Tuned GRU achieved statistically significant improvements over the LSTM and RNN models in terms of key performance metrics, highlighting its robustness and suitability for financial time series forecasting. However, when compared with the baseline GRU model, the enhancement in prediction accuracy remained relatively limited, suggesting that while hyperparameter optimization contributes to performance refinement, the overall gain within the same architecture is moderate.
The findings of this study show that the GRU algorithm outperforms both THYAO and PGSUS stock price predictions. Compared to LSTM, GRU has fewer parameters and is more computationally efficient, providing significant advantages, especially in situations where dataset size and processing time are critical. Additionally, the GRU’s ability to shorten training time and reduce the risk of overfitting while maintaining its capacity to learn long-term dependencies has contributed to more stable and reliable predictions in financial time series. Therefore, the GRU can be considered a strong candidate for predicting airline stock prices, both in terms of accuracy and computational efficiency.
Predicting airline stock prices is a complex process that depends on numerous variables, such as economic indicators, market trends, demand fluctuations, and operational factors. Recurrent neural networks, such as LSTM and GRU, have emerged as powerful tools for financial forecasting due to their ability to learn sequential dependencies in such time series. However, results obtained without proper model selection and hyperparameter tuning may not fully reflect market dynamics. Therefore, it is crucial to carefully design deep learning models and test them under various scenarios, especially for highly volatile financial instruments like airline stocks.

5. Conclusions

Predicting the future is considered an important goal for both the economy and individuals due to the potential benefits it offers. The aviation sector, in particular, is one of the sectors where stock price predictions are of strategic importance due to its high sensitivity to economic fluctuations and global developments. Predicting stock price movements plays a critical role in making strategic decisions regarding capital markets and minimizing investor risk. Artificial intelligence technologies have the potential to provide researchers with more accurate predictions than traditional methods. The continuous development of technology and algorithms will increase the accuracy of these predictions over time. In this study, DL models were developed and comparative analyses were conducted to predict the stock prices of THYAO and PGSUS. The findings revealed that GRU-based models showed the best performance with MAPE values of 3.05% and 3.97%, and it is anticipated that the developed approach will contribute to the creation of strategies with higher return potential in investment decisions while also capturing both balanced and asymmetric dynamics in stock price behavior, consistent with the conceptual notion of symmetry in financial forecasting.
This study only considers time series data of stock closing prices. However, previous studies have shown that fluctuations in the stock market can be modeled not only using price data but also a wide variety of data types, such as investors’ psychological tendencies, financial and economic news content, and macroeconomic indicators. In future research, it is planned to develop a forecasting model that can utilize multi-source data structures (e.g., market news texts, visual information sets, and metrics related to investor sentiment). Additionally, to enhance model accuracy and support investors in making more informed decisions, the application of hybrid prediction models that combine different machine learning methods with deep learning approaches is targeted.

Author Contributions

Conceptualization, M.G. and Ö.A.; methodology, F.H.S.; software, F.H.S.; validation, G.S., M.G. and Ö.A.; formal analysis, G.S.; investigation, Ö.A.; resources, G.S.; data curation, F.H.S.; writing—original draft preparation, M.G.; writing—review and editing, G.S.; visualization, F.H.S.; supervision, F.H.S.; project administration, M.G.; funding acquisition, G.S. All authors have read and agreed to the published version of the manuscript.

Funding

This research received no external funding.

Data Availability Statement

The data supporting this study were obtained from publicly available sources on finance.yahoo.com, which can be accessed freely for verification purposes.

Conflicts of Interest

The authors declare no conflicts of interest.

References

  1. Erden, C. Derin Öğrenme ve ARIMA Yöntemlerinin Tahmin Performanslarının Kıyaslanması: Bir Borsa İstanbul Hissesi Örneği. Yönetim Ekon. Derg. 2023, 30, 419–438. [Google Scholar] [CrossRef]
  2. Shahi, T.B.; Shrestha, A.; Neupane, A.; Guo, W. Stock price forecasting with deep learning: A comparative study. Mathematics 2020, 8, 1441. [Google Scholar] [CrossRef]
  3. Md, A.Q.; Kapoor, S.; AV, C.J.; Sivaraman, A.K.; Tee, K.F. Novel optimization approach for stock price forecasting using multi-layered sequential LSTM. Appl. Soft Comput. 2023, 134, 109830. [Google Scholar] [CrossRef]
  4. Ren, S.; Wang, X.; Zhou, X.; Zhou, Y. A novel hybrid model for stock price forecasting integrating Encoder Forest and Informer. Expert Syst. Appl. 2023, 234, 121080. [Google Scholar] [CrossRef]
  5. Horobet, A.; Zlatea, M.L.E.; Belascu, L.; Dumitrescu, D.G. Oil price volatility and airlines’ stock returns: Evidence from the global aviation industry. J. Bus. Econ. Manag. 2022, 23, 284–304. [Google Scholar] [CrossRef]
  6. Akusta, A. Time Series Analysis of Long-Term Stock Performance of Airlines: The case of Turkish Airlines. Polit. Ekon. Kuram 2024, 8, 160–173. [Google Scholar] [CrossRef]
  7. Xiao, D.; Su, J. Research on stock price time series prediction based on deep learning and autoregressive integrated moving average. Sci. Program. 2022, 2022, 4758698. [Google Scholar] [CrossRef]
  8. Ji, X.; Wang, J.; Yan, Z. A stock price prediction method based on deep learning technology. Int. J. Crowd Sci. 2021, 5, 55–72. [Google Scholar] [CrossRef]
  9. Mukherjee, S.; Sadhukhan, B.; Sarkar, N.; Roy, D.; De, S. Stock market prediction using deep learning algorithms. CAAI Trans. Intell. Technol. 2021, 8, 82–94. [Google Scholar] [CrossRef]
  10. Hoque, K.E.; Aljamaan, H. Impact of hyperparameter tuning on machine learning models in stock price forecasting. IEEE Access 2021, 9, 163815–163830. [Google Scholar] [CrossRef]
  11. Xu, X.; McGrory, C.A.; Wang, Y.; Wu, J. Influential factors on Chinese airlines’ profitability and forecasting methods. J. Air Transp. Manag. 2020, 91, 101969. [Google Scholar] [CrossRef]
  12. Chang, V.; Xu, Q.A.; Chidozie, A.; Wang, H. Predicting Economic Trends and Stock Market Prices with Deep Learning and Advanced Machine Learning Techniques. Electronics 2024, 13, 3396. [Google Scholar] [CrossRef]
  13. Kumar, R.; Kumar, P.; Kumar, Y. Multi-step time series analysis and forecasting strategy using ARIMA and evolutionary algorithms. Int. J. Inf. Technol. 2021, 14, 359–373. [Google Scholar] [CrossRef]
  14. Ji, G.; Yu, J.; Hu, K.; Xie, J.; Ji, X. An adaptive feature selection schema using improved technical indicators for predicting stock price movements. Expert Syst. Appl. 2022, 200, 116941. [Google Scholar] [CrossRef]
  15. Chen, Y.; Huang, W. Constructing a stock-price forecast CNN model with gold and crude oil indicators. Appl. Soft Comput. 2021, 112, 107760. [Google Scholar] [CrossRef]
  16. Mashadihasanli, T. Stock Market Price Forecasting Using the Arima Model: An Application to Istanbul, Turkiye. J. Econ. Policy Res./İktisat Polit. Araştırmaları Derg. 2022, 9, 439–454. [Google Scholar] [CrossRef]
  17. Ferdinand, F.V.; Santoso, T.H.; Saputra, K.V.I. Performance comparison between Facebook Prophet and SARIMA on Indonesian stock. In Proceedings of the 2023 IEEE International Conference on Industrial Engineering and Engineering Management (IEEM), Singapore, 18–21 December; pp. 1–5.
  18. Henrique, B.M.; Sobreiro, V.A.; Kimura, H. Stock price prediction using support vector regression on daily and up to the minute prices. J. Financ. Data Sci. 2018, 4, 183–201. [Google Scholar] [CrossRef]
  19. Gorde, P.S.; Borkar, S.N. Comparative analysis of linear regression, random forest regressor and LSTM for stock price prediction. In Proceedings of the 2024 8th International Conference on Computing, Communication, Control and Automation (ICCUBEA), Pune, India, 23–24 August 2024; pp. 1–5. [Google Scholar]
  20. Raudys, A.; Goldstein, E. Forecasting detrended volatility risk and financial price series using LSTM neural networks and XGBOOST Regressor. J. Risk Financ. Manag. 2022, 15, 602. [Google Scholar] [CrossRef]
  21. Ecer, F.; Ardabili, S.; Band, S.S.; Mosavi, A. Training Multilayer Perceptron with Genetic Algorithms and Particle Swarm Optimization for Modeling Stock Price Index Prediction. Entropy 2020, 22, 1239. [Google Scholar] [CrossRef]
  22. Khuat, T.T.; Le, M.H. An application of artificial neural networks and fuzzy logic on the stock price prediction problem. JOIV Int. J. Inform. Vis. 2017, 1, 40–49. [Google Scholar]
  23. Sunny, M.a.I.; Maswood, M.M.S.; Alharbi, A.G. Deep Learning-Based Stock Price Prediction using LSTM and Bi-Directional LSTM model. In Proceedings of the 2020 2nd Novel Intelligent and Leading Emerging Sciences Conference (NILES), Giza, Egypt, 24–26 October 2020; pp. 87–92. [Google Scholar]
  24. Bhavani, A.; Ramana, A.V.; Chakravarthy, A.S.N. Comparative Analysis between LSTM and GRU in Stock Price Prediction. In Proceedings of the 2022 International Conference on Edge Computing and Applications (ICECAA), Tamilnadu, India, 13–15 October 2022; pp. 532–537. [Google Scholar]
  25. Lu, W.; Li, J.; Li, Y.; Sun, A.; Wang, J. A CNN-LSTM-Based model to forecast stock prices. Complexity 2020, 2020, 6622927. [Google Scholar] [CrossRef]
  26. Chen, Y.; Fang, R.; Liang, T.; Sha, Z.; Li, S.; Yi, Y.; Zhou, W.; Song, H. Stock price forecast based on CNN-BILSTM-ECA model. Sci. Program. 2021, 2021, 2446543. [Google Scholar] [CrossRef]
  27. Xu, C.; Li, J.; Feng, B.; Lu, B. A financial time-series prediction model based on multiplex attention and linear transformer structure. Appl. Sci. 2023, 13, 5175. [Google Scholar] [CrossRef]
  28. Li, X.; Chen, S.; Qiao, X.; Zhang, M.; Zhang, C.; Zhao, F. Multi-perspective Learning Based on Transformer for Stock Price Trend. Int. J. Comput. Intell. Syst. 2025, 18, 1–18. [Google Scholar] [CrossRef]
  29. Bhandari, H.N.; Rimal, B.; Pokhrel, N.R.; Rimal, R.; Dahal, K.R.; Khatri, R.K. Predicting stock market index using LSTM. Mach. Learn. Appl. 2022, 9, 100320. [Google Scholar] [CrossRef]
  30. Chong, E.; Han, C.; Park, F.C. Deep learning networks for stock market analysis and prediction: Methodology, data representations, and case studies. Expert Syst. Appl. 2017, 83, 187–205. [Google Scholar] [CrossRef]
  31. Gupta, U.; Bhattacharjee, V.; Bishnu, P.S. StockNet—GRU based stock index prediction. Expert Syst. Appl. 2022, 207, 117986. [Google Scholar] [CrossRef]
  32. Chandra, R.; Chand, S. Evaluation of co-evolutionary neural network architectures for time series prediction with mobile application in finance. Appl. Soft Comput. 2016, 49, 462–473. [Google Scholar] [CrossRef]
  33. Naik, N.; Mohan, B.R. Novel Stock Crisis Prediction Technique—A Study on Indian Stock Market. IEEE Access 2021, 9, 86230–86242. [Google Scholar] [CrossRef]
  34. Aker, Y. Analysis of price volatility in BIST 100 index with time series: Comparison of Fbprophet and LSTM model. Avrupa Bilim Ve Teknol. Derg. 2022, 35, 89–93. [Google Scholar] [CrossRef]
  35. Liu, B.; Yu, Z.; Wang, Q.; Du, P.; Zhang, X. Prediction of SSE Shanghai Enterprises index based on bidirectional LSTM model of air pollutants. Expert Syst. Appl. 2022, 204, 117600. [Google Scholar] [CrossRef]
  36. Zhou, C. Long Short-term Memory Applied on Amazon’s Stock Prediction. Highlights Sci. Eng. Technol. 2023, 34, 71–76. [Google Scholar] [CrossRef]
  37. Saini, A.; Singh, N.; Singh, R.K.; Sachan, M.K. Financial Time Series Prediction on Apple stocks using machine and deep learning models. In Proceedings of the 2024 International Conference on Electrical, Computer and Energy Technologies (ICECET), Sydney, Australia, 25–27 July 2024; pp. 1–6. [Google Scholar]
  38. Gülmez, B. Stock price prediction with optimized deep LSTM network with artificial rabbits optimization algorithm. Expert Syst. Appl. 2023, 227, 120346. [Google Scholar] [CrossRef]
  39. Zhang, J.; Ye, L.; Lai, Y. Stock price prediction using CNN-BILSTM-Attention model. Mathematics 2023, 11, 1985. [Google Scholar] [CrossRef]
  40. Ali, M.; Khan, D.M.; Alshanbari, H.M.; El-Bagoury, A.A.-A.H. Prediction of complex stock market data using an improved hybrid EMD-LSTM model. Appl. Sci. 2023, 13, 1429. [Google Scholar] [CrossRef]
  41. Jaiswal, R.; Singh, B. A hybrid convolutional recurrent (CNN-GRU) model for stock price prediction. In Proceedings of the 2022 IEEE 11th International Conference on Communication Systems and Network Technologies (CSNT), Indore, India, 23–24 April 2022; pp. 299–304. [Google Scholar]
  42. Song, H.; Choi, H. Forecasting stock market indices using the recurrent neural network based hybrid models: CNN-LSTM, GRU-CNN, and ensemble models. Appl. Sci. 2023, 13, 4644. [Google Scholar] [CrossRef]
  43. Singh, U.; Tamrakar, S.; Saurabh, K.; Vyas, R.; Vyas, O. Optimizing hyperparameters of deep learning models for stock price prediction. In Proceedings of the 2024 15th International Conference on Computing Communication and Networking Technologies (ICCCNT), Kamand, India, 24–28 June 2024; pp. 1–7. [Google Scholar]
  44. Chauhan, A.; Shivaprakash, S.J.; Sabireen, H.; Md, A.Q.; Venkataraman, N. Stock price forecasting using PSO hypertuned neural nets and ensembling. Appl. Soft Comput. 2023, 147, 110835. [Google Scholar] [CrossRef]
  45. Chung, H.; Shin, K. Genetic Algorithm-Optimized Long Short-Term Memory Network for stock market prediction. Sustainability 2018, 10, 3765. [Google Scholar] [CrossRef]
  46. Chen, X.; Yang, F.; Sun, Q.; Yi, W. Research on stock prediction based on CED-PSO-StockNet time series model. Sci. Rep. 2024, 14, 27462. [Google Scholar] [CrossRef]
  47. Yan, J.; Huang, Y. MambaLLM: Integrating Macro-Index and Micro-Stock Data for Enhanced Stock Price Prediction. Mathematics 2025, 13, 1599. [Google Scholar] [CrossRef]
  48. Torres, J.F.; Hadjout, D.; Sebaa, A.; Martínez-Álvarez, F.; Troncoso, A. Deep learning for Time Series Forecasting: A survey. Big Data 2020, 9, 3–21. [Google Scholar] [CrossRef] [PubMed]
  49. Lu, M.; Xu, X. TRNN: An efficient time-series recurrent neural network for stock price prediction. Inf. Sci. 2023, 657, 119951. [Google Scholar] [CrossRef]
  50. Sagheer, A.; Kotb, M. Time series forecasting of petroleum production using deep LSTM recurrent networks. Neurocomputing 2018, 323, 203–213. [Google Scholar] [CrossRef]
  51. Hochreiter, S.; Schmidhuber, J. Long Short-Term memory. Neural Comput. 1997, 9, 1735–1780. [Google Scholar] [CrossRef]
  52. Cao, J.; Li, Z.; Li, J. Financial time series forecasting model based on CEEMDAN and LSTM. Phys. A Stat. Mech. Its Appl. 2018, 519, 127–139. [Google Scholar] [CrossRef]
  53. Mahjoub, S.; Chrifi-Alaoui, L.; Marhic, B.; Delahoche, L. Predicting energy consumption using LSTM, Multi-Layer GRU and Drop-GRU neural networks. Sensors 2022, 22, 4062. [Google Scholar] [CrossRef]
  54. Pirani, M.; Thakkar, P.; Jivrani, P.; Bohara, M.H.; Garg, D. A comparative analysis of ARIMA, GRU, LSTM and BILSTM on financial Time Series forecasting. In Proceedings of the 2022 IEEE International Conference on Distributed Computing and Electrical Circuits and Electronics (ICDCECE), Ballari, India, 23–24 April 2022; pp. 1–6. [Google Scholar]
  55. Önder, G.T. Comparative Time series analysis of SARIMA, LSTM, and GRU models for global SF6 emission Management System. J. Atmos. Sol. -Terr. Phys. 2024, 265, 106393. [Google Scholar] [CrossRef]
  56. Jiang, X.; Xu, C. Deep Learning and Machine Learning with Grid Search to Predict Later Occurrence of Breast Cancer Metastasis Using Clinical Data. J. Clin. Med. 2022, 11, 5772. [Google Scholar] [CrossRef]
  57. Bergstra, J.; Bengio, Y. Random search for hyper-parameter optimization. J. Mach. Learn. Res. 2012, 13, 281–305. [Google Scholar]
  58. Snoek, J.; Larochelle, H.; Adams, R.P. Practical bayesian optimization of machine learning algorithms. In Proceedings of the Neural Information Processing Systems, Red Hook, NY, USA, 3–6 December 2012; Volume 2. [Google Scholar]
  59. Lee, S.; Kim, J.; Kang, H.; Kang, D.; Park, J. Genetic algorithm based deep learning neural network structure and hyperparameter optimization. Appl. Sci. 2021, 11, 744. [Google Scholar] [CrossRef]
  60. Teixeira, D.M.; Barbosa, R.S. Stock Price Prediction in the Financial Market Using Machine Learning Models. Computation 2024, 13, 3. [Google Scholar] [CrossRef]
  61. Chen, P.; Boukouvalas, Z.; Corizzo, R. A deep fusion model for stock market prediction with news headlines and time series data. Neural Comput. Appl. 2024, 36, 21229–21271. [Google Scholar] [CrossRef]
  62. Yang, L.; Shami, A. On hyperparameter optimization of machine learning algorithms: Theory and practice. Neurocomputing 2020, 415, 295–316. [Google Scholar] [CrossRef]
  63. Wu, J.; Chen, X.Y.; Zhang, H.; Xiong, L.D.; Lei, H.; Deng, S.H. Hyperparameter optimization for machine learning models based on Bayesian optimization. J. Electron. Sci. Technol. 2019, 17, 26–40. [Google Scholar]
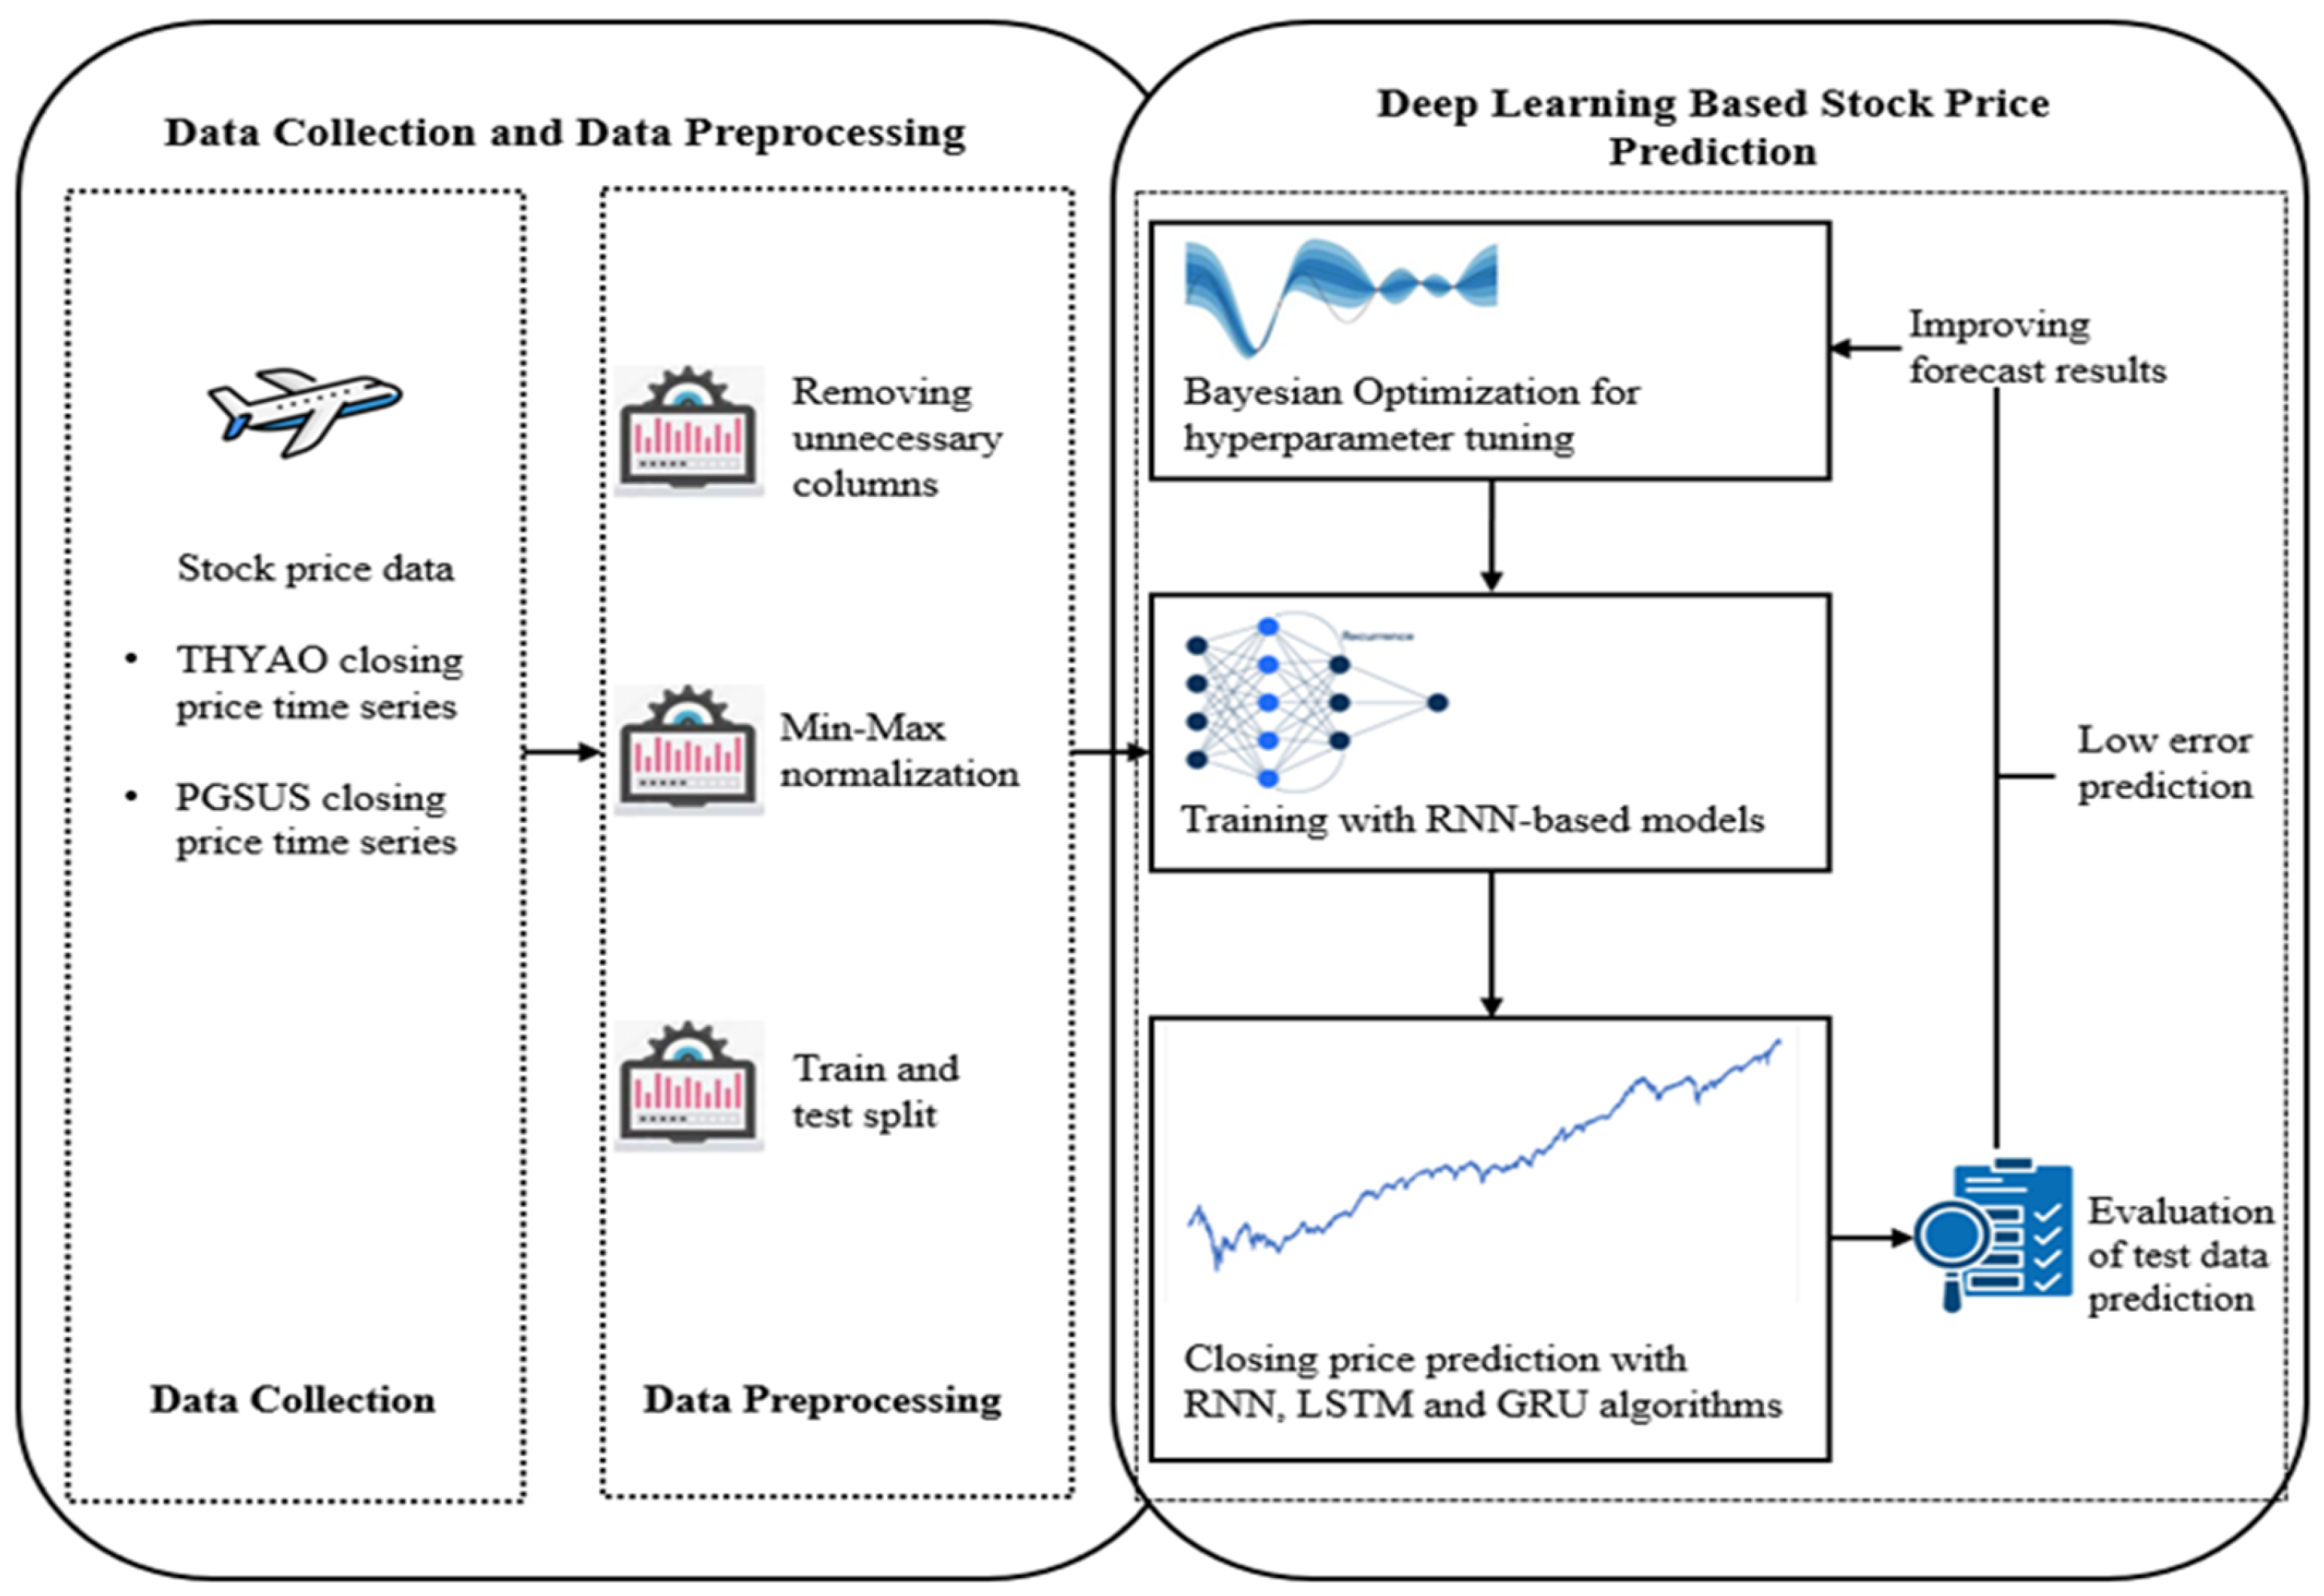
Figure 1. Stock price forecasting model.
Symmetry 17 01905 g001
Figure 2. RNN architecture.
Symmetry 17 01905 g002
Figure 3. LSTM architecture.
Symmetry 17 01905 g003
Figure 4. GRU architecture.
Symmetry 17 01905 g004
Figure 5. THYAO training and validation loss over epochs.
Symmetry 17 01905 g005
Figure 6. PGSUS training and validation loss over epochs.
Symmetry 17 01905 g006
Figure 7. THYAO stock price forecasting.
Symmetry 17 01905 g007
Figure 8. PGSUS stock price forecasting.
Symmetry 17 01905 g008
Table 1. Literature review.
ReferenceDataForecasting TargetTime IntervalProposed Model
[29]S&P 500 indexClosing price2006–2020LSTM
[30]KOSPI marketStock returns2010–2014DNN
[31]CNX-NiftOpening price1996–2020GRU
[32]NASDAQClosing price2006–2010RNN
[23]Google stock marketStock price2004–2019LSTM, BiLSTM
[33]NIFTY 50Stock crisis event2007–2021DNN
[34]BIST-100 indexClosing price2021–2021LSTM
[35]SSE Shanghai
Enterprises index
Closing price2014–2020GRU, LSTM, BiLSTM
[36]Amazon’s stockOpening price1997–2021LSTM
[37]Apple StocksClosing price2018–2023LSTM, CNN
[38]DJIA indexStock price2018–2023Rabbits Optimization algorithm (ARO)-LSTM
[39]CSI300 indexClosing price2011–2021CNN-BiLSTM
[40]KSE-100 indexClosing price2015–2022Empirical Mode Decomposition (EMD)-LSTM
[41]Tesla Stock PriceClosing price2010–2017CNN-RNN, CNN-LSTM, CNN-GRU
[42]DOWClosing price2000–2019CNN-LSTM, GRU-CNN
Table 2. Search space for hyperparameters.
LayerHyperparameterSearch Range
Layer 1Hidden unit (per layer)32, 50, 64, 96 or 128
Activation functionsReLU, tanh or sigmoid
Dropout rate (ratio)0.2, 0.3, 0.4 or 0.5
Layer 2Hidden unit (per layer)32, 50, 64, 96 or 128
Activation functionsReLU, tanh or sigmoid
Dropout rate (ratio)0.2, 0.3, 0.4 or 0.5
GlobalOptimization solverAdam or Rmsprop
Table 3. Performance metrics of THYAO stock price prediction models.
ModelVariantMSERMSEMAEMedAEMAPE (%)
RNNBaseline120.03610.9568.6536.0319.390
RNNHyperparameter-Tuned75.9048.7127.6146.5529.060
LSTMBaseline21.4364.6303.3962.3634.200
LSTMHyperparameter-Tuned15.4663.9332.9732.2973.650
GRUBaseline14.1813.7662.6551.6643.220
GRUHyperparameter-Tuned10.2063.1952.4321.8783.050
Table 4. Performance metrics of PGSUS stock price prediction models.
ModelVariantMSERMSEMAEMedAEMAPE (%)
RNNBaseline65.9808.1236.2834.6419.790
RNNHyperparameter-Tuned36.8826.0735.2734.2949.270
LSTMBaseline17.0984.1353.1852.2315.560
LSTMHyperparameter-Tuned19.1864.3803.2632.3185.460
GRUBaseline13.5983.6882.7301.7434.630
GRUHyperparameter-Tuned10.4433.2322.3261.3913.970
Table 5. Wilcoxon signed-rank test results for GRU (Tuned) compared with other models (THYAO).
Compared ModelMetricGRU Tuned MeanOther_MeanBetter ModelWilcoxon
Statistic
p_Value
RNN (Tuned)MAPE (%)2.9919.080GRU (Tuned)30.0098
RNN (Tuned)RMSE3.2639.110GRU (Tuned)30.0098
LSTM (Tuned)MAPE (%)2.9914.617GRU (Tuned)00.0020
LSTM (Tuned)RMSE3.2634.876GRU (Tuned)10.0039
GRU (Baseline)MAPE (%)2.9913.397GRU (Tuned)120.1309
GRU (Baseline)RMSE3.2633.673GRU (Tuned)140.1934
Table 6. Wilcoxon signed-rank test results for GRU (Tuned) compared with other models (PGSUS).
Compared ModelMetricGRU Tuned MeanOther_MeanBetter ModelWilcoxon
Statistic
p_Value
RNN (Tuned)MAPE (%)3.88214.075GRU (Tuned)00.0020
RNN (Tuned)RMSE3.0889.902GRU (Tuned)10.0039
LSTM (Tuned)MAPE (%)3.8827.089GRU (Tuned)00.0020
LSTM (Tuned)RMSE3.0885.238GRU (Tuned)00.0020
GRU (Baseline)MAPE (%)3.8824.559GRU (Tuned)170.3223
GRU (Baseline)RMSE3.0883.621GRU (Tuned)120.1309
Disclaimer/Publisher’s Note: The statements, opinions and data contained in all publications are solely those of the individual author(s) and contributor(s) and not of MDPI and/or the editor(s). MDPI and/or the editor(s) disclaim responsibility for any injury to people or property resulting from any ideas, methods, instructions or products referred to in the content.