Article

Experimental and Numerical Investigation of Projectile Penetration into Thin Concrete Targets at an Angle of Attack

1
Ministerial Key Laboratory of ZNDY, Nanjing University of Science and Technology, Nanjing 210094, China
2
Heilongjiang North Tool Co., Mudangjiang 157000, China
*
Author to whom correspondence should be addressed.
Symmetry 2025, 17(11), 1904; https://doi.org/10.3390/sym17111904
Submission received: 19 June 2025 / Revised: 6 August 2025 / Accepted: 8 August 2025 / Published: 7 November 2025
(This article belongs to the Special Issue Symmetry, Asymmetry and Nonlinearity in Geomechanics)

Abstract

This study presents a combined experimental and numerical investigation into the evolution of projectile attitude during oblique penetration into thin concrete targets at non-zero angles of attack. An oblique penetration test system was developed based on a cannon platform, incorporating a planar mirror reflection technique and high-speed imaging to capture the projectile’s spatial orientation. A set of equations was derived to relate the projectile’s three-dimensional attitude angles to its two-dimensional and mirror-reflected projections. The system demonstrated the ability to generate controlled initial angles of attack and accurately measure the projectile’s attitude, with measurement errors primarily within 2° and a maximum error of approximately 5°. Numerical simulations were conducted using the RHT strength model to replicate the experimental process. The simulation results showed good agreement with experimental data, with residual velocity errors less than 5% and attitude angle deviations below 15%. The validated model was further employed to study the effects of initial velocity, impact angle of attack, and target thickness on the evolution of projectile attitude. The findings reveal that, within a velocity range of 550–1000 m/s, the post-perforation attitude angle is negatively correlated with projectile velocity, though the variation remains under 15%. Increasing the target thickness from 90 mm to 240 mm significantly raises the post-perforation attitude angle and angle of attack by more than 70% and 20%, respectively. Under varying initial attitude angles, the final attitude angle increases with the initial value, with the maximum growth rate occurring around 15°, after which the rate gradually decreases. The angle of attack evolution during penetration can be divided into four stages: (1) crater formation, (2) plugging penetration, (3) breakthrough plugging, and (4) post-exit. These results offer valuable insights into projectile dynamics under complex impact conditions and provide theoretical support for the design of protective structures.

1. Introduction

In terminal ballistics research, the behavior of projectiles’ penetration into concrete has always been a key issue. Unlike conventional studies that primarily focus on normal penetration into single-layer targets, real-world protective structures often employ multilayered thin concrete slabs arranged with spacing. In such systems, due to the relatively small thickness of each slab and the presence of gaps between layers, the projectile tends to deflect after perforating each slab, resulting in a non-zero angle of attack when impacting the subsequent layer. This leads to an oblique penetration process characterized by a “dual asymmetry”: (1) asymmetry in the contact region between the upper and lower surfaces of the projectile and (2) disparity in the corresponding normal velocity components. This coupled asymmetry drives the continuous evolution of the projectile’s attitude angle, potentially inducing dynamic instability and significantly increasing the complexity of trajectory prediction. Therefore, a comprehensive understanding of this process holds significant theoretical importance and practical application value.
Based on a review of the existing literature, current research efforts can be broadly categorized into the following three areas:
  • Studies on the Influence of Incidence and Attack Angles: He Xiang et al. [1] developed a theoretical model to analyze the oblique penetration of projectiles into layered geomaterials such as soil and concrete, which showed good agreement with experimental data. Duan et al. investigated the evolution of projectile attitude during the penetration of concrete targets at non-zero incidence angles, identifying several characteristic stages and correlating them with target responses [2]. Dong et al. [3,4] and Chen et al. [5] conducted both experimental and numerical studies on oblique penetration, highlighting the effects of projectile geometry and incidence angle on attitude deviation and penetration depth. Dong et al. [6] further investigated penetration characteristics of pyramidal projectiles into concrete targets, expanding the understanding of shape influence on penetration mechanisms. Moreover, Li et al. [7,8] proposed models addressing projectile blunting and asymmetric flow fields, emphasizing their impact on trajectory stability.
  • Research on Concrete Material Properties: to enhance penetration resistance, attention has shifted toward ultra-high-performance concrete (UHPC) and steel–concrete composite structures. Sun et al. [9] found that fiber-reinforced UHPC effectively suppresses asymmetric crater formation. Ning et al. [10] compared the penetration resistance of UHPC and granite, demonstrating UHPC’s superior performance. Sun et al. [11] highlighted that interfacial bonding strength governs the efficiency of oblique penetration. The studies by Wang et al. [12] and Jurecs et al. [13] further analyzed the evolution of attack angle and residual mass in extremely high-strength concrete.
  • Numerical Modeling and Experimental Investigations: Li et al. [14] compared four widely used concrete strength models and found that the RHT and TCK models better capture concrete damage, while the HJC and KCC models provide more accurate predictions of residual projectile velocity. Teng et al. [15] analyzed the response of reinforced concrete under oblique impact using finite element methods, providing early insights into concrete damage mechanisms under inclined loading. Yang et al. [16] conducted combined attack angle and obliquity penetration tests using a 152 mm hydrogen-driven gun, verifying the applicability of the ACE and Forrestal formulas under oblique impact conditions. Chen et al. [17] proposed an approximate method for predicting the penetration depth of rigid projectiles into concrete targets covered with yaw-inducing layers, considering the effects of tilt and attack angles and validating the model through experiments. Li et al. [7] established a two-dimensional oblique penetration trajectory model, emphasizing the role of asymmetric ejecta in deflecting trajectories. In terms of experimental observation, Jiang et al. [18] investigated the mechanism of multilayer interfacial structures and demonstrated how the presence of water layers further intensified the evolution of projectile attitude.
In summary, several gaps and challenges remain in current research on angle of attack penetration. (1) Most experimental setups lack precise control of the initial angle of attack, making it difficult to capture the full evolution of the projectile’s three-dimensional attitude. (2) There is a scarcity of experimental data on projectile penetration into thin concrete targets at non-zero angles of attack, limiting the validation and credibility of numerical simulations. (3) The coupled effects of key parameters—such as angle of attack, impact velocity, and target thickness—have not yet been systematically investigated.
Compared with existing studies such as those by Duan et al. [2] and Dong et al. [3,4], this study proposes a research framework and presents the following innovations centered on the asymmetric response characteristics during angle of attack (AOA) penetration:
A projectile AOA control system was developed based on a cannon platform, in combination with a mirror-reflection method and high-speed imaging system, enabling non-contact and continuous measurement of the projectile’s three-dimensional attitude angles and angle of attack, offering sub-5° angular error.
A high-fidelity finite element model incorporating the RHT (Riedel–Hiermaier–Thoma) constitutive model was established, accompanied by mesh convergence analysis. The numerical results were validated against experimental data to ensure both accuracy and reproducibility, achieving residual velocity errors under 5% and attitude errors within 4°. Such integration of experimental control, high-precision measurement, and numerical fidelity has not yet been comprehensively achieved in previous literature.
The evolution of projectile attitude, crater morphology, and asymmetric response mechanisms under varying initial angles of attack, impact velocities, and target thicknesses was systematically analyzed. The results were compared with those of existing studies to uncover the dynamic coupling effects inherent in AOA penetration.
This research not only expands the experimental methodologies for measuring asymmetric penetration behavior but also provides valuable data and modeling support for the design of protective structures and the development of terminal ballistics theory.

2. Experimental Investigation

2.1. Experimental Design

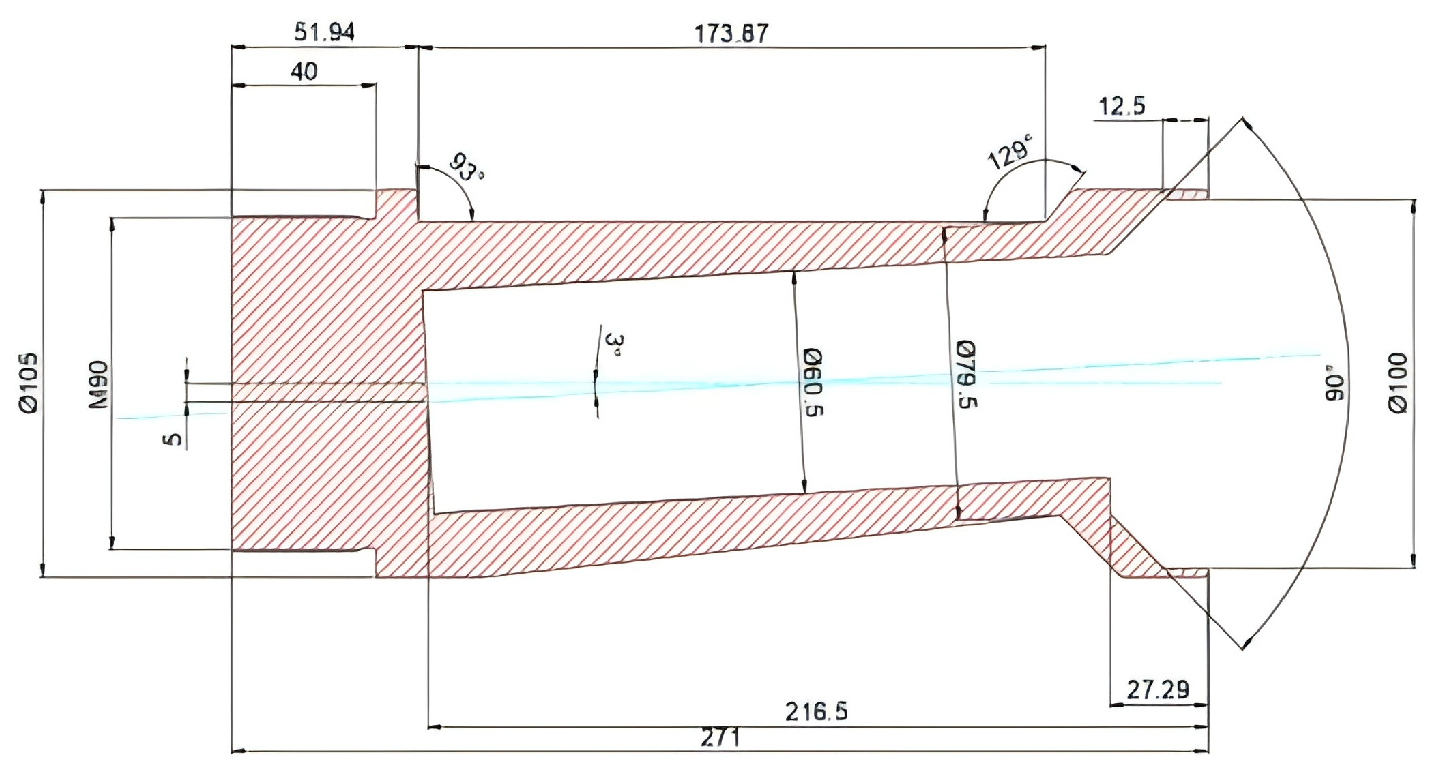
The projectile used in the experiments consisted of a main body with a base screw at the tail (Figure 1). The total mass of the projectile was 4.9 kg, of which the main body and base plug accounted for 4.724 kg. The projectile had a diameter of 60.5 mm, an overall length of 302.5 mm, and a caliber-radius-head (CRH) value of 4. The projectile was fabricated from 30CrMnSiNi2A steel, with a yield strength of 1587 MPa.
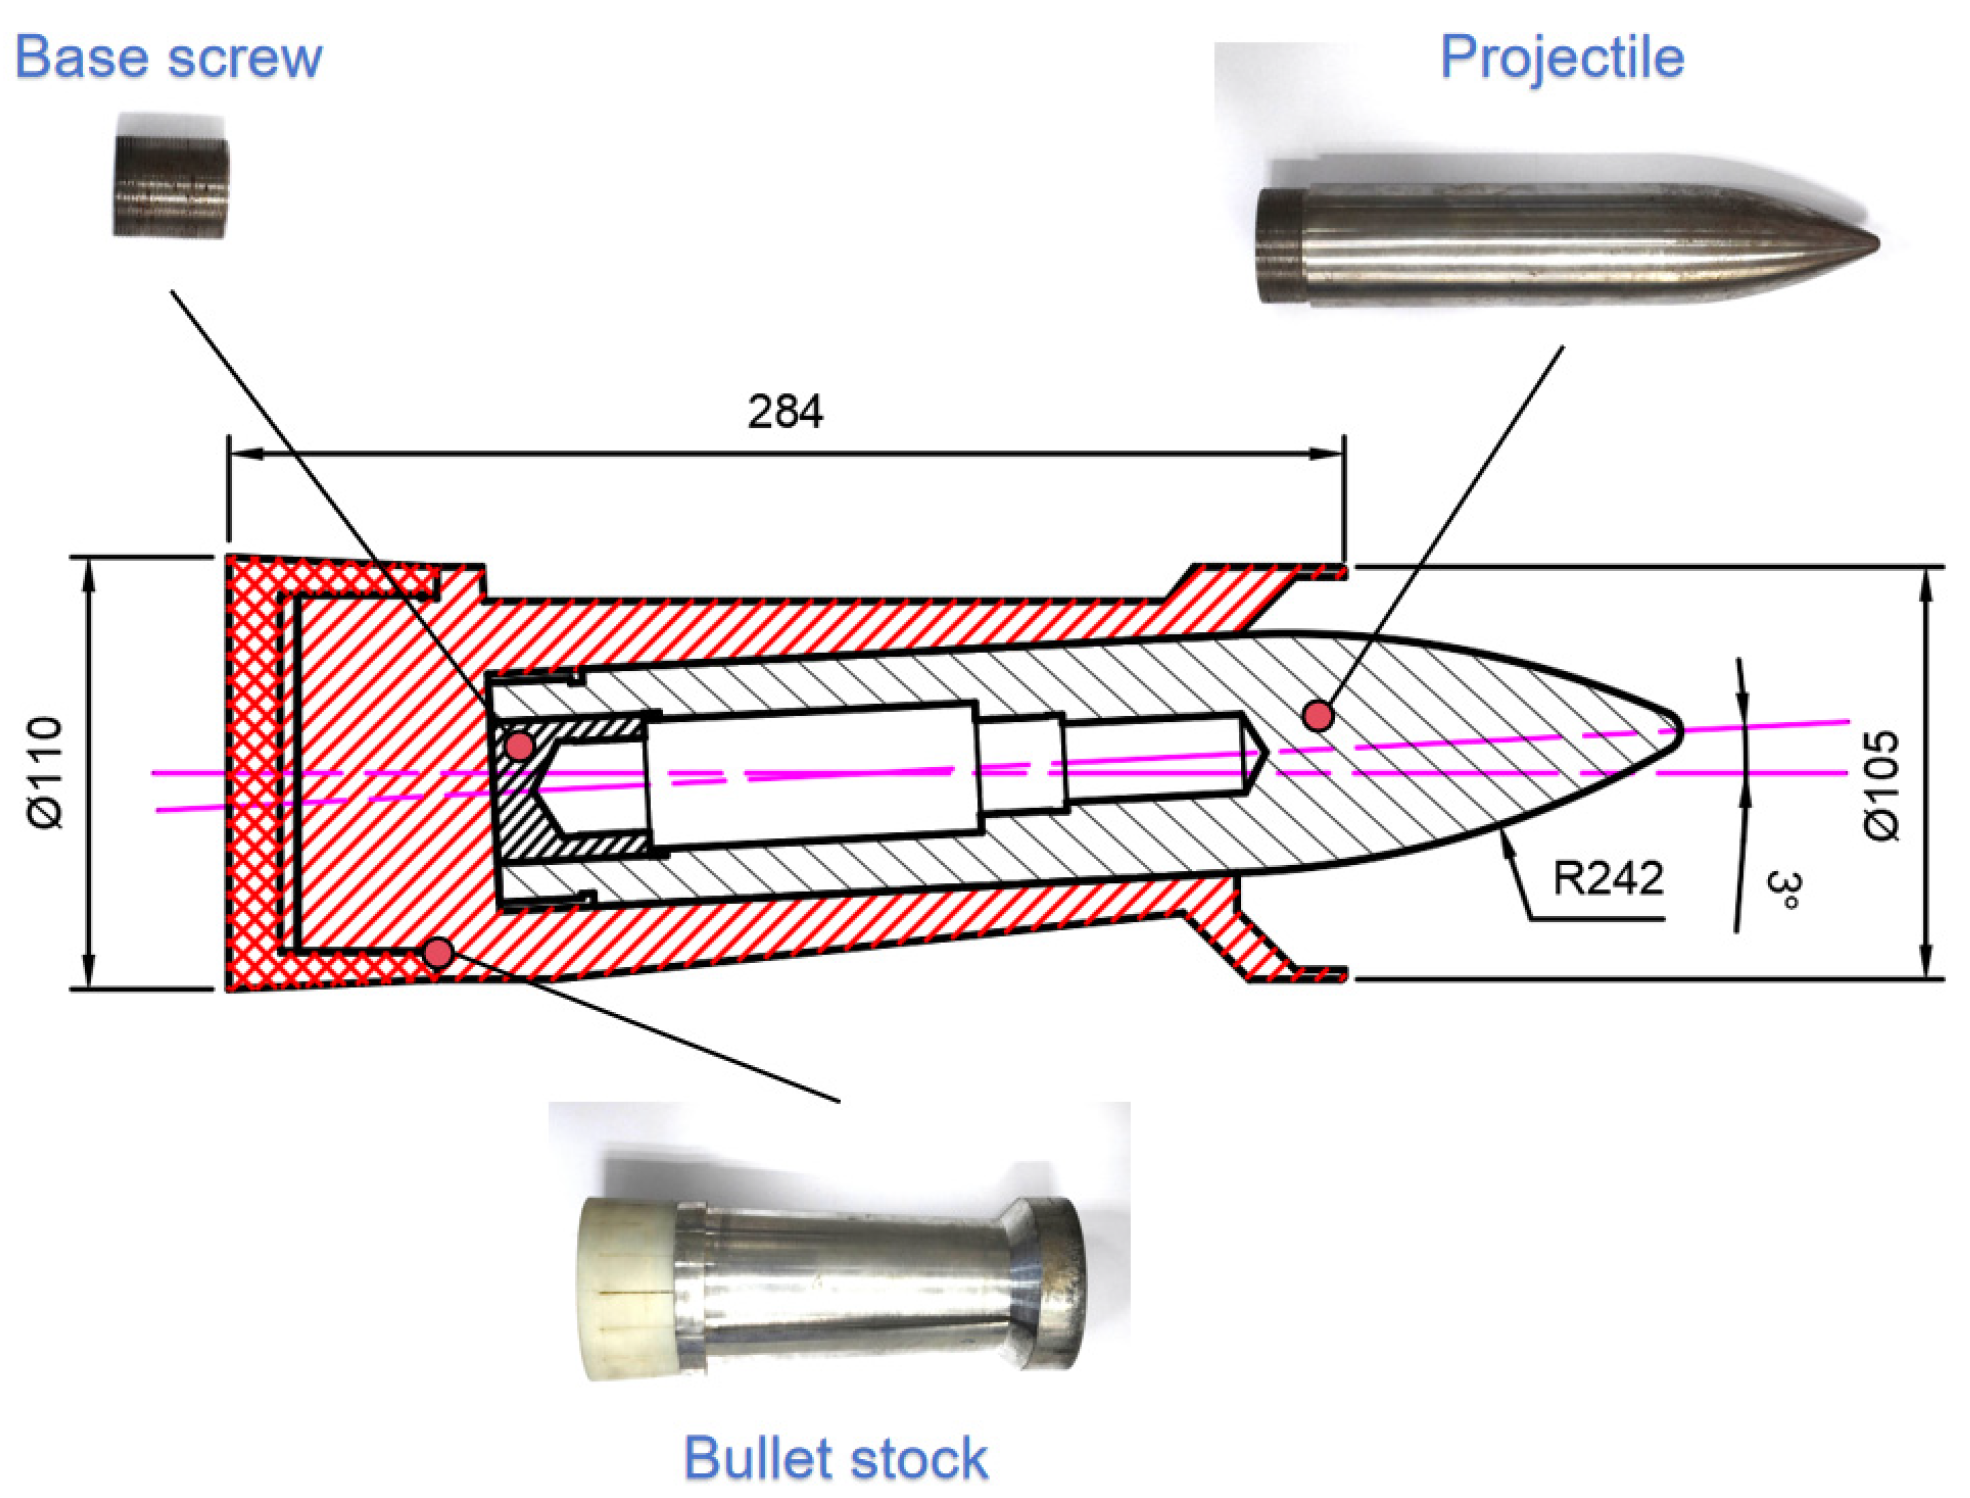
Since the projectile launched from a gun platform inherently travels along a path parallel to the central axis of the barrel, achieving a non-zero initial angle of attack requires the projectile to be positioned at an angle within the barrel. Based on this requirement, a specially designed bullet stock was developed in this study (Figure 2). This bullet stock enables the projectile to maintain a preset inclination relative to the barrel axis during propulsion by the propellant gases. As a result, the projectile exits the barrel with a relatively stable initial angle of attack.
Figure 3 shows the assembly configuration of the projectile and the angle of attack of the bullet stock prior to launch.
The target used in the experiments was a plain concrete slab. The main material properties of the concrete are listed in Table 1. The cement used was of strength grade 32.5R; the fine aggregate was quartz sand, and the coarse aggregate was limestone with a maximum particle size of 20 mm. The dimensions of the concrete target surface were 1400 mm × 1400 mm.
To investigate the influence of the projectile’s initial velocity, initial angle of attack, and target thickness on its post-penetration attitude, a series of experimental schemes were designed, as summarized in Table 2.
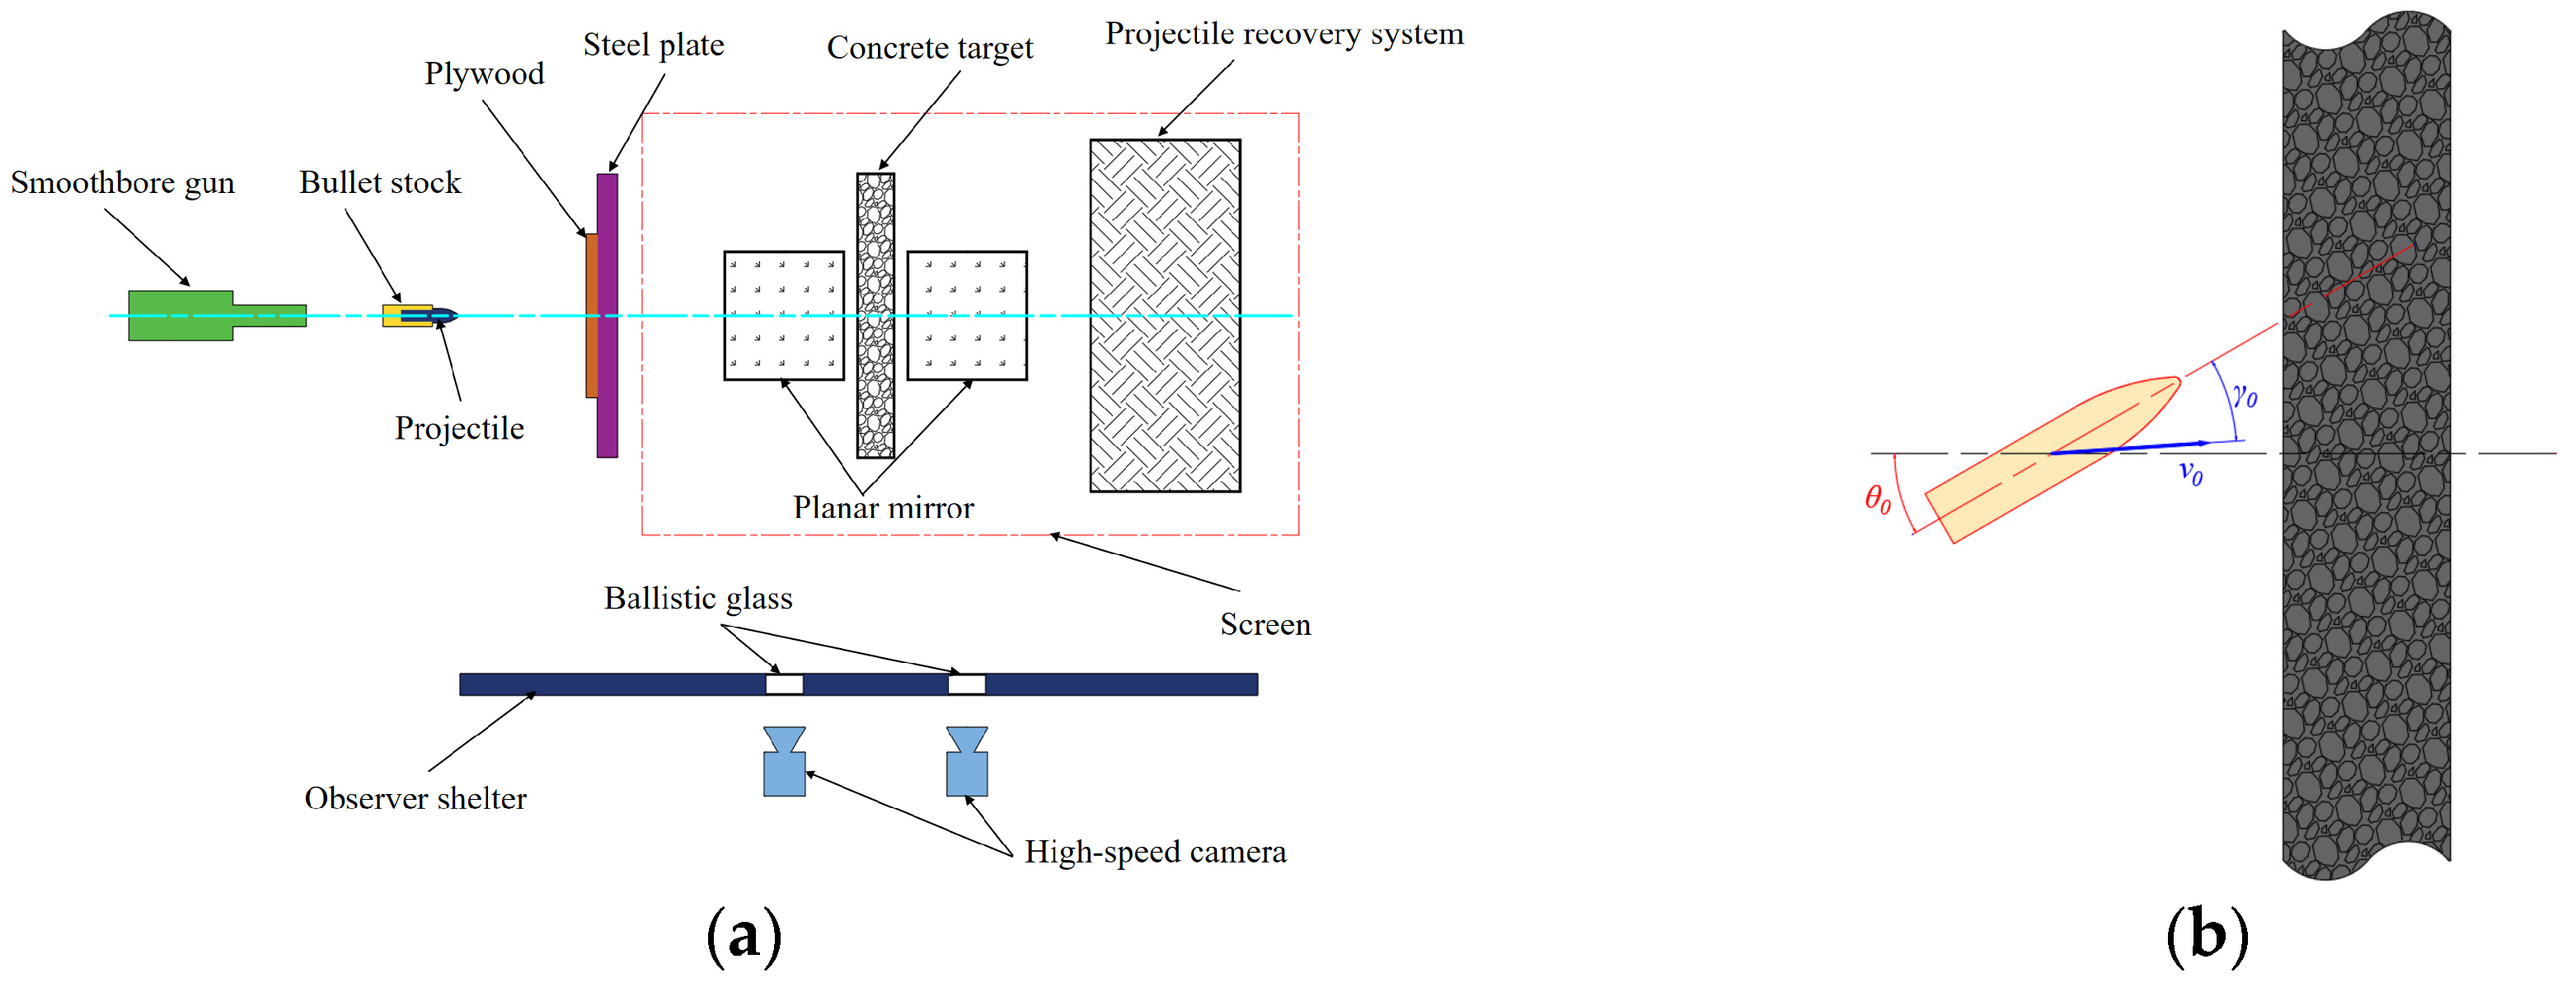
Figure 4 presents the schematic layout of the penetration experiment. Figure 4a illustrates the overall experimental arrangement, while Figure 4b shows the relative positioning of the projectile and the target just before impact. All angles indicated in the figure are measured counterclockwise as positive.
To minimize attitude variation in the projectile after exiting the muzzle, the distance between the muzzle and the target was reduced as much as possible—within the constraints of safety and ensuring complete sabot separation. According to the requirements of the projectile flight attitude measurement system, two planar mirrors inclined at 45° to the ground were placed in front of and behind the target. A high-speed imaging system was employed to measure the projectile’s velocity and attitude within the observation plane. A sabot interception device was installed between the muzzle and the target to eliminate interference from the sabot impact. A recovery setup was placed behind the target to collect the residual projectile.
Although the muzzle-to-target distance in this study was minimized to ensure attitude stability and accurate measurement, this setting corresponds to short-range impact conditions observed in confined protective structures (e.g., bunkers, urban combat). In extended-range scenarios, aerodynamic effects will further influence projectile attitude, which can be investigated through flight path extension in future work. Nevertheless, the close-range data provide critical insights into initial target interaction dynamics.
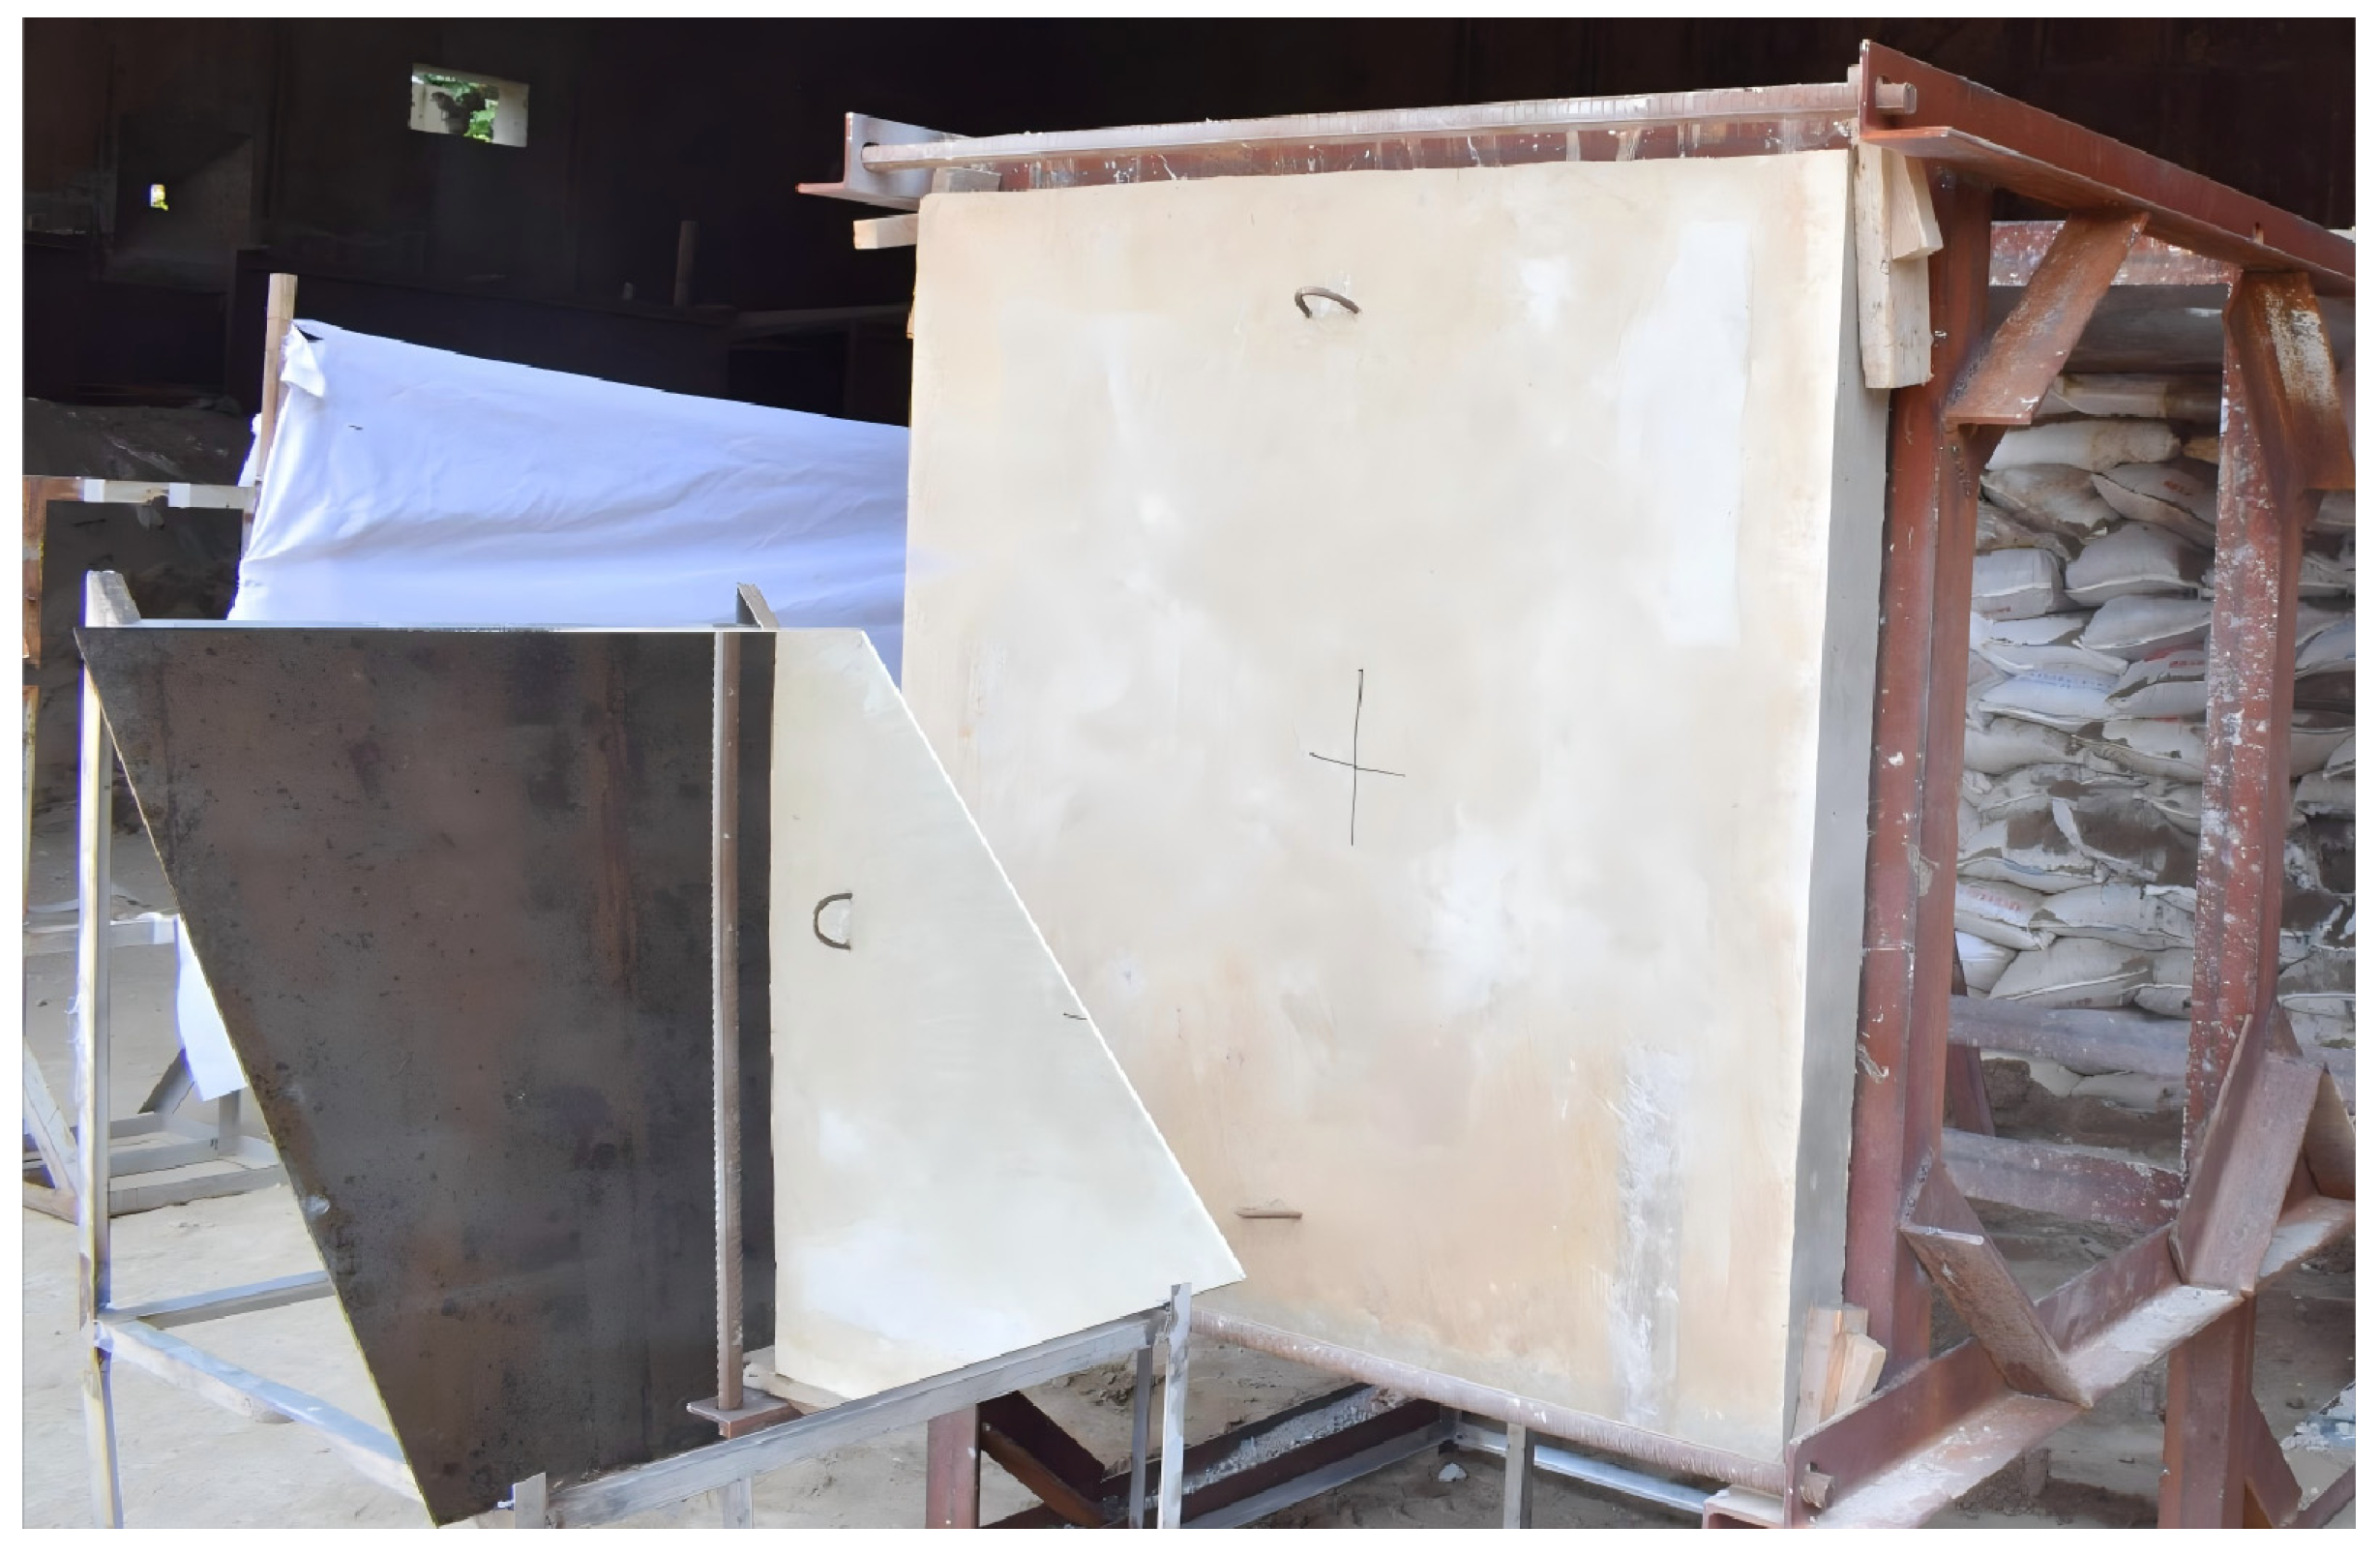
The concrete target plate is positioned on a steel target frame, with the upper and lower edges on both sides of the plate restrained by cork boards to prevent displacement caused by vibrations generated during artillery firing. The specific arrangement is shown in Figure 5.

2.2. Measurement System

Researchers have long been concerned with accurately determining the warhead’s flight attitude during experiments. Warrn et al. [19] used an orthogonal X-ray setup positioned in front of the target to record the projectile’s projections on two perpendicular planes with radiographic film. Although this method has high measurement accuracy, it has strict requirements on the experimental site and is relatively expensive. In this study, adopting the mirror-imaging concept, we derive a set of analytical expressions that enable computation of the projectile’s three-dimensional attitude angles from the spatial coordinates of key points captured by a high-speed camera system.
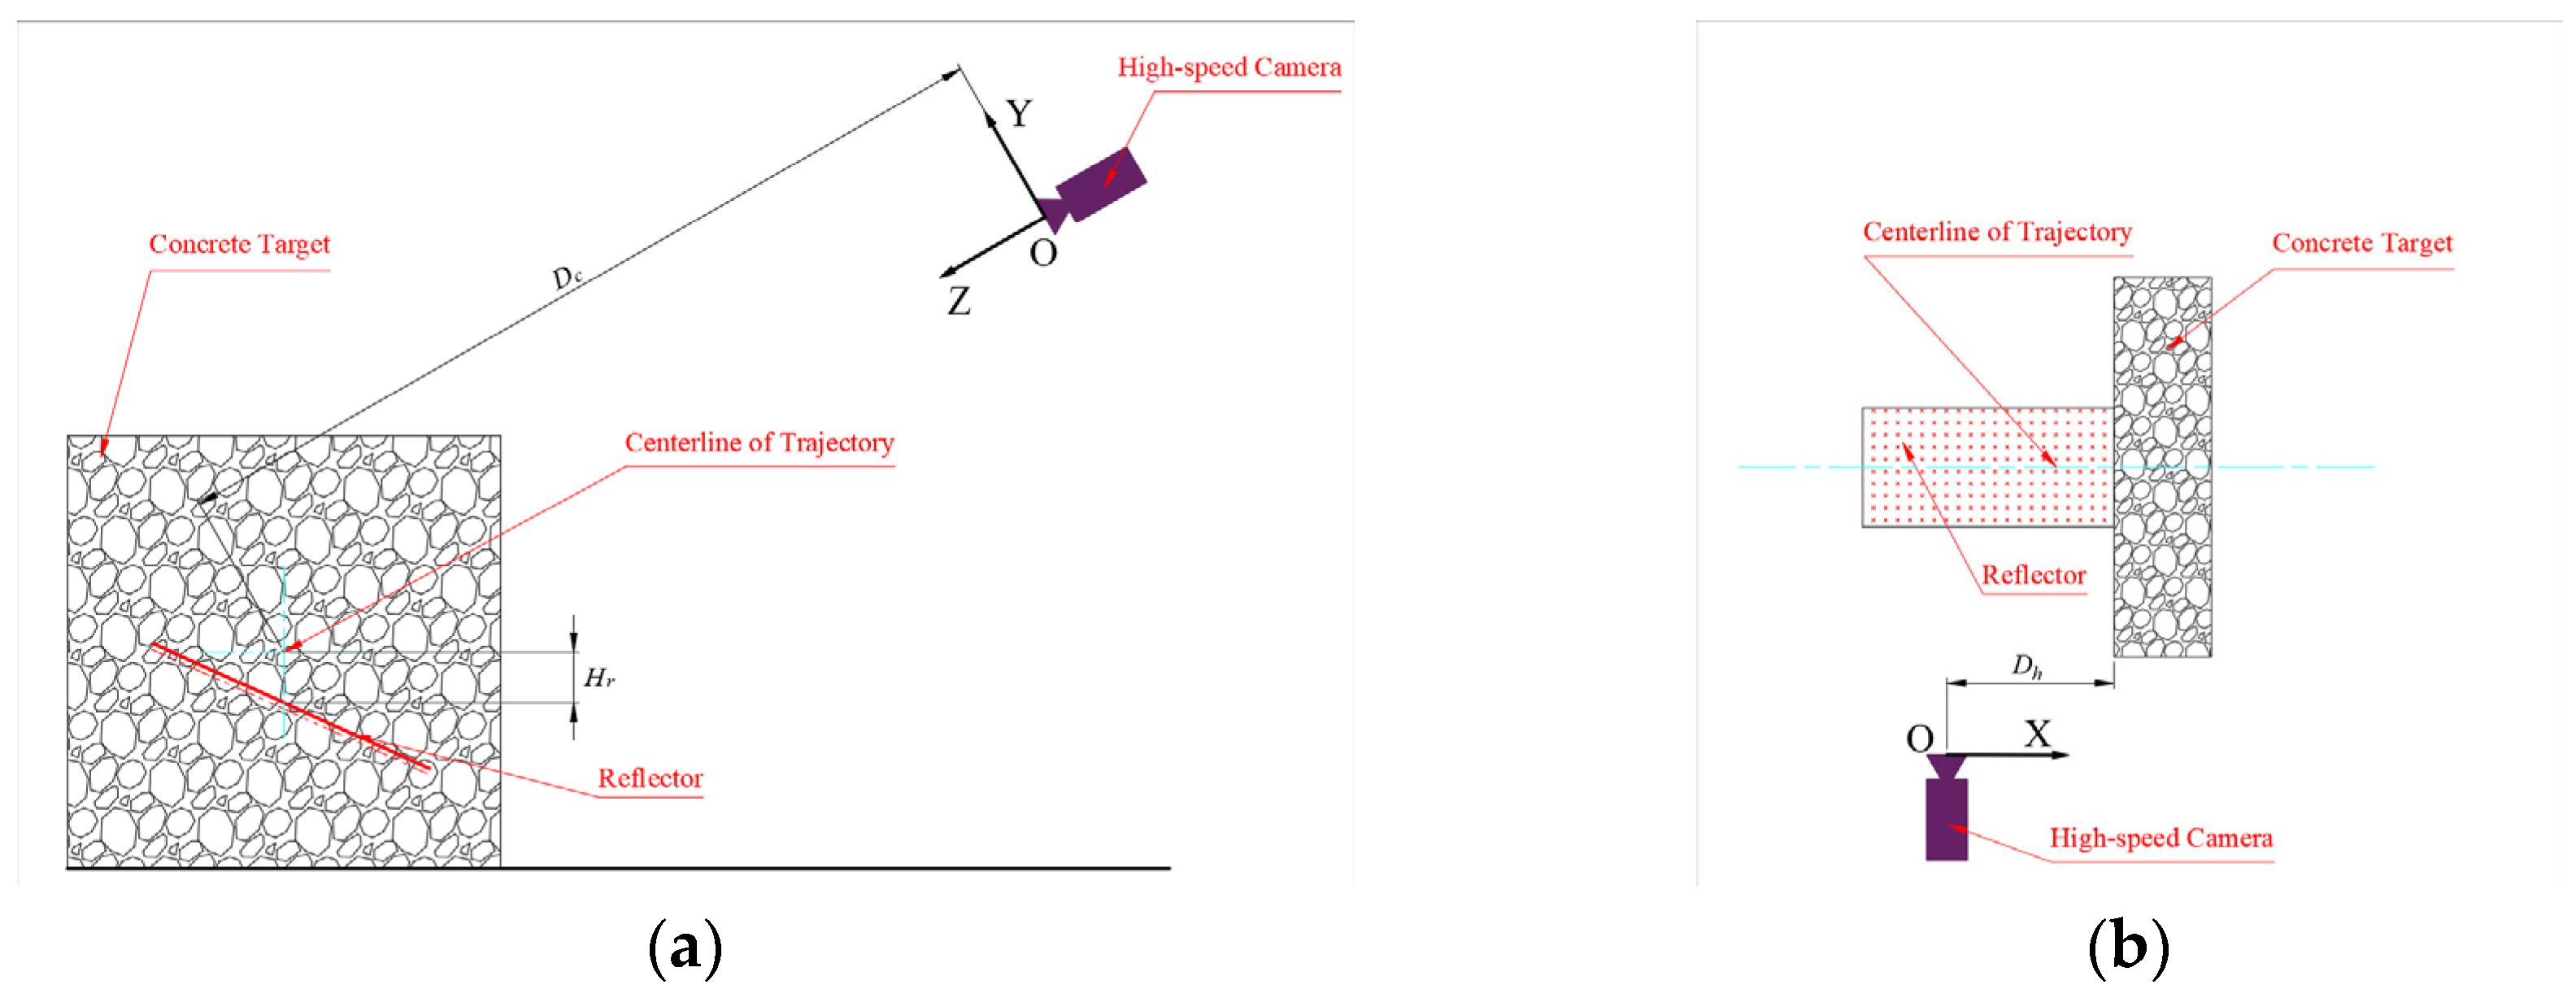
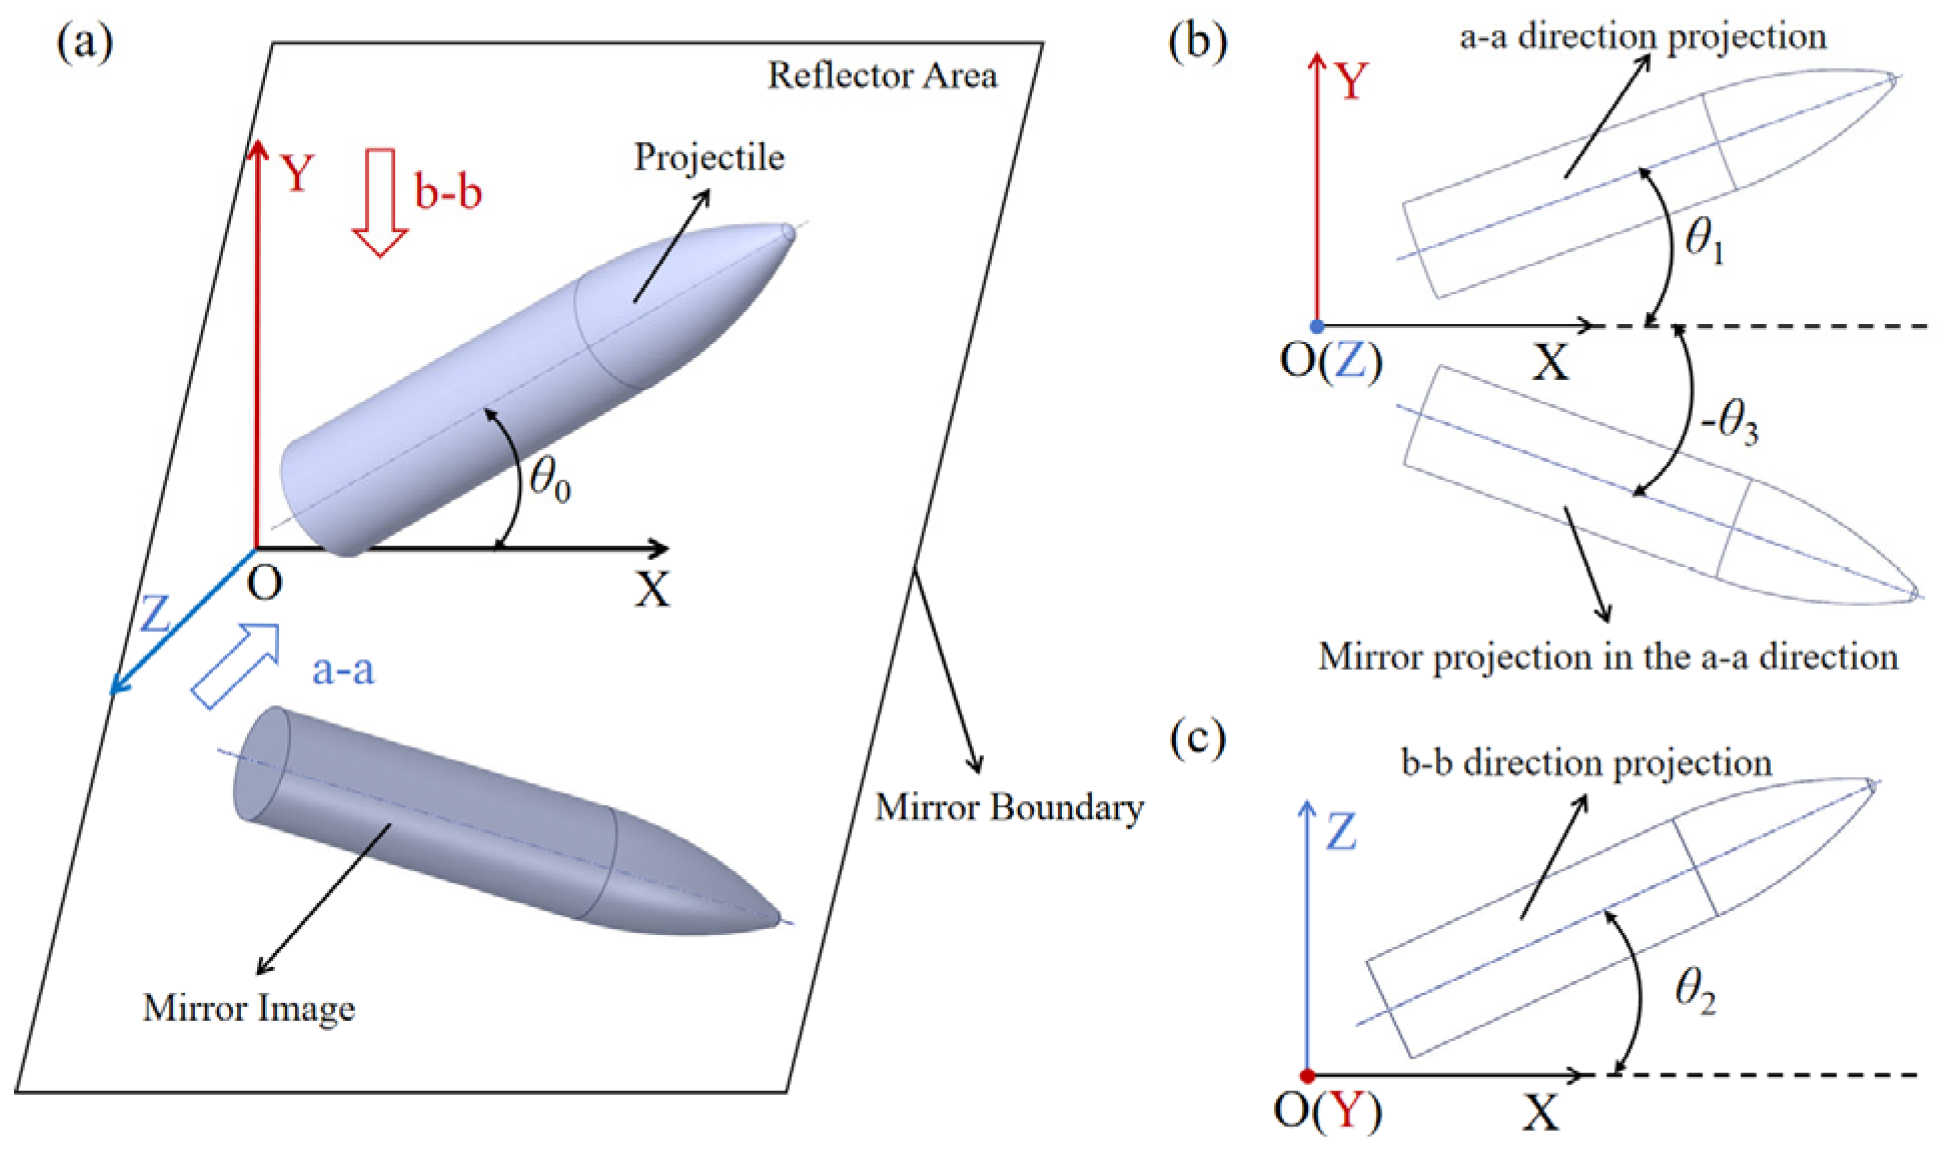
Figure 6, Figure 7 and Figure 8 present, respectively, the test system layout diagram, the mirror-angle configuration, and the decomposition of the projectile’s three-dimensional attitude angles in space. D c denotes the minimum distance from the high-speed camera to the projectile trajectory along the Z-axis; H r represents the vertical distance from the trajectory’s centerline to the mirror surface. The mirror forms an angle β 0 with the negative direction of the Z-axis and an angle β 2 with the horizontal plane, while the Z-axis itself is inclined at an angle β 1 relative to the horizontal plane.All these parameters can be accurately obtained using a laser rangefinder in combination with a level instrument.
A three-dimensional Cartesian coordinate system is established with the high-speed camera as the origin. The X-axis is defined as perpendicular to and inward from the target surface, while the Z-axis is perpendicular to the projectile’s trajectory plane, extending from the origin.
As illustrated in Figure 8, the projectile’s longitudinal axis forms an angle with the X-axis θ 0 . Its projection on the XOY plane is inclined at a certain angle to the X-axis θ 1 , while the projection of the projectile’s mirrored axis (reflected by the horizontal mirror) makes another distinct angle with the same reference line θ 3 . Furthermore, the projection of the projectile axis on the XOZ plane is also inclined relative to the X-axis θ 2 , representing the spatial relationship among the three characteristic angles.
Accordingly, let the coordinates of the projectile’s base center be expressed as (x0,y0,z0),with its total length represented by l. The spatial coordinates of the projectile tip can then be determined as (x1,y1,z1) = (x0 + lcosθ2cosθ1, y0 + lcosθ2sinθ1, z0 + lsinθ1).
The analytical expression of the line located directly beneath the trajectory centerline on the mirror surface can be written as follows:
y = H r cos β 1 z = D c + H r sin β 1
The mirror surface in three-dimensional space can be mathematically described by the following equation:
y + H r cos β 1 z D c H r sin β 1 = tan β 0
Transforming Equation (2) into the standard plane ( A x + B y + C z + D = 0 ) form yields the following coefficients for each corresponding term:
A = 0 B = 1 C = tan β 0 D = H r cos β 1 + tan β 0 D c + H r sin β 1
Using the geometric relationship for determining a point’s mirror image with respect to a plane, and omitting the term associated with a = 0, the reflected coordinates of the projectile’s base center x 0 , y 0 , z 0 and tip x 1 , y 1 , z 1 can be expressed as follows:
x 0 , y 0 , z 0 = x 0 , B 2 y 0 + C 2 y 0 2 B C z 0 2 B D B 2 + C 2 , B 2 z 0 C 2 z 0 2 B C y 0 2 C D B 2 + C 2
x 1 , y 1 , z 1 = x 1 , B 2 y 1 + C 2 y 1 2 B C z 1 2 B D B 2 + C 2 , B 2 z 1 C 2 z 1 2 B C y 1 2 C D B 2 + C 2
Simultaneous solution of Equations (4) and (5) yields the following expressions:
y 1 y 0 x 1 x 0 = B C B + C tan θ 1 + 2 B C sec θ 1 tan θ 2 B 2 + C 2 = tan θ 3
In Equation (6), the angles θ1 and θ3 can be directly determined from the high-speed image data. As indicated by this equation, the projectile’s orientation is not influenced by the position coordinates of its base.
From Equation (7), the value of θ2—defined as the angle between the projectile’s projection on the XOZ plane and the X-axis—can be derived. According to the geometric projection relationships in three-dimensional space, the overall inclination angle θ0 between the projectile axis and the X-axis can then be determined from the following relation:
θ 0 = arccos   1 cos 2 θ 1 + 1 cos 2 θ 2 1 0.5
The velocity of the projectile’s center of mass is inferred from the measured motion of its tip, under the assumption that the center of mass remains within the ballistic plane during flight. The projectile’s spatial position and orientation are identified at two successive instants from the high-speed images separated by a time interval Δt, which is determined by multiplying the camera’s inter-frame period by the number of frames between the two captures. The displacement of the projectile nose between these frames, is converted into its actual physical displacement through a proportional calibration based on the pre-test reference image (see Figure 9b).
At the two observation instants, the angles between the projectile axis and the X-axis in the imaging plane—obtained directly from the high-speed camera—are denoted as θ1 and θ1*. The corresponding angles between the projectile axis and the X-axis in the XOZ plane, determined from the 3D attitude reconstruction system, are θ2 and θ2*. Let l0 denote the distance from the projectile tip to its center of mass. Using these quantities, the horizontal velocity (vx) of the projectile’s center of mass can be evaluated as follows:
v x = Δ x 2 Δ x 1 l 0 cos θ 2 * cos θ 1 * cos θ 2 cos θ 1 Δ t

2.3. Experimental Results and Analysis

A total of eight penetration tests were conducted using thin concrete targets. The high-speed imaging system and the aforementioned measurement setup were employed to capture the projectile’s velocity, attitude angles, and angular velocity before and after penetration.
Let Vf and Vb denote the velocities of the projectile just before impact and after exiting the target, respectively. Similarly, θ0f and θ0b represent the projectile’s attitude angles before and after impact, respectively. The actual measured thickness of the target plate is denoted as Th, and Dt represents the measured distance from the projectile tip to the rear surface of the target after penetration.
The key physical parameters measured before and after impact in the tests are summarized in Table 3.
A comparative analysis of test cases S7 and S8 in Table 3 reveals that, under similar initial attitude angles and velocities, an increase in target thickness leads to a larger attitude angle of the projectile near the rear surface of the target. Similarly, a comparison between S4 and S5 indicates that as the initial attitude angle increases, the projectile exhibits a more pronounced attitude angle after penetrating the target plate.
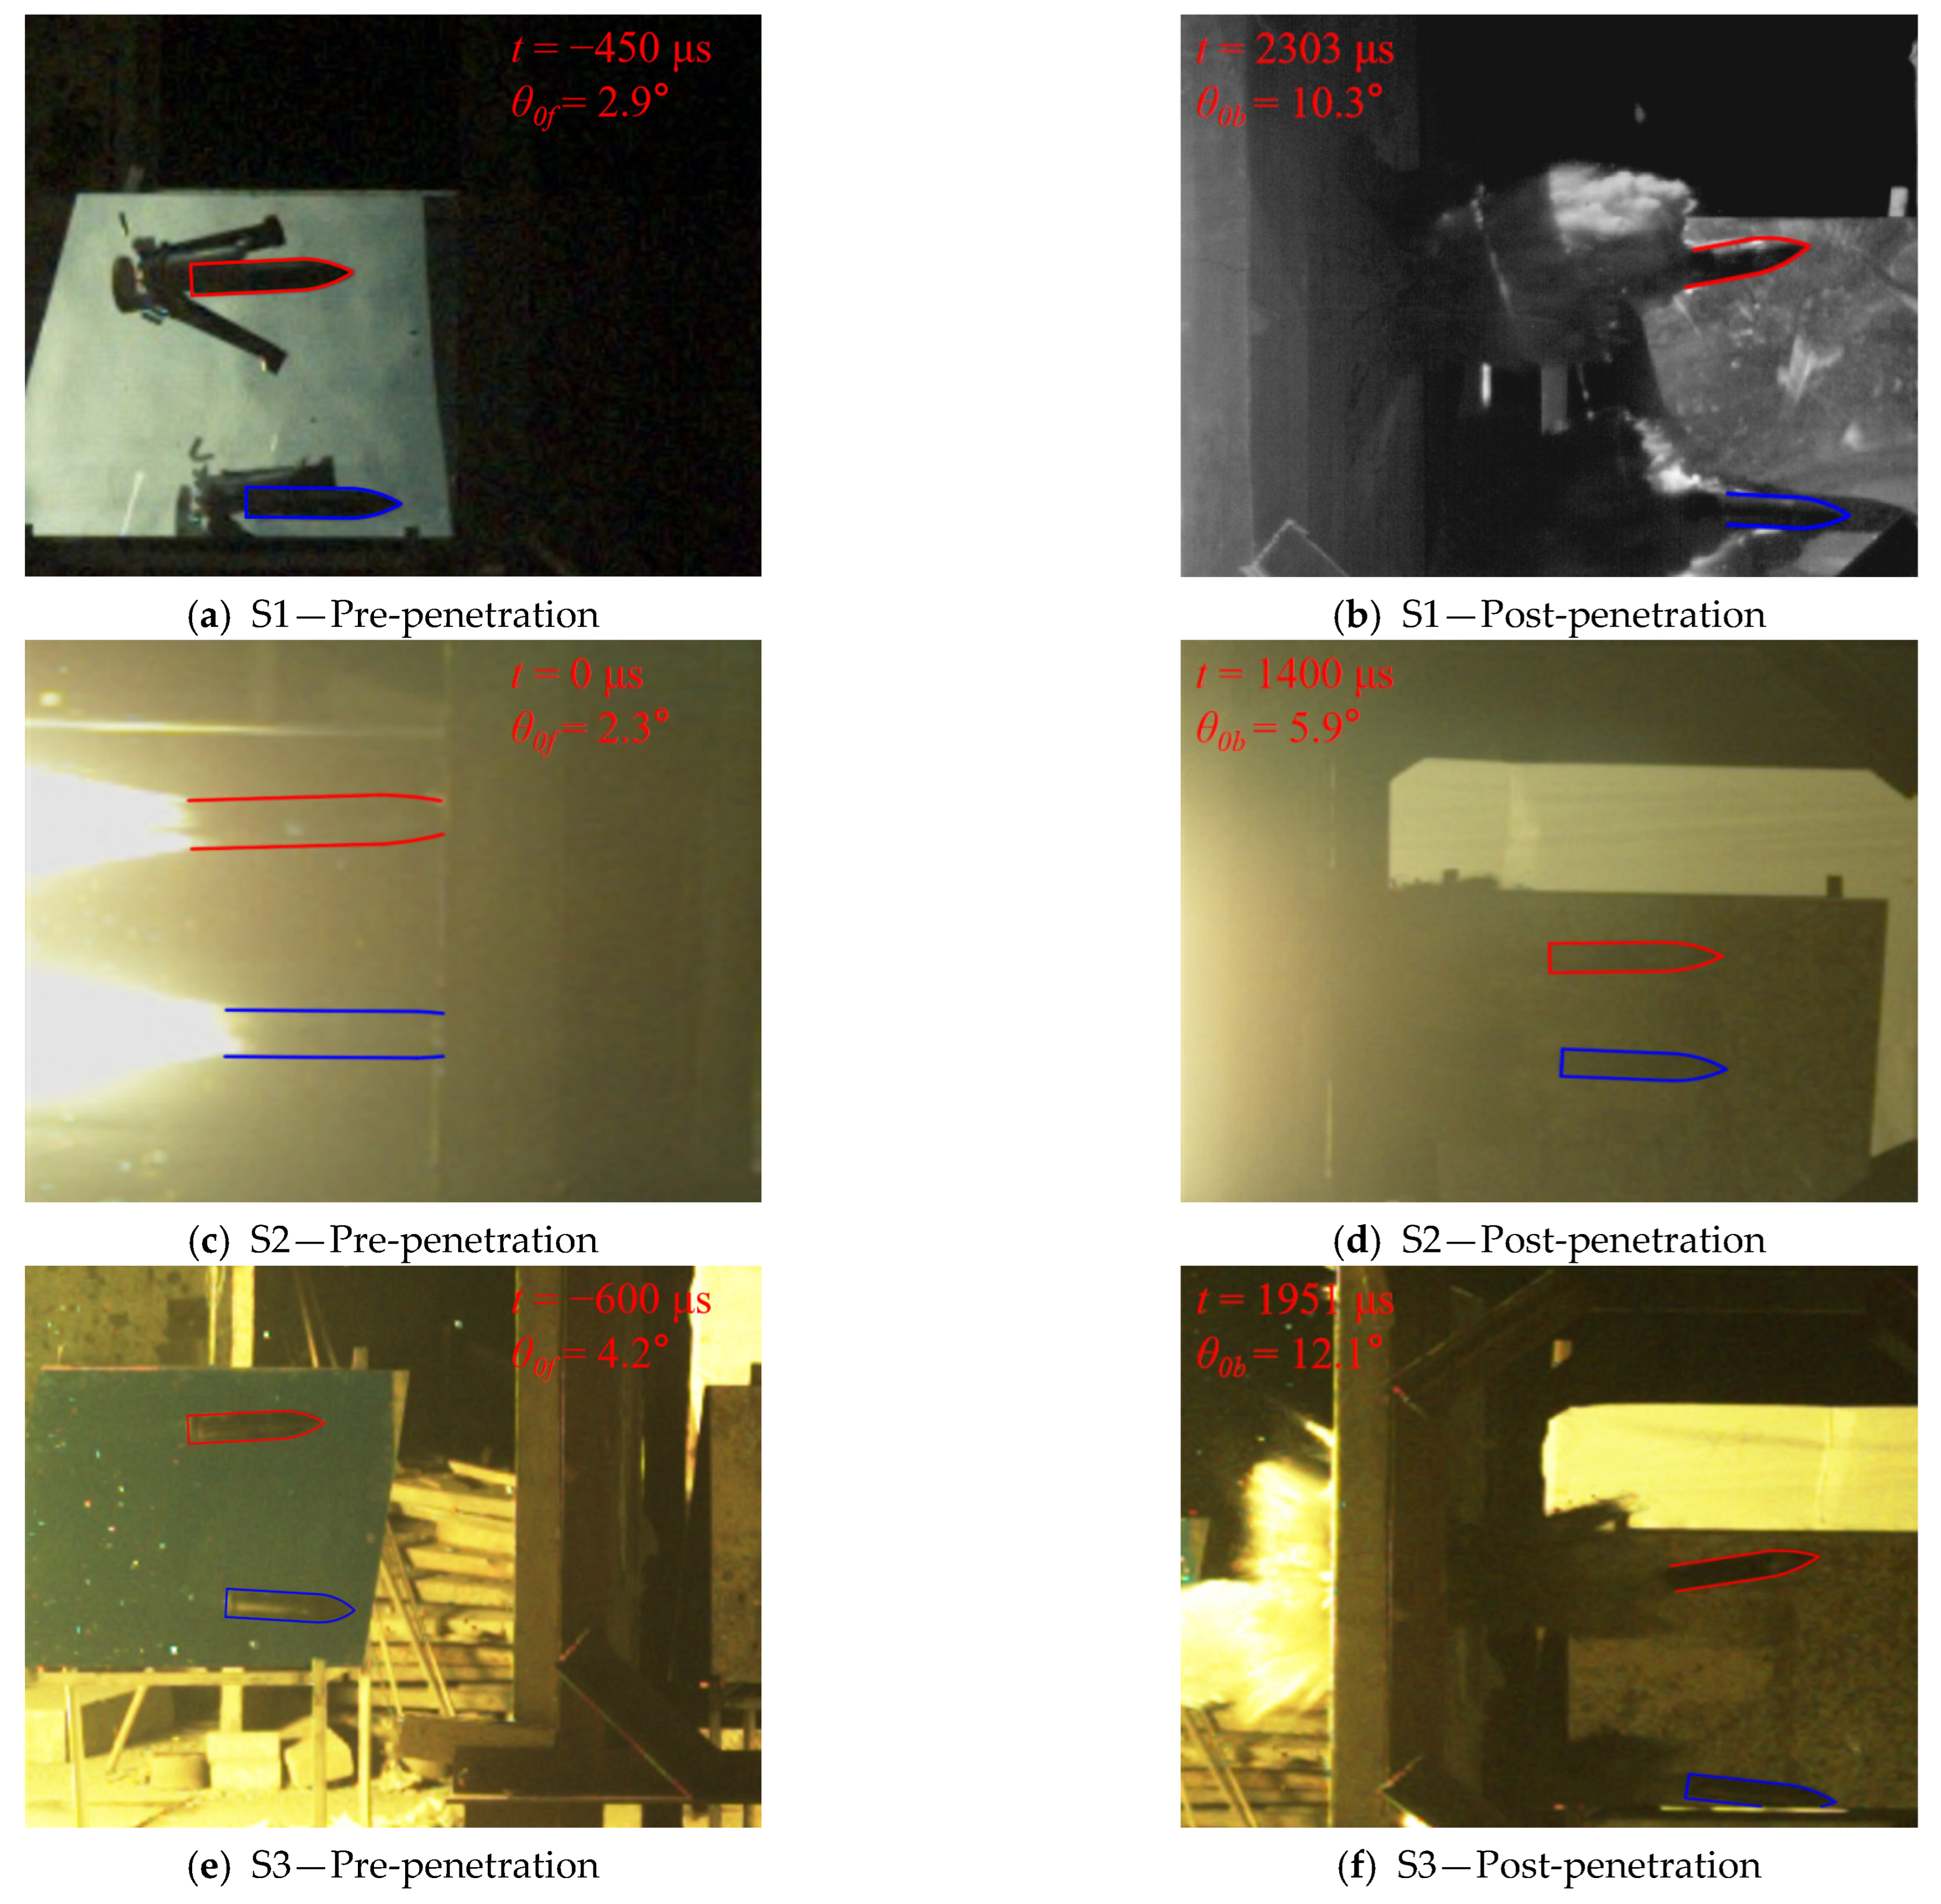
The moment immediately before the projectile contacts the target plate, corresponding to the frame captured just prior to impact, is defined as the time zero point. In the high-speed images, the projectile’s outline is highlighted with red lines, while the outline of its mirror image is marked with blue lines. Figure 10 shows selected frames illustrating the projectile’s posture before and after penetrating a single-layer concrete target. Except for test case S2, where the mirror image before impact is not clearly visible, the projectile’s reflection on the mirror surface is well-defined at all other time points.

2.4. Analysis of Experimental Errors

Concrete, as a complex multiphase and multiscale material, exhibits local variability in its response to external loading due to the heterogeneity of its internal mesostructure. The HSREM (Heterogeneous Structural Random Element Method) proposed by Zhang et al. [20] fully considers the arbitrarily distributed stochastic characteristics of structural materials and effectively captures the random response behavior of heterogeneous materials under static loading. However, under explosive or impact loading, the influence of mesostructural differences on the overall response of concrete is relatively minor, as also investigated in the work of Wu Cheng [21].
In this study, the main source of experimental error lies in the processing of the projectile’s angle and flight distance derived from high-speed photography images. When using PCC (Phantom Camera Control, Version 3.8) software to extract the coordinates of specific points, the cursor may deviate slightly and snap to adjacent pixels. It is assumed that the cursor may fluctuate within a 3 × 3 pixel range around the true pixel center. The physical length represented by each pixel in the software is provided in Table 4. Based on coordinate variations within this pixel grid, the corresponding maximum and minimum values of the calculated projectile attitude angle, derived from θ1 and θ3, are listed in Table 5.
As shown in Table 5, the attitude angle error caused by cursor movement is primarily within 2°. The relatively larger errors in the post-target attitude angles for tests S3, S4, S5, S7, and S8 are attributed to the limited visibility of the projectile’s contour in the post-target region, where even minor endpoint displacements can lead to significant angular deviations.
With respect to velocity, the displacement error caused by cursor deviation—typically a few millimeters—is negligible compared to the projectile’s overall travel distance of several tens of centimeters and is therefore not analyzed in this study.
Figure 11 presents bar charts with error bars for the pre- and post-target projectile attitude angles across different tests.

3. Numerical Investigation

3.1. Introduction of Numerical Model

The projectile dimensions were kept consistent with those used in the experiment. Meshing was performed using SOLID164 elements in LS-DYNA. As no significant projectile deformation was observed during the experiment, the RIGID material model was employed for numerical simulation. The projectile was assigned a density of 7.71 g/cm3 and discretized using tetrahedral elements to improve surface mesh conformity.
In contrast, the target plate was expected to undergo large deformation and failure during the penetration process. To ensure higher computational accuracy, the target was meshed using hexahedral elements instead of tetrahedral. The computational mesh of the projectile is shown in Figure 12.
The ratio of the maximum coarse aggregate particle size in the concrete to the projectile diameter was 0.521, which is smaller than the threshold value of 0.949 reported by Wu [20], where consistency between meso-scale and macro-scale modeling was observed. Therefore, a macro-scale modeling approach was adopted in this study to improve computational efficiency.
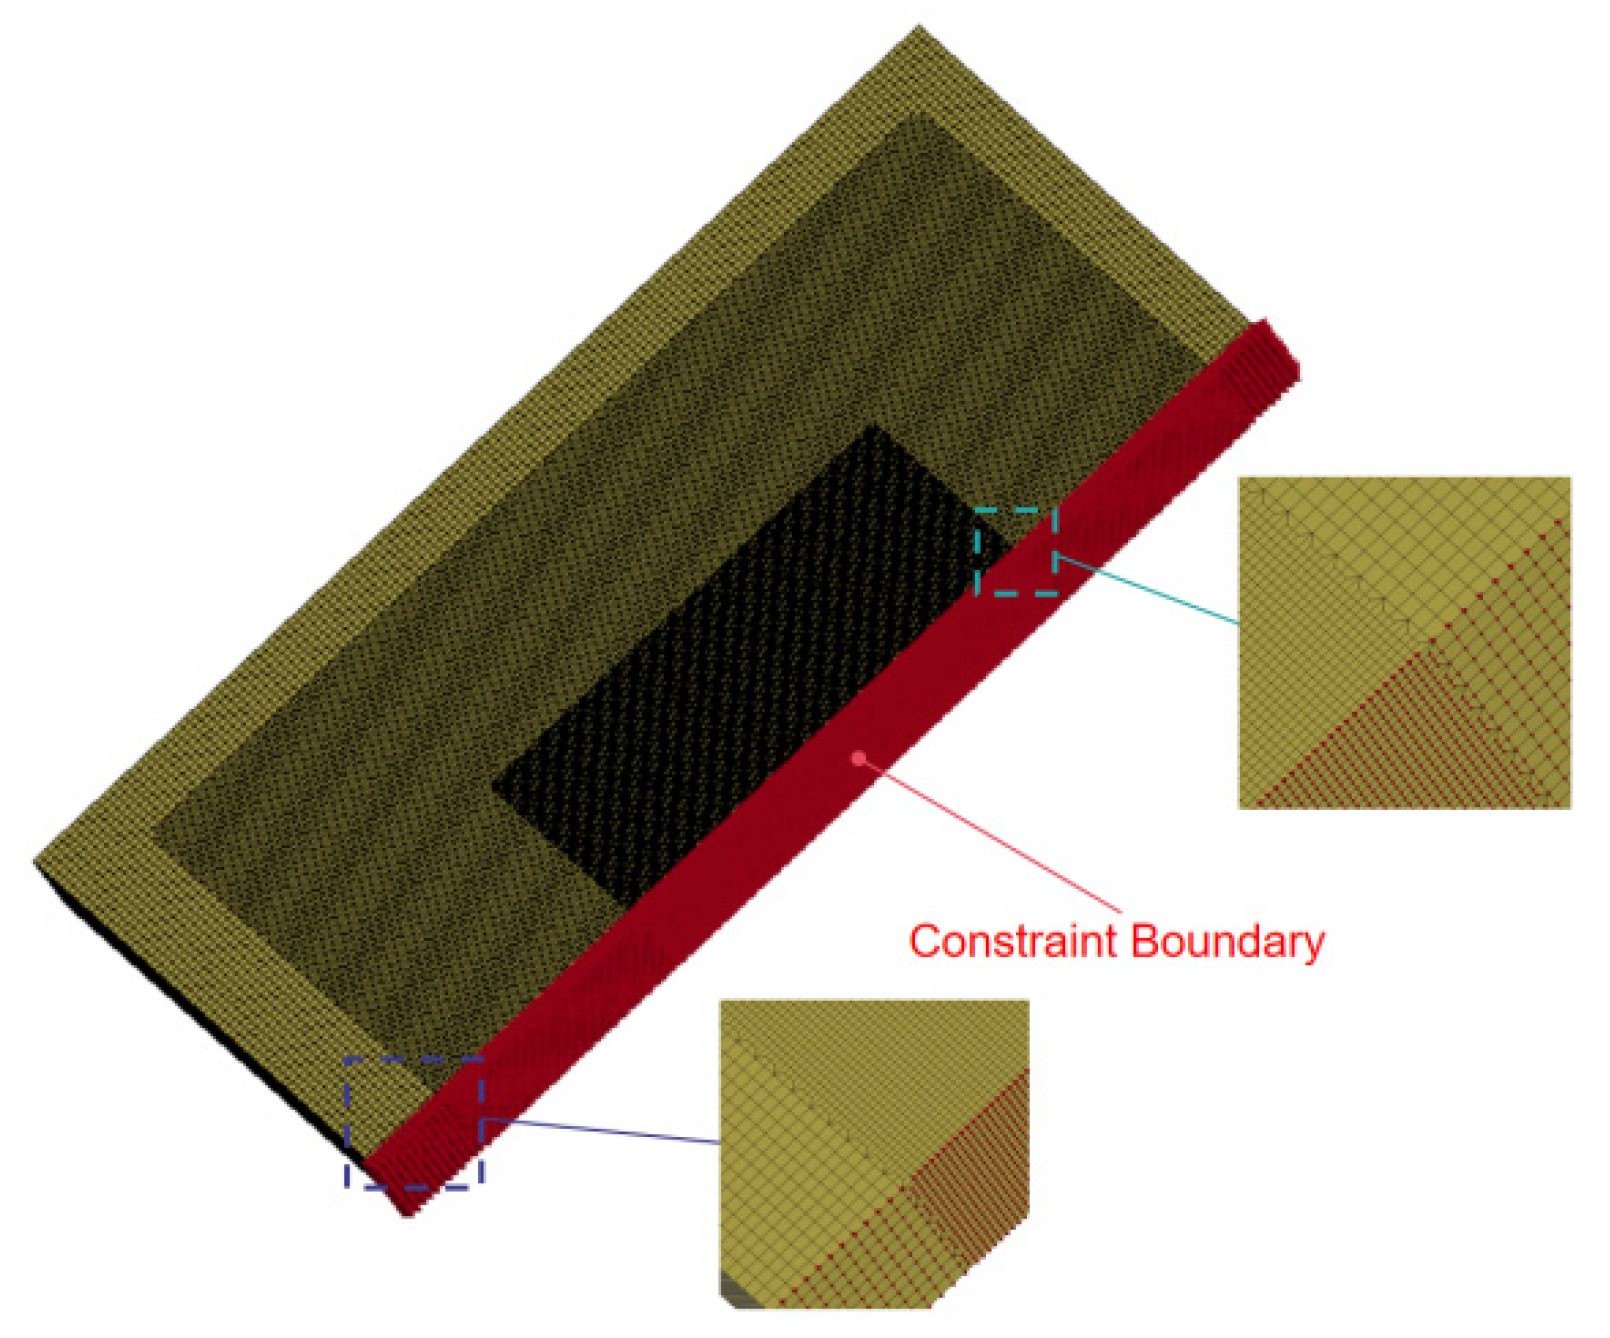
To reduce computational cost, a half-model was used in the simulation, with the symmetry constraint applied at the z = 0 plane. To further accelerate computation, the target plate was divided into three distinct regions with different mesh resolutions. The central region, which is in direct contact with the projectile, was defined as a refined mesh zone measuring 600 mm × 600 mm, with the mesh size consistent with that of the projectile. Surrounding the refined zone is a transition region measuring 1200 mm × 1200 mm, where the mesh size is twice that of the central zone. The outermost area is the boundary region, with a mesh size four times that of the refined zone.
These three regions were connected using a transitional mesh system with a refinement ratio of 4:2. The CONSTRAINED_GLOBAL keyword in LS-DYNA was used to define the XOY plane as a symmetry boundary. The complete mesh configuration of the target plate and the applied boundary constraints are shown in Figure 13.
The RHT (Riedel–Hiermaier–Thoma) constitutive model was adopted to represent the behavior of concrete material [22]. Developed at the Ernst Mach Institute in Germany by Riedel, Hiermaier, and Thoma, this model is widely used to simulate the dynamic mechanical behavior of brittle materials such as concrete under high-strain-rate loading conditions. It accounts for various effects, including pressure hardening, strain hardening, strain rate sensitivity, compression and tension meridians using the third invariant, damage evolution, volumetric compaction, and post-failure softening due to cracking. When coupled with an appropriate equation of state, the RHT model provides accurate predictions of concrete response under impact loading.
The MAT_ADD_EROSION keyword in LS-DYNA was used to define additional failure criteria. Element erosion occurs when the maximum effective strain reaches 1.2 or the volumetric strain reaches 0.8. The material parameters for the C35 concrete RHT model are listed in Table 6.

3.2. Mesh Convergence Analysis

To verify the rationality of the selected mesh size and to achieve a balance between numerical accuracy and computational efficiency, a mesh convergence analysis was carried out. In addition to the original scheme, three additional simulations were performed using different mesh sizes in the refined regions of both the projectile and the concrete target. These included a coarse, medium, and fine mesh scheme with an element size of 5 mm, 3.5 mm, and 2 mm, respectively.
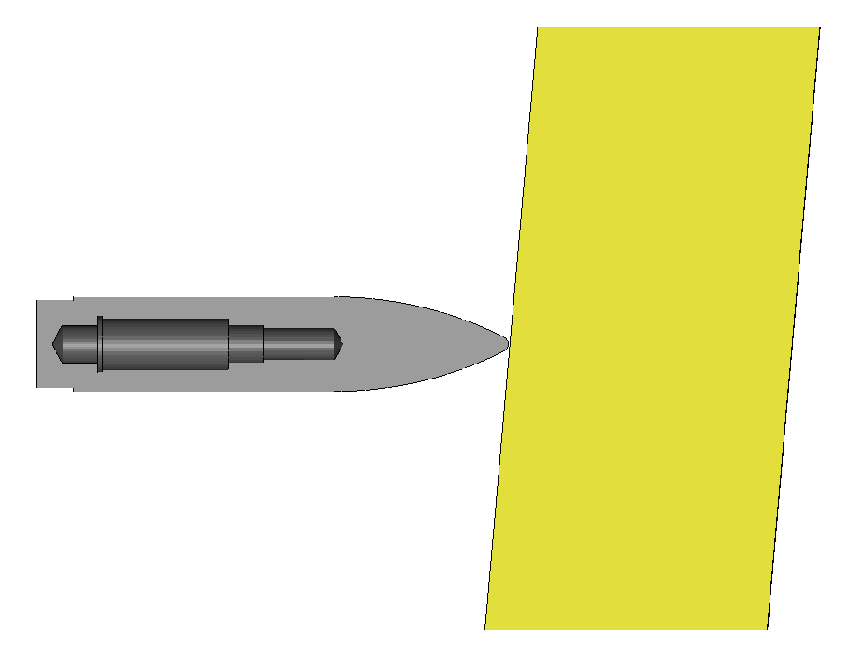
To account for the influence of projectile obliquity and angle of attack, the target plate was rotated during model construction to introduce an initial impact angle. The INITIAL_VELOCITY_GENERATION keyword was employed to assign an initial velocity to the rigid projectile, incorporating an initial angle of attack. For all mesh schemes, the material parameters, boundary conditions, and mesh transition strategy for the target plate were kept consistent. Figure 14 illustrates the projectile meshing for the three additional mesh schemes. The setup of the projectile and target in the mesh convergence study is depicted in Figure 15.
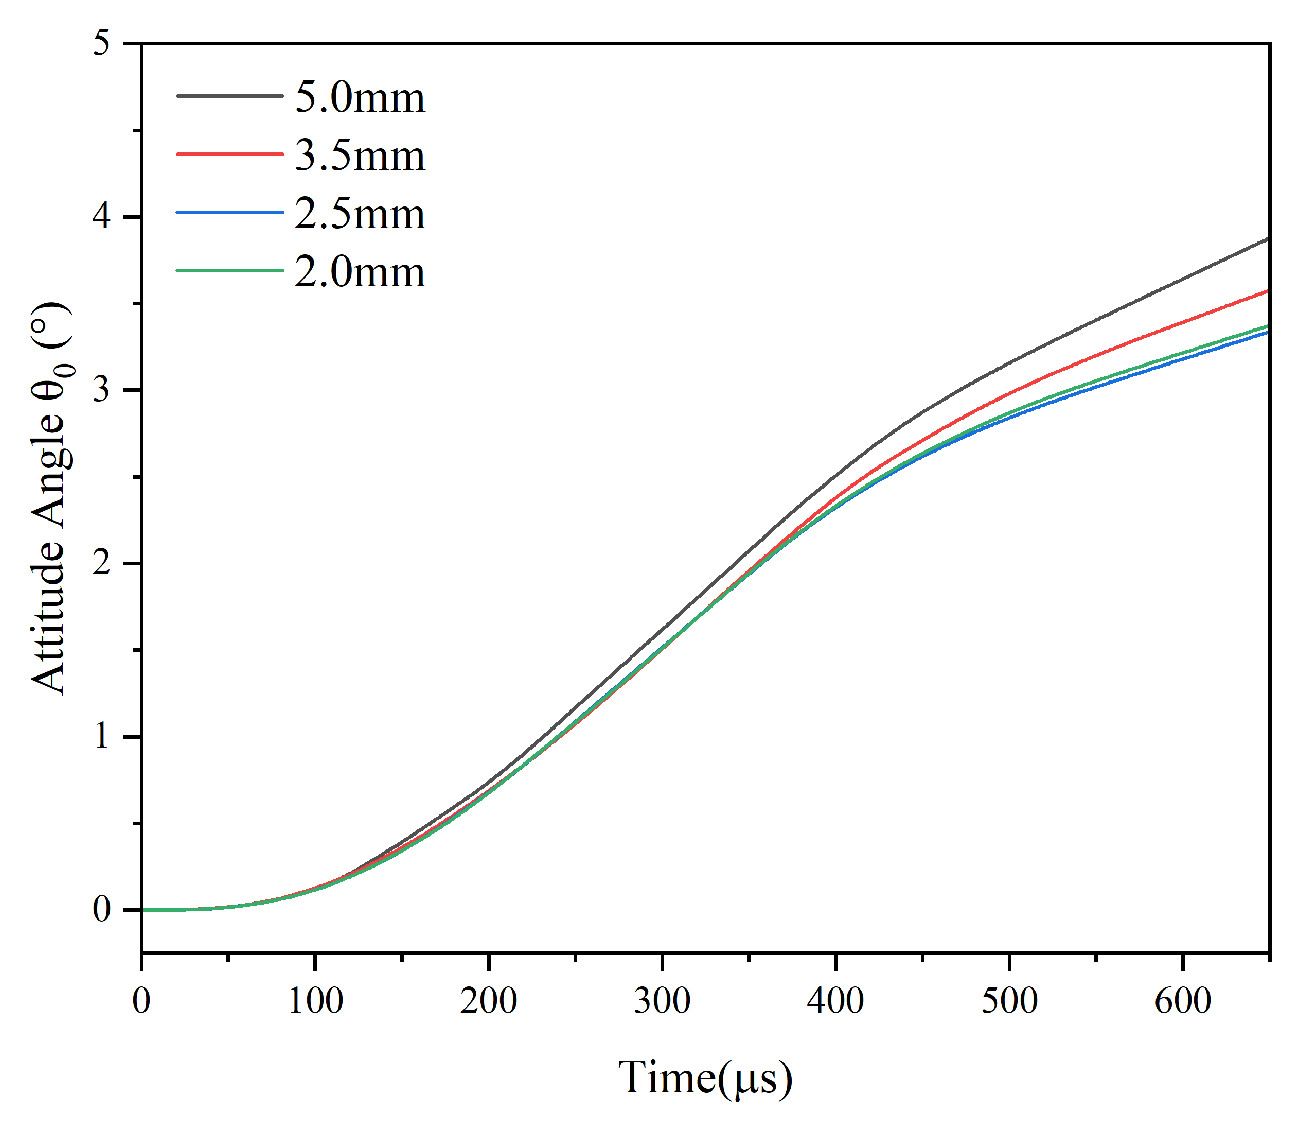
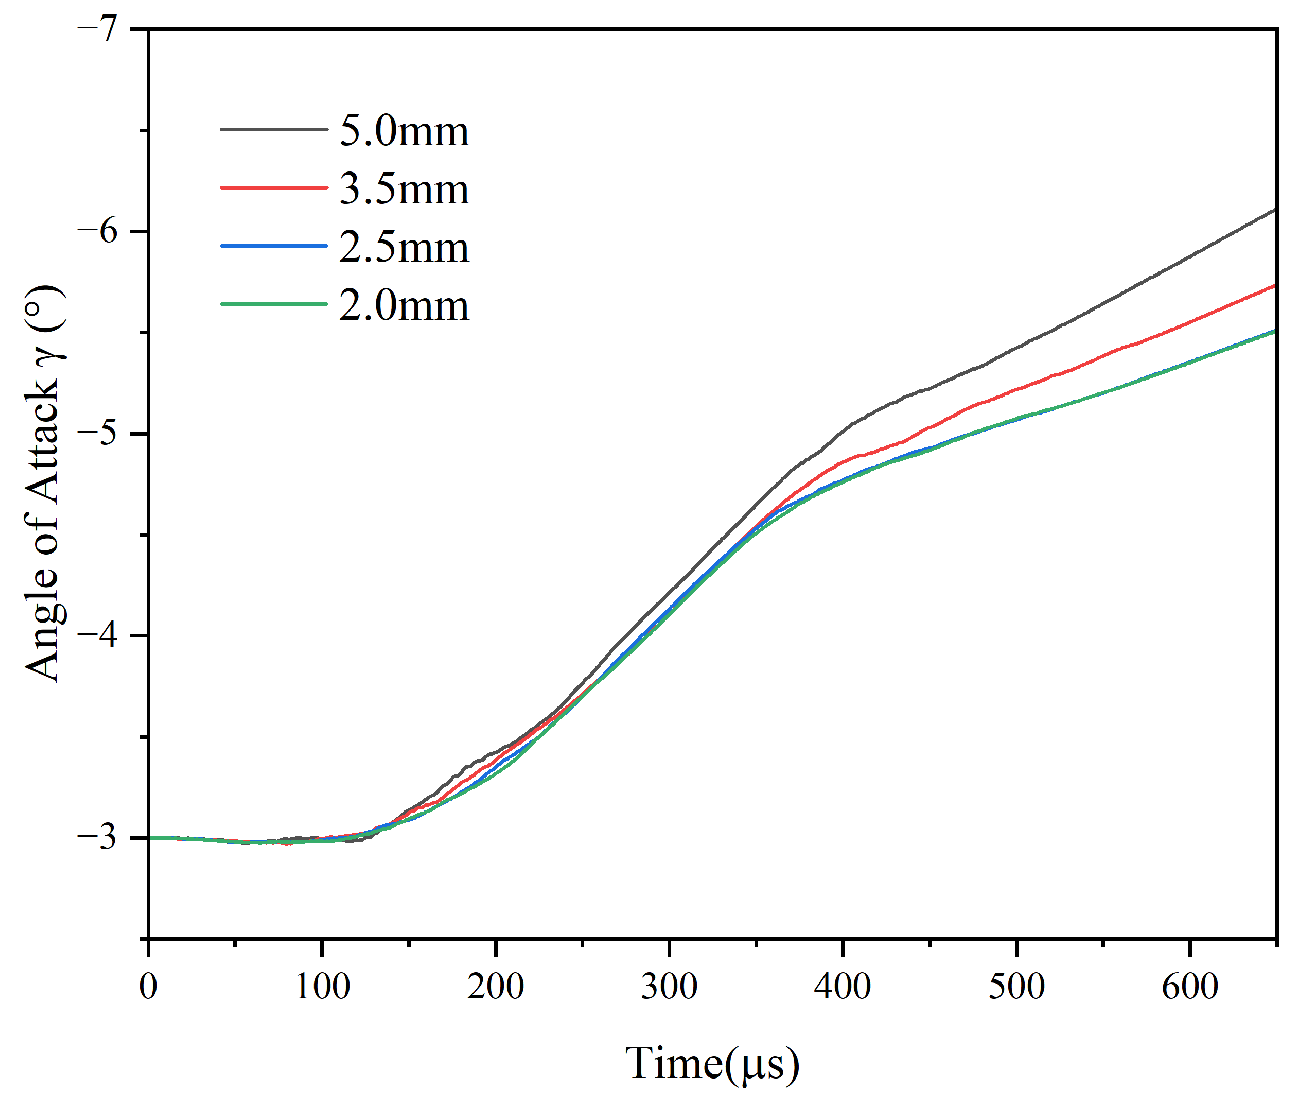
Under different mesh resolutions, the DATABASE_HISTORY_NODE keyword was used to monitor the real-time spatial positions of the front and rear nodes along the projectile axis. Based on these positions, the instantaneous attitude angle θ0 of the projectile was calculated. Combined with the projectile’s velocity at each time step, the instantaneous angle of attack γ was obtained. The time histories of the projectile’s orientation angle and angle of attack under different mesh schemes are shown in Figure 16 and Figure 17.
As shown in Figure 16 and Figure 17, the curves of the projectile’s real-time attitude angle and angle of attack are nearly identical when the mesh sizes are 2.5 mm and 2 mm. This indicates that the 2.5 mm mesh scheme satisfies the convergence criterion for simulating the projectile’s angle of attack penetration behavior.

3.3. Validation of Numerical Model

Based on the experimentally measured impact velocity and attitude of the projectile, these values were used as the initial conditions for the numerical simulations conducted in this study. The projectile’s velocity and attitude data at the post-penetration observation time, obtained from the simulations, were then compared with the corresponding experimental results. Detailed comparison data are provided in Table 7.
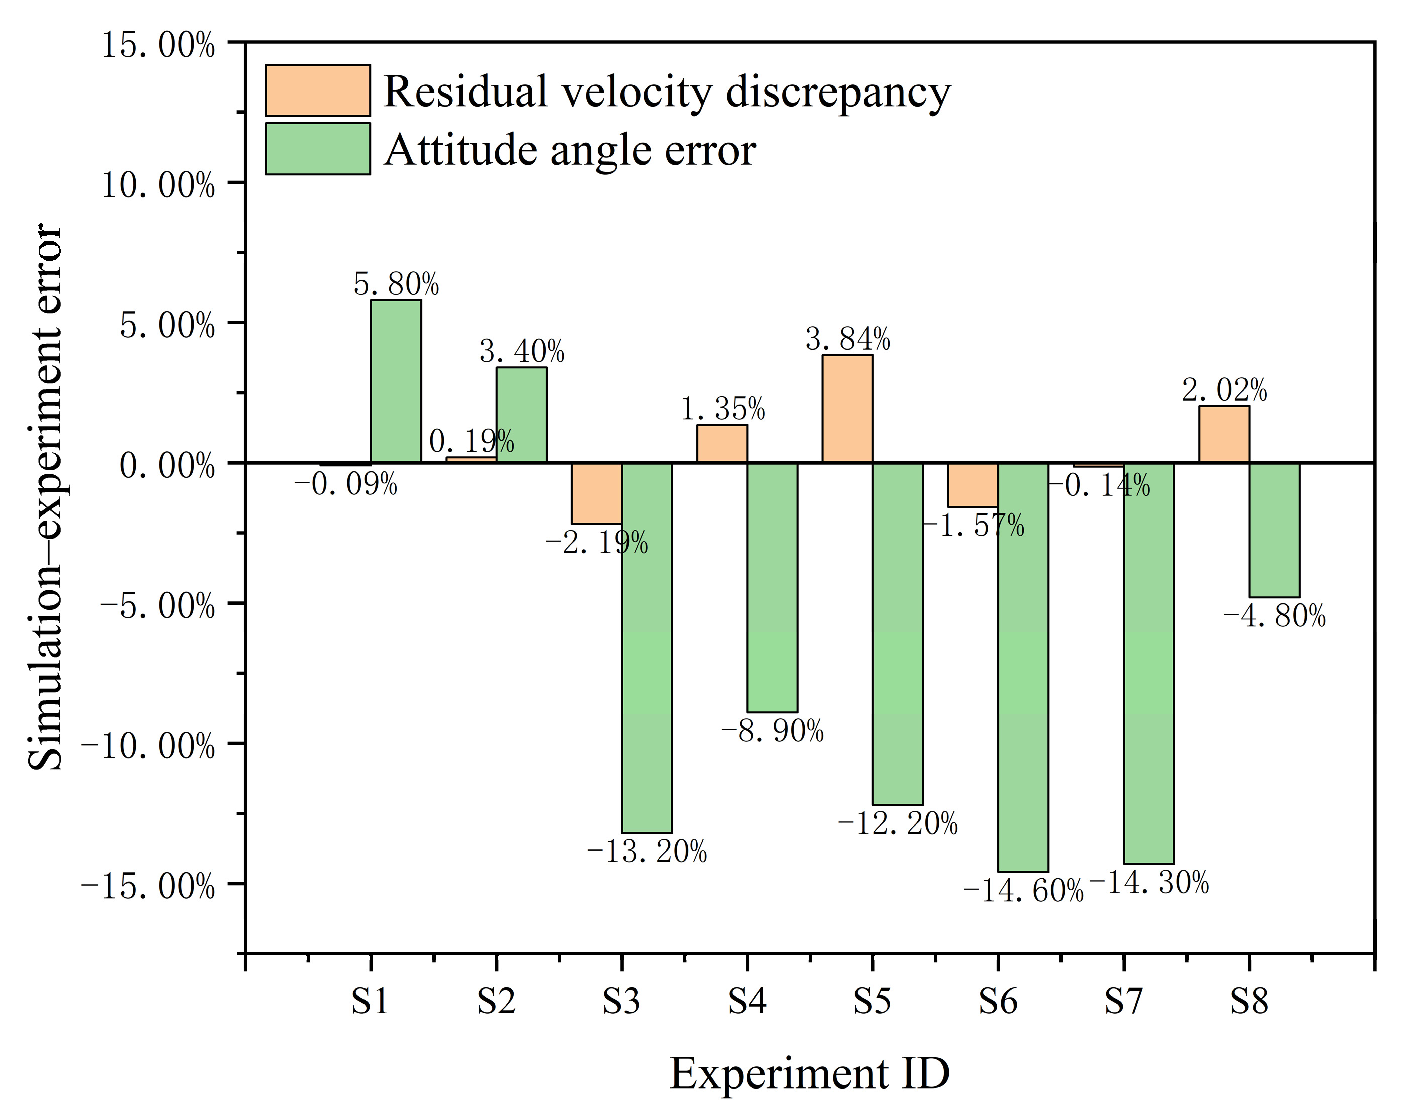
The discrepancies in residual velocity and attitude angle between simulation and experiment are illustrated in Figure 18.
As shown in Table 7, the difference between the projectile velocities obtained from the numerical simulations and those measured in the experiments remains within 5%, indicating good agreement. The relative error in the simulated attitude angles is within 15%, without the absolute error exceeding 4°. Considering that the upper and lower bounds of the attitude angle error calculated in Section 2.4 are approximately 5°, the numerical results are deemed to be in good overall agreement with the experimental observations. Furthermore, the test cases exhibiting higher simulation errors are highly consistent with those showing greater experimental uncertainties, as discussed in the error analysis section, thereby reinforcing the reliability of the simulation results. Therefore, the numerical simulation method and material parameters adopted in this study can accurately reproduce the projectile’s penetration process into thin concrete targets at an angle of attack.

3.4. Numerical Analyses

To investigate the influence of projectile–target conditions on trajectory deflection, numerical simulations were performed using the previously established modeling approach and material parameters. The simulations focused on the process of projectile penetration into thin concrete targets at an angle of attack. A single-variable control method was employed to separately examine the effects of impact velocity, initial attitude angle, and target thickness on the trajectory deflection behavior.

3.4.1. Influence of Impact Velocity

Under the initial conditions of a target thickness of 180 mm and a projectile initial attitude angle of 10°, simulations were performed with impact velocities ranging from 550 m/s to 1000 m/s. The projectile’s velocity and attitude angle were recorded when the tip of the projectile reached a position 320 mm beyond the rear surface of the target. The corresponding simulation results are summarized in Table 8.
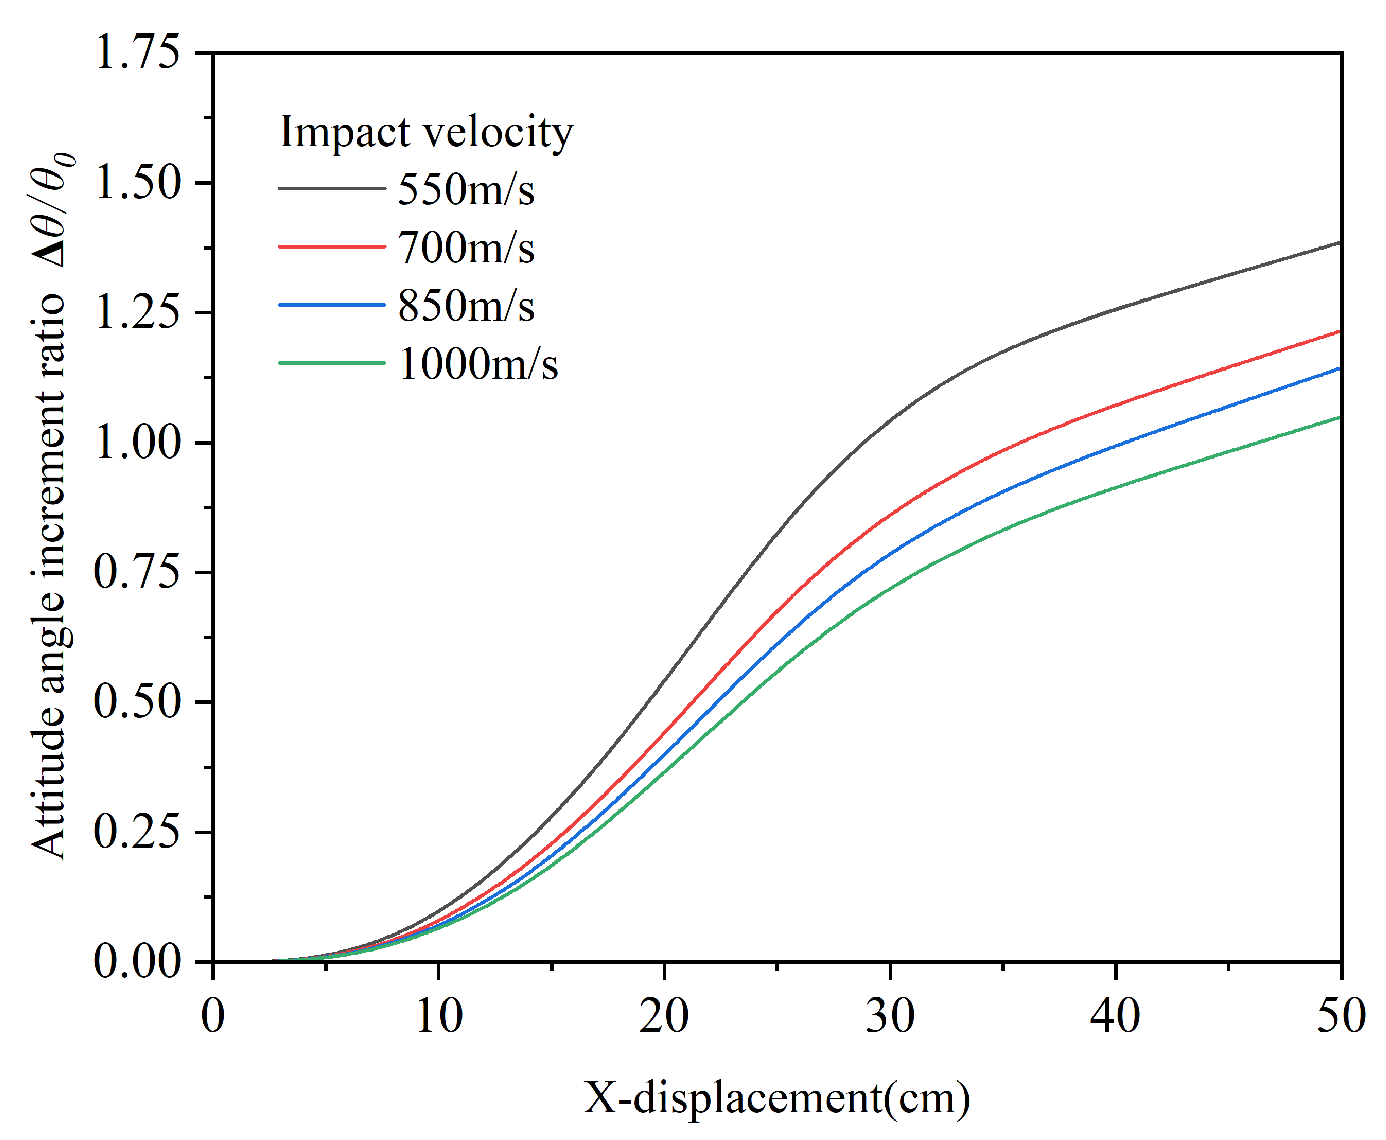
The variation trends of the projectile’s attitude angle rate and angle of attack rate with respect to its displacement in the X-direction under different impact velocities are shown in Figure 19 and Figure 20, respectively. It is observed that impact velocity exerts limited influence on the post-perforation attitude angle and angle of attack, as their respective variations remain below 15% and 5% within the velocity range of 550 to 1000 m/s.
As indicated by Table 8 and Figure 19, the rate of change in the projectile’s attitude angle increases with increasing impact velocity throughout the penetration process.
Analysis of the curves in Figure 20 shows that the evolution of the angle of attack rate can be divided into four distinct stages. The first stage corresponds to the crater formation phase, during which the angle of attack gradually decreases as penetration proceeds. In this stage, the angle of attack rate is negatively correlated with the impact velocity—that is, the higher the impact velocity, the smaller the rate of change in the angle of attack. This stage consistently ends when the horizontal displacement of the projectile tip reaches approximately 9 cm.
The second stage corresponds to the penetration plugging phase, during which the angle of attack gradually increases. In this stage, projectiles with lower impact velocities exhibit larger angles of attack over the same penetration distance.
The third stage, referred to as the breakthrough plugging phase, begins when the projectile nose exits the target. At this point, due to the larger post-penetration deflection associated with lower impact velocities, the projectile tail remains in contact with the target, producing a restraining effect on the projectile’s attitude deflection. As a result, the rate of increase in the angle of attack slows down.
The final stage occurs once the projectile is fully detached from the target plate. At this point, the projectile continues to rotate with the angular velocity acquired at the exit moment, while its translational velocity remains constant. Consequently, the angle of attack increases linearly with flight time.

3.4.2. Influence of Initial Attitude Angle

In this set of numerical simulations, the impact velocity was fixed at 850 m/s and the target thickness at 180 mm, while the initial attitude angle varied from 5° to 30°. The projectile’s velocity and attitude angle were recorded when the projectile tip reached a position 320 mm beyond the rear surface of the target. The corresponding simulation results are summarized in Table 9.
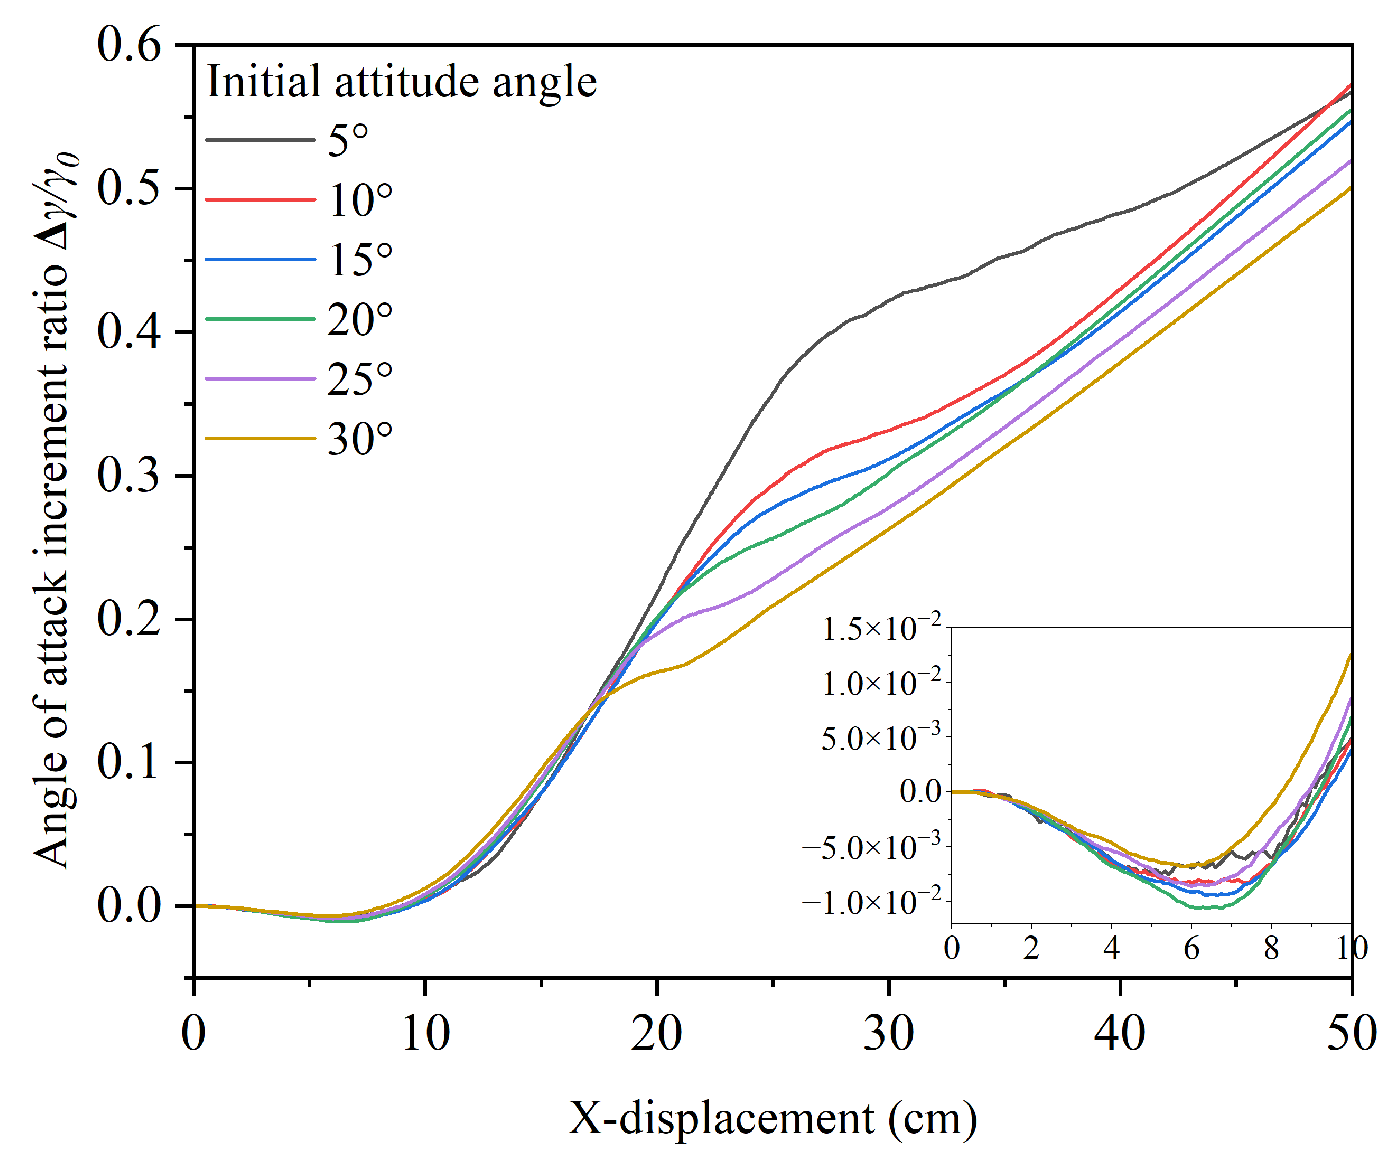
The variation trends of the projectile’s attitude angle rate and angle of attack rate with respect to its X-direction displacement under different initial attitude angles are shown in Figure 21 and Figure 22, respectively.
As shown in Table 9 and Figure 21, the projectile’s attitude angle after penetrating the target increases with an increase in the initial attitude angle. However, the rate of change in attitude angle does not increase monotonically with the initial attitude angle. When the initial attitude angle exceeds 15°, further increases lead to a decrease in the attitude angle rate.
The curves in Figure 22 can similarly be divided into four distinct stages. In the first stage, the angle of attack decreases with increasing penetration distance. During this phase, the angle of attack rate exhibits a nonlinear trend: it initially decreases and then increases with a rising initial attitude angle. This trend mirrors that of the attitude angle rate, with 15° acting as a critical threshold. The end of the first stage corresponds to a horizontal displacement of approximately 9 cm for the projectile tip.
Early in the second stage, the angle of attack rate increases with the initial attitude angle. Subsequently, under the 5° condition, the angle of attack rate gradually exceeds that observed under other conditions, while under the 30° condition, the rate progressively decreases.
In the third stage, a negative correlation is observed between the angle of attack rate and the initial attitude angle. The final stage corresponds to stable post-penetration flight. As the projectile’s velocity remains essentially constant in this phase, it can be considered that the penetration process has concluded.

3.4.3. Influence of Target Plate Thickness

In this set of numerical simulations, the impact velocity was fixed at 850 m/s and the initial attitude angle at 10°, while the target plate thickness varied from 90 mm to 240 mm. The projectile’s velocity and attitude angle were recorded when the projectile tip reached a position 320 mm beyond the rear surface of the target. The corresponding simulation results are presented in Table 10.
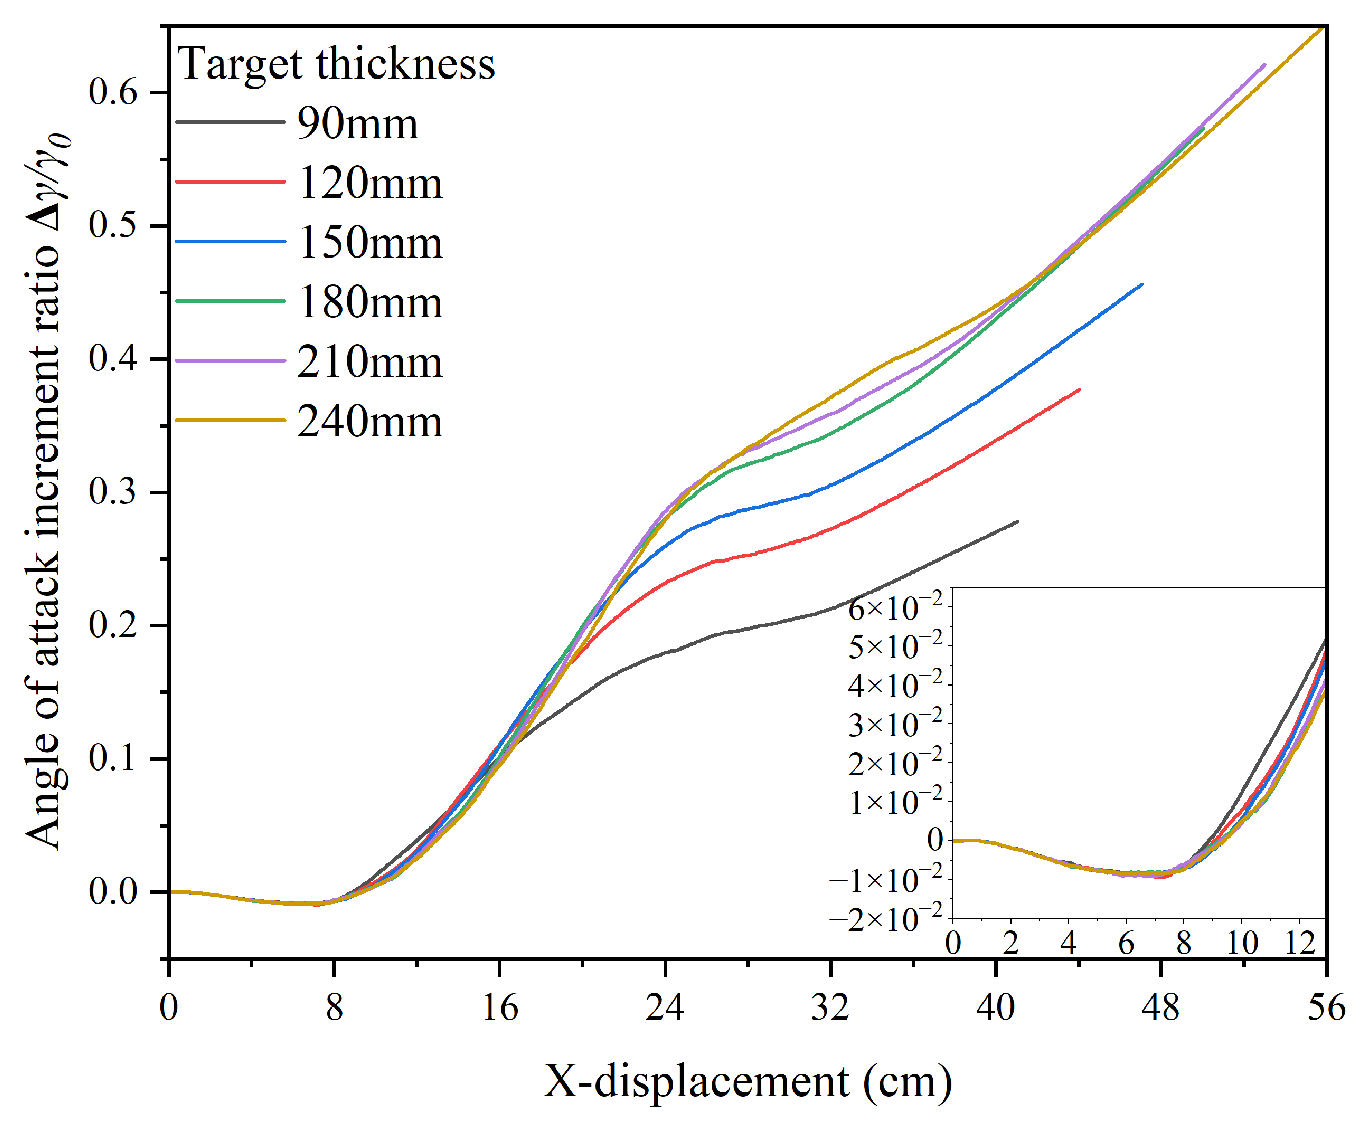
The variation trends of the projectile’s attitude angle rate and angle of attack rate with respect to its X-direction displacement under different target plate thicknesses are shown in Figure 23 and Figure 24, respectively. The concrete target thickness exhibits a notable influence on the post-perforation projectile attitude. When the thickness increases from 90 mm to 240 mm, the attitude angle increases by over 70%, while the angle of attack increases by more than 20%.
As shown in Table 10, Figure 23, and Figure 24, both the attitude angle and angle of attack of the projectile after penetrating the target increase with the thickness of the target plate.
During the initial stage of penetration, the rates of change in the attitude angle and angle of attack are nearly identical, indicating that the projectile is not yet affected by the free surface effect behind the target. As the penetration progresses, the projectile begins to experience the influence of the free surface, leading to a gradual decrease in both the attitude angle rate and the angle of attack rate.

4. Conclusions

Through the simulation and comparison of projectile penetration into thin concrete targets at an angle of attack, as well as parametric studies under varying impact velocities, initial attitude angles, and target plate thicknesses, the following conclusions are drawn:
  • The use of a three-petal bullet stock with offset geometry, as designed in this study, in combination with a smoothbore gun, effectively establishes a controllable angle of attack penetration condition. When integrated with the projectile flight attitude measurement system, this setup enables accurate measurement and recording of key parameters during angle of attack penetration tests into concrete targets. Due to the resolution limitations of the high-speed imaging system, the projectile contour becomes partially obscured by dust after perforating the target, which reduces the measurable profile and increases the error in the calculated three-dimensional attitude angle. Despite this limitation, the measurement error remains within 5°. This setup, while tailored to short-range impact conditions, establishes a methodological basis for extended applications with projectile trajectory considerations.
  • By employing the RHT strength model along with a suitably refined mesh, the numerical simulation successfully captures the oblique penetration behavior of projectiles penetrating concrete targets. The simulated horizontal velocity deviates from experimental measurements by less than 5%, and the attitude angle error remains within 4°, demonstrating good agreement and model fidelity.
  • During angle of attack penetration into thin concrete targets, the post-penetration attitude angle of the projectile is negatively correlated with its velocity and positively correlated with the target plate thickness.
  • The evolution of the projectile’s angle of attack throughout the penetration process can be divided into four distinct stages:
    -
    In the crater formation stage, the angle of attack gradually decreases.
    -
    In the penetration plugging stage, it increases rapidly.
    -
    During the breakthrough plugging stage, the growth slows down.
    -
    After exiting the target, the angle of attack increases at a constant angular velocity.
  • Under varying initial attitude angles, the post-penetration attitude angle increases with the initial attitude angle. However, both the attitude angle rate and angle of attack rate reach their maximum values when the initial attitude angle is around 15° and then gradually decrease as the initial attitude angle continues to increase. An increase in the initial attitude angle leads to stronger non-axial forces acting on the projectile, which in turn amplify the deflecting moment. This causes a portion of the translational kinetic energy to be converted into rotational kinetic energy about the transverse axis, thereby inducing greater fluctuations in the horizontal velocity. These findings are in agreement with the results reported by Dong and Chen et al.
These findings suggest that for protective structures comprising spaced thin concrete layers, attention must be paid to induced projectile deflection and rotational effects, especially under high AOA conditions. The evolution patterns revealed in this study support optimized layer spacing and concrete thickness design.
Despite the effective numerical reproduction of angle of attack penetration tests and the analysis of key factors such as initial attitude angle, impact velocity, and target thickness, certain limitations remain in the present study. Future research will focus on the following areas:
The current three-dimensional angle measurement system, based on mirror reflection, imposes strict constraints on mirror positioning, leading to lengthy experimental setup times. Future work will aim to generalize the geometric relationship between the projectile’s spatial orientation and the mirror angle to enhance system flexibility and reduce alignment sensitivity.
According to Wu’s findings, concrete can be modeled as a homogeneous material for simulation purposes when the maximum aggregate size is less than 0.949 times the projectile diameter. However, for heterogeneous targets such as block stone concrete or those containing large rock inclusions, the current modeling approach lacks accuracy. Future efforts will focus on extending the simulation methodology to account for such material heterogeneity.
With the increasing use of steel fiber-reinforced concrete (SFRC), concrete behavior during penetration is no longer governed by traditional brittle failure modes. Given that crater formation and spalling are critical stages influencing projectile attitude evolution during oblique penetration, future work will involve the mesoscale modeling of SFRC. This will help to clarify how fiber reinforcement alters the asymmetric response and post-penetration attitude dynamics observed in thin target configurations.

Author Contributions

Conceptualization, W.L. and Z.T.; methodology, Z.T.; software, Z.T.; validation, J.X.; writing—original draft preparation, Z.T. and R.M.; writing—review and editing, W.Z. All authors have read and agreed to the published version of the manuscript.

Funding

This research received no external funding.

Data Availability Statement

Data is contained within the article.

Conflicts of Interest

Author Rui Ma was employed by Northern Tools Company Ltd. The remain authors declare that the research was conducted in the absence of any commercial or financial relationships that could be consumed as a potential conflict of interest.

AI Statement

During the preparation of this manuscript, we utilized OpenAI’s ChatGPT-4o to assist in the following aspects: (1) searching for relevant literature and facilitating quick reading; (2) aiding in the translation and polishing of the manuscript after the initial Chinese version was completed; (3) generating the reference list in the format required by the Symmetry journal. It is important to note that the original writing of the main text and data analysis were not assisted by AI. Authors are fully responsible for the originality, validity, and integrity of the content of their manuscript, including any material contributed by GenAI tools, and must ensure, through careful review, that this content complies with all MDPI’s publication ethics policies including, but not limited to, Plagiarism, Data Fabrication and Image Manipulation and Intellectual Property.

References

  1. He, X.; Sun, G.; Xu, X.; Yang, J. Theoretical analysis of oblique penetration of projectiles with a certain angle of attack into concrete and rock media. In Proceedings of the National Conference on Structural Safety and Protection Engineering, Luoyang, China, 16–21 August 2007. (In Chinese). [Google Scholar]
  2. Duan, Z.; Li, S.; Ma, Z.; Ou, Z.; Huang, F. Attitude deflection of oblique perforation of concrete targets by a rigid projectile. Def. Technol. 2019, 15, 700–707. [Google Scholar] [CrossRef]
  3. Dong, H.; Liu, Z.; Wu, H.; Gao, X.; Pi, A.; Huang, F. Study on penetration characteristics of high-speed elliptical cross-sectional projectiles into concrete. Int. J. Impact Eng. 2019, 132, 103311. [Google Scholar] [CrossRef]
  4. Dong, H.; Wu, H.; Ren, G.; Lv, Y.; Quan, X.; Li, M.; Huang, F. Complexity of space trajectory and macro-micro failure mechanism of elliptical projectile penetrating concrete at high velocity. Int. J. Impact Eng. 2025, 169, 105386. [Google Scholar] [CrossRef]
  5. Chen, X.; Lu, F.; Zhang, D. Penetration trajectory of concrete targets by ogived steel projectiles—experiments and simulations. Int. J. Impact Eng. 2018, 122, 202–213. [Google Scholar] [CrossRef]
  6. Dong, H.; Wu, H.; Liu, Z.; Gao, X.; Pi, A.; Li, J.; Huang, F. Penetration characteristics of pyramidal projectile into concrete target. Int. J. Impact Eng. 2020, 143, 103583. [Google Scholar] [CrossRef]
  7. Li, X.; Liu, Y.; Yan, J.; Shi, Z.; Wang, H.; Xu, Y.; Huang, F. High-speed penetration of ogive-nose projectiles into thick concrete targets. Def. Technol. 2024, 20, 11–23. [Google Scholar] [CrossRef]
  8. Li, P.; Zhang, X.; Liu, C.; Deng, Y.; Sheng, Q.; Wang, J. Trajectory characteristics of oblique penetration of projectile into concrete targets considering cratering effect. Int. J. Impact Eng. 2024, 185, 104864. [Google Scholar] [CrossRef]
  9. Sun, W.; Zhang, W.; Yan, J.; Gao, X.; Wu, Y.; Ni, W.; Feng, J. Multi-scale study on penetration performance of steel fiber reinforced ultra-high performance concrete. Constr. Build. Mater. 2022, 330, 127263. [Google Scholar] [CrossRef]
  10. Ning, H.; Ren, H.; Wang, W.; Nie, X. Impact resistance of ultra-high-performance concrete composite structures. Materials 2023, 16, 7456. [Google Scholar] [CrossRef] [PubMed]
  11. Sun, S.; He, X.; Liu, F.; Chen, J.; Gou, S. Experimental and numerical investigation on anti-penetration mechanism of steel-concrete composite structures. Structures 2025, 71, 108083. [Google Scholar] [CrossRef]
  12. Wang, W.; Song, X.; Yang, J.; Liu, F.; Gao, W. Experimental and numerical research on the effect of ogive-nose projectile penetrating UR50 ultra-early-strength concrete. Cemen. Concr. Compo. 2023, 136, 104902. [Google Scholar] [CrossRef]
  13. Jurecs, S.P.; Tabei, A. Simulation of the Effects of Angle of Attack and Projectile Contour in Damage Development in Reinforced Concrete. Designs 2021, 5, 49. [Google Scholar] [CrossRef]
  14. Li, J.; Liu, Y.; Li, P.; Wang, H.; Chen, P. Study on the suitability of concrete constitutive models for perforation simulation. Materials 2024, 17, 5562. [Google Scholar] [CrossRef] [PubMed]
  15. Teng, T.; Chu, Y.; Chang, F.; Chin, H. Numerical analysis of oblique impact on reinforced concrete. Cemen. Concr. Compo. 2005, 27, 481–492. [Google Scholar] [CrossRef]
  16. Yang, Z.; Lv, Z.; Wu, B. Comparative analysis of depth prediction formulas for oblique penetration of projectiles with angle of attack into concrete. J. Ordnance Equip. Eng. 2014, 35, 37–40. (In Chinese) [Google Scholar]
  17. Chen, W.; Zhang, Y.; Guo, Z.; Zou, H. Penetration of rigid projectile into concrete target with effect of attack angle: Theory and experiment. Int. J. Struct. Stab. Dyn. 2017, 17, 1750080. [Google Scholar] [CrossRef]
  18. Jiang, A. Study of attitude deflection and trajectory yawing mechanism of concrete wedge-water layer combination structures for long rod ogive-nosed projectiles. Int. J. Impact Eng. 2025, 204, 105392. [Google Scholar] [CrossRef]
  19. Warren, T.L.; Poormon, K.L. Penetration of 6061-t6511 aluminum targets by ogive-nosed var 4340 steel projectiles at oblique angles: Experiments and simulations. Int. J. Impact Eng. 2001, 25, 993–1022. [Google Scholar] [CrossRef]
  20. Zhang, H.; Xiang, X.; Huang, B.; Wu, Z.; Chen, H. Static homotopy response analysis of structure with random variables of arbitrary distributions by minimizing stochastic residual error. Comput. Struct. 2023, 288, 107153. [Google Scholar] [CrossRef]
  21. Wu, C. Research on Anti-Penetration Performance of Concrete Target at Mesoscale. Ph.D. Thesis, Nanjing University of Science & Technology, Nanjing, China, 2019, unpublished. [Google Scholar]
  22. Jia, T.; Wu, H.; Dong, H.; Cheng, L.; Zheng, Z. Numerical Simulation Study on the Mechanical Properties of Concrete Under Rapid Stress Cycling. In Proceedings of the International Conference on Computational & Experimental Engineering and Sciences, Changsha, China, 25–29 May 2025; Springer: Cham, Switzerland, 2025. [Google Scholar]
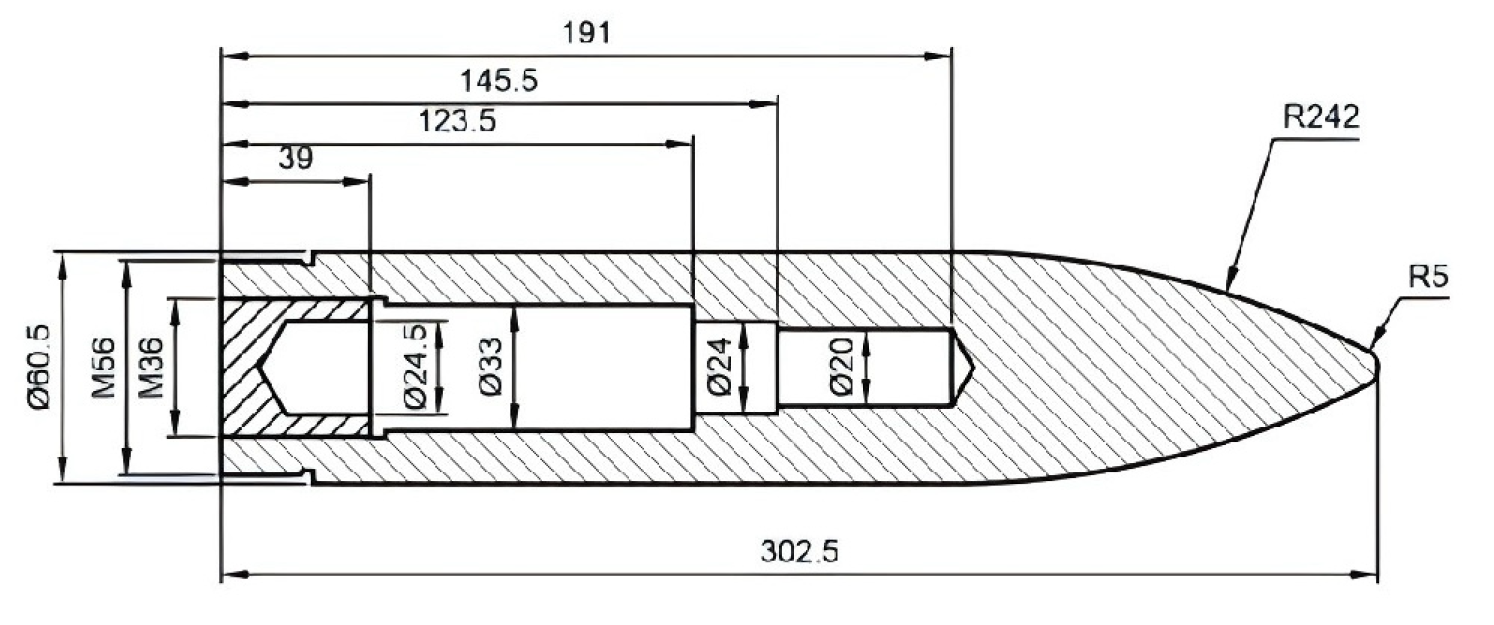
Figure 1. Geometric dimensions of the test projectile.
Symmetry 17 01904 g001
Figure 2. Main geometric dimensions of the angle of attack bullet stock.
Symmetry 17 01904 g002
Figure 3. Pre-launch assembly configuration of the projectile and angle of attack bullet stock.
Symmetry 17 01904 g003
Figure 4. Experimental schematic. (a) Layout of the experimental site; (b) pre-impact orientation of the projectile relative to the target.
Symmetry 17 01904 g004
Figure 5. Arrangement of target plate and pre-target planar mirror.
Symmetry 17 01904 g005
Figure 6. Test system layout diagram. (a) Front view of the test system; (b) top view of the test system.
Symmetry 17 01904 g006
Figure 7. Angle relationship between the mirror, coordinate system, and horizontal plane.
Symmetry 17 01904 g007
Figure 8. Schematic illustrating the projectile’s spatial orientation within the coordinate system: (a) spatial and mirror-image attitudes of the projectile; (b) projection of the projectile and its mirror image on the XOY plane; (c) projection of the projectile on the XOZ plane.
Symmetry 17 01904 g008
Figure 9. High-speed photography images. (a) High-speed photography observation moment 1; (b) High-speed photography observation moment 2; (c) pre-experiment calibration images.
Symmetry 17 01904 g009
Figure 10. High-speed images showing the projectile’s attitude before and after penetrating the single-layer concrete target.
Symmetry 17 01904 g010aSymmetry 17 01904 g010b
Figure 11. Projectile attitude angle errors induced by cursor displacement.
Symmetry 17 01904 g011
Figure 12. The computational mesh of the projectile.
Symmetry 17 01904 g012
Figure 13. Overall mesh partitioning and boundary constraints of the target plate.
Symmetry 17 01904 g013
Figure 14. Projectile mesh configuration schemes.
Symmetry 17 01904 g014
Figure 15. Initial projectile–target configuration.
Symmetry 17 01904 g015
Figure 16. Time history of projectile attitude angle θ0 under different mesh schemes.
Symmetry 17 01904 g016
Figure 17. Time history of projectile angle of attack γ under different mesh schemes.
Symmetry 17 01904 g017
Figure 18. Experimental and numerical simulation error.
Symmetry 17 01904 g018
Figure 19. Variation in the attitude angle increment rate under different impact velocities.
Symmetry 17 01904 g019
Figure 20. Variation in the angle of attack increment rate under different impact velocities.
Symmetry 17 01904 g020
Figure 21. Variation in the attitude angle increment rate under different initial attitude angles.
Symmetry 17 01904 g021
Figure 22. Variation in the angle of attack increment rate under different initial attitude angles.
Symmetry 17 01904 g022
Figure 23. Variation in the attitude angle increment rate under different target plate thicknesses.
Symmetry 17 01904 g023
Figure 24. Variation in the angle of attack increment rate under different target plate thicknesses.
Symmetry 17 01904 g024
Table 1. Concrete mix proportions and mechanical strength.
Mass RatioStrength Grade
CementWaterFine AggregateCoarse Aggregate
10.41.452.49C35
Table 2. Experimental design parameters for angle of attack penetration tests.
No.Impact Velocity (m/s)Angle of Attack (°)Target Thickness (mm)
1#5003120
2#7503100
3#500390
4#5003125
5#5005123
6#6005150
7#600290
8#6002120
Table 3. Horizontal velocity and attitude angle of the projectile before and after penetrating the target plate.
No.Pre-Impact Horizontal Velocity, Vf (m/s)Pre-Impact Attitude Angle,
θ0f (°)
Post-Impact Horizontal Velocity,
Vb (m/s)
Post-Impact Attitude Angle,
θ0b (°)
Target Plate Thickness,
Th (mm)
Nose–Rear Surface Distance,
Dt (mm)
S1484.02.9456.910.3123971.6
S2743.02.3718.65.9104894.9
S3489.24.2480.412.993876.2
S4481.34.2445.512.3125654.6
S5505.28.1450.021.3123672.8
S6568.88.9522.825.3151668.6
S7576.52.3558.65.694556.2
S8603.52.3564.96.3122597.6
Table 4. Actual physical length corresponding to a single pixel in PCC.
Experiment IDS1S2S3S4S5S6S7S8
Pixel size in physical units (mm)1.41.41.61.51.51.41.21.8
Table 5. Maximum and minimum attitude angles θ0 resulting from cursor jitter.
Experiment IDPre-PenetrationPost-Penetration
θ0minθ0maxθ0minθ0tθ0maxθ0tθ0minθ0maxθ0minθ0tθ0maxθ0t
S12.04.0−0.91.19.111.7−1.21.4
S21.33.4−1.01.14.67.2−1.31.3
S32.85.7−1.41.510.613.7−2.30.8
S42.95.6−1.31.49.615.1−2.72.8
S56.89.4−1.31.318.823.9−2.52.6
S67.710.5−1.21.623.626.8−1.71.5
S71.53.2−0.80.93.57.9−2.12.3
S81.03.9−1.31.63.79.5−2.63.2
Table 6. RHT model parameters for C35 concrete in LS-DYNA (units: cm–g–μs).
ROSHEARONEMPAEPSFB0B1T1A
2.270.1611−62.01.221.220.35271.6
NFCFS*FT*Q0BT2E0C
0.612.34 × 10−40.180.10.68050.010503 × 10−11
E0TECETBETACBETATPTFGC*GT*
3 × 10−123 × 10223 × 10220.044350.0460831 × 10−40.530.7
XID1D2EPMAFNFGAMMAA1
0.50.0410.011.60.6100.3527
A2A3PELPCONPALPHA
0.39580.09041.5567 × 10−40.0631.21145
Table 7. Comparison of projectile velocity and attitude after target penetration between simulation and experiment.
No.Experimental ResultNumerical ResultError
Post-Impact Horizontal Velocity,
Ve (m/s)
Post-Impact Attitude Angle,
θ0e (°)
Post-Impact Horizontal Velocity,
Vs (m/s)
Post-Impact
Attitude Angle,
θ0s (°)
ΔV/VeΔθ0Δθ0/θ0e
S1456.910.3456.510.9−0.09%0.65.8%
S2718.65.97206.10.19%0.23.4%
S3480.412.9469.911.2−2.19%−1.7−13.2%
S4445.512.3451.511.21.35%−1.1−8.9%
S5450.021.3467.318.73.84%−2.6−12.2%
S6522.825.3514.621.6−1.57%−3.7−14.6%
S7558.65.6557.84.8−0.14%−0.6−14.3%
S8564.96.3576.36.02.02%−0.3−4.8%
Table 8. Post-target states of the projectile under different impact velocities.
No.Impact Velocity (m/s)Residual Horizontal Velocity (m/s)Attitude Angle After Penetration (°)Angle of Attack After Penetration (°)
Vel1550475.423.915.2
Vel2700624.222.215.4
Vel3850772.521.415.7
Vel41000917.820.515.5
Table 9. Post-target states of the projectile under different initial attitude angles.
No.Initial Attitude Angles (°)Residual Horizontal Velocity (m/s)Attitude Angle After Penetration (°)Angle of Attack After Penetration (°)
Ang15793.09.97.8
Ang210772.521.415.7
Ang315737.532.423.2
Ang420696.043.331.1
Ang525650.652.838.0
Ang630605.761.745.0
Table 10. Post-target states of the projectile under different target plate thicknesses.
No.Target Thicknesses (mm)Residual Horizontal Velocity (m/s)Attitude Angle After Penetration (°)Angle of Attack After Penetration (°)
Thi190819.114.812.8
Thi2120804.716.913.8
Thi3150789.318.814.6
Thi4180772.521.415.7
Thi5210751.323.416.2
Thi6240728.725.616.5
Disclaimer/Publisher’s Note: The statements, opinions and data contained in all publications are solely those of the individual author(s) and contributor(s) and not of MDPI and/or the editor(s). MDPI and/or the editor(s) disclaim responsibility for any injury to people or property resulting from any ideas, methods, instructions or products referred to in the content.