Symmetry-Preserving Optimization of Differentially Private Machine Learning Based on Feature Importance
Abstract
1. Introduction
2. Related Works
3. The Proposed Scheme
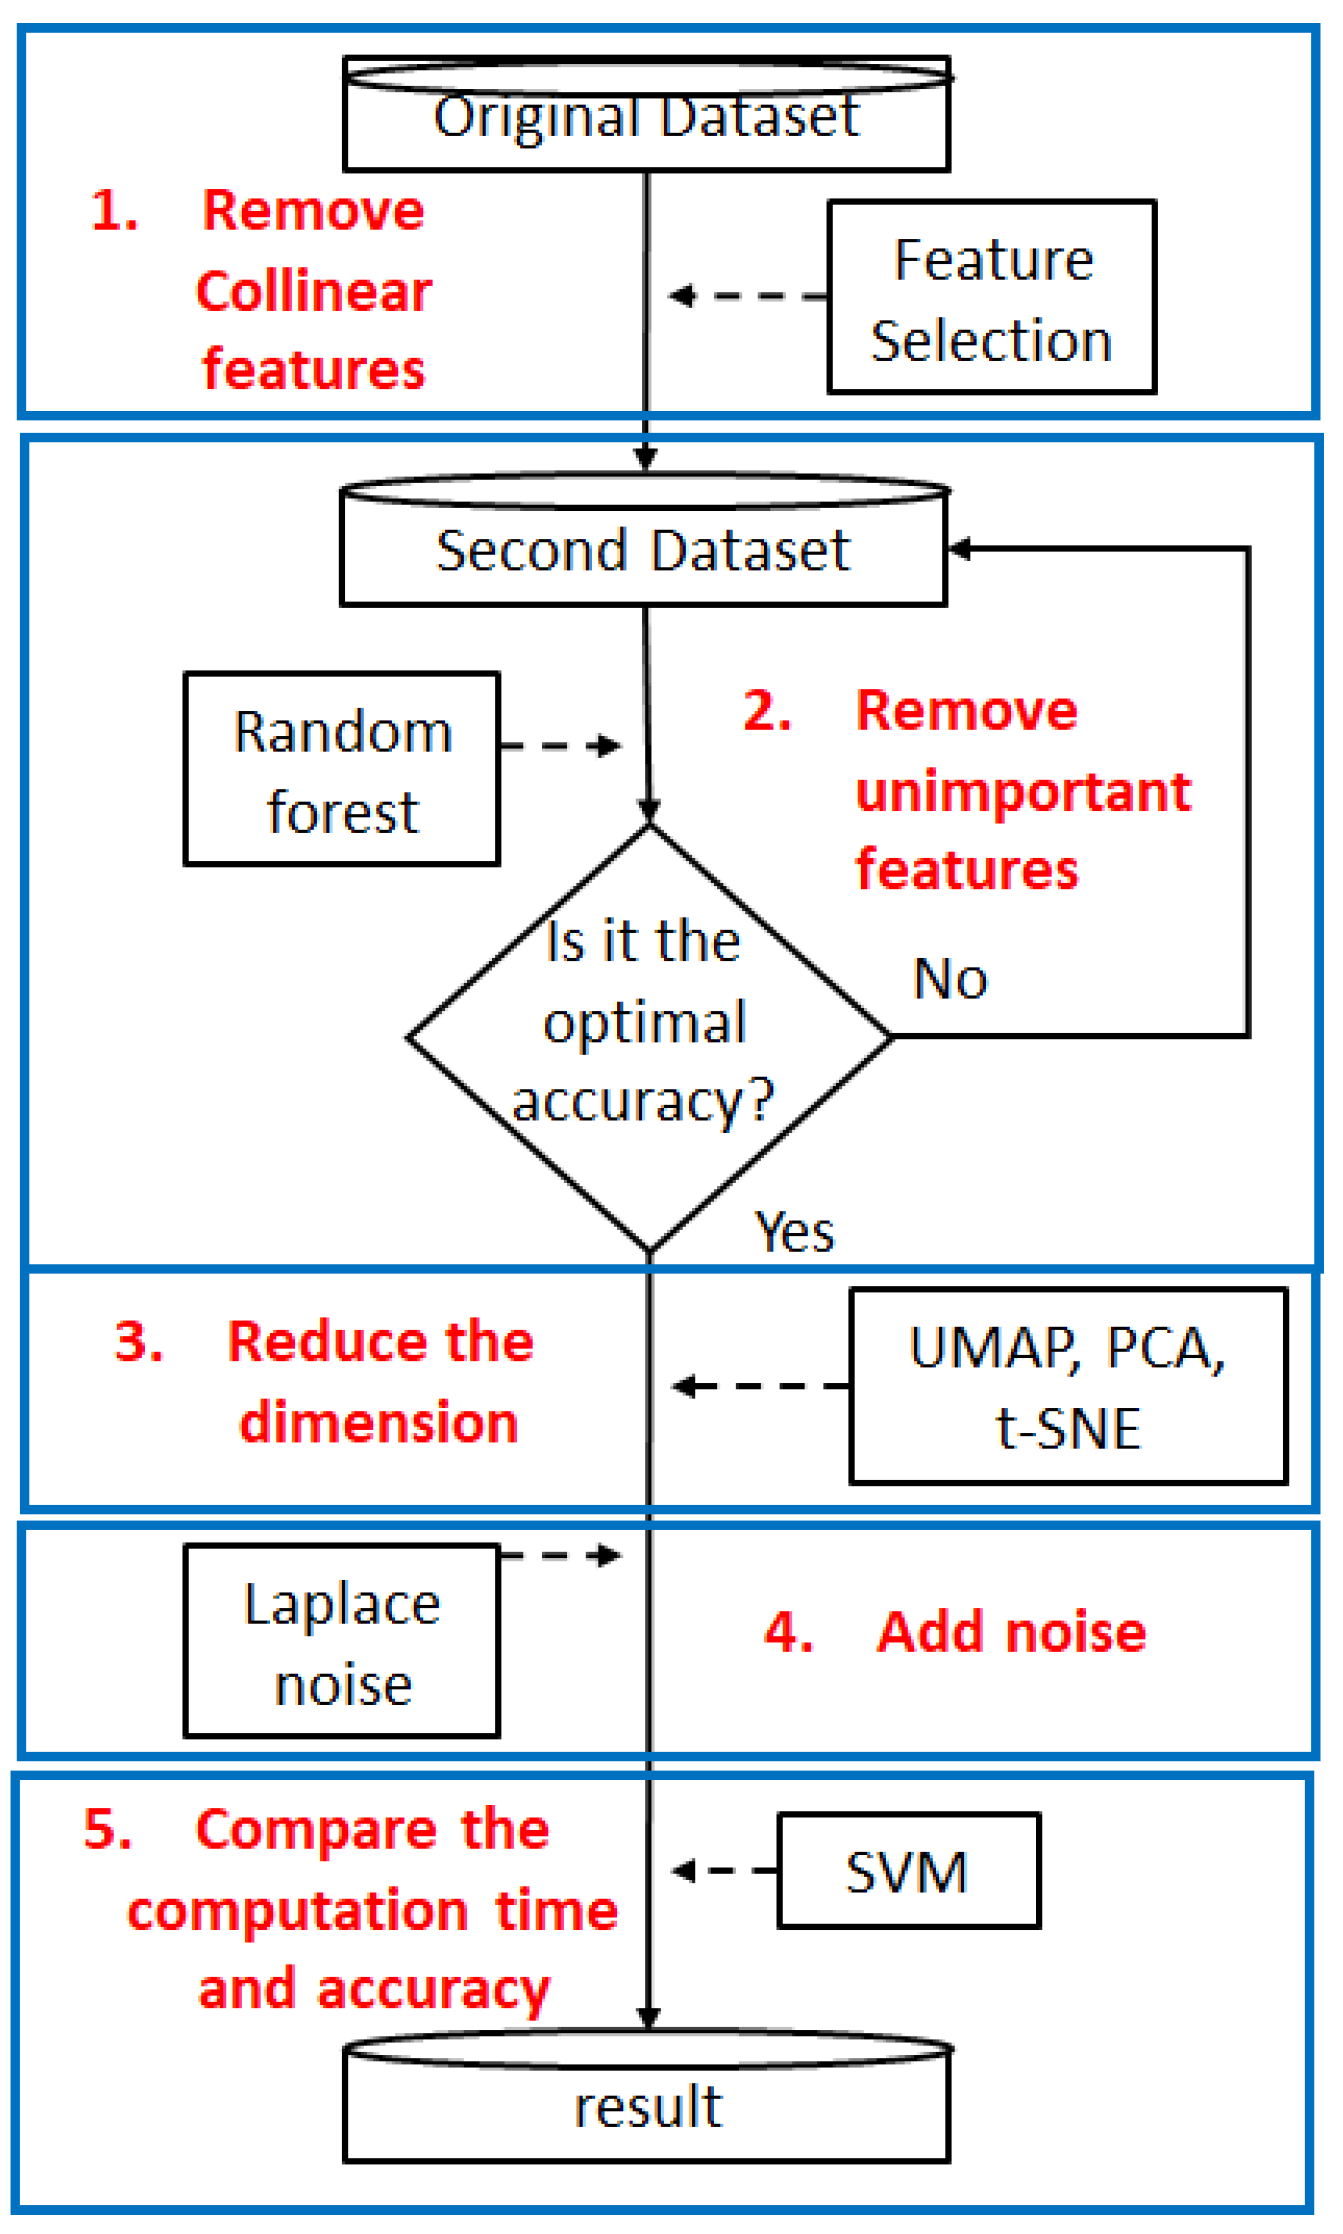
- Step 1. Feature Selection:
- This step involves calculating feature correlation and removing collinear features. We use the correlation analysis to calculate the correlation between features, and we set a threshold to filter out features with too high a correlation, thereby reducing the impact of data correlation and noise.
- To reduce the correlation and potential noise between features in the data, we utilize information entropy and mutual information as the basis for correlation analysis.
- By calculating the mutual information value between each pair of features, we can effectively capture linear and nonlinear correlations. First, the continuous variables are appropriately discretized to calculate the mutual information accurately. Then, we calculate the mutual information between all features and construct a matrix of feature mutual information. According to the set mutual information threshold, the features above the threshold are regarded as highly redundant. The lowly redundant are selectively retained, and the other highly redundant are removed to achieve the purpose of feature filtering and data simplification.
- In this way, we not only effectively reduce collinearity and redundancy in the data but also control unnecessary information overlap between features, thereby reducing the noise level introduced in the model learning process and improving the model’s stability and generalization ability.
- Step 2. Calculate feature importance based on random forest:
- To remove unimportant features, we calculate feature importance using the random forest. The features are sorted according to feature importance, and features are removed in order of importance from low to high until the best accuracy is achieved.
- Assuming there are n features, the feature importance based on random forest will calculate the Gini Impurity of each feature. The so-called Gini Impurity is the probability of misclassifying randomly selected elements in the dataset after randomly labeling them according to the class distribution in the dataset. Its calculation formula is as follows:where c denotes the total number of classes; denotes the probability of the ith class. Removing or reducing noise with low contribution and less relevant information can effectively reduce the noise scale, improve accuracy, and enhance availability. Moreover, when the noise scale or data volume is reduced, the calculation cost will also decrease, and the mean square error (MSE) of the data query will be lower.
- Step 3. Reduce the dimension:
- In reality, most data does not exist in one-dimensional space, but it may exist in a higher-dimensional space. High-dimensional data can lead to the curse of dimensionality. Figure 2 illustrates that as the dimensionality increases, the sample data becomes sparser.
Figure 2. The higher the dimensionality, the sparser the sample data becomes.- We use the following different feature extraction methods for dimensionality reduction:
- 1.
- PCA: A standard method for feature extraction is principal component analysis (PCA) [27]. Li et al. optimized PCA using importance assessment. The optimized PCA can perform feature screening and dimensionality reduction, thereby reducing the amount of data required for calculation and significantly reducing calculation time while maintaining or even improving accuracy. PCA linearly transforms the observed values of a series of possibly related variables through orthogonal transformation and projects them into a series of linearly unrelated variable values, which are called principal components. This method can reduce high-dimensional data to low-dimensional data. Its advantages include avoiding the curse of dimensionality, reducing data correlation, reducing calculation time, and improving model accuracy. However, if PCA is not applied to linear data, a large amount of structural information may be lost in the process of projecting the data vector.
- 2.
- t-SNE: t-SNE (t-distributed Stochastic Neighbor Embedding) [28] is a nonlinear dimensionality reduction algorithm that uses a t-distribution to define a probability distribution in a low-dimensional space. It is often used for visualization and processing of high-dimensional datasets, and it can effectively alleviate the problem of structural information loss caused by the curse of dimensionality. The t-SNE algorithm consists of three parts.
- (a)
- t-SNE is used to find the similarity between two points in high-dimensional space. This method assigns a higher probability to similar data points while assigning a lower probability to data points with larger differences. Its formula is as follows:where is the conditional probability, and and are the two data points whose similarity is to be calculated. If and are close to each other, then is large.
- (b)
- t-SNE defines the similar probability distribution of points in a low-dimensional space. Low-dimensional data often follows a t-distribution (because the t-distribution is robust to outliers) rather than a normal distribution. The formula for t-SNE in low-dimensional space is as follows:
- (c)
- After obtaining the probabilities of high-dimensional space and low-dimensional space, the proximity between and is calculated. The calculation formula is as follows:where and are the conditional probabilities of high-dimensional space and low-dimensional space, respectively, C is the cost function, KL is the Kullback–Leibler divergence, and the Kullback–Leibler divergence is an indicator to measure the difference in probability distribution.
Since standard t-SNE is non-parametric and does not provide a natural mapping for unseen/test data, in this study, we adopted the common practice of fitting t-SNE on the training set, then applying the learned embedding to the test set using a parametric approximation approach. This ensures that performance evaluation on the test set is unbiased and feasible within the experimental design. - 3.
- UMAP: Uniform Manifold Approximation and Projection (UMAP) [29] is a dimensionality reduction technique based on the theoretical framework of Riemannian geometry and algebraic topology. Assuming that the available data samples are uniformly distributed in the topological space (or manifold), these limited data samples can be approximated and mapped to a lower-dimensional space. Its visualization and dimensionality reduction capabilities are comparable to t-SNE. Still, its dimensionality reduction time is shorter than t-SNE, and there is no computational limit on the embedding dimension. The UMAP algorithm is based on three assumptions about the dataset: (1) the data is uniformly distributed on the Riemannian manifold; (2) the Riemannian metric is locally constant; and (3) the manifold is interconnected within the region.UMAP can be divided into three main steps:
- (a)
- Learning the manifold structure in the high-dimensional spaceBefore mapping high-dimensional data to a low-dimensional space, it is necessary to understand what the data looks like in the high-dimensional space. The UMAP algorithm initially employs the nearest neighbor descent method to identify the nearest data point. Here, you can specify the number of neighboring data points to use by adjusting the n_neighbors parameter. UMAP limits the size of local neighborhoods when learning the manifold’s structure to control how UMAP balances the local and global structure of the data. Therefore, it is crucial to adjust the number of n_neighbors.UMAP needs to build a graph by connecting the nearest neighbor data points that have been previously determined. The data points are assumed to be uniformly distributed on the manifold, which means that the space between these data points will stretch or shrink depending on the location of the data (whether it is sparse or dense). This means that the distance measure is not universal across the entire space but varies from one region to another.
- (b)
- Find a low-dimensional representation of the manifold structureAfter learning an approximate manifold from a high-dimensional space, the next step of UMAP is to project (map) it to a low-dimensional space. Unlike the first step, this step does not aim to change the distance in the low-dimensional space representation; instead, it seeks to make the distance on the manifold equivalent to the standard Euclidean distance relative to the global coordinate system.However, the conversion from variable distance to standard distance will also affect the distance of the nearest neighbor. Therefore, another hyperparameter called min_dist (default value = 0.1) needs to be passed here to define the minimum distance between embedding points. This step controls the minimum distribution of data points and avoids the situation where many data points overlap with each other in the low-dimensional embedding. After specifying the minimum distance, the algorithm can begin searching for a more optimal low-dimensional manifold representation.
- (c)
- Minimize the cost function (cross entropy)The ultimate goal of this step is to find the optimal weight values of the edges in the low-dimensional representation. These optimal weight values are determined by minimizing the cross-entropy function, which can be optimized using stochastic gradient descent. UMAP achieves the goal of finding a better low-dimensional manifold representation by minimizing the following cost function:stands for cross entropy, stands for the manifold edge weights learned in high-dimensional space, and stands for the manifold edge weights in low-dimensional space.
Moreover, this study will explore and compare the accuracy and computational time of the three different feature extraction methods for dimensionality reduction (t-NSE, PCA, and UMAP) mentioned above as dimensionality reduction methods for the proposed scheme.
- Step 4. Add Laplace noise:
- In this step, the differential privacy guarantee is achieved through input perturbation, i.e., Laplace noise is directly added to the features of the dataset before they are used for machine learning tasks. This ensures that the original data cannot be reverse-engineered while still allowing subsequent steps, such as feature selection and dimensionality reduction, to operate on privatized inputs.For a dataset D, any query can satisfy -differential privacy as long as it satisfies the following algorithm M:where △ denotes the global sensitivity of the query Q, defined aswith D and being two neighboring datasets differing in one record. In this work, is determined based on the sensitivity of each feature attribute. The scale parameter is then used to sample from the Laplace distribution.Regarding privacy budget allocation, when multiple stages (feature selection, dimensionality reduction, and noise addition) access the raw data, we adopt a sequential composition framework.
- Step 5. Compare the training and prediction time and accuracy:
- We employ a support vector machine (SVM) classifier to assess the performance of the aforementioned dimensionality reduction methods. The experimental process first preprocesses the original data, including standardization and data segmentation into training and test sets. Importantly, all dimensionality reduction methods (PCA, t-SNE, and UMAP) are fit only on the training set. The learned transformation from the training set is then applied to the test set to ensure unbiased evaluation and avoid inflating performance metrics. The converted features are input into the SVM model for training.We use the same SVM parameter settings for each method and evaluate model performance on the same test set. The comparison indicators include classification accuracy and computational time for training and prediction.Logistic regression and decision trees can also be employed as classifiers to assess the performance of the aforementioned dimensionality reduction methods. However, they are not the goal of this study.
4. Experiments
4.1. Evaluation Criteria
- 1.
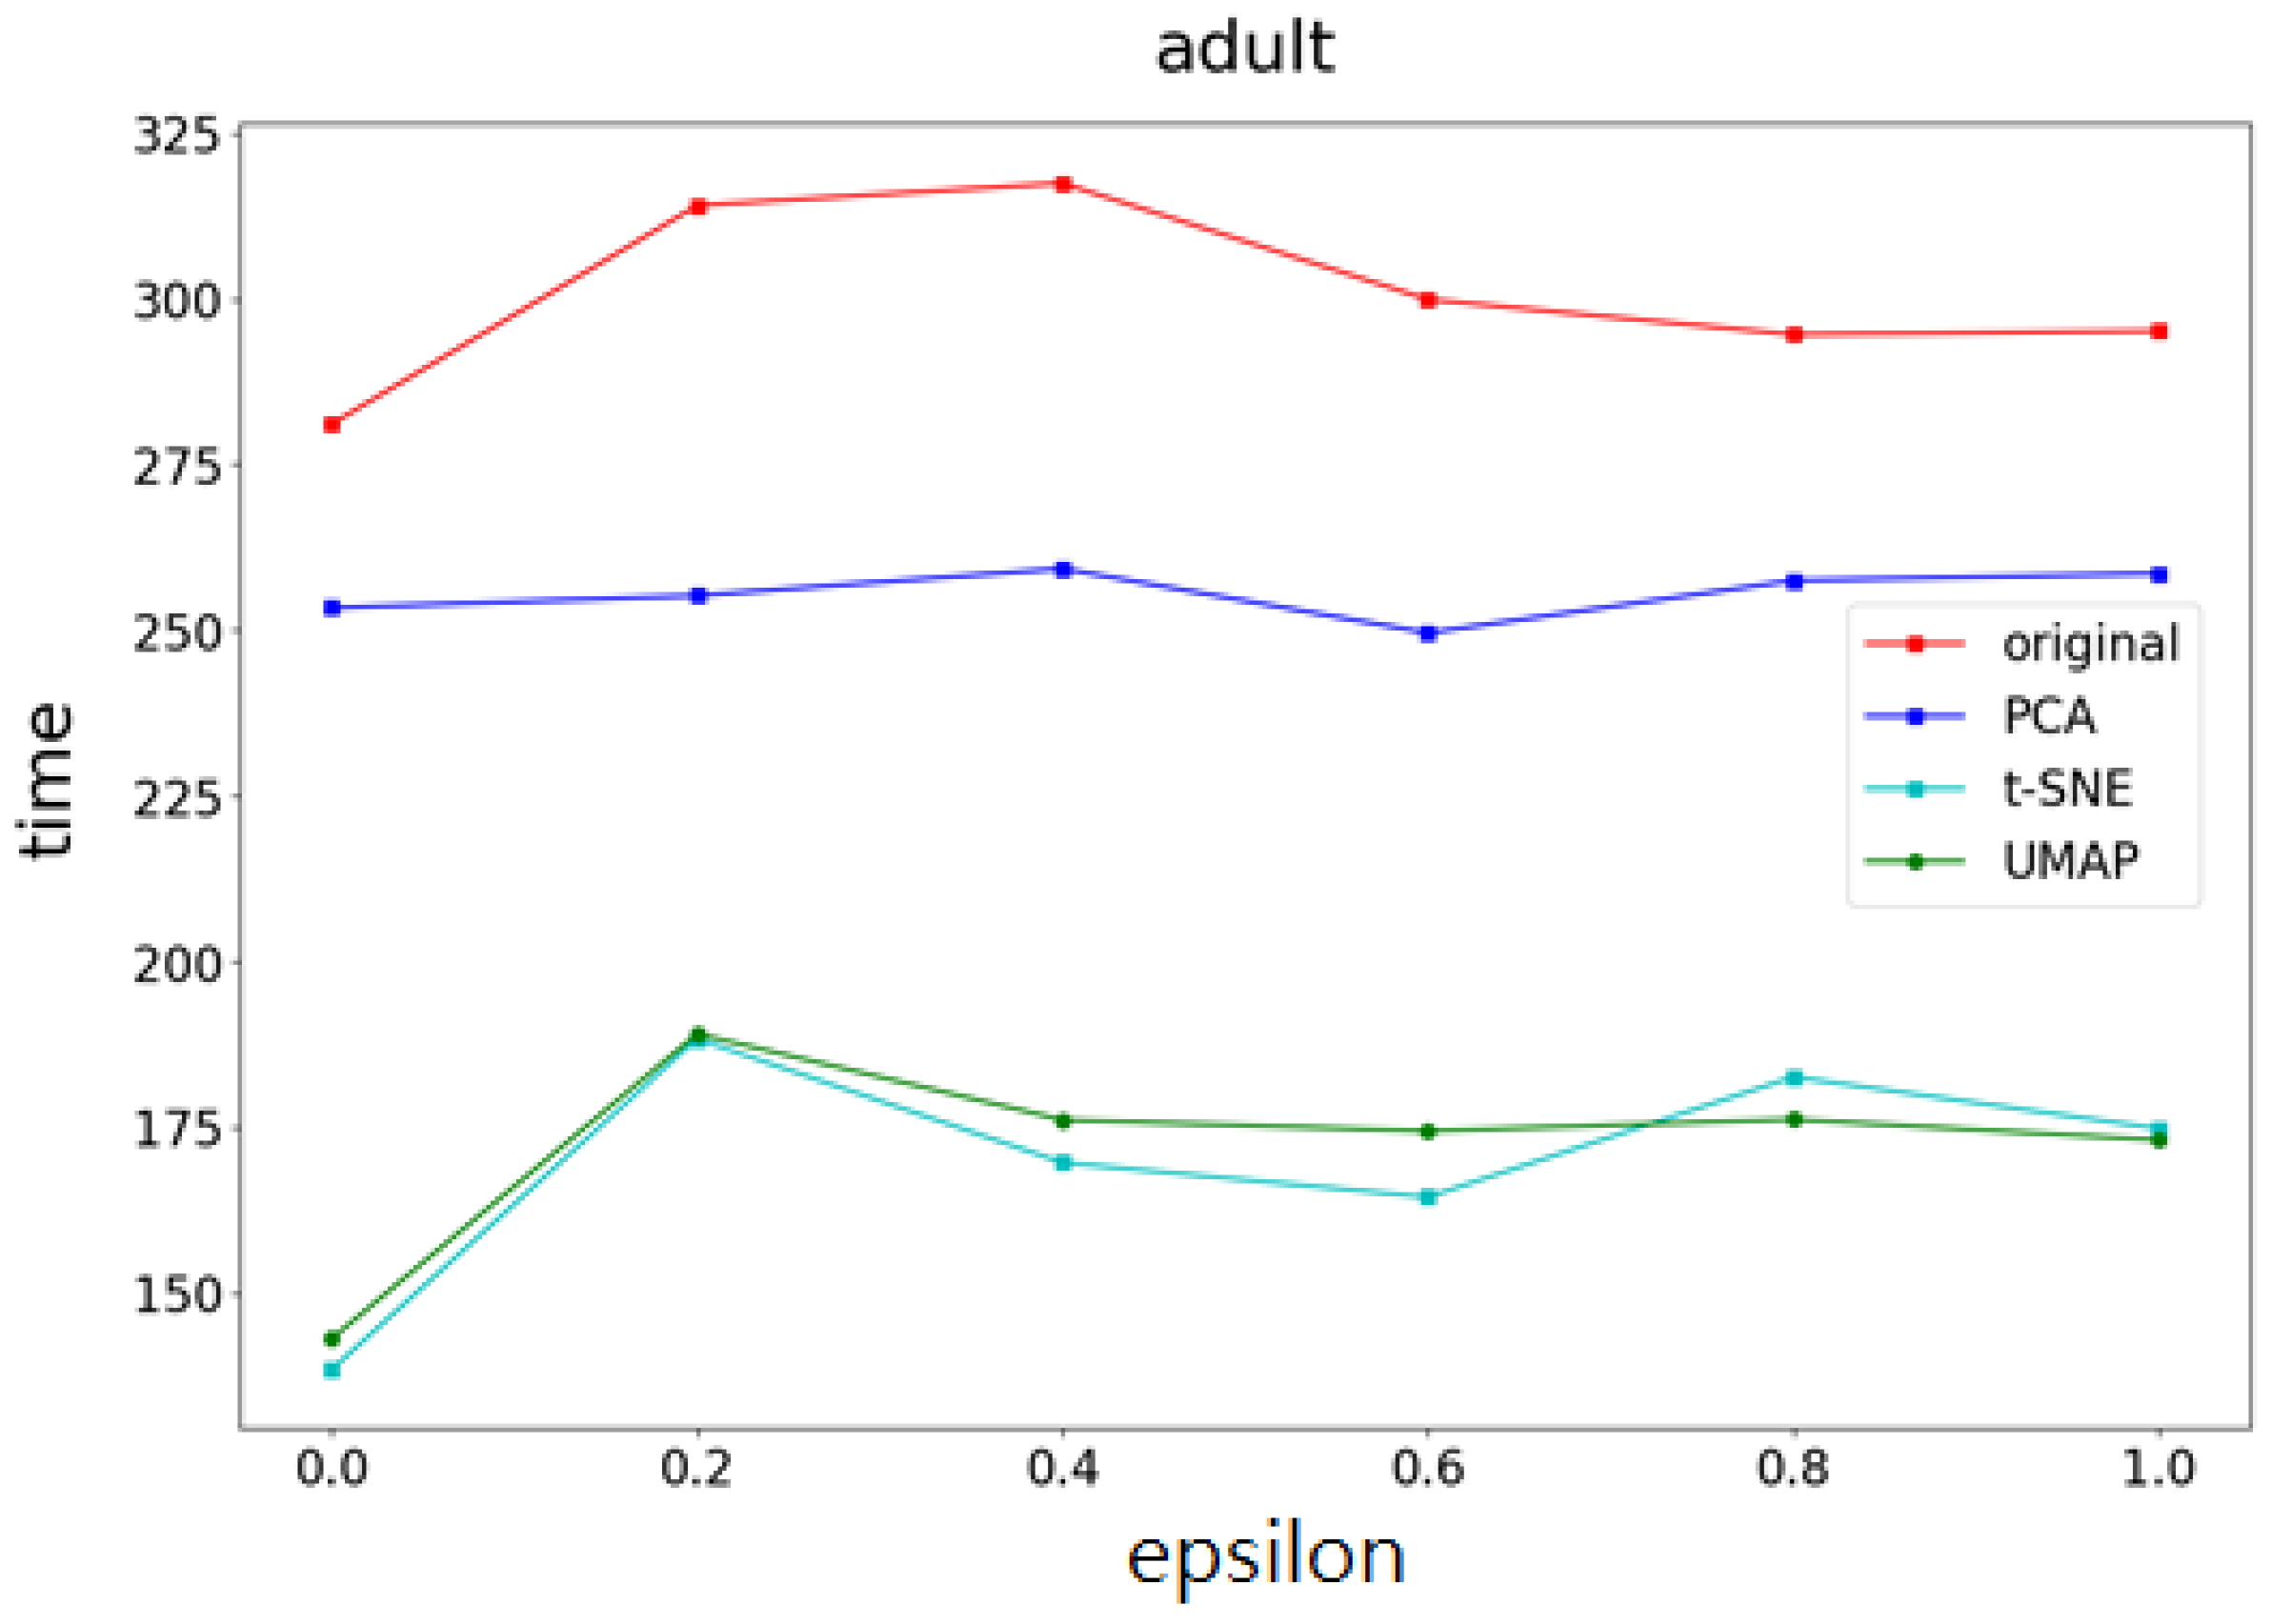
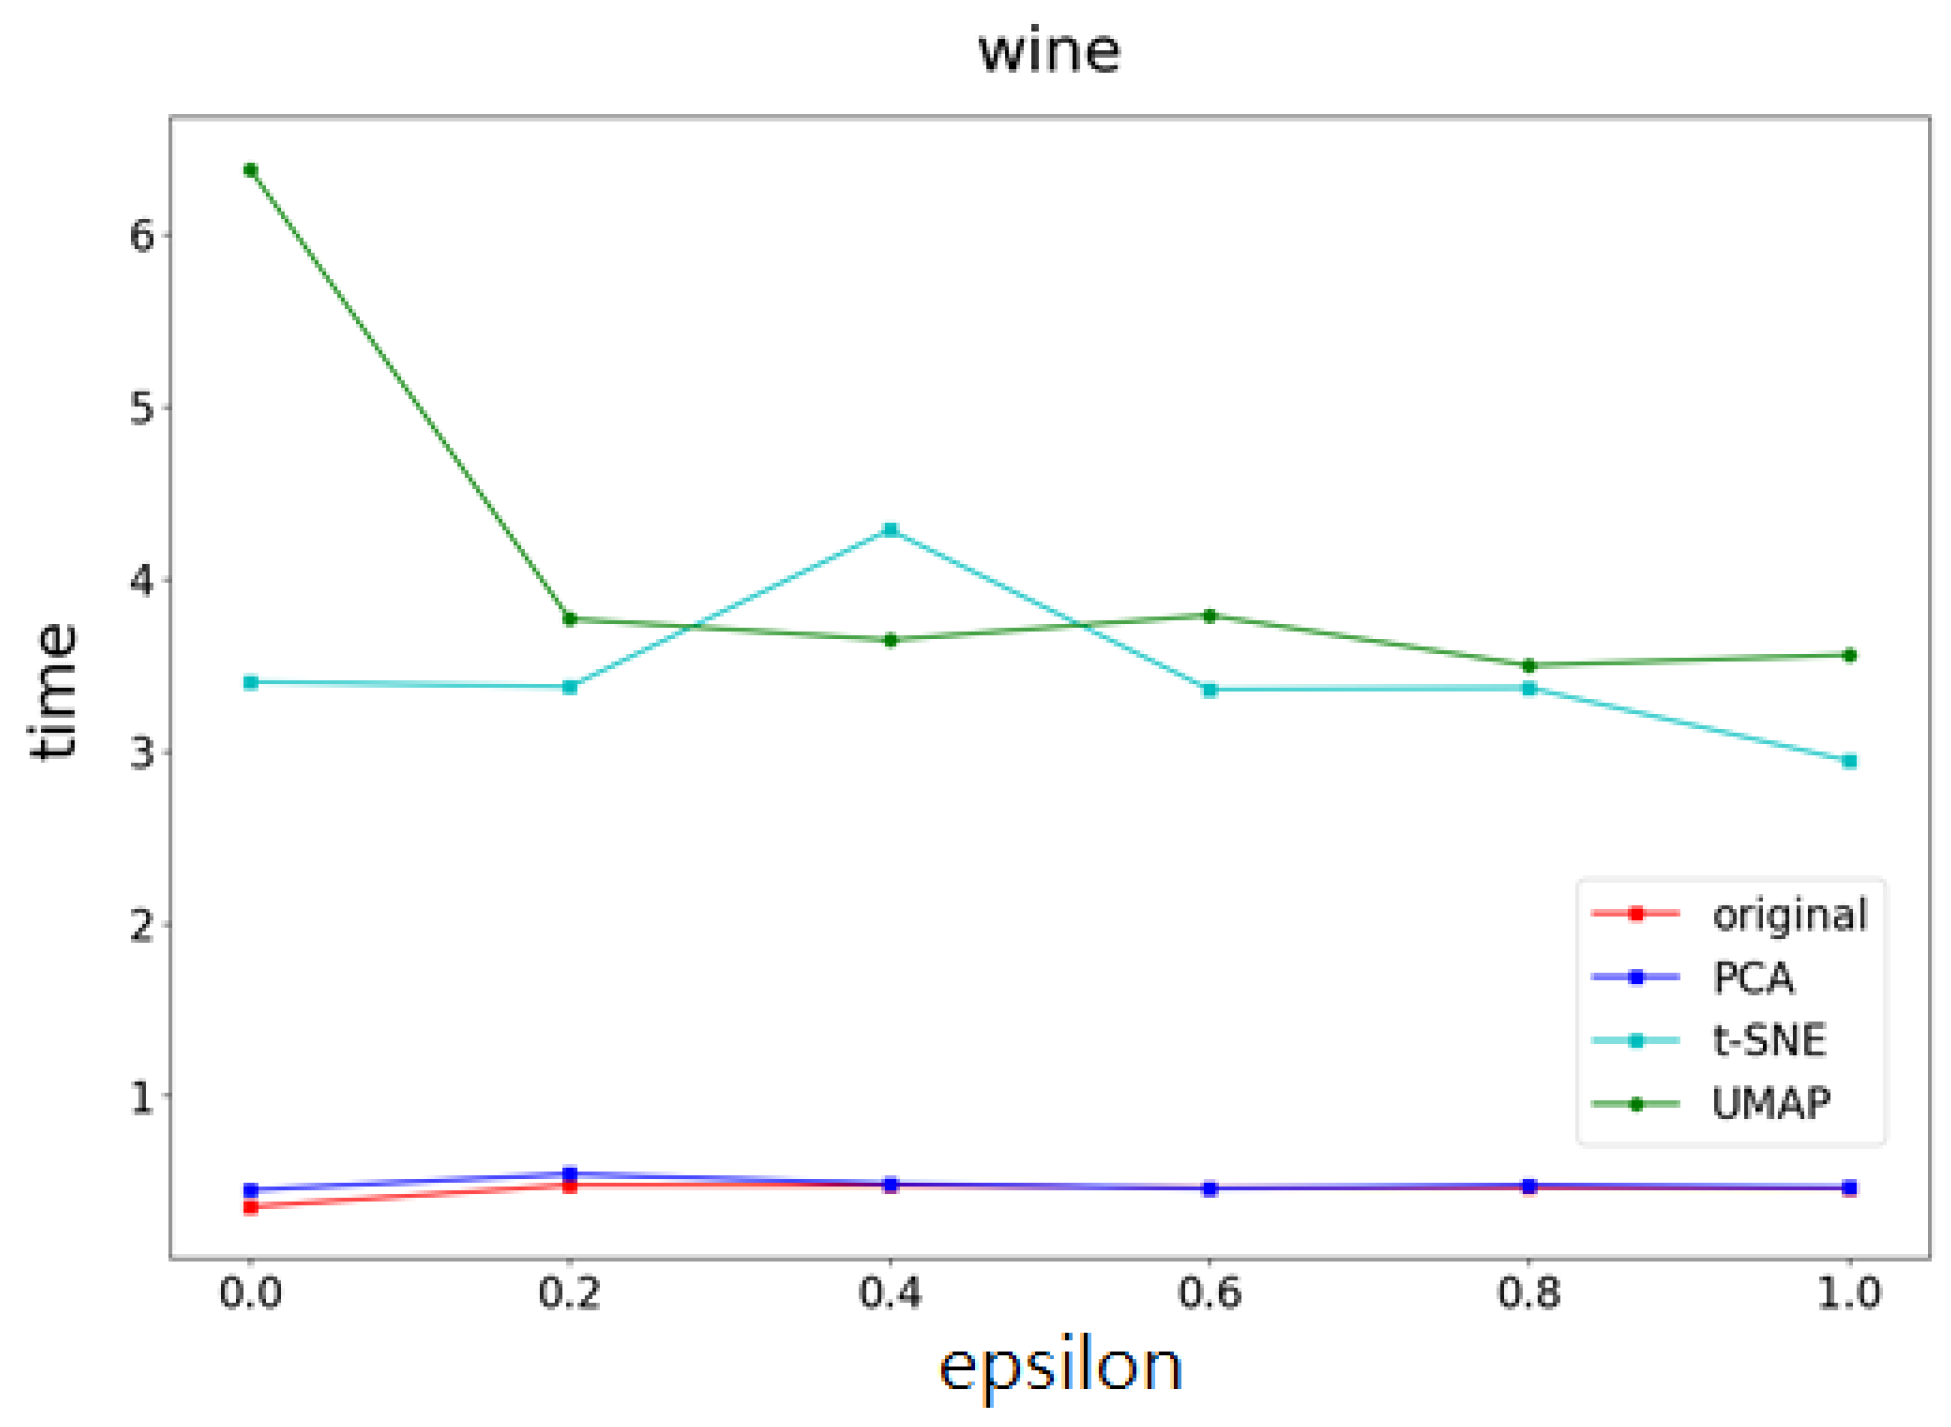
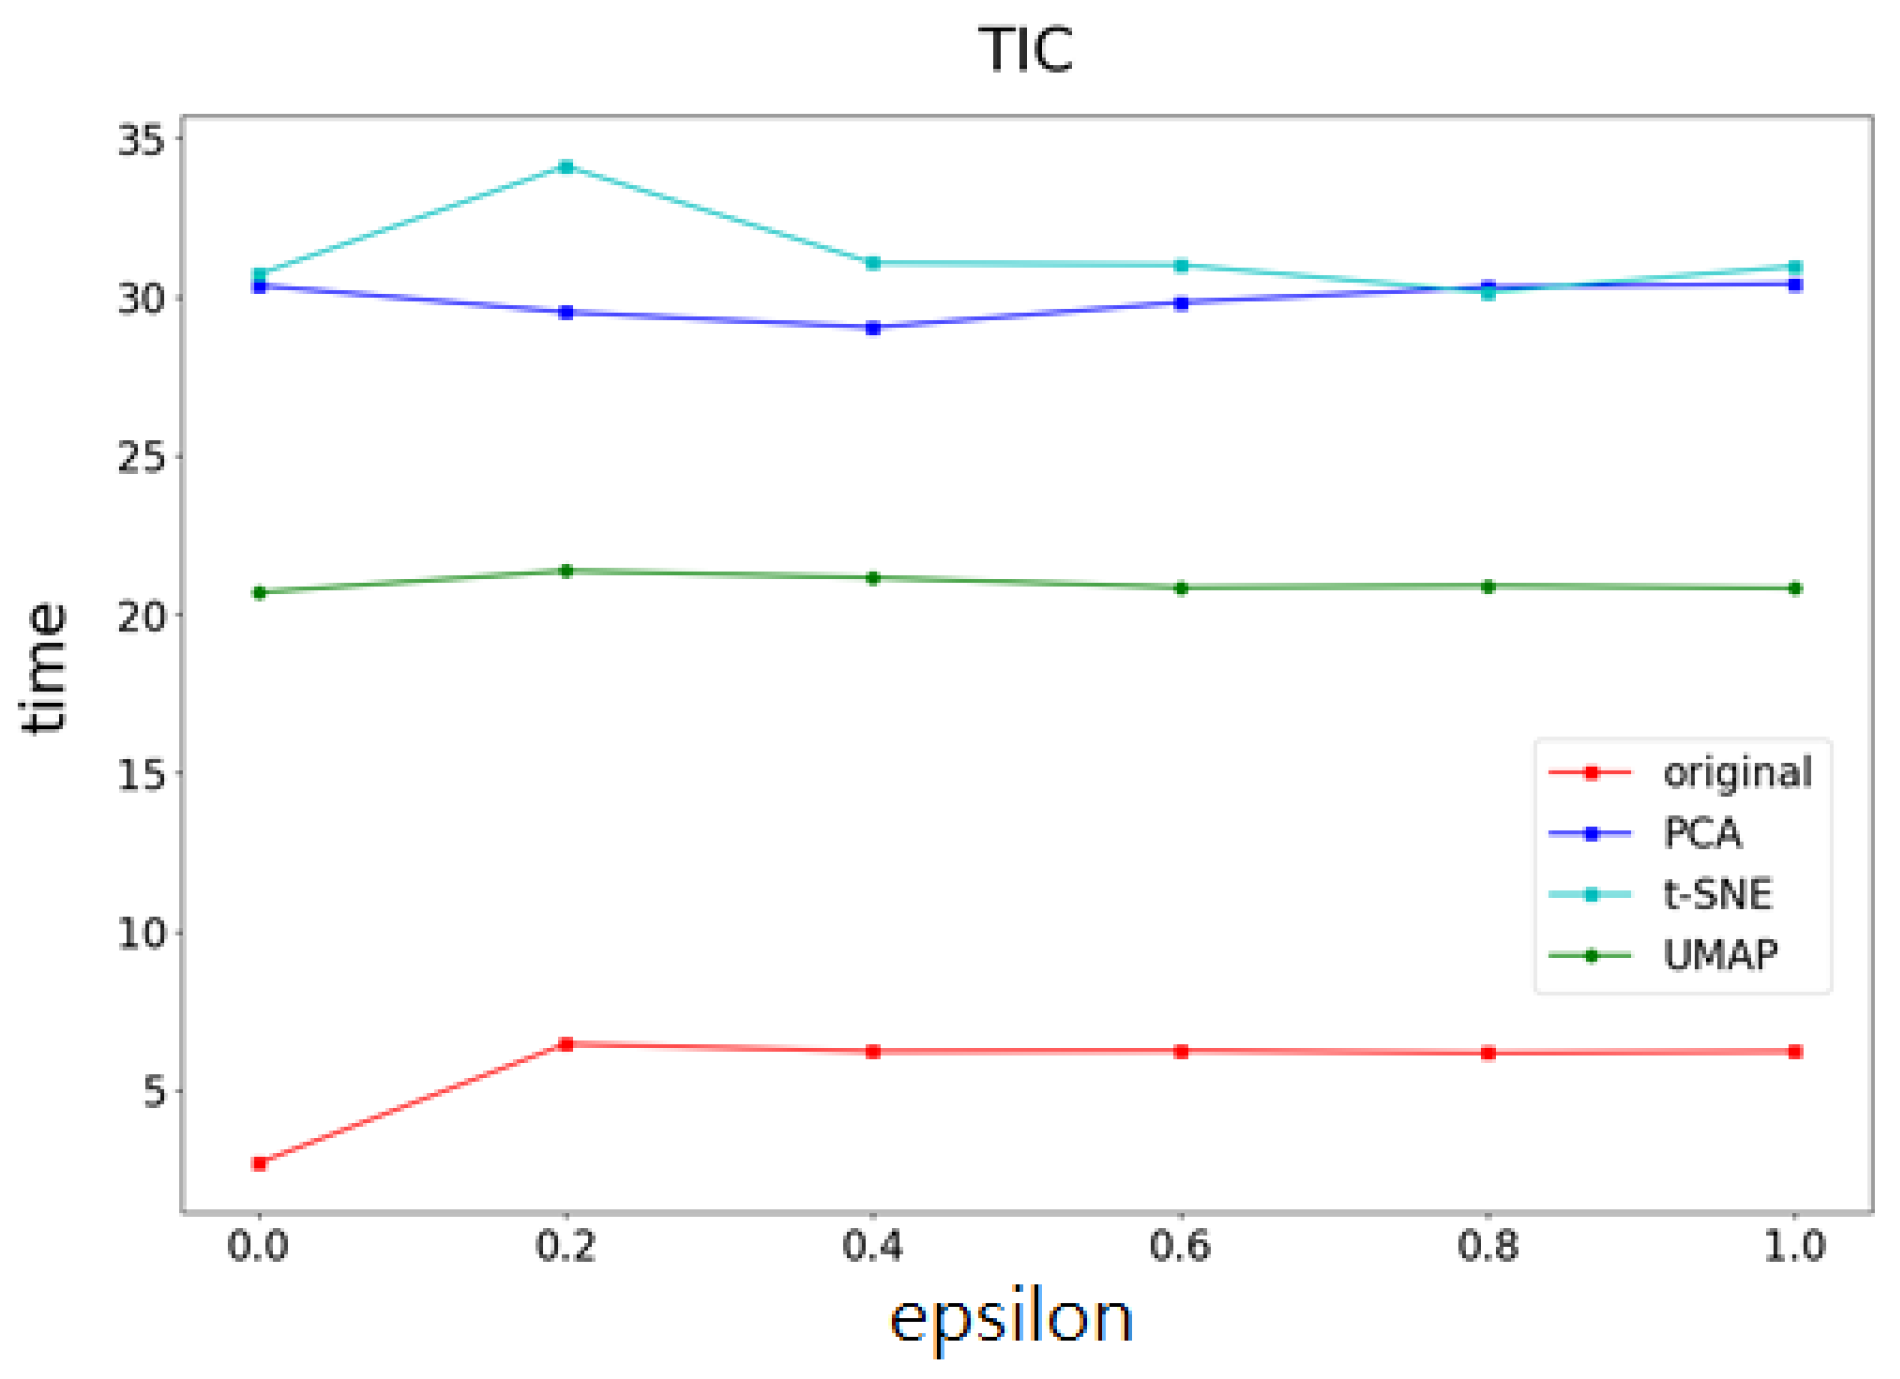
- Total computational timeThis research method primarily consists of the following four parts: correlation analysis, feature screening, feature extraction, and noise addition. These steps will generate different computational times depending on the size of the dataset or the number of features. Therefore, we will evaluate whether this research method can reduce the training time of machine learning compared with the method using PCA and t-SNE, and we will determine the impact of different feature numbers and data sizes on computational time. This study will compare the following under the same privacy budget and the same model:
- (a)
- The computational time of the t-SNE, UMAP, and PCA methods on the same dataset.
- (b)
- Changes in computational time of the t-SNE, UMAP, and PCA methods on datasets with different features and data amounts.
- 2.
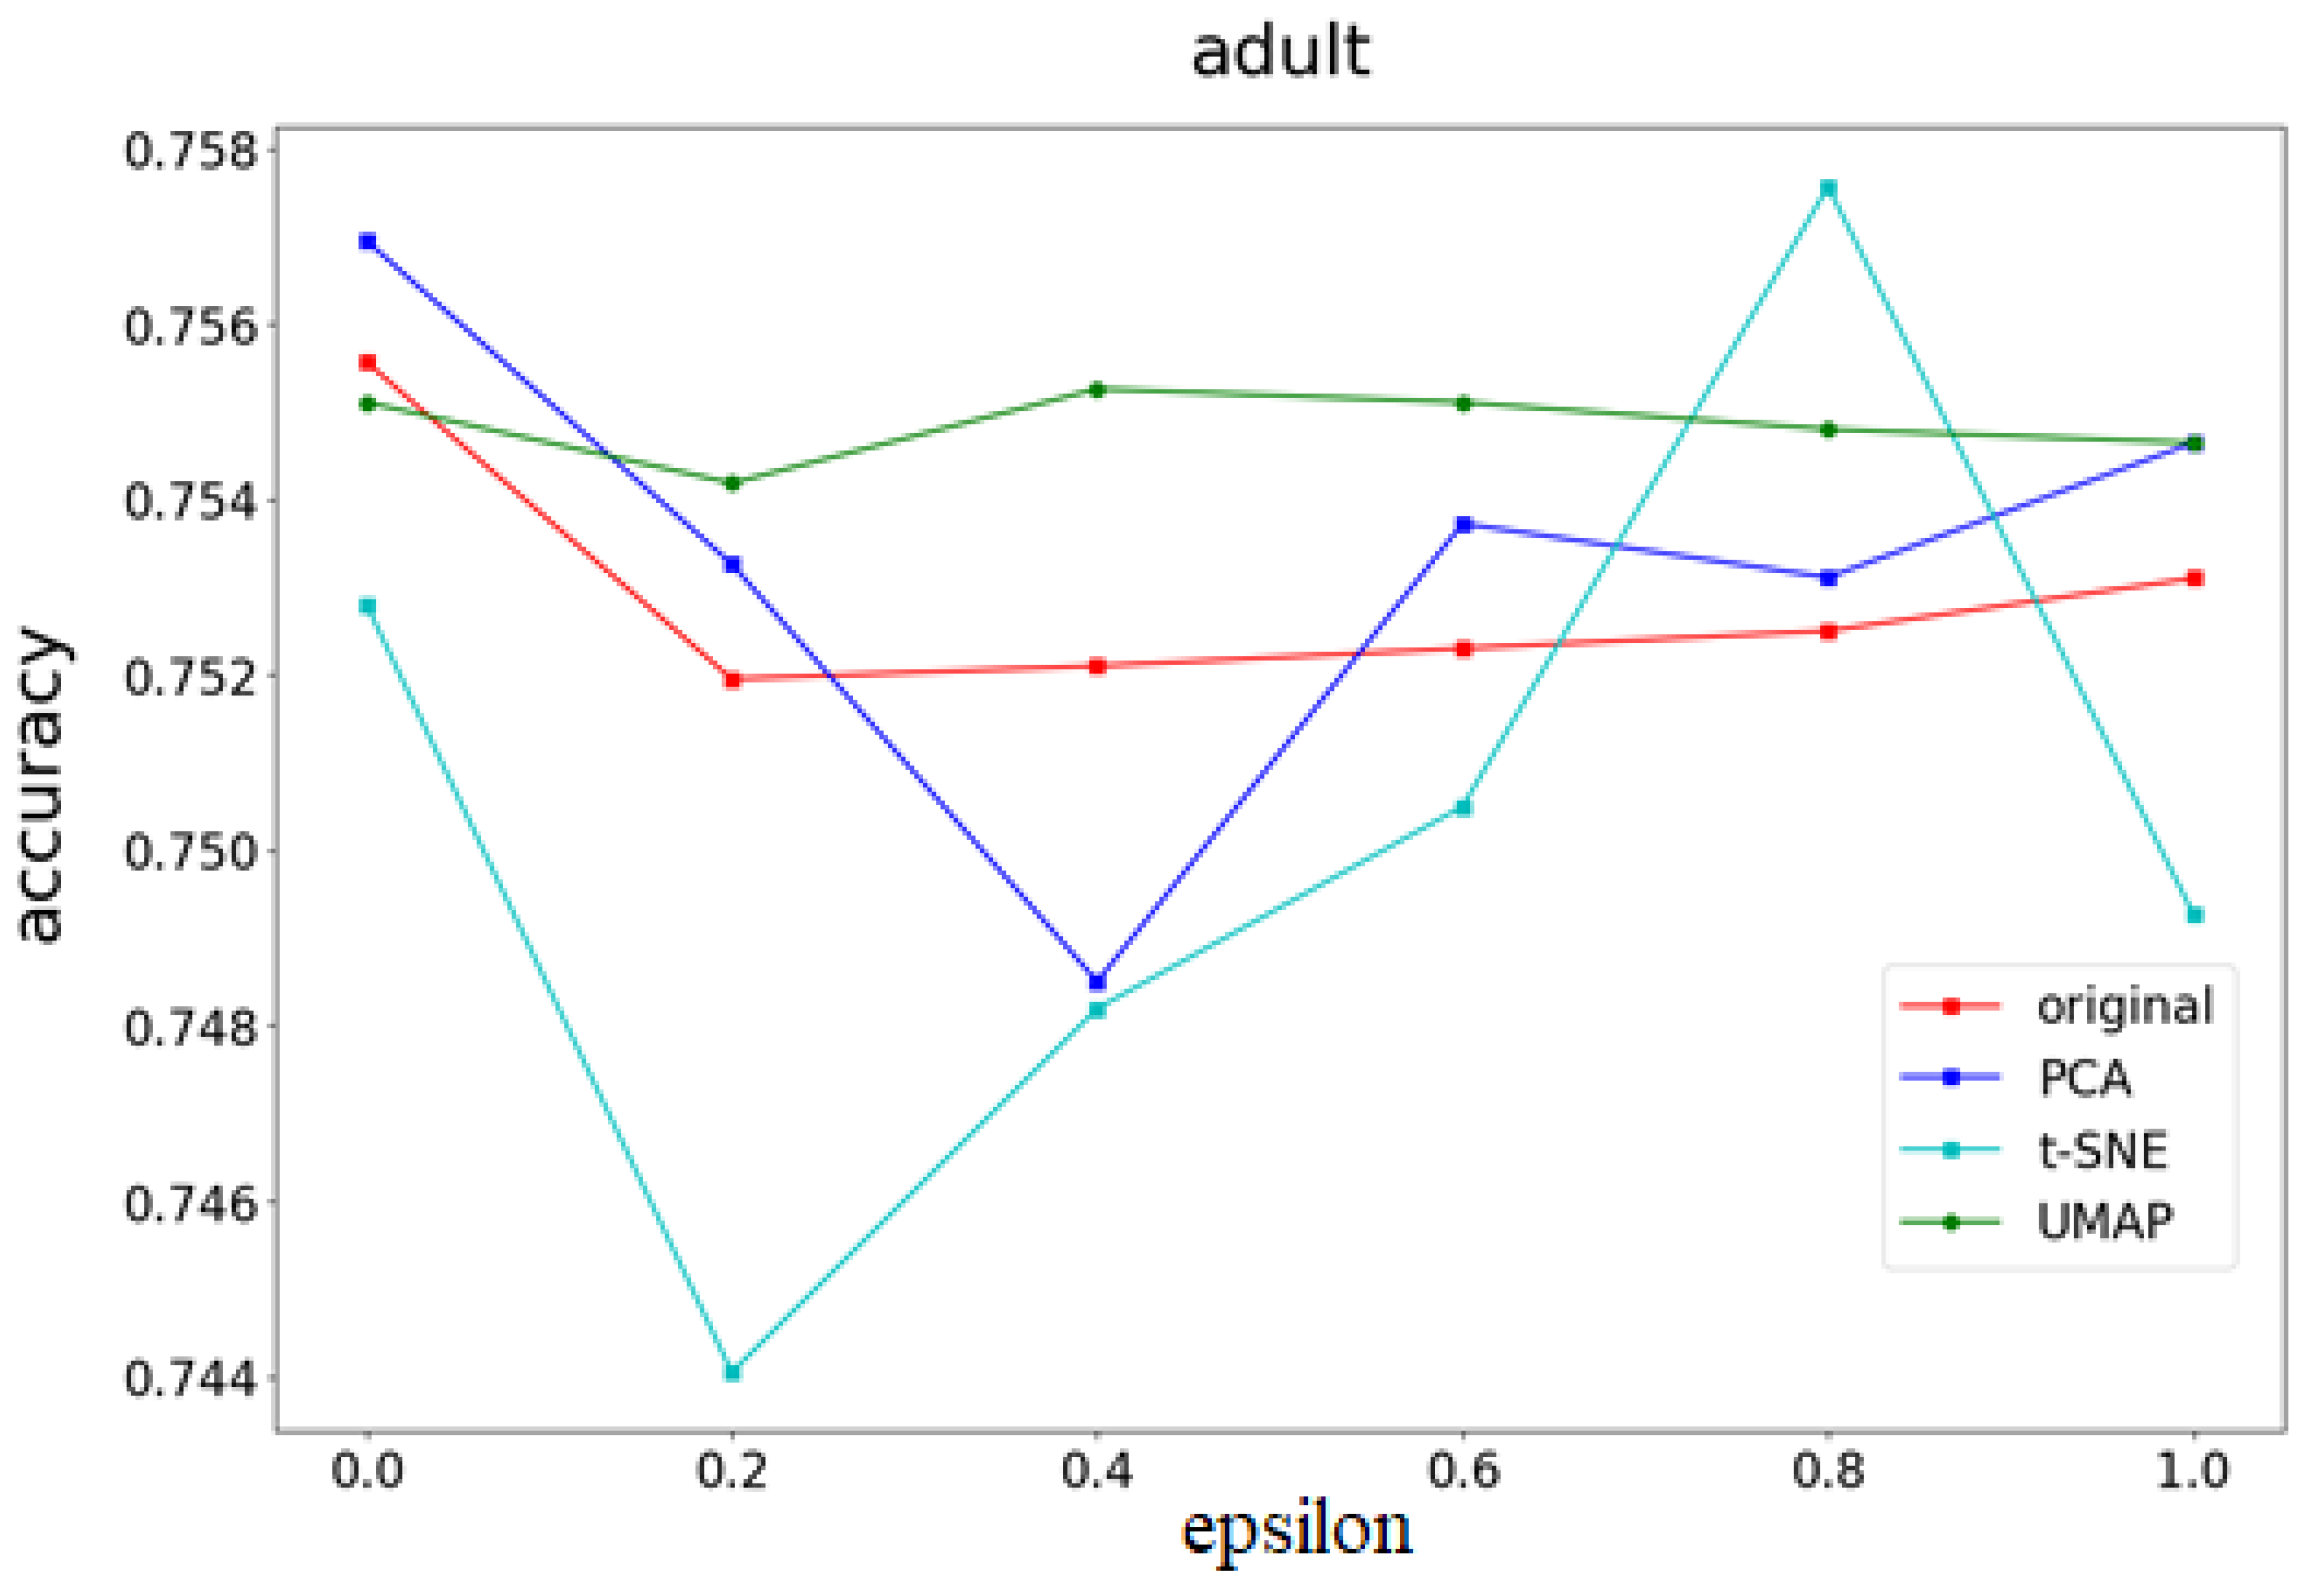
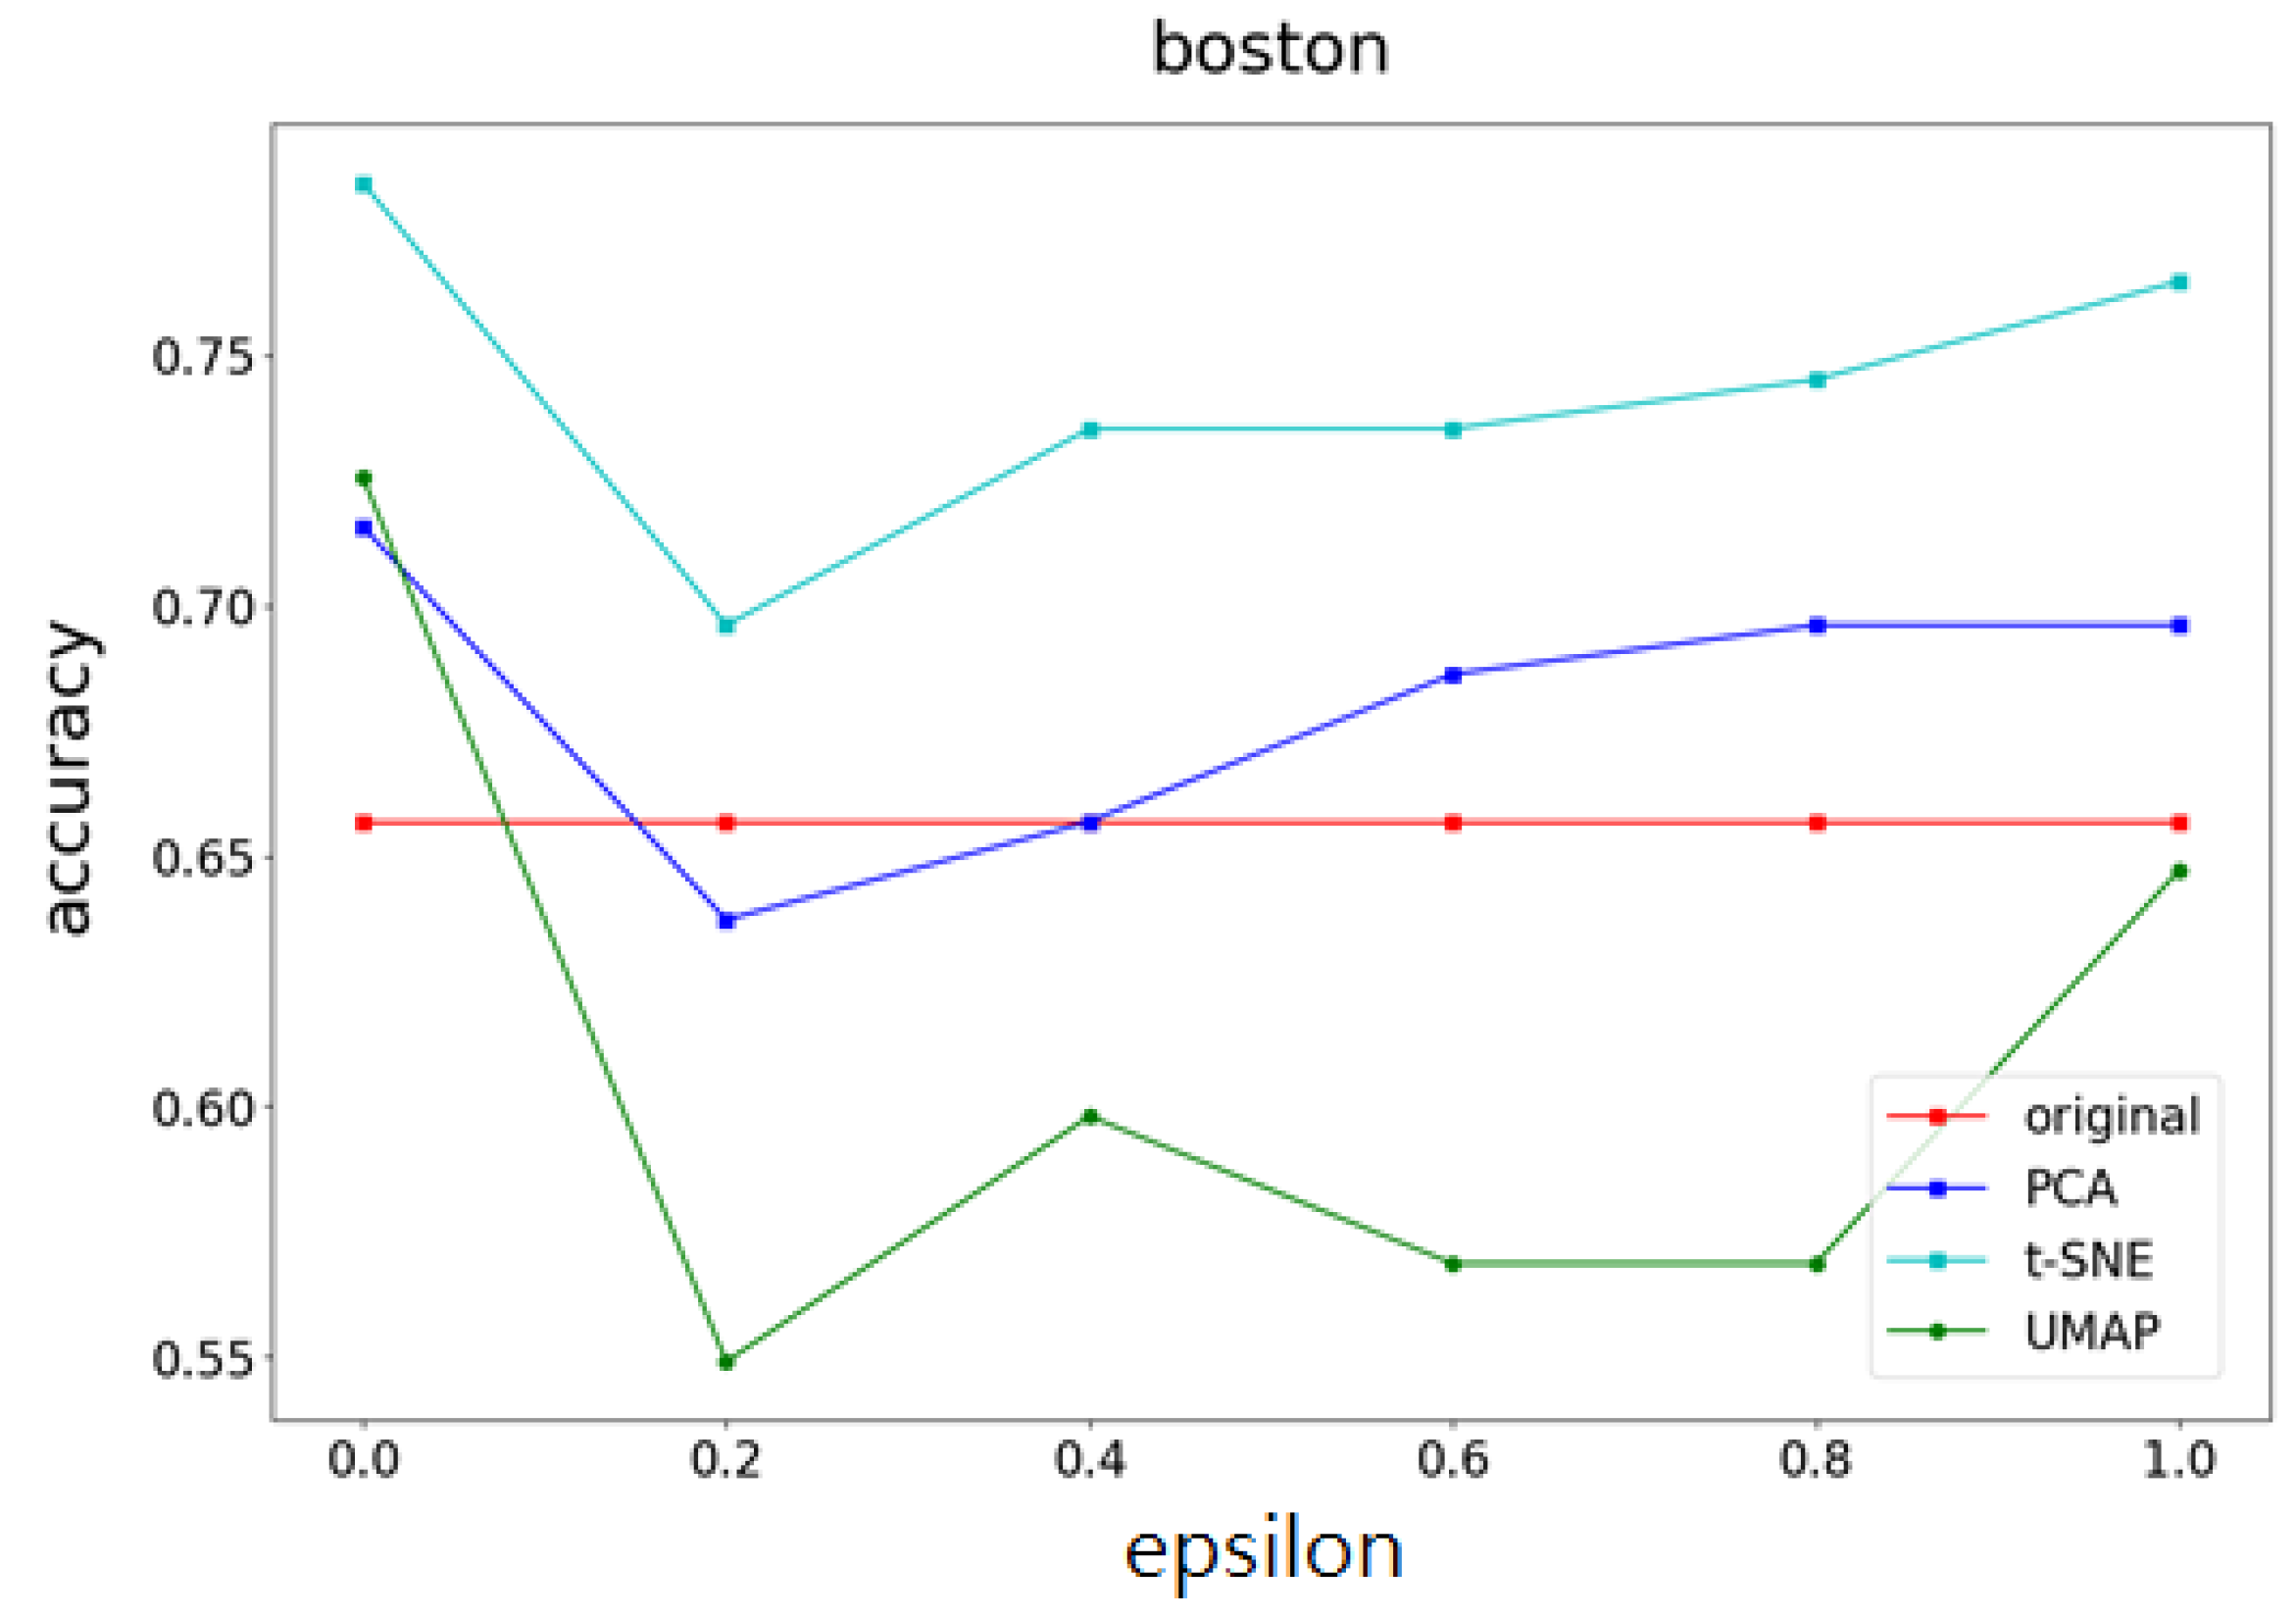
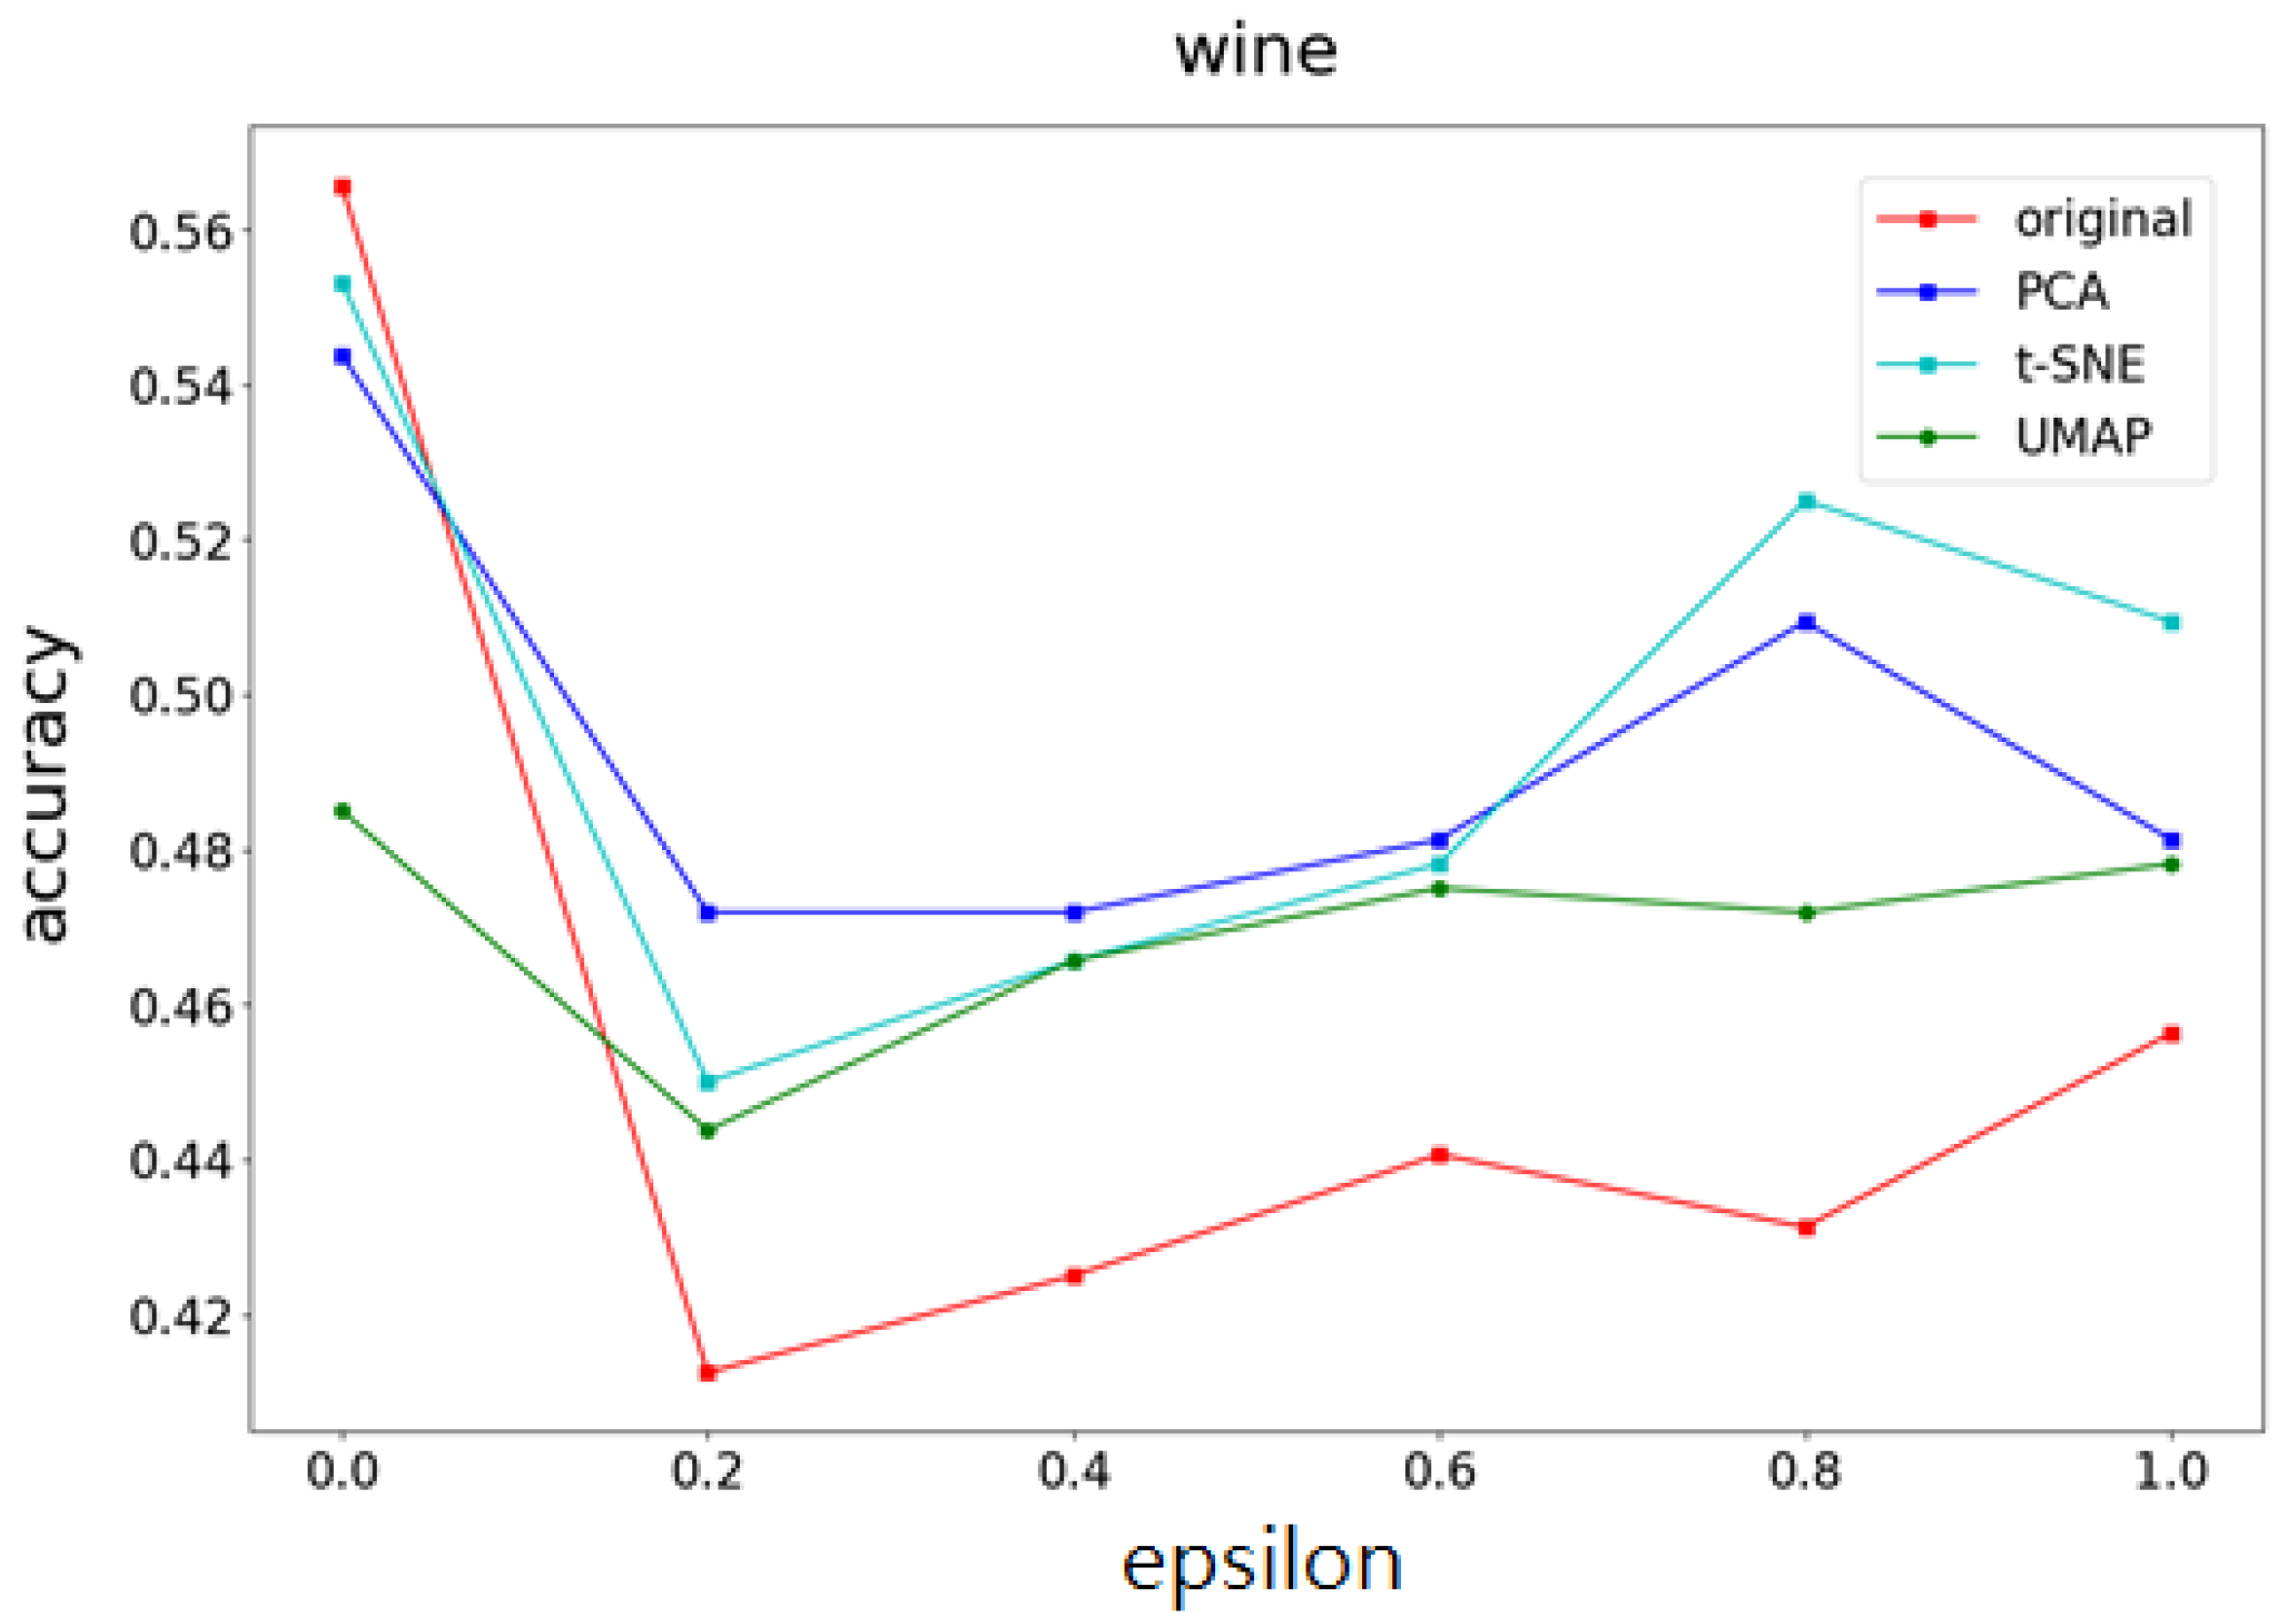
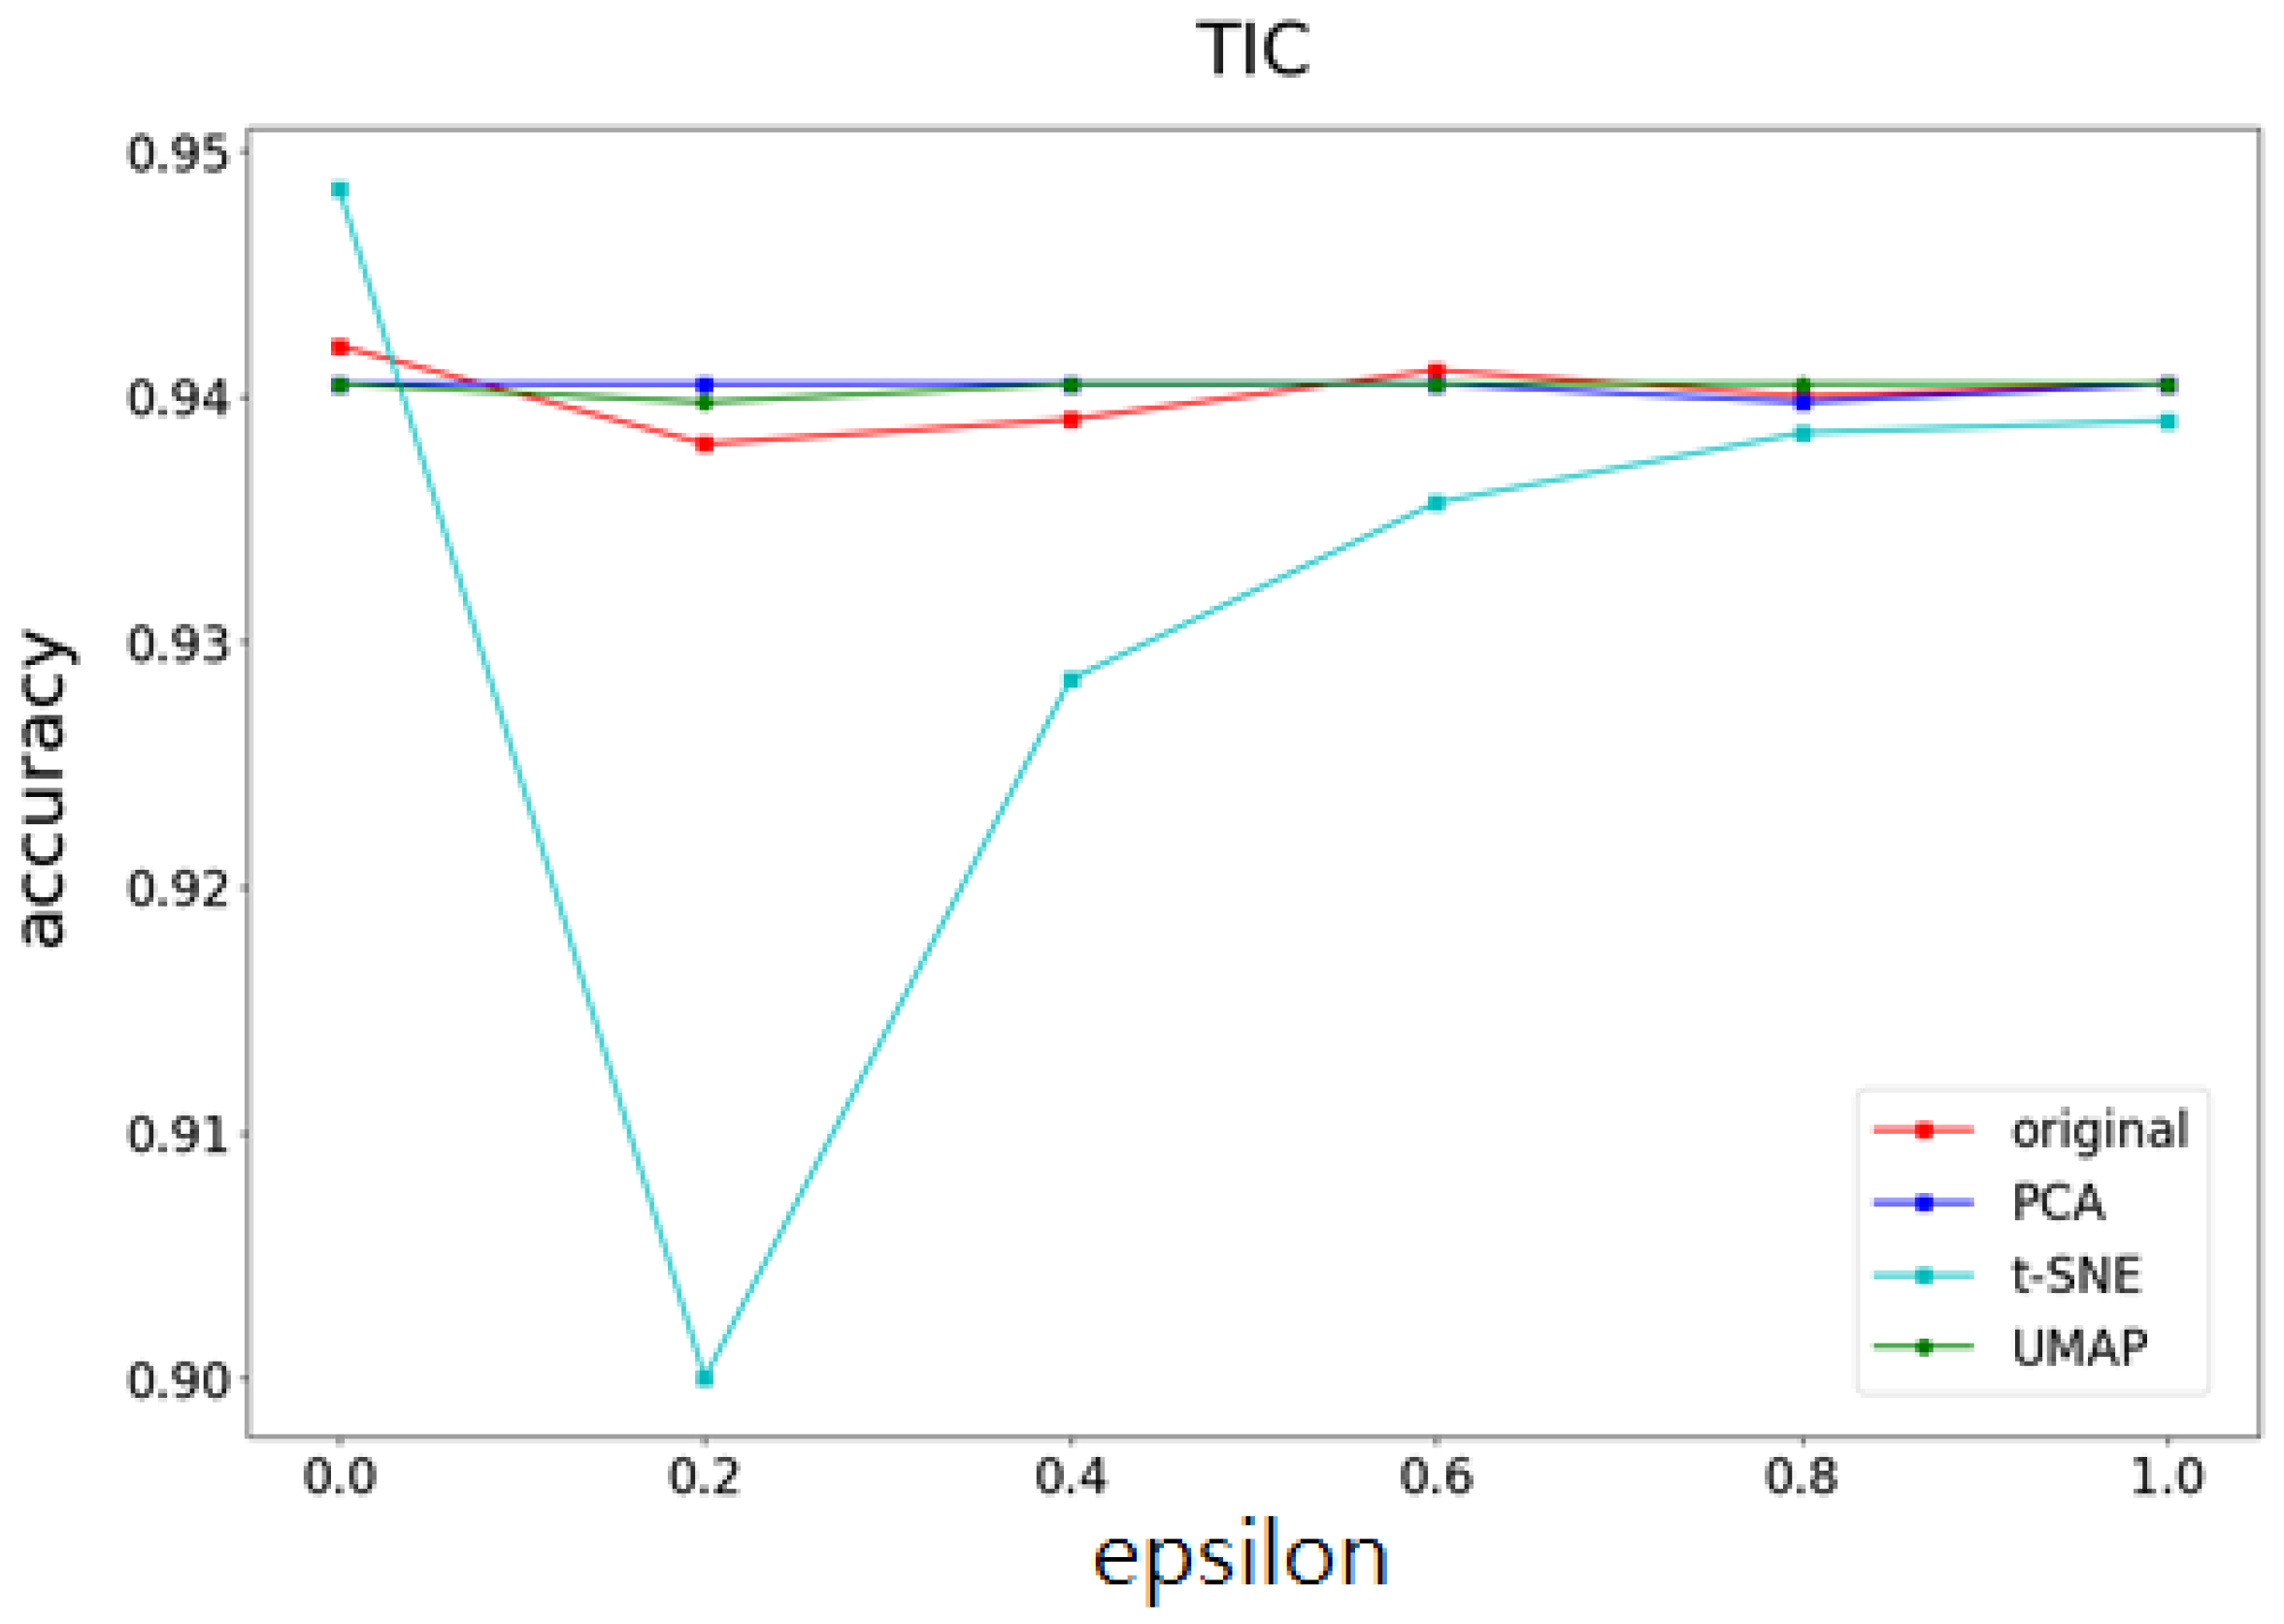
- Model accuracyTo protect data privacy, noise is added to the original dataset. Although this method can protect data privacy, the accuracy of the machine learning model will decrease. Therefore, to understand the impact of this method and PCA and t-SNE methods on the accuracy of differential privacy machine learning models, as well as the impact of different feature numbers and data amounts on accuracy, the following are compared under the same privacy budget and the same model:
- (a)
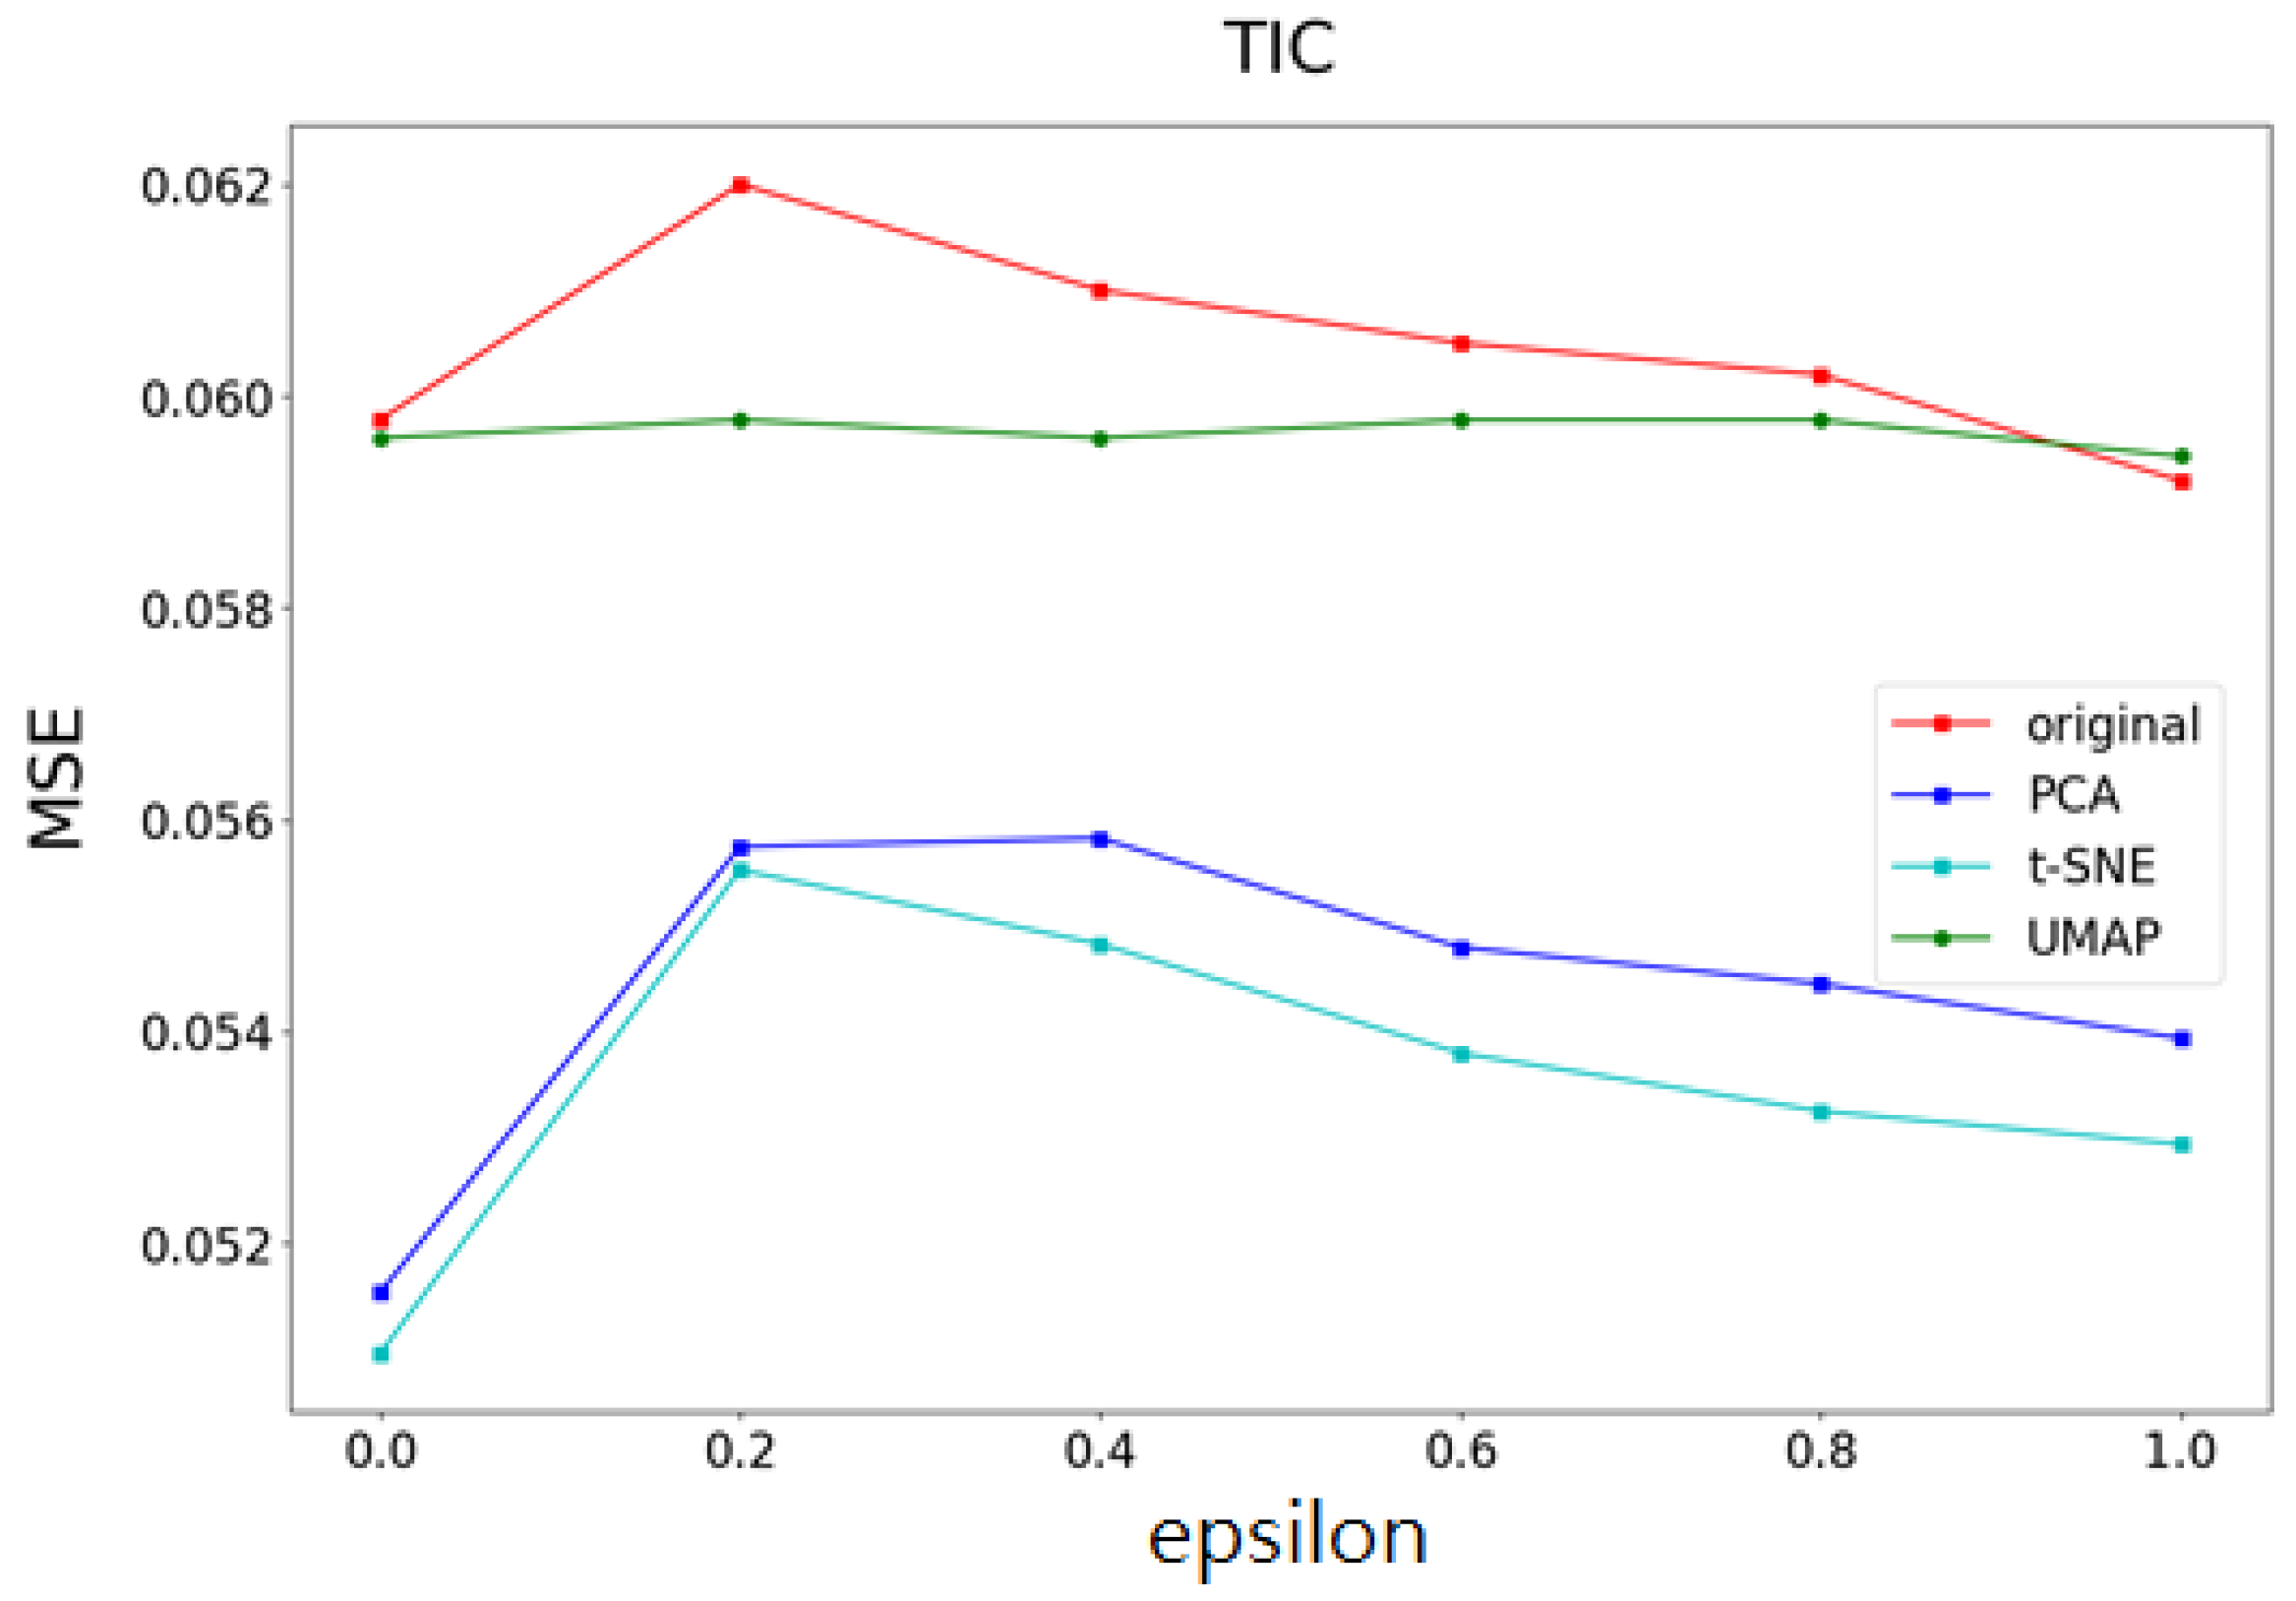
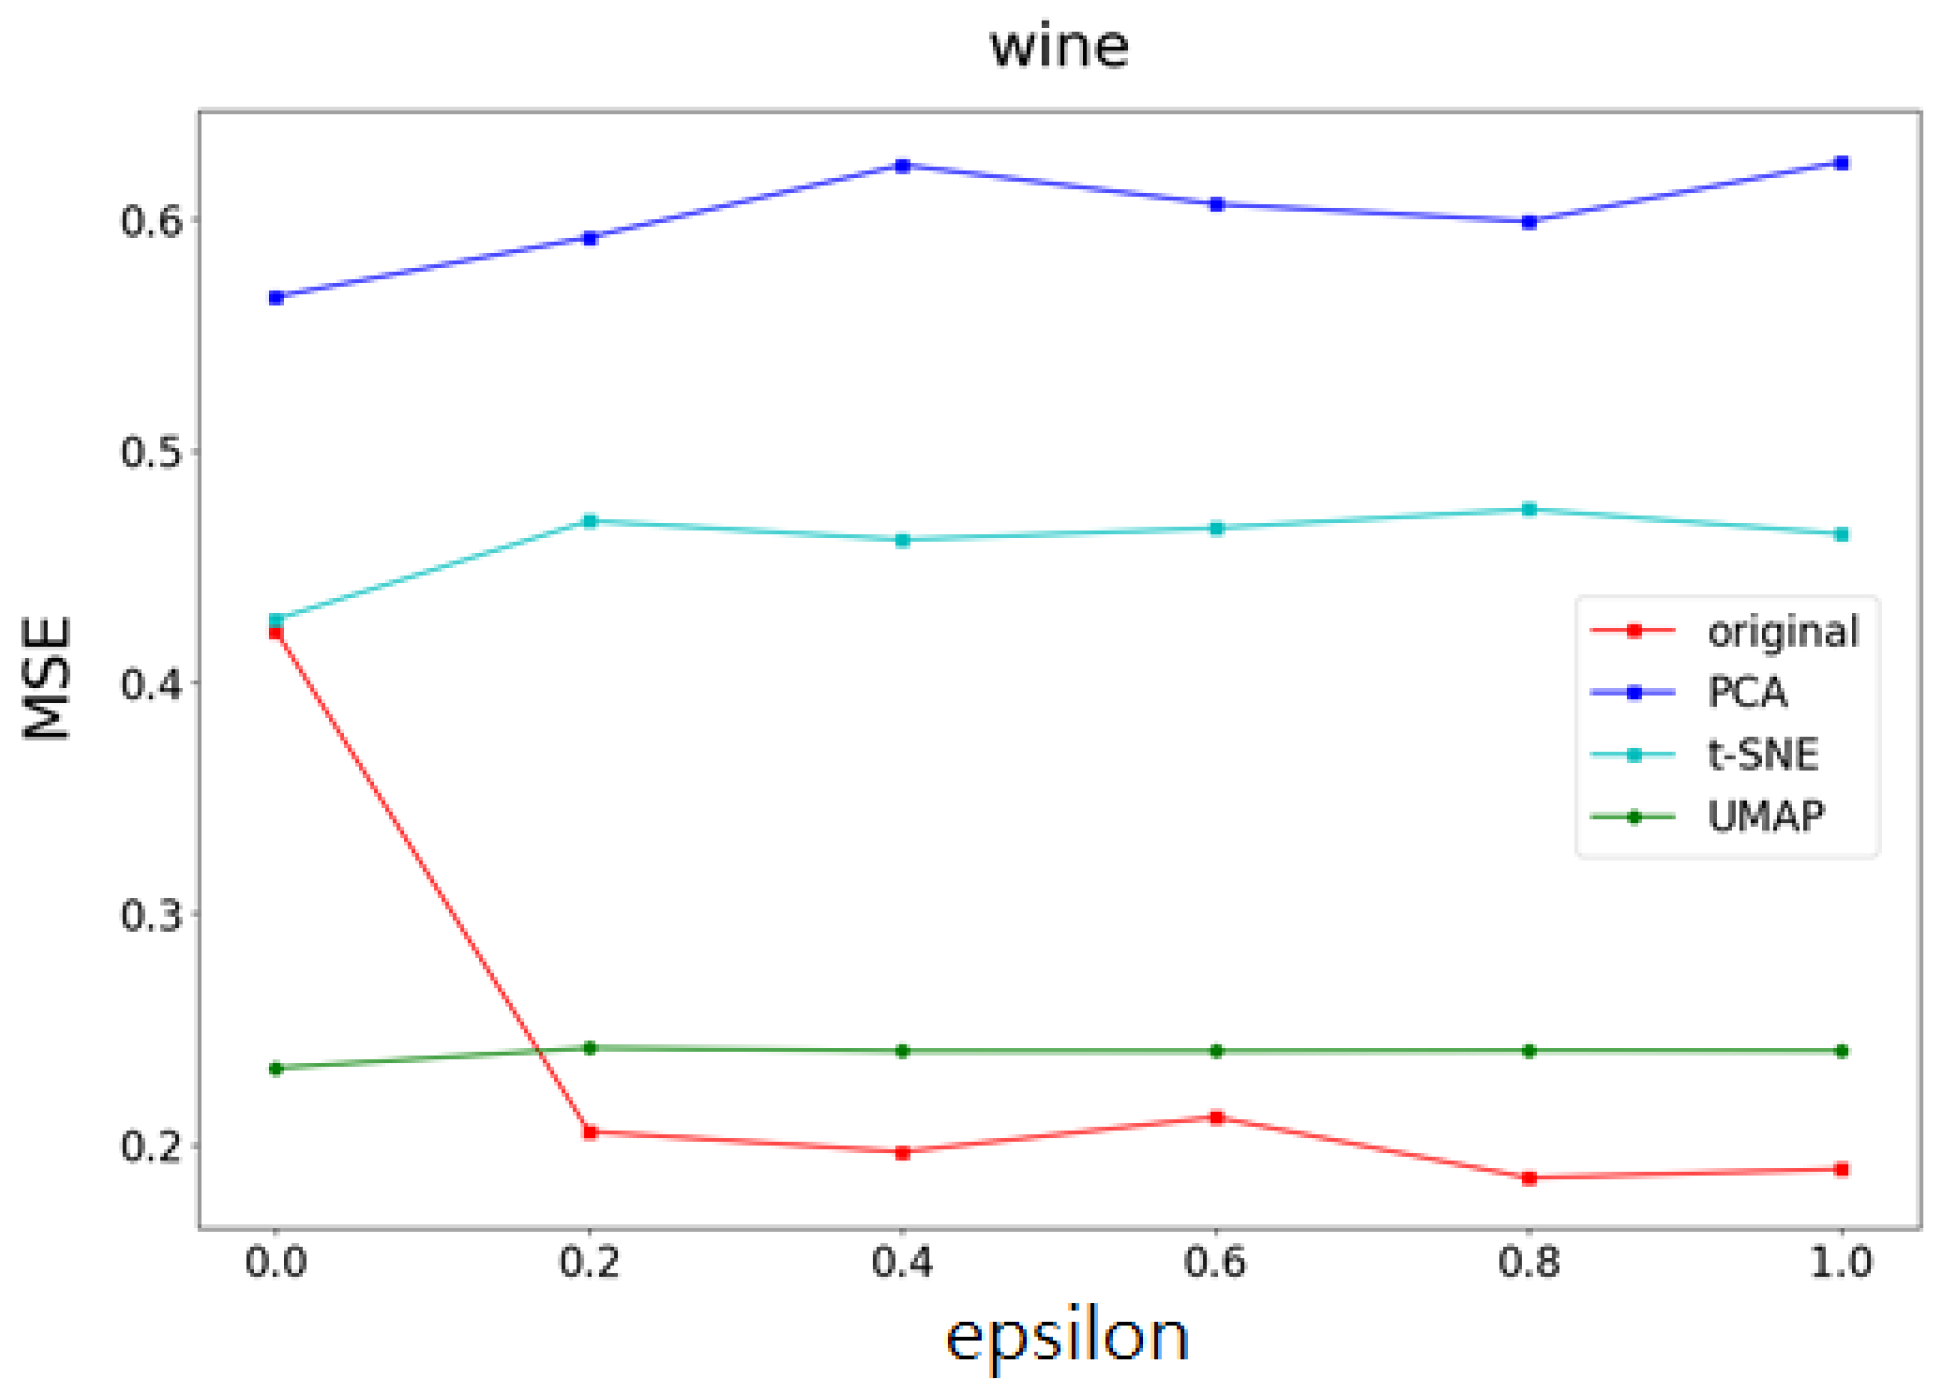
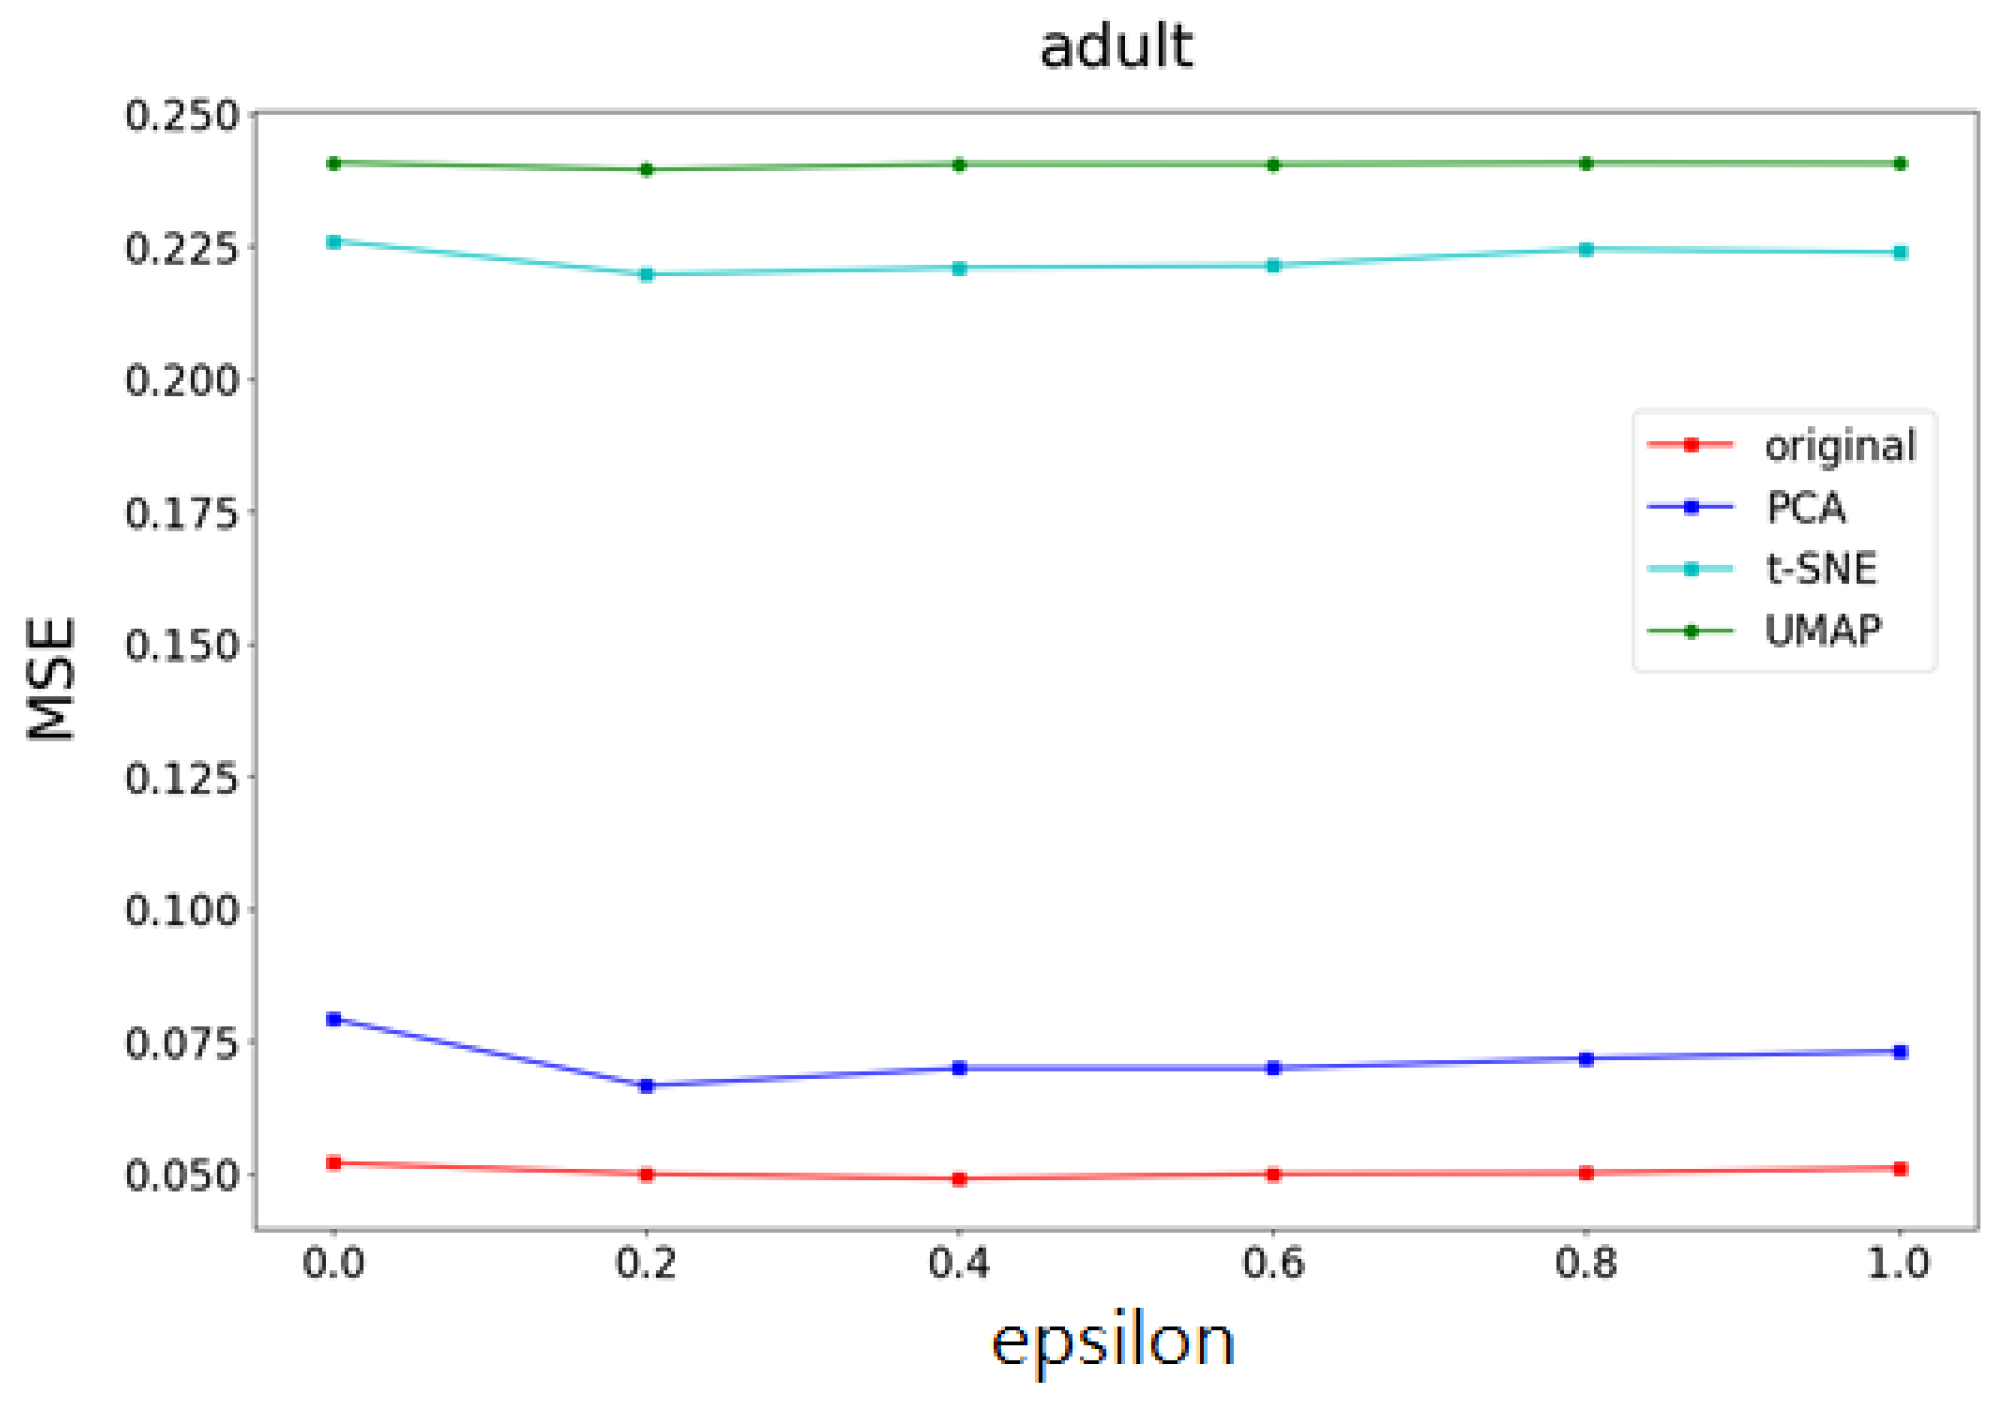
- Accuracy and mean square error (MSE) of the t-SNE, UMAP, and PCA methods on different datasets.
- (b)
- The changes in accuracy and mean square error (MSE) of the t-SNE, UMAP, and PCA methods on datasets with different feature data sizes.
4.2. Experimental Dataset and Parameter Settings
- The first dataset is Adult. Barry Becker extracted this dataset from the 1994 census database, and it is primarily used it to predict whether a person’s annual income exceeds $ 50,000 US dollars [30]. This dataset contains 14 attributes, including age, gender, and marital status. There are 48,842 datasets in total, and the target variable attribute is income_bracket, which indicates a person’s annual income level.
- The second dataset is Boston. This dataset contains housing data for Boston, Massachusetts, collected by the US Census Bureau, which is used to predict the median price of houses [31]. This dataset contains 506 records, including 13 attributes such as the city’s per capita crime rate and the city’s teacher–student ratio. Its target variable attribute is medv, which indicates the median of owner-occupied houses.
- The third dataset is TIC. This dataset is based on real commercial data and is provided by Sentient Machine Research, a Dutch data mining company, to predict who will buy RV insurance [32]. This dataset contains 5822 customer records and 86 attributes, including socio-demographics (attributes 1–43) and product ownership (attributes 44–86). Socio-demographics are based on zip codes, and all customers residing in the same zip code area share the same socio-demographic characteristics. Its target variable attribute is CARAVAN, which represents the number of mobile home insurance policies that the customer owns.
- The fourth dataset is Wine. This dataset contains entity data for red grapes, which is used to predict the quality of red wine [33]. This dataset contains 4898 records, including 11 attributes such as fixed acidity and citric acid. Its target variable attribute is quality, which represents the quality of red wine.
| Dataset | Number of Features | Number of Data Records |
|---|---|---|
| Adults | 14 | 48842 |
| Boston | 13 | 506 |
| TIC | 86 | 5822 |
| Wine | 11 | 4898 |
4.3. Experimental Results
- Part I Calculates the correlation of the data feature importance set, then sequentially removes features with low importance and high correlation to find the optimal number of features.
- Part II Dimensionality reduction is performed using multiple UMAP, t-SNE, and PCA methods, respectively, and weights are determined based on the feature importances calculated in Part I. After obtaining the weighting parameters, noise is added. This method effectively reduces the added noise, preventing excessive noise from being introduced into the data, thereby minimizing its impact on machine learning performance.
4.4. The Optimality
5. Conclusions and Discussion
Author Contributions
Funding
Data Availability Statement
Conflicts of Interest
References
- Cuzzocrea, A. Privacy-Preserving Big Data Stream Mining: Opportunities, Challenges, Directions. In Proceedings of the 2017 IEEE International Conference on Data Mining Workshops, New Orleans, LA, USA, 18–21 November 2017. [Google Scholar] [CrossRef]
- Council of the European Union. 2016. General Data Protection Regulation. Available online: https://gdpr-info.eu/ (accessed on 7 September 2025).
- Cao, J.; Ren, J.; Guan, F.; Li, X.; Wang, N. K-anonymous Privacy Protection Based on You Only Look Once Network and Random Forest for Sports Data Security Analysis. Int. J. Netw. Secur. 2025, 27, 264–273. [Google Scholar]
- Mothukuri, V.; Parizi, R.M.; Pouriyeh, S.; Huang, Y.; Dehghantanha, A.; Srivastava, G. A Survey on Security and Privacy of Federated Learning. Future Gener. Comput. Syst. 2021, 115, 619–640. [Google Scholar] [CrossRef]
- Chen, J.; Gong, L.; Chen, J. Privacy Preserving Scheme in Mobile Edge Crowdsensing Based on Federated Learning. Int. J. Netw. Secur. 2024, 26, 74–83. [Google Scholar]
- Li, Q.; Wen, Z.; He, B. Federated Learning Systems: Vision, Hype and Reality for Data Privacy and Protection. arXiv 2019, arXiv:1907.09693. [Google Scholar] [CrossRef]
- Li, T.; Sahu, A.K.; Talwalkar, A.; Smith, V. Federated Learning: Challenges, Methods, and Future Directions. IEEE Signal Process 2019, 37, 50–60. [Google Scholar] [CrossRef]
- Hard, A.; Rao, K.; Mathews, R.; Ramaswamy, S.; Beaufays, F.; Augenstein, S.; Eichner, H.; Kiddon, C.; Ramage, D. Federated Learning for Mobile Keyboard Prediction. arXiv 2019, arXiv:1811.03604v2. Available online: https://arxiv.org/pdf/1811.03604.pdf (accessed on 21 July 2025). [CrossRef]
- Xu, N.; Feng, T.; Zheng, J. Ice-snow Physical Data Privacy Protection Based on Deep Autoencoder and Federated Learning. Int. J. Netw. Secur. 2025, 27, 314–322. [Google Scholar]
- Yu, J.; Huang, L.; Zhao, L. Art Design Data Privacy Protection Strategy Based on Blockchain Federated Learning and Long Short-term Memory. Int. J. Netw. Secur. 2024, 26, 573–581. [Google Scholar]
- Hu, W.P.; Lin, C.B.; Wu, J.T.; Yang, C.Y.; Hwang, M.S. Research on Privacy and Security of Federated Learning in Intelligent Plant Factory Systems. Int. J. Netw. Secur. 2023, 25, 377–384. [Google Scholar]
- Lin, J.; Du, M.; Liu, J. Free-Riders in Federated Learning: Attacks and Defenses. arXiv 2019, arXiv:1911.12560. Available online: https://api.semanticscholar.org/CorpusID:208513099 (accessed on 21 July 2025). [CrossRef]
- Chen, J.; Zhang, J.; Zhao, Y.; Han, H.; Zhu, K.; Chen, B. Beyond Model-Level Membership Privacy Leakage: An Adversarial Approach in Federated Learning. In Proceedings of the 29th International Conference on Computer Communications and Networks (ICCCN), Honolulu, HI, USA, 3–6 August 2020. [Google Scholar]
- Li, X.G.; Li, H.; Li, F.; Zhu, H. A Survey on Differential Privacy. J. Cyber Secur. 2018, 3, 92–104. [Google Scholar]
- Ji, Z.; Lipton, Z.C.; Elkan, C. Differential Privacy and Machine Learning: A Survey and Review. arXiv 2014, arXiv:1412.7584. Available online: https://arxiv.org/abs/1412.7584 (accessed on 21 July 2025). [CrossRef]
- Dong, W.; Sun, D.; Yi, K. Better than Composition: How to Answer Multiple Relational Queries under Differential Privacy. Proc. ACM Manag. Data 2023, 1, 1–26. [Google Scholar] [CrossRef]
- Laouir, A.E.; Imine, A. Private Approximate Query over Horizontal Data Federation. arXiv 2024, arXiv:2406.11421. Available online: https://arxiv.org/abs/2406.11421 (accessed on 21 July 2025).
- Abadi, M.; Chu, A.; Goodfellow, I.; McMahan, H.B.; Mironov, I.; Talwar, K.; Zhang, L. Deep Learning with Differential Privacy. In Proceedings of the 2016 ACM SIGSAC Conference on Computer and Communications Security, Vienna, Austria, 24–28 October 2016; pp. 308–318. [Google Scholar]
- Ni, L.; Li, C.; Wang, X.; Jiang, H.; Yu, J. DP-MCDBSCAN: Differential Privacy Preserving Multi-Core DBSCAN Clustering for Network User Data. IEEE Access 2018, 6, 21053–21063. [Google Scholar] [CrossRef]
- Wang, J.; Wang, A. An Improved Collaborative Filtering Recommendation Algorithm Based on Differential Privacy. In Proceedings of the IEEE 11th International Conference on Software Engineering and Service Science (ICSESS), Beijing, China, 16–18 October 2020; pp. 310–315. [Google Scholar]
- Sharma, J.; Kim, D.; Lee, A.; Seo, D. On Differential Privacy-Based Framework for Enhancing User Data Privacy in Mobile Edge Computing Environment. IEEE Access 2021, 9, 38107–38118. [Google Scholar] [CrossRef]
- Ji, Z.; Elkan, C. Differential privacy based on importance weighting. Mach. Learn. 2013, 93, 163–183. [Google Scholar] [CrossRef] [PubMed]
- Akmeşe, Ö.F. A novel random number generator and its application in sound encryption based on a fractional-order chaotic system. J. Circuits Syst. Comput. 2023, 32, 2350127. [Google Scholar] [CrossRef]
- Akmeşe, Ö.F. Data privacy-aware machine learning approach in pancreatic cancer diagnosis. BMC Med. Inform. Decis. Mak. 2024, 24, 248. [Google Scholar] [CrossRef]
- Alaca, Y.; Akmeşe, Ö.F. Pancreatic Tumor Detection from CT Images Converted to Graphs Using Whale Optimization and Classification Algorithms with Transfer Learning. Int. J. Imaging Syst. Technol. 2025, 35, e70040. [Google Scholar] [CrossRef]
- Tozlu, B.H.; Akmeşe, Ö.F.; Şimşek, C.; Şenel, E. A New Diagnosing Method for Psoriasis from Exhaled Breath. IEEE Access 2025, 13, 25163–25174. [Google Scholar] [CrossRef]
- Li, W.; Zhang, X.; Li, X.; Cao, G.; Zhang, Q. PPDP-PCAO: An Efficient High-Dimensional Data Releasing Method with Differential Privacy Protection. IEEE Access 2019, 7, 176429–176437. [Google Scholar] [CrossRef]
- Maaten, L.V.D.; Hinton, G. Visualizing Data using t-SNE. J. Mach. Learn. 2008, 9, 2579–2605. [Google Scholar]
- McInnes, L.; Healy, J.; Melville, J. UMAP: Uniform Manifold Approximation and Projection for Dimension Reduction. arXiv 2018, arXiv:1802.03426. [Google Scholar] [CrossRef]
- Becker, B.; Kohavi, R.; Adult Data Set. UCI Machine Learning Repository. 1996. Available online: https://archive.ics.uci.edu/ml/datasets/adult (accessed on 21 July 2025).
- Harrison, D.; Rubinfeld, D.L. Hedonic housing prices and the demand for clean air. J. Environ. Econ. Manag. 1978, 5, 81–102. [Google Scholar] [CrossRef]
- Sentient Machine Research. TIC Data Set (CARAVAN Insurance Challenge) UCI Machine Learning Repository. Available online: https://www.kaggle.com/datasets/uciml/caravan-insurance-challenge (accessed on 7 September 2025).
- Cortez, P.; Cerdeira, A.; Almeida, F.; Matos, T.; Reis, J. Modeling wine preferences by data mining from physicochemical properties. Decis. Support Syst. 2009, 47, 547–553. [Google Scholar] [CrossRef]


| Component | Hyperparameters |
|---|---|
| SVM | kernel = ‘rbf’; gamma = ‘scale’; random_state = 42 |
| Random Seed | 42 (applied across all methods) |
| Libraries | scikit-learn 1.5.2 |
| Accuracy | Average | |||||
|---|---|---|---|---|---|---|
| Original | 0.6888 | 0.6940 | 0.6975 | 0.6957 | 0.6997 | 0.6951 |
| PCA | 0.7018 | 0.7036 | 0.7138 | 0.7256 | 0.7163 | 0.7122 |
| t-SNE | 0.6985 | 0.7205 | 0.7253 | 0.7426 | 0.7406 | 0.7255 |
| UMAP | 0.6723 | 0.6903 | 0.6837 | 0.6828 | 0.7024 | 0.6863 |
| Computational Time | Average | |||||
|---|---|---|---|---|---|---|
| Original | 80.38 | 80.84 | 76.81 | 75.79 | 75.78 | 77.92 |
| PCA | 71.40 | 72.51 | 70.14 | 73.30 | 74.16 | 72.30 |
| t-SNE | 55.47 | 52.19 | 50.09 | 53.71 | 52.74 | 52.84 |
| UMAP | 52.40 | 50.12 | 49.63 | 49.59 | 49.35 | 50.22 |
Disclaimer/Publisher’s Note: The statements, opinions and data contained in all publications are solely those of the individual author(s) and contributor(s) and not of MDPI and/or the editor(s). MDPI and/or the editor(s) disclaim responsibility for any injury to people or property resulting from any ideas, methods, instructions or products referred to in the content. |
© 2025 by the authors. Licensee MDPI, Basel, Switzerland. This article is an open access article distributed under the terms and conditions of the Creative Commons Attribution (CC BY) license (https://creativecommons.org/licenses/by/4.0/).
Share and Cite
Wu, N.-I.; Wu, J.-T.; Hwang, M.-S. Symmetry-Preserving Optimization of Differentially Private Machine Learning Based on Feature Importance. Symmetry 2025, 17, 1747. https://doi.org/10.3390/sym17101747
Wu N-I, Wu J-T, Hwang M-S. Symmetry-Preserving Optimization of Differentially Private Machine Learning Based on Feature Importance. Symmetry. 2025; 17(10):1747. https://doi.org/10.3390/sym17101747
Chicago/Turabian StyleWu, Nan-I, Jing-Ting Wu, and Min-Shiang Hwang. 2025. "Symmetry-Preserving Optimization of Differentially Private Machine Learning Based on Feature Importance" Symmetry 17, no. 10: 1747. https://doi.org/10.3390/sym17101747
APA StyleWu, N.-I., Wu, J.-T., & Hwang, M.-S. (2025). Symmetry-Preserving Optimization of Differentially Private Machine Learning Based on Feature Importance. Symmetry, 17(10), 1747. https://doi.org/10.3390/sym17101747


