Article

An Enhanced Particle Swarm Optimization Algorithm for the Permutation Flow Shop Scheduling Problem

1
School of Information Technology, Meiga Polytechnic Institute of Hubei, Xiaogan 432900, China
2
School of Information and Electrical Engineering, Hunan University of Science and Technology, Xiangtan 411201, China
*
Author to whom correspondence should be addressed.
Symmetry 2025, 17(10), 1697; https://doi.org/10.3390/sym17101697
Submission received: 26 August 2025 / Revised: 17 September 2025 / Accepted: 22 September 2025 / Published: 10 October 2025

Abstract

The permutation flow shop scheduling problem (PFSP) is one of the hot issues in current research, and its production methods are widely used in steel, medicine, semiconductor, and other industries. Due to the characteristics of permutation flow (optimize the production process through the principle of symmetry to achieve efficient allocation and balance of resources), its task processes only need to be sorted on the first machine, and the subsequent machines are completely symmetrical with the first machine. This paper proposes an enhanced particle swarm optimization algorithm (EPSO) for the PFSP. Firstly, in order to enhance the diversity of the algorithm, a new dynamic inertia weight method was introduced to dynamically adjust the search range of particles. Secondly, a new speed update strategy was proposed, which makes full use of the information of high-quality solutions and further improves the convergence speed of the algorithm. Subsequently, an interference strategy based on individual mutations was designed, which improved the universality of the model’s global search. Finally, to verify the effectiveness of the EPSO algorithm, six benchmark functions were tested, and the results proved the superiority of the EPSO algorithm. In addition, the average relative error of the improved algorithm is at least 21.6% higher than that of the unimproved algorithm when solving large-scale PFSPs.

1. Introduction

The permutation flow shop scheduling problem (PFSP) differs from traditional flow shop scheduling problems in that it enforces that the processing order of jobs on each machine must be exactly the same. In other words, a set of jobs waiting to be processed consists of multiple operations, and once the first operation of a job is sequenced on the first machine, the subsequent operations of the other jobs are also processed in the same order as that of the first machine. This kind of constraint is more in line with the actual processing conditions of the production line and can effectively improve the operational efficiency of enterprises [1]. Although the constraint model of the PFSP is relatively simple, it has been confirmed in flexible manufacturing systems that the PFSP becomes a typical NP-hard problem when three or more machines are involved in the production process. Currently, the PFSP is primarily addressed using heuristic algorithms, exact algorithms, and intelligent algorithms. Exact algorithms have high computational complexity and are only suitable for solving small-scale problems. Heuristic methods can construct solutions in a short amount of time based on the characteristics of the problem but often struggle to guarantee solution quality. With the development of intelligent computing, intelligent algorithms for solving the PFSP have received extensive research attention. Existing studies on the PFSP include Qi et al. [2], who proposed a variable-neighborhood artificial bee colony algorithm (VABC) for solving the PFSP, which has an enhanced exploration capability due to the introduction of variable neighborhood search, NEH (Namaz Enscore Ham) initialization, and differential evolution concepts. Subsequently, strategies such as optimal point set mapping and adaptive crossover mutation were employed to improve the hybrid crossover variation beluga whale optimization (HCVBWO) algorithm [3], with the results validating the reliability of the improved algorithm. Robert et al. [4] integrated genetic algorithms and simulated annealing (hybrid genetic algorithm and simulated annealing, HGASA) to solve large-scale flow shop scheduling instances, significantly reducing completion times. Han et al. [5] combined neural networks with genetic algorithms (neural network genetic algorithm, ANN-GA) using a random insertion disturbance scheme to enhance the resulting solution quality. Yang et al. [6] mapped hyper-heuristic clustering strategies to scheduling problems, demonstrating the effectiveness of their improvements. Zeng et al. [7] proposed a fruit fly algorithm based on variable neighborhood and probabilistic model improvements, constructing multiple disturbance operators to enhance algorithmic efficiency. Sami et al. [8] introduced a position-guided improvement distribution estimation algorithm, significantly enhancing the algorithm’s performance in minimizing completion times for the PFSP through mechanisms such as sampling different elements. Based on the latest literature, it can be observed that existing solution methods for the PFSP problem perform well on small-scale instances, but when faced with large-scale instances, they are prone to the “curse of dimensionality,” which significantly reduces their computational efficiency and leads to uncertain optimization results. To improve the convergence speed and optimization accuracy of algorithms in complex situations, it is essential to adopt more innovative optimization strategies to enhance their adaptability and robustness.
The particle swarm optimization algorithm (PSO), proposed by James Kennedy et al. [9] in 1995, features a simple and efficient search framework compared to other algorithms and is widely applied in fields such as path planning, data mining, and production scheduling. However, like other algorithms, the PSO algorithm is prone to getting trapped in local optima. Therefore, this paper proposes an enhanced particle swarm optimization algorithm (EPSO) to address the PFSP. Firstly, to enhance the diversity of the algorithm, a novel dynamic inertia weight method is introduced to dynamically adjust the search range of the particles. Secondly, a new velocity update strategy is proposed which fully utilizes the information of high-quality solutions to further improve the convergence speed of the algorithm. Subsequently, a disturbance strategy based on individual mutation is designed to enhance the generality of the model’s global search. Finally, to validate the effectiveness of the EPSO algorithm, six benchmark functions are tested, and the results demonstrate the superiority of the EPSO algorithm. Additionally, the improved algorithm also yields optimal results in solving the PFSP.

2. Particle Swarm Optimization Algorithm

In the standard PSO algorithm framework, the search space is abstracted as a D-dimensional Euclidean space, where each potential solution to the optimization problem is modeled as a massless particle with a velocity and position to dynamically track the search process in real-time. Particles evaluate their own state through a fitness function, continuously moving towards their individual best solution P b e s t and the global best solution G b e s t during the iteration process, while dynamically optimizing their search strategies to ultimately achieve the identification of the global optimum.
Assuming the population size in the D-dimensional space is N, the process of updating a particle’s position and velocity can be expressed by the following Equation (1):
V i , j ( t + 1 ) = w × V i , j ( t ) + c 1 × r 1 ( P b e s t X i , j ( t ) ) + c 2 × r 2 ( G b e s t X i , j ( t ) ) X i , j ( t + 1 ) = X i , j ( t ) + V i , j ( t + 1 )
where V i , j ( t ) and X i , j ( t ) represent the j-dimensional velocity and position components i = 1 , 2 , , N and j = 1 , 2 , , D of the i-th particle at the t-th iteration. c 1 and c 2 are the acceleration coefficients, r 1 and r 2 are random numbers uniformly distributed over the interval [0, 1], and w is the inertia weight that controls the particle’s velocity inertia.

3. Enhanced Particle Swarm Optimization Algorithm

This section mainly introduces an improved PSO algorithm. This algorithm has an enhanced performance in three aspects: (1) A new dynamic parameter adjustment strategy is introduced. (2) A new speed update strategy is proposed which makes full use of the information of high-quality solutions to further improve the convergence speed of the algorithm. (3) A perturbation strategy based on individual variation was designed to enhance the universality of the model’s global search.

3.1. Dynamic Parameter Adjustment Strategy

The inertia weight w is a key parameter in the PSO algorithm. Enhancing the population diversity and accelerating the convergence significantly affects the global search ability of the algorithm. However, fixing w may lead to an imbalance between global search and local exploration, and may result in missing the global optimal solution. Both linear and nonlinear inertia weights can effectively solve this problem. Linearly decreasing inertia weights are often used due to their simplicity, but their rigidity may lead to premature convergence. In contrast, the periodic sinusoidal decreasing inertia weight proposed in this paper allows for a smoother and more adaptive transition between exploration and utilization. The calculation method for this is as follows:
w = w min + ( w max + w min ) × sin ( π 2 ( 1 t T max ) )
where w min is taken as 0.3 and w max as 0.9. t represents the number of iterations; T max represents the maximum number of iterations. sin ( π 2 ( 1 t T max ) ) is a sine function that smoothly transitions from 1 to 0. As the number of iterations t changes from 0 to T max , this item smoothly transitions from sin ( 0 ) = 0 to sin ( π 2 ) = 1 .
As can be seen from Figure 1, compared with the sinusoidal decreasing inertia weight, the cosine decreasing inertia weight better balances global exploration and local development, as the sinusoidal decreasing inertia weight simply changes it. Firstly, the inertia weight w reaches its maximum value at the beginning (the early stage of the algorithm), allowing particles to conduct large-scale searches in the solution space and enhancing the algorithm’s exploration ability. As the number of iterations increases (the later stage of the algorithm), the inertia weight w continuously decreases and particles are already in the vicinity of the optimal solution. At this point, small-scale searches are carried out, which improves the algorithm’s local development ability.

3.2. Speed Update Strategy

The traditional PSO algorithm’s velocity update method combines the current individual optimal solution P b e s t and the global optimal solution G b e s t to calculate the new velocity. This leads to the particle population gradually concentrating in a certain sub-region and thereby hinders the effective exploration of other potential optimal regions. Specifically, being very close to the current particle position may make the velocity very small or even zero, which can cause the particle to be unable to move further and eventually fall into a local optimum. To fully utilize the information of high-quality solutions, inspired by reference [10], P b e s t and G b e s t are, respectively, replaced by their linear combinations G b e s t + P b e s t 2 and G b e s t P b e s t 2 . In addition, to make the particle search range wider, the perturbation term strategy was adopted, as shown in Equation (3).
R A N = μ ( r a n d ( N , D ) 0.5 )
where μ represents the disturbance intensity. In reference [5], the value of μ is 0.01. r a n d ( N , D ) is the random value between 0 and 1 for generating a matrix of size (N × D) and N is the population size.
In summary, the new speed update is as follows:
V i , j ( t + 1 ) = w × V i , j ( t ) + c 1 × r 1 ( P b e s t + G b e s t 2 X i , j ( t ) ) + c 2 × r 2 ( P b e s t G b e s t 2 X i , j ( t ) ) X i , j ( t + 1 ) = X i , j ( t ) + V i , j ( t + 1 ) + R A N
where V i , j ( t + 1 ) and X i , j ( t + 1 ) represent the j-dimensional velocity and position components i = 1 , 2 , , N and j = 1 , 2 , , D of the i-th particle at the (t + 1) iteration. c 1 and c 2 are the acceleration coefficients, r 1 and r 2 are random numbers uniformly distributed over the interval [0,1], and w is the inertia weight that controls the particle’s velocity inertia.
In the evolution process of particles in the EPSO algorithm, effectively utilizing the information from both the current individual best solution and the global best individual can significantly improve the model’s search efficiency and convergence speed. This approach helps particles quickly identify potential optimal solutions while avoiding getting trapped in local optima. By combining individual and global information, the algorithm can better balance exploration and exploitation, enhance the cooperation among particles, and ultimately exhibit an improved overall optimization performance, which makes it more adaptable to complex search spaces.

3.3. Perturbation Strategy

To enhance the exploration ability of the particle swarm optimization algorithm and maintain population diversity, a perturbation strategy based on individual variation is designed to improve the universality of global search. Gaussian mutation and Cauchy mutation are two commonly used perturbation methods. Figure 2 shows density function graphs of Gaussian mutation and Cauchy mutation, and a comparative analysis of their density functions is conducted.
By observing Figure 2, it can be concluded that the tail of the Cauchy mutation function is much longer, which indicates that the probability of a single particle escaping the local optimum is significantly higher. This feature amplifies the differences between the offspring and the parents, making the Cauchy mutation operator exhibit more prominent perturbation effects. In the later stage of the PSO algorithm iteration, the particle swarm often rapidly gathers in the high-fitness region, which results in a decrease in movement speed and triggers premature convergence. To alleviate this issue, this question introduces the Cauchy mutation operator, which enhances the algorithm’s ability to escape local extrema by increasing the population diversity. The perturbation applied to particles is represented as follows:
X i = X i × ( 1 + γ × C a u c h y ( 0 , 1 ) ) C a u c h y ( 0 , 1 ) = tan ( ( r a n d ( 0 , 1 ) 0.5 ) × π )
where γ is the scale parameter. In reference [2], the value of γ is 0.2.

3.4. Algorithm Performance Testing

This paper examines the improved performance of the EPSO algorithm through six different types of benchmark test functions. Table 1 presents the information of six benchmark functions, and the algorithm proposed in this paper is used to solve the minimum value of these functions. After combining the EPSO algorithm with particle swarm optimization (PSO) [9], it was compared to the whale optimization algorithm (WOA) [11], the chimp algorithm [12], the dung beetle algorithm (dung beetle optimization (DBO) [13], and GWO [14], and the parameters of each algorithm can be found in the corresponding literature. The experimental environment is MATLAB R2019b running on a 2.5 GHz Intel Core i7-8700 processor with 8 GB of RAM at 2400 MHz. The operating system is Windows 10. It can be purchased at Lenovo Group in Beijing, China. To ensure the fairness and validity of the experiment, all algorithms were independently run 30 times, with 500 iterations and a population size of 40. Table 2 shows the test results, with the average value and standard deviation serving as comparison indicators. The optimal solution is displayed in bold.
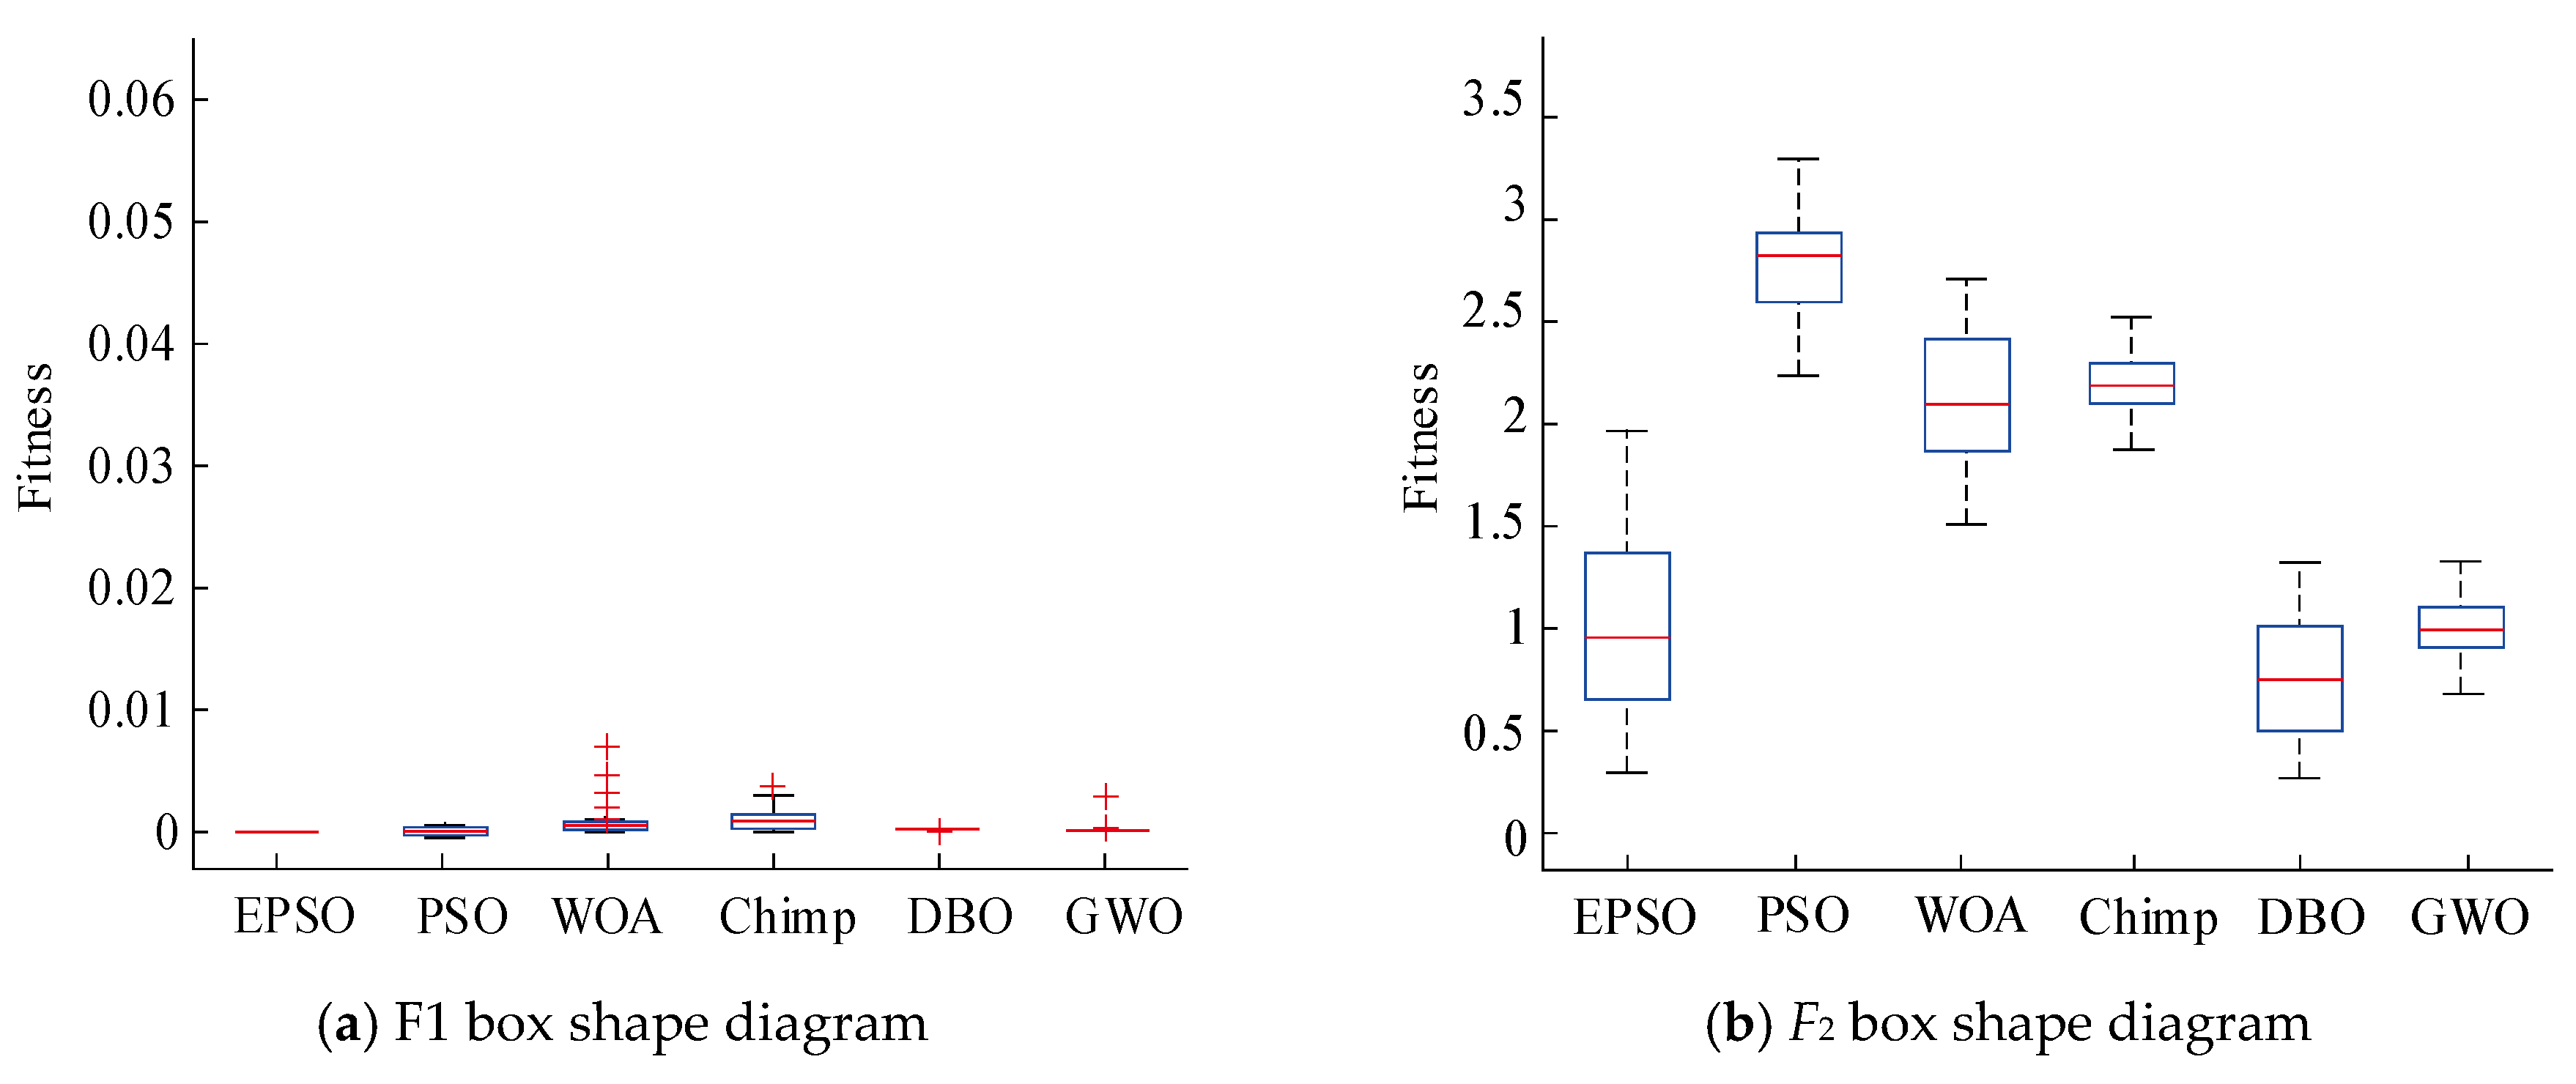
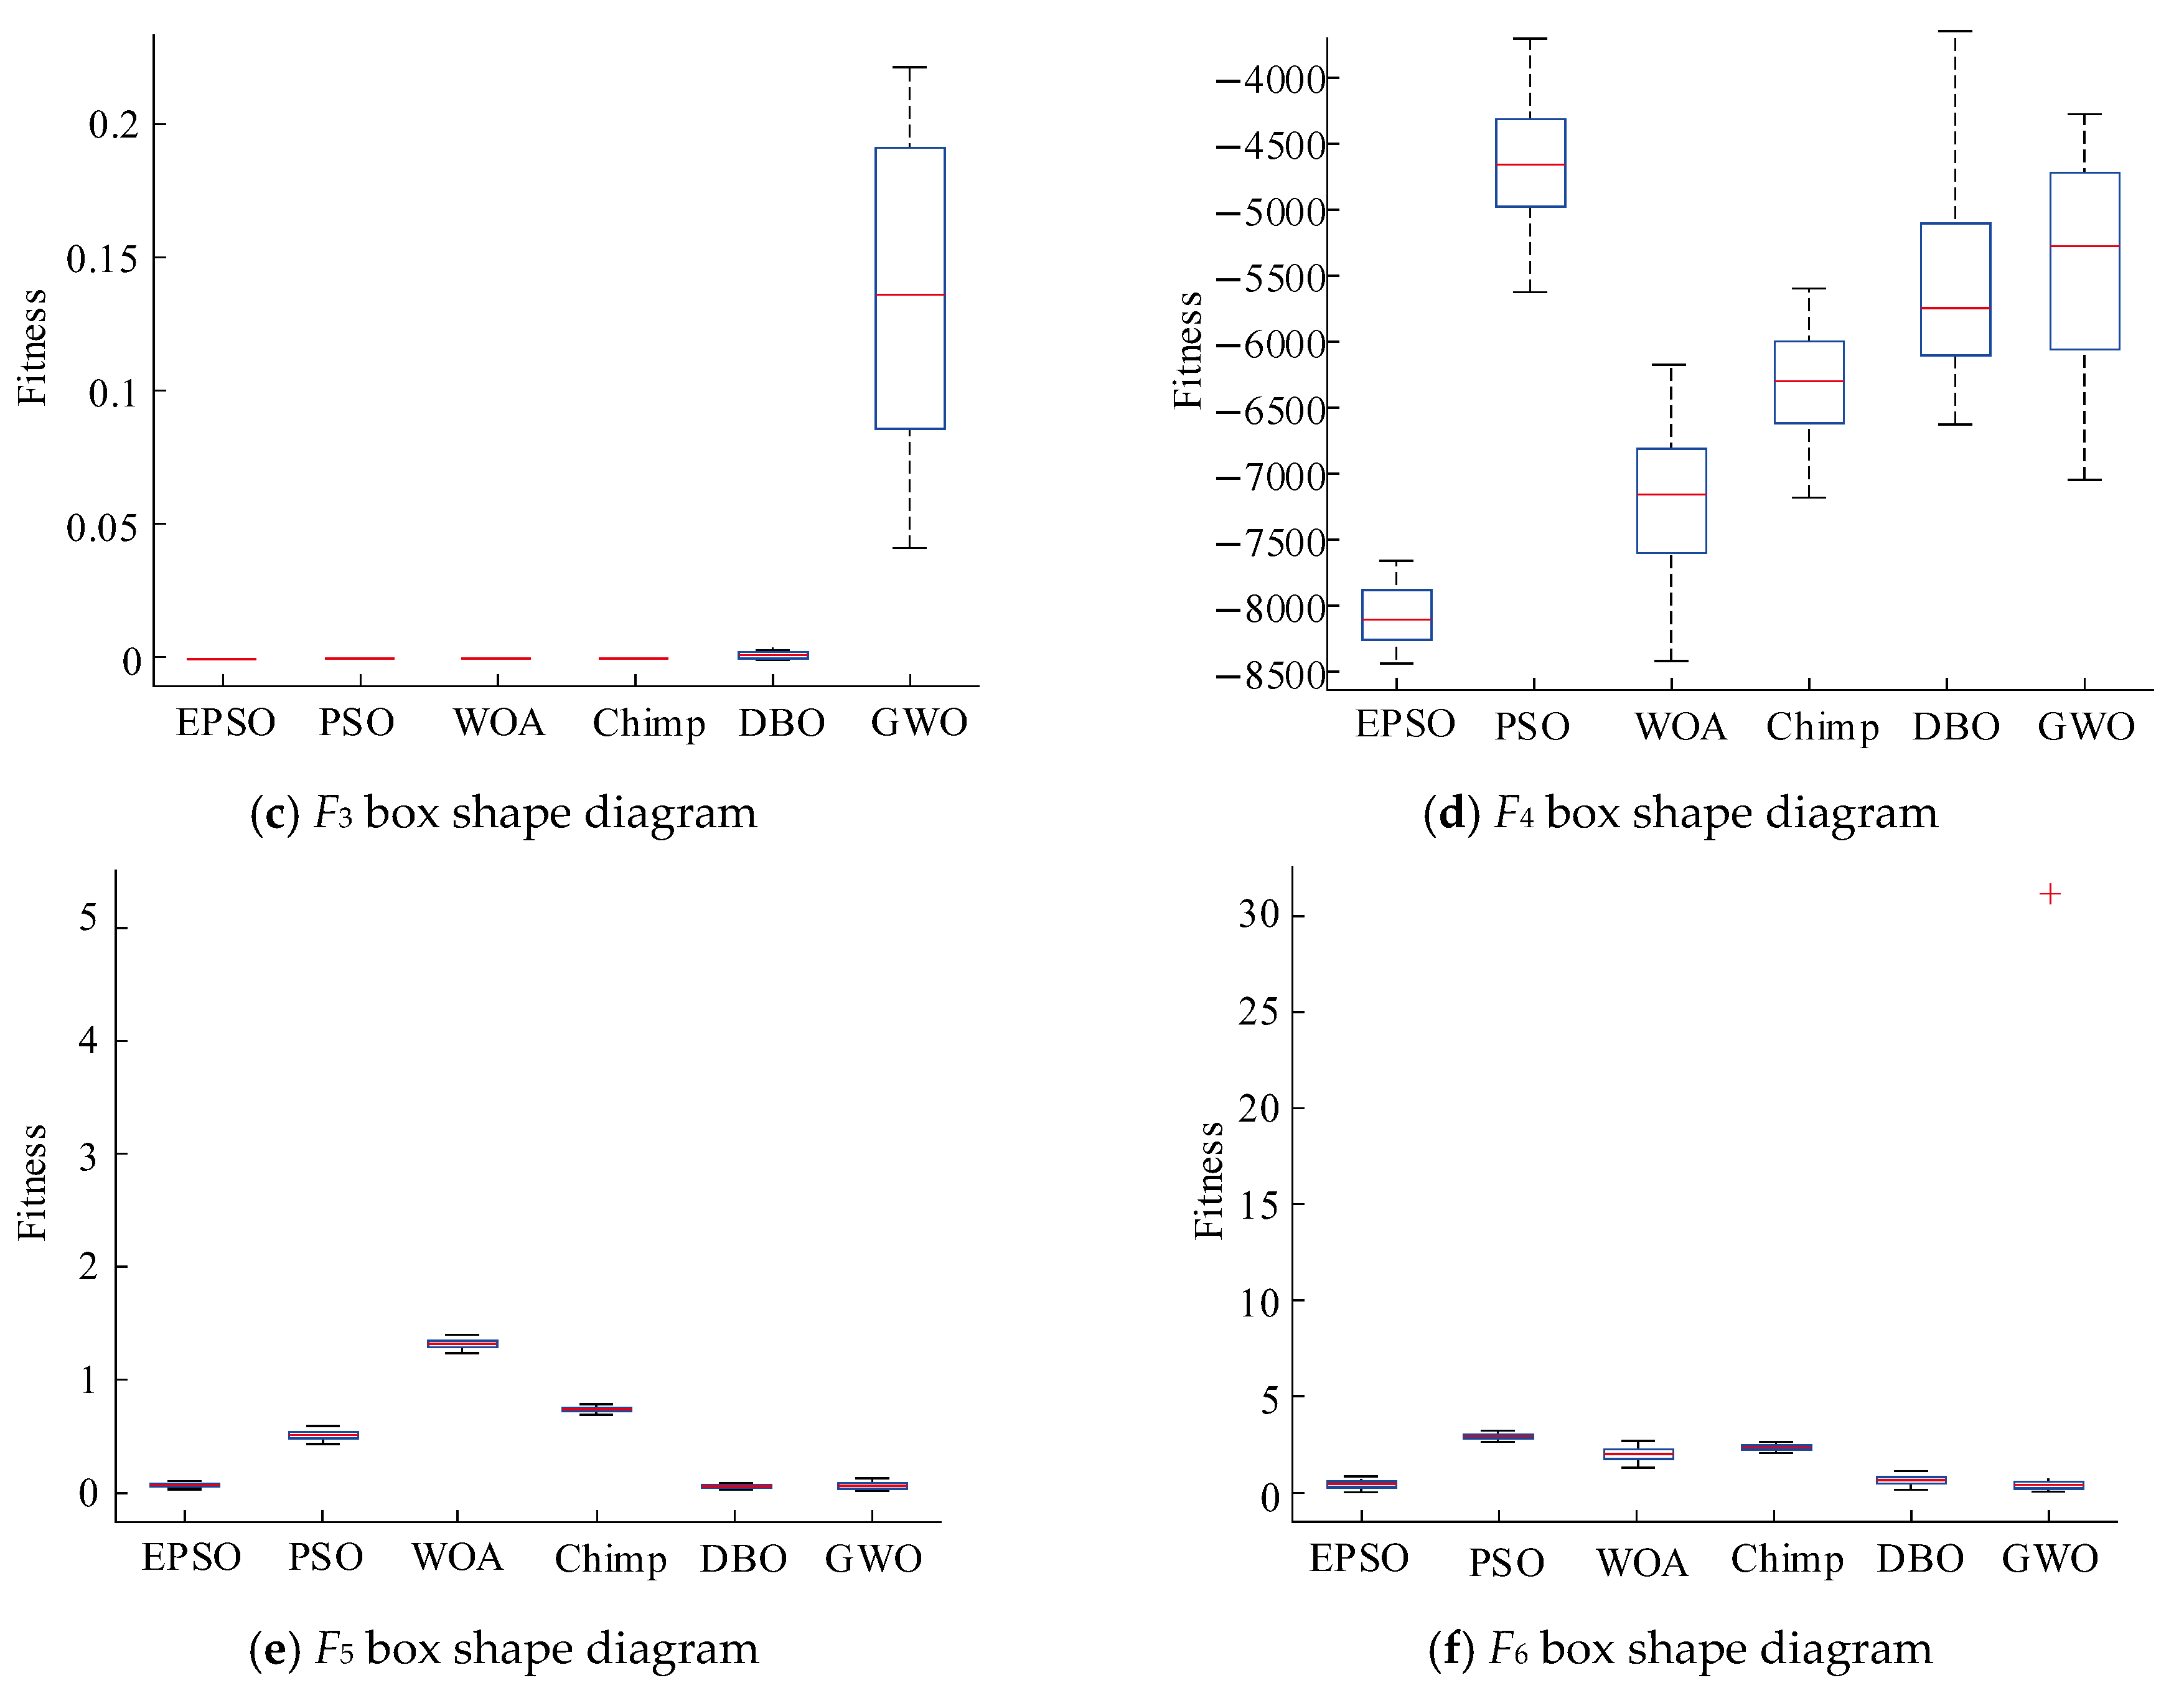
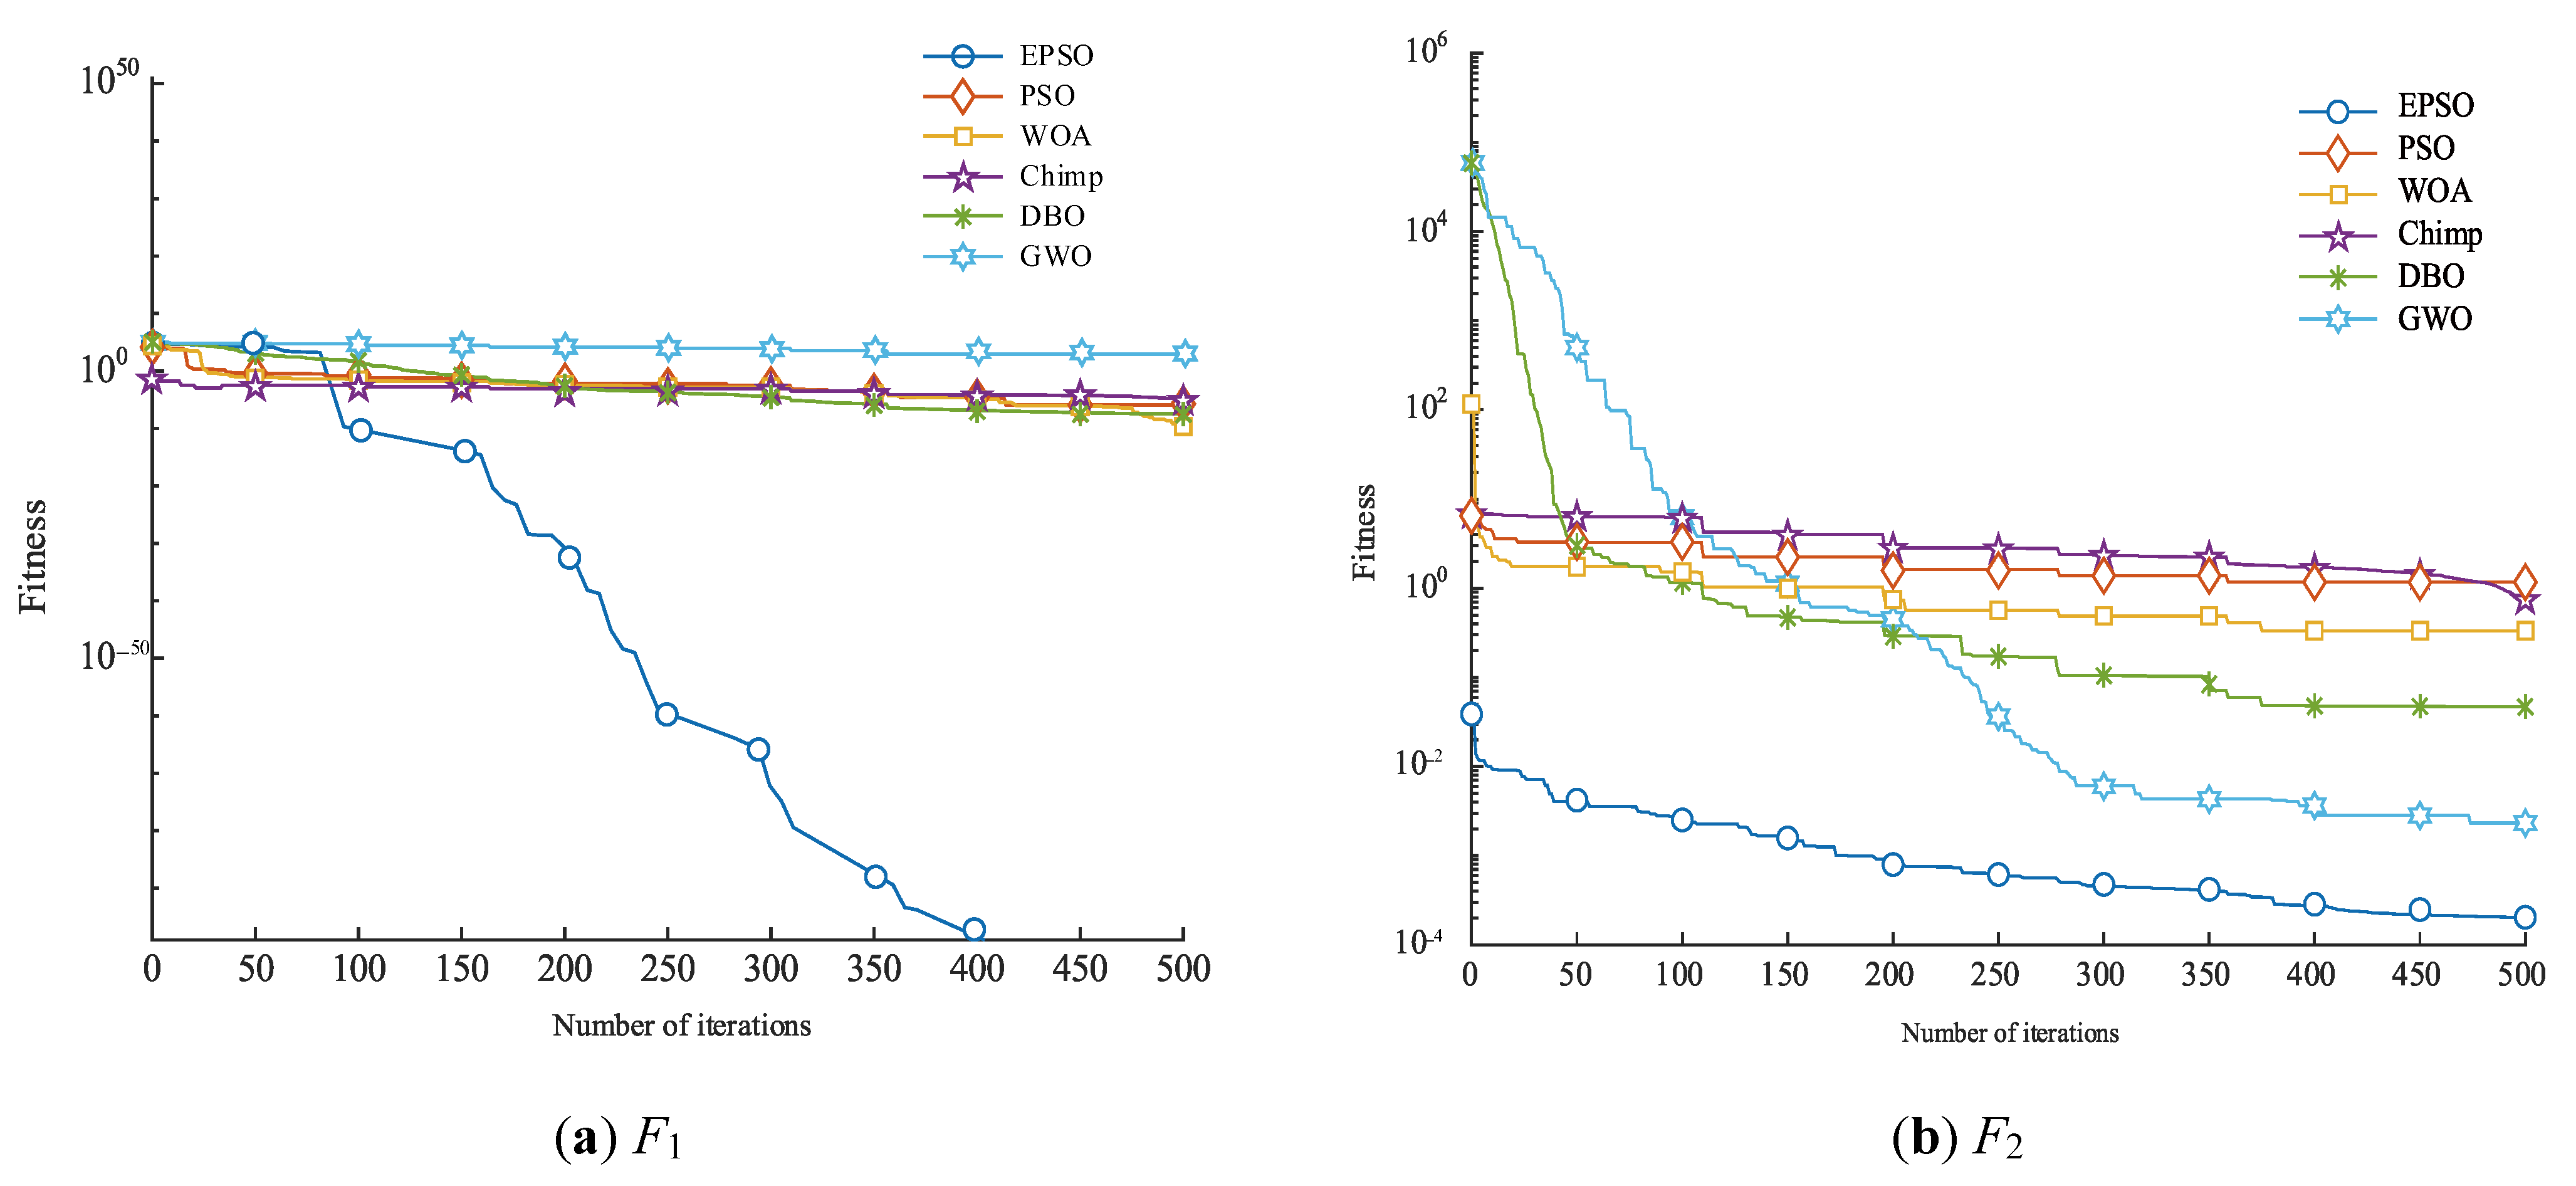
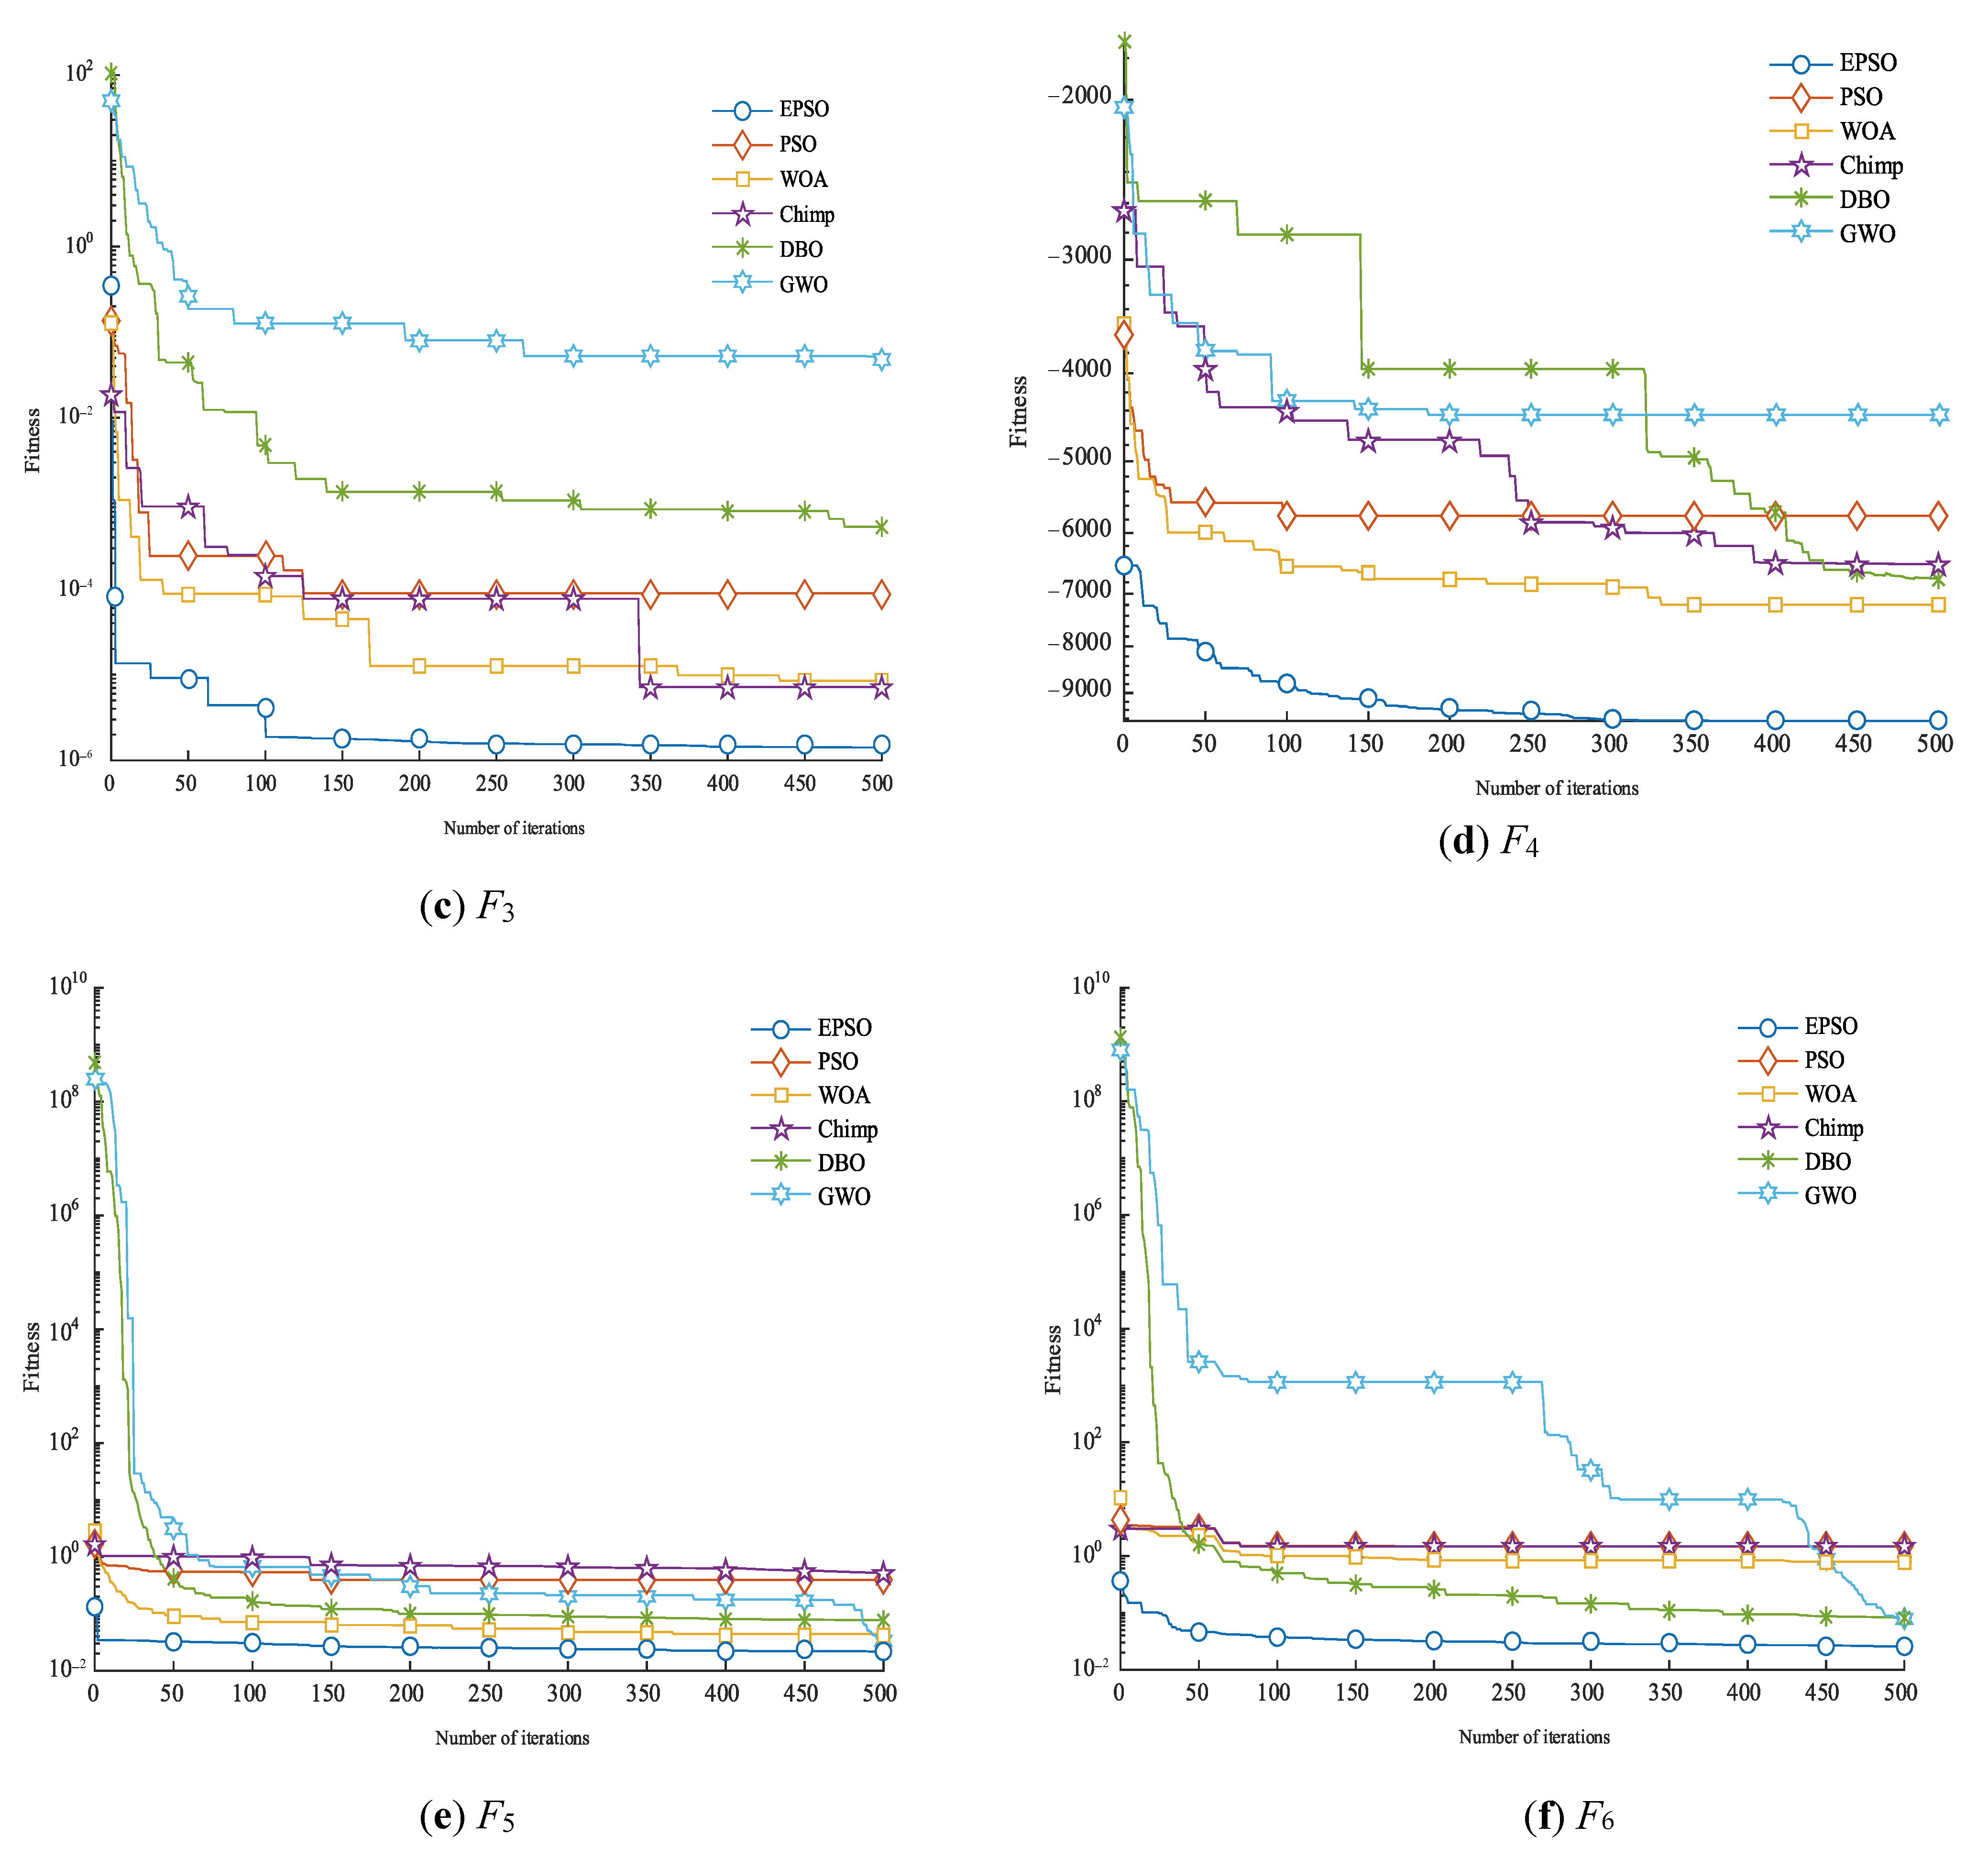
The results in Table 2 indicate that the EPSO algorithm outperforms the comparison algorithms across benchmark test functions, demonstrating the strong advantages of the improved algorithm in terms of its search capabilities. Figure 3 presents box plots from 30 independent runs of six algorithms, clearly showing that the EPSO algorithm consistently achieves the lowest results and thus further validating its superiority. The success of the EPSO algorithm can be primarily attributed to the various strategies incorporated into its design. Firstly, the EPSO algorithm employs a dynamic parameter adjustment strategy, which allows the algorithm to effectively regulate its optimization mechanism by dynamically adjusting search parameters based on the current search state at different stages. This flexibility enables the algorithm to better adapt to complex optimization problems and enhances its global search efficiency. Secondly, the new velocity update strategy effectively utilizes information from both the current individual best solution and the global best individual, which significantly improves the algorithm’s search efficiency and convergence speed, helping particles to quickly locate potential optimal solutions while avoiding local optima. Additionally, to prevent the algorithm from getting trapped in local optima, an individual mutation disturbance strategy has been introduced. This strategy increases the diversity in the search process by introducing disturbances, allowing the algorithm to escape local optima and increasing the likelihood of finding the global optimum. Figure 4 illustrates the iteration curves of the six algorithms, showing that the EPSO algorithm exhibits significant improvements in both convergence speed and accuracy. The rapid convergence speed indicates that the EPSO algorithm can find results close to the optimal solution in a shorter time, while its high accuracy ensures the quality of the solutions found. This dual advantage makes the EPSO algorithm more attractive for practical applications, especially in fields requiring quick responses and high-precision solutions. In summary, the analysis results from multiple dimensions indicate that the improvement strategies of the EPSO algorithm are feasible and effective, with its performance standing out among numerous comparison algorithms, laying a solid foundation for future research on solving the PFSP problem and promoting technological advancements and application development in related fields.

3.5. Strategy Effectiveness Analysis

The EPSO algorithm integrates dynamic parameter adjustment strategies, new velocity update strategies, and perturbation strategies for individual variations. To verify the contribution of each proposed improvement point, three variant experiments are designed, as detailed below:
EPSO1: remove the dynamic parameter adjustment strategy and adopt the fixed parameters before improvement;
EPSO2: remove the new speed update strategy and adopt the previous speed update strategy without improvement;
EPSO3: adopt the perturbation strategy for eliminating individual variation.
Each algorithm was independently run 30 times on six instances. The evaluation metrics and cut-off conditions were the same as those in Section 3.4. Table 3 shows the test results of the EPSO algorithm and its variant algorithms.The optimal value is displayed in bold.
As can be seen from Table 3, the EPSO algorithm achieved the best results on all six benchmark test functions, which preliminarily verifies the effectiveness of the improvement strategy. By comparing EPSO1 with the EPSO algorithm, it can be seen that the EPSO algorithm adopts a dynamic parameter adjustment strategy. This strategy enables the EPSO algorithm to reasonably regulate the optimization mechanism and thereby dynamically adjust parameters at different stages according to the current search status. This flexibility enables the algorithm to better adapt to complex optimization problems and improve the efficiency of its global search. By comparing EPSO2 with the EPSO algorithm, it can be seen that the new speed update strategy fully utilizes the information of the optimal solution. This information sharing mechanism not only enhances the exploration ability of the algorithm but also increases the probability of finding high-quality solutions. By comparing EPSO3 with the EPSO algorithm, it can be seen that the introduction of the perturbation strategy with individual variation increases the diversity in the search process, enabling the algorithm to escape from the local optimal solution and thus making it more likely to find the global optimal solution. From the above, it can be seen that each improvement strategy contributes to improvement in the performance of the algorithm.

3.6. EPSO Algorithm

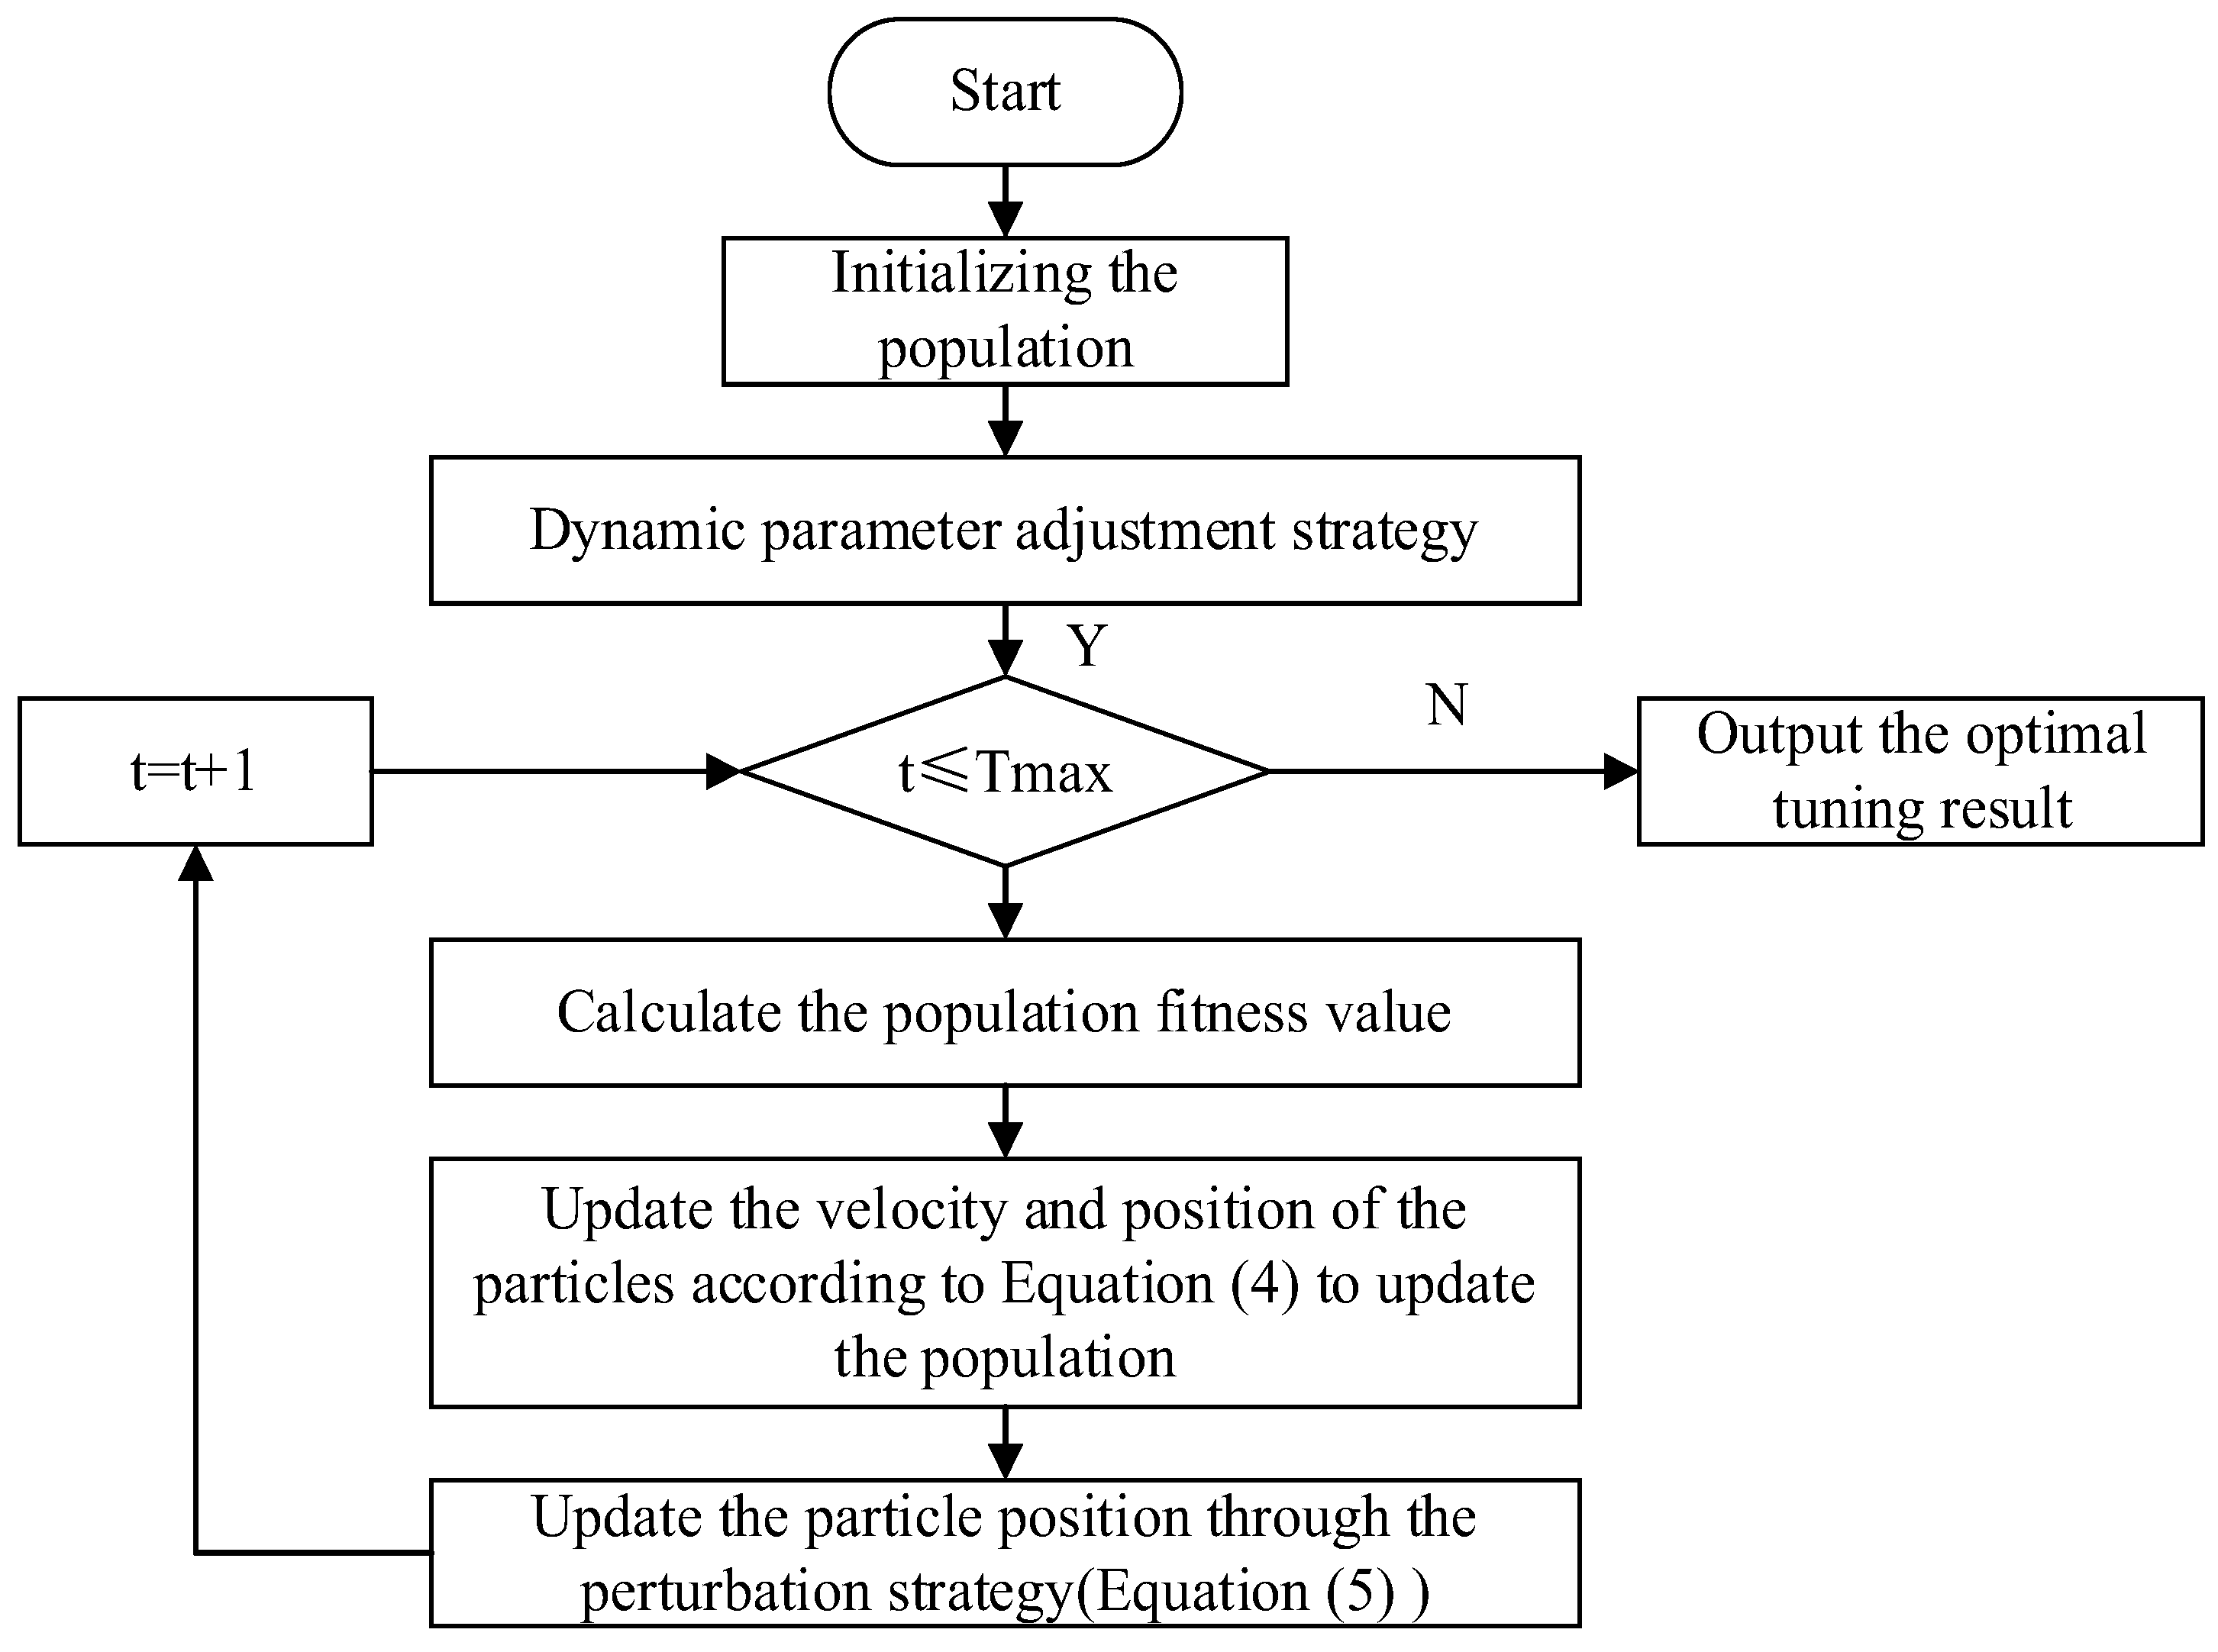
By introducing dynamic parameter adjustment strategies, new velocity update strategies, and individual perturbation strategies to improve the shortcomings of the PSO algorithm, an EPSO algorithm is proposed. Figure 5 shows the flowchart of the improved algorithm.

4. Instance Testing

4.1. PFSP Problem Description

The PFSP is n , n { O 1 , O 2 , , O n } , a typical type of production scheduling problem that involves jobs being processed in sequence on m , m { E 1 , E 2 , , E n } machines in the same order. Given the processing time of n workpieces on m machines, the objective is to find the optimal processing sequence and determine the order of the workpieces so that the scheduling objective for the solution is optimal. Equations (6)–(11) are the mathematical models of the PFSP.
C ( σ ( 1 ) , 1 ) = P σ ( 1 ) , 1
C ( σ ( l ) , 1 ) = C ( σ ( l 1 ) , 1 ) + P σ ( l ) , 1 ,   l = 1 , 2 , , n
C ( σ ( 1 ) , y ) = C ( σ ( 1 ) , y 1 ) + P σ ( 1 ) , 1 ,   y = 2 , 3 , , m
C ( σ ( l ) , y ) = max { C ( σ ( l 1 ) , y ) , C ( σ ( l ) , y 1 ) } + P σ ( l ) , y , l = 2 , 3 , , n ,   y = 2 , 3 , , m
C max ( σ ) = C ( σ ( n ) , m )
C max * = min σ C max ( σ * )
where P l , y represents the processing time of job O l on machine E y and σ represents the processing sequence { σ ( 1 ) , σ ( 2 ) , , σ ( n ) } of the job, where σ ( l ) represents the i-th job to be processed. C ( σ ( l ) , y ) represents the completion time of job σ ( l ) on machine E y . Σ represents the set of all processing sequences.

4.2. The EPSO Algorithm for Solving the PFSP

4.2.1. Encoding and Population Initialization

For solving continuous problems, the EPSO algorithm outperforms the comparison algorithms with its efficient performance. To further enhance the performance of the EPSO algorithm and apply it to the PFSP, an improved NEH algorithm is introduced in the initial stage based on the EPSO algorithm, and other individuals are randomly generated and combined.
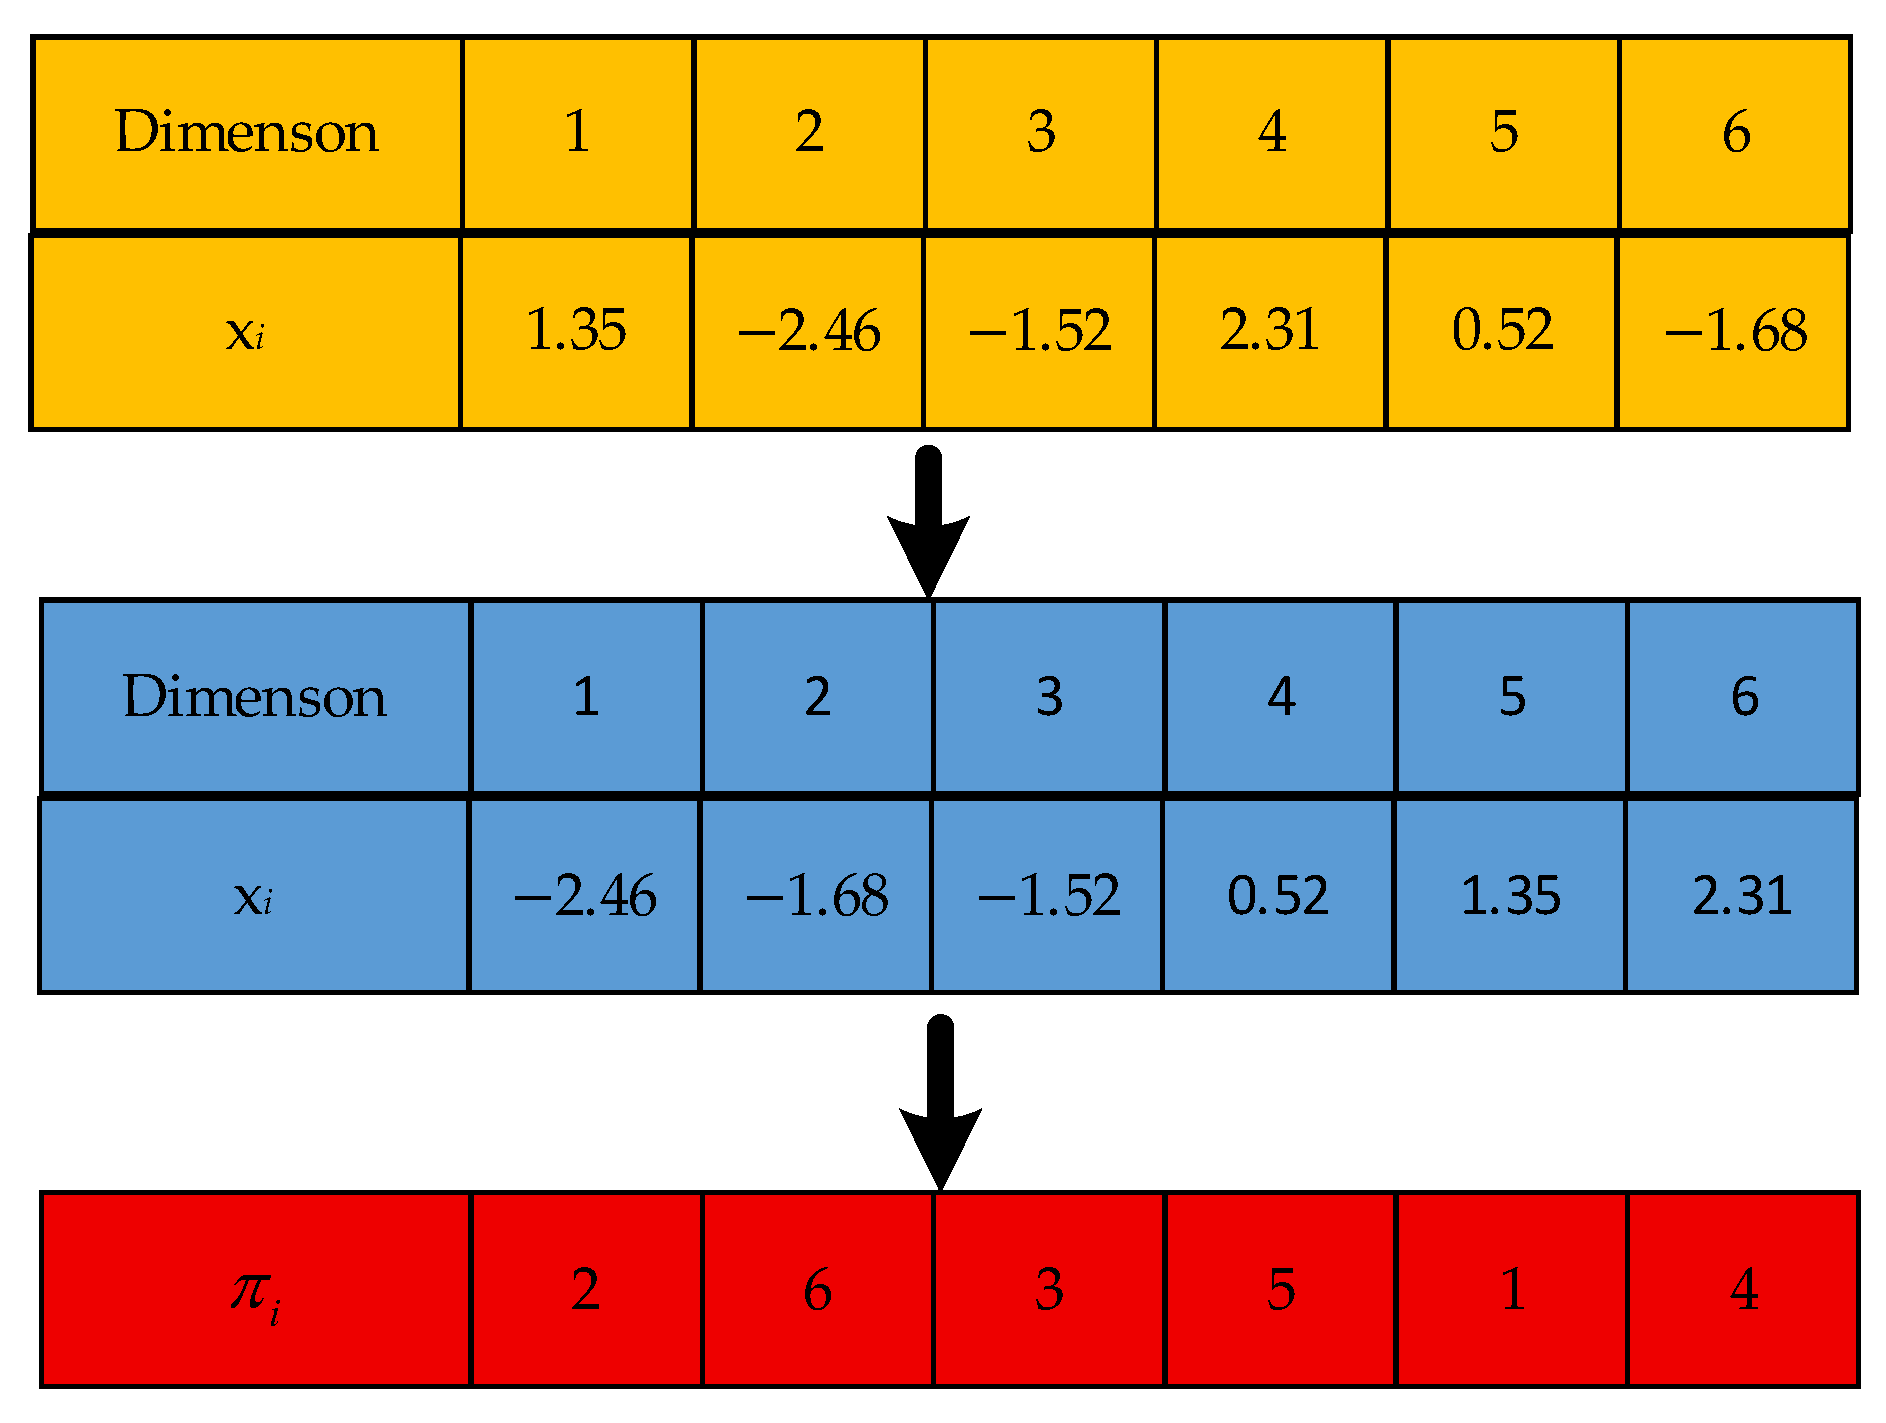
The continuous values are converted into job sequences by using the discrete coding method of the shortest processing time sorting. The shortest processing time sorting sets the minimum value in the updated solution to the first position of the job arrangement, the second minimum value to the second position, and so on. Figure 6 shows a schematic diagram of the encoding conversion of the EPSO algorithm from continuous to discrete.
The NEH method is effective in scheduling problems. This section introduces and improves the NEH method to generate 10% of the initial solutions, which can enhance the quality of the solutions. Other solutions are generated through chaotic mapping. The specific operation steps are as follows:
Step1: calculate the sum of the average, skewness, and standard deviation of the completion time of each job on all machines;
Step2: for the assignment l = 1, 2, … n, arrange the jobs in descending order according to the results calculated in Step1;
Step3: re-enter the first and second jobs in the sequence, then calculate and select the sequence with the shortest completion time;
Step4: insert the third job in the best sequence of Step3 and repeat Step3;
Step5: insert the next task into the shortest completion time series obtained in Step4 and record all the arrangement schemes;
Step6: calculate and select the sequence with the shortest completion time as the initial solution.
To allow for a clearer understanding of the above process, a simple example is provided in Figure 7. According to step 1, the job sequence [2,3,4,1] is obtained. By taking out the first two jobs and shuffling them, two sequences [2,3] and [3,2] can be obtained. The one with the shortest completion time is selected as the current scheduling sequence, and the third job is inserted into all possible positions of [3,2]. We can obtain [4,3,2], [3,4,2], and [3,2,4]. Similarly, calculate the completion times of the three sequences and select the one with the shortest completion time as the current scheduling sequence. Insert the fourth assignment into it. And so on. Finally, select the sequence with the shortest completion time.

4.2.2. Variable Neighborhood Search Strategy

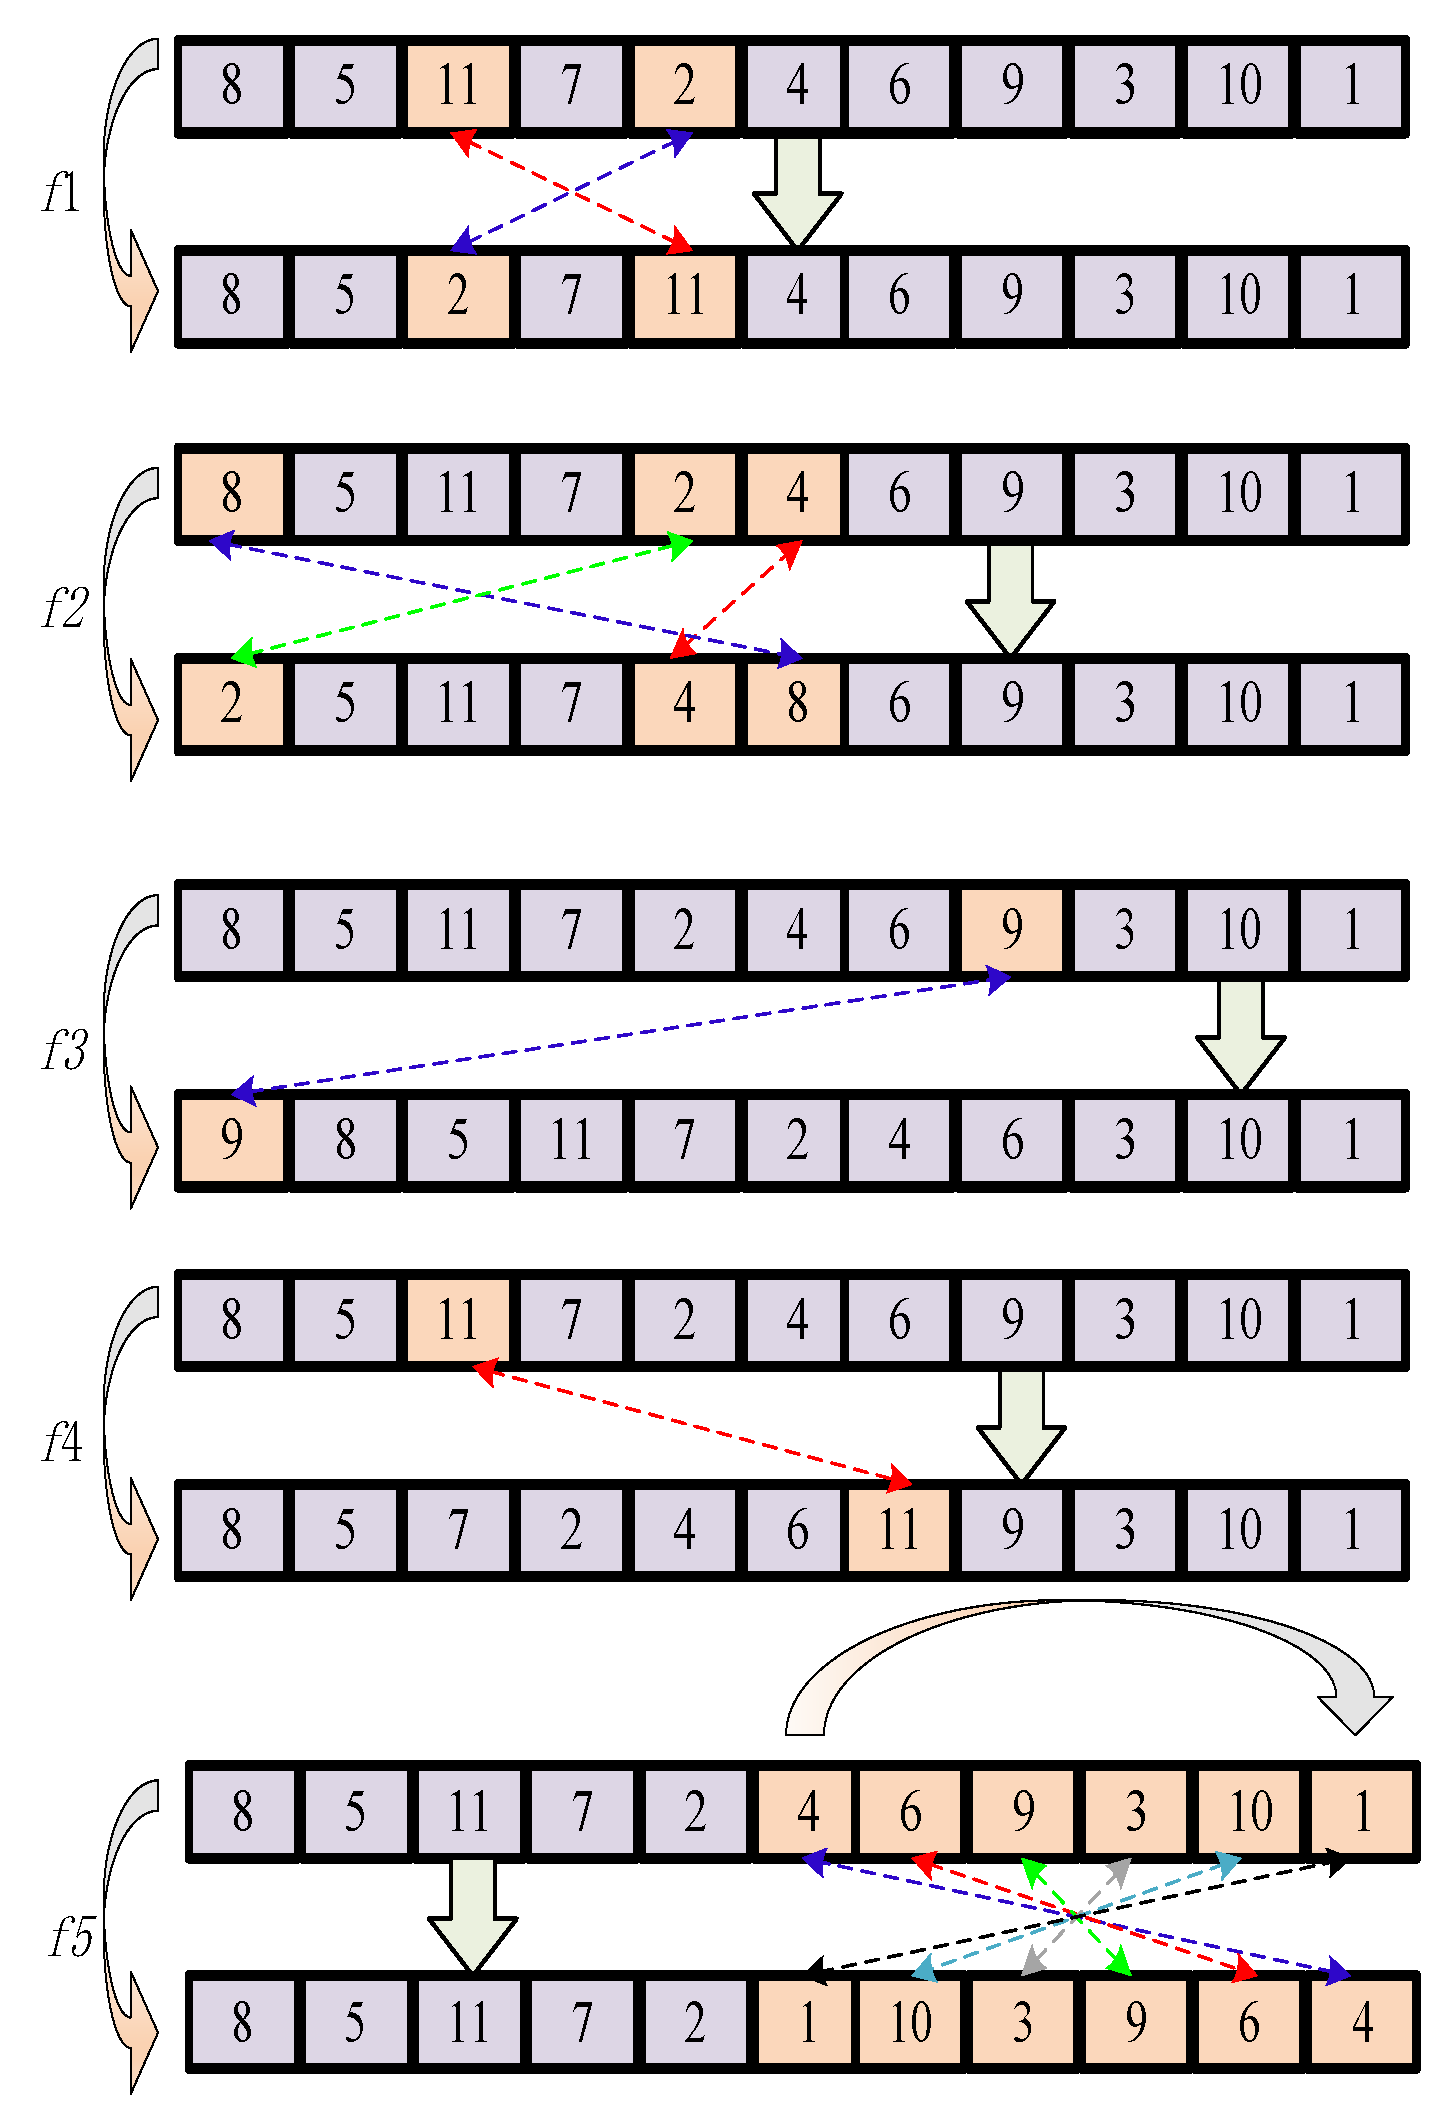
To improve the quality of the optimal solution in the current population, a hybrid variable neighborhood search strategy [15] is adopted to further search for the optimal solution. The hybrid variable neighborhood search strategy integrates five neighborhood search strategies, each of which is a search operator, as shown in Figure 8.
(1) Two-point swap (f1): Randomly select two different encoding positions for swapping;
(2) Three-point swap (f2): Randomly select three different encoding positions for swapping;
(3) Pre-insertion (f3): Select a position and then randomly insert it into any position before that position. If this element is the first process, reselect or maintain the current optimal solution;
(4) Backward insertion (f4): Select a position and then randomly insert it into any position following that position. If this element is the last process, reselect or maintain the current optimal solution;
(5) Reverse (f5): Randomly select two different positions to form a sequence fragment. Perform a reverse operation on this sequence fragment. If the number of positions in the fragment is less than 2, reselect or maintain the current optimal solution.
Each neighborhood search has an equal probability of being selected. After randomly choosing a strategy, if the new solution generated is better than the global optimum, its probability of being selected will increase. In the next optimization search, it will have a higher probability of being selected. The specific operation is as follows: For each neighborhood fk, a selection probability is proposed, and its calculation process mainly relies on the search results of the neighborhood fk. For a given initial solution, if the initial solution is modified after the search through the neighborhood fk, it is said that the execution of the neighborhood fk has been successful; otherwise, it is called a failure. When the algorithm is initially initialized, the selection probabilities of all neighborhoods are defined to be the same, all equal to 1/K. In each iteration, record the number of successes and failures in each neighborhood, which are denoted as sak and fak. The switching of neighborhoods is based on the selection probability, that is, the type of the next neighborhood search is generated according to the selection probability. The selection probability of each neighborhood is calculated according to the following formula:
S u = s a k s a k + f a k + 0.05 ,   k = 1 , 2 , K
S P u = S u k = 1 K S k
where Su = sak/(sak + fak) + 0.05, k = 1, 2, … K is called the success rate of neighborhood fk. The addition of 0.05 at the end is to prevent the situation where the selection probability of certain neighborhood types is 0. According to Equation (13), it is obvious that the selection probability of the neighborhood type that can bring about improvement will increase accordingly. After determining the selection probabilities of each neighborhood type, the roulette wheel method is used to randomly select the type of neighborhood search.

4.2.3. Complexity Analysis

This section analyzes the time complexity of the EPSO algorithm. Firstly, the time complexity of the initial population when using NEH and random strategies is O ( n 2 × log n ) . The time complexity of the particle evolution stage is O ( N × n × m ) , and it is O ( n 2 ) when performing variable neighborhood search. In conclusion, the total time complexity of the EPSO algorithm is O ( T max × ( N × n × m + n 2 ) ) . N represents the population size, Tmax represents the maximum number of iterations, n represents the number of jobs, and m represents the number of machines.

4.3. Analysis of Experimental Results

To test the performance of the EPSO algorithm in solving the PFSP, simulation experiments were conducted on test set Reeves [16] and test set Taillard [17]. The comparison algorithms are the VABC [2], HCVBWO [3], ANN-GA [4], HGASA [5], and GWO algorithms [14]. To ensure the fairness and validity of the experiment, all algorithms were independently run 30 times, with 500 iterations and a population size of 40. The best relative error (BRE) and the average relative error (ARE) are two indicators for evaluating the performance of an algorithm, as shown in Equations (14) and (15), and Table 4 presents the experimental results.The optimal value is displayed in bold.
B R E = C min C * C * × 100 %
A R E = C ¯ C * C * × 100 %
where C min and C ¯ represent the optimal value and average value obtained by running each algorithm 30 times, respectively, and C * represents the currently known optimal solution.
Through the solutions obtained for 21 Rec cases, the EPSO algorithm demonstrated excellent performance in cases with a smaller number of workpieces. Although its performance slightly declined when dealing with large-scale problems, the results are still within an acceptable range. In terms of average deviation, 15 examples performed better than the other algorithms. Therefore, on the whole, the EPSO algorithm still leads in performance compared to the other algorithms. Overall, the optimal relative deviation and average deviation of the EPSO algorithm are 0.453 and 1.093, respectively, both of which are superior to the other five algorithms.
For the Taillard benchmark test, for which the ARE was used as the evaluation index, the results shown in Table 5.The optimal value is displayed in bold.
Table 5 shows the ARE values of 120 test examples. It can be seen from Table 5 that, among the 12 examples of different scales, the EPSO algorithm achieves the optimal value in 7 scales. Moreover, the EPSO algorithm has obvious advantages in large-scale instances, such as those with scales of 100 × 20 and 500 × 20. It is worth mentioning that the effects of the ANN-GA and HGASA algorithms are also good, second only to EPSO.
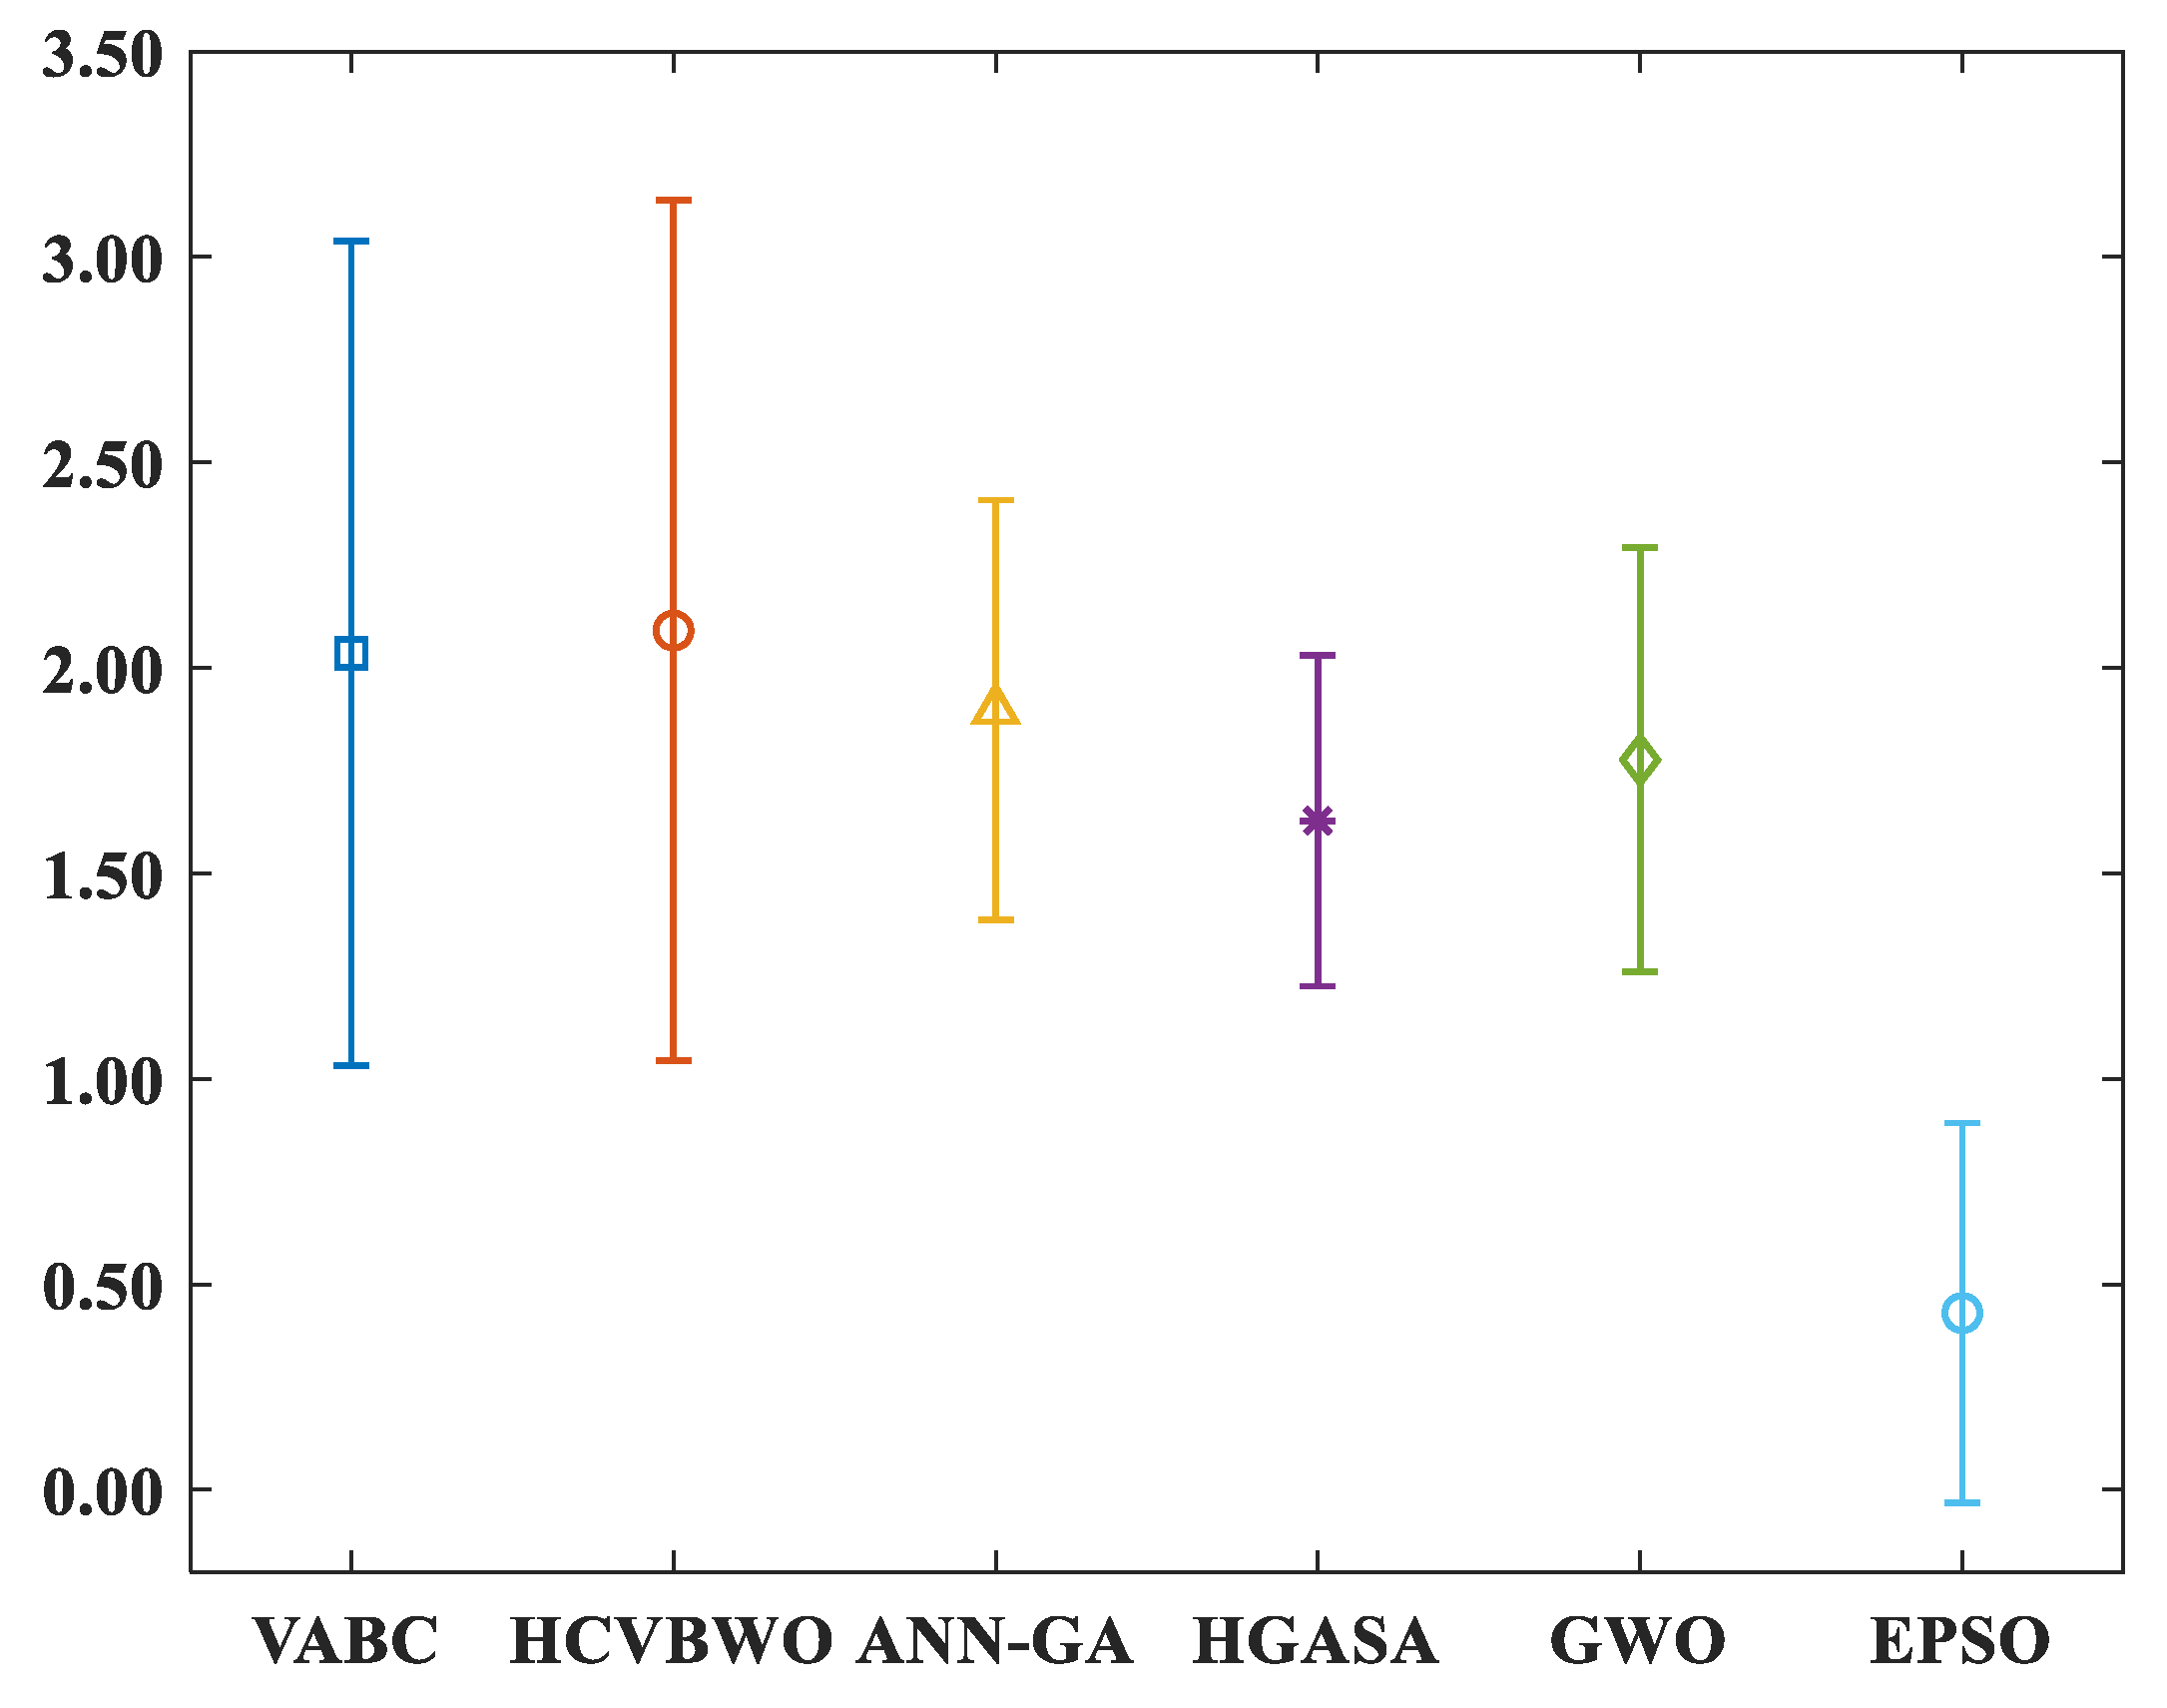
To more intuitively prove the above conclusion, Figure 9 shows a confidence interval graph with a confidence level of 95%. According to the interval results of the EPSO algorithm and the comparison algorithms in Figure 9, it can be seen that the interval graph of the EPSO algorithm is lower than that of algorithms such as the ANN-GA algorithm and HGASA algorithm and does not overlap with the comparison algorithms. This indicates the effectiveness of the improved strategy of the EPSO algorithm.
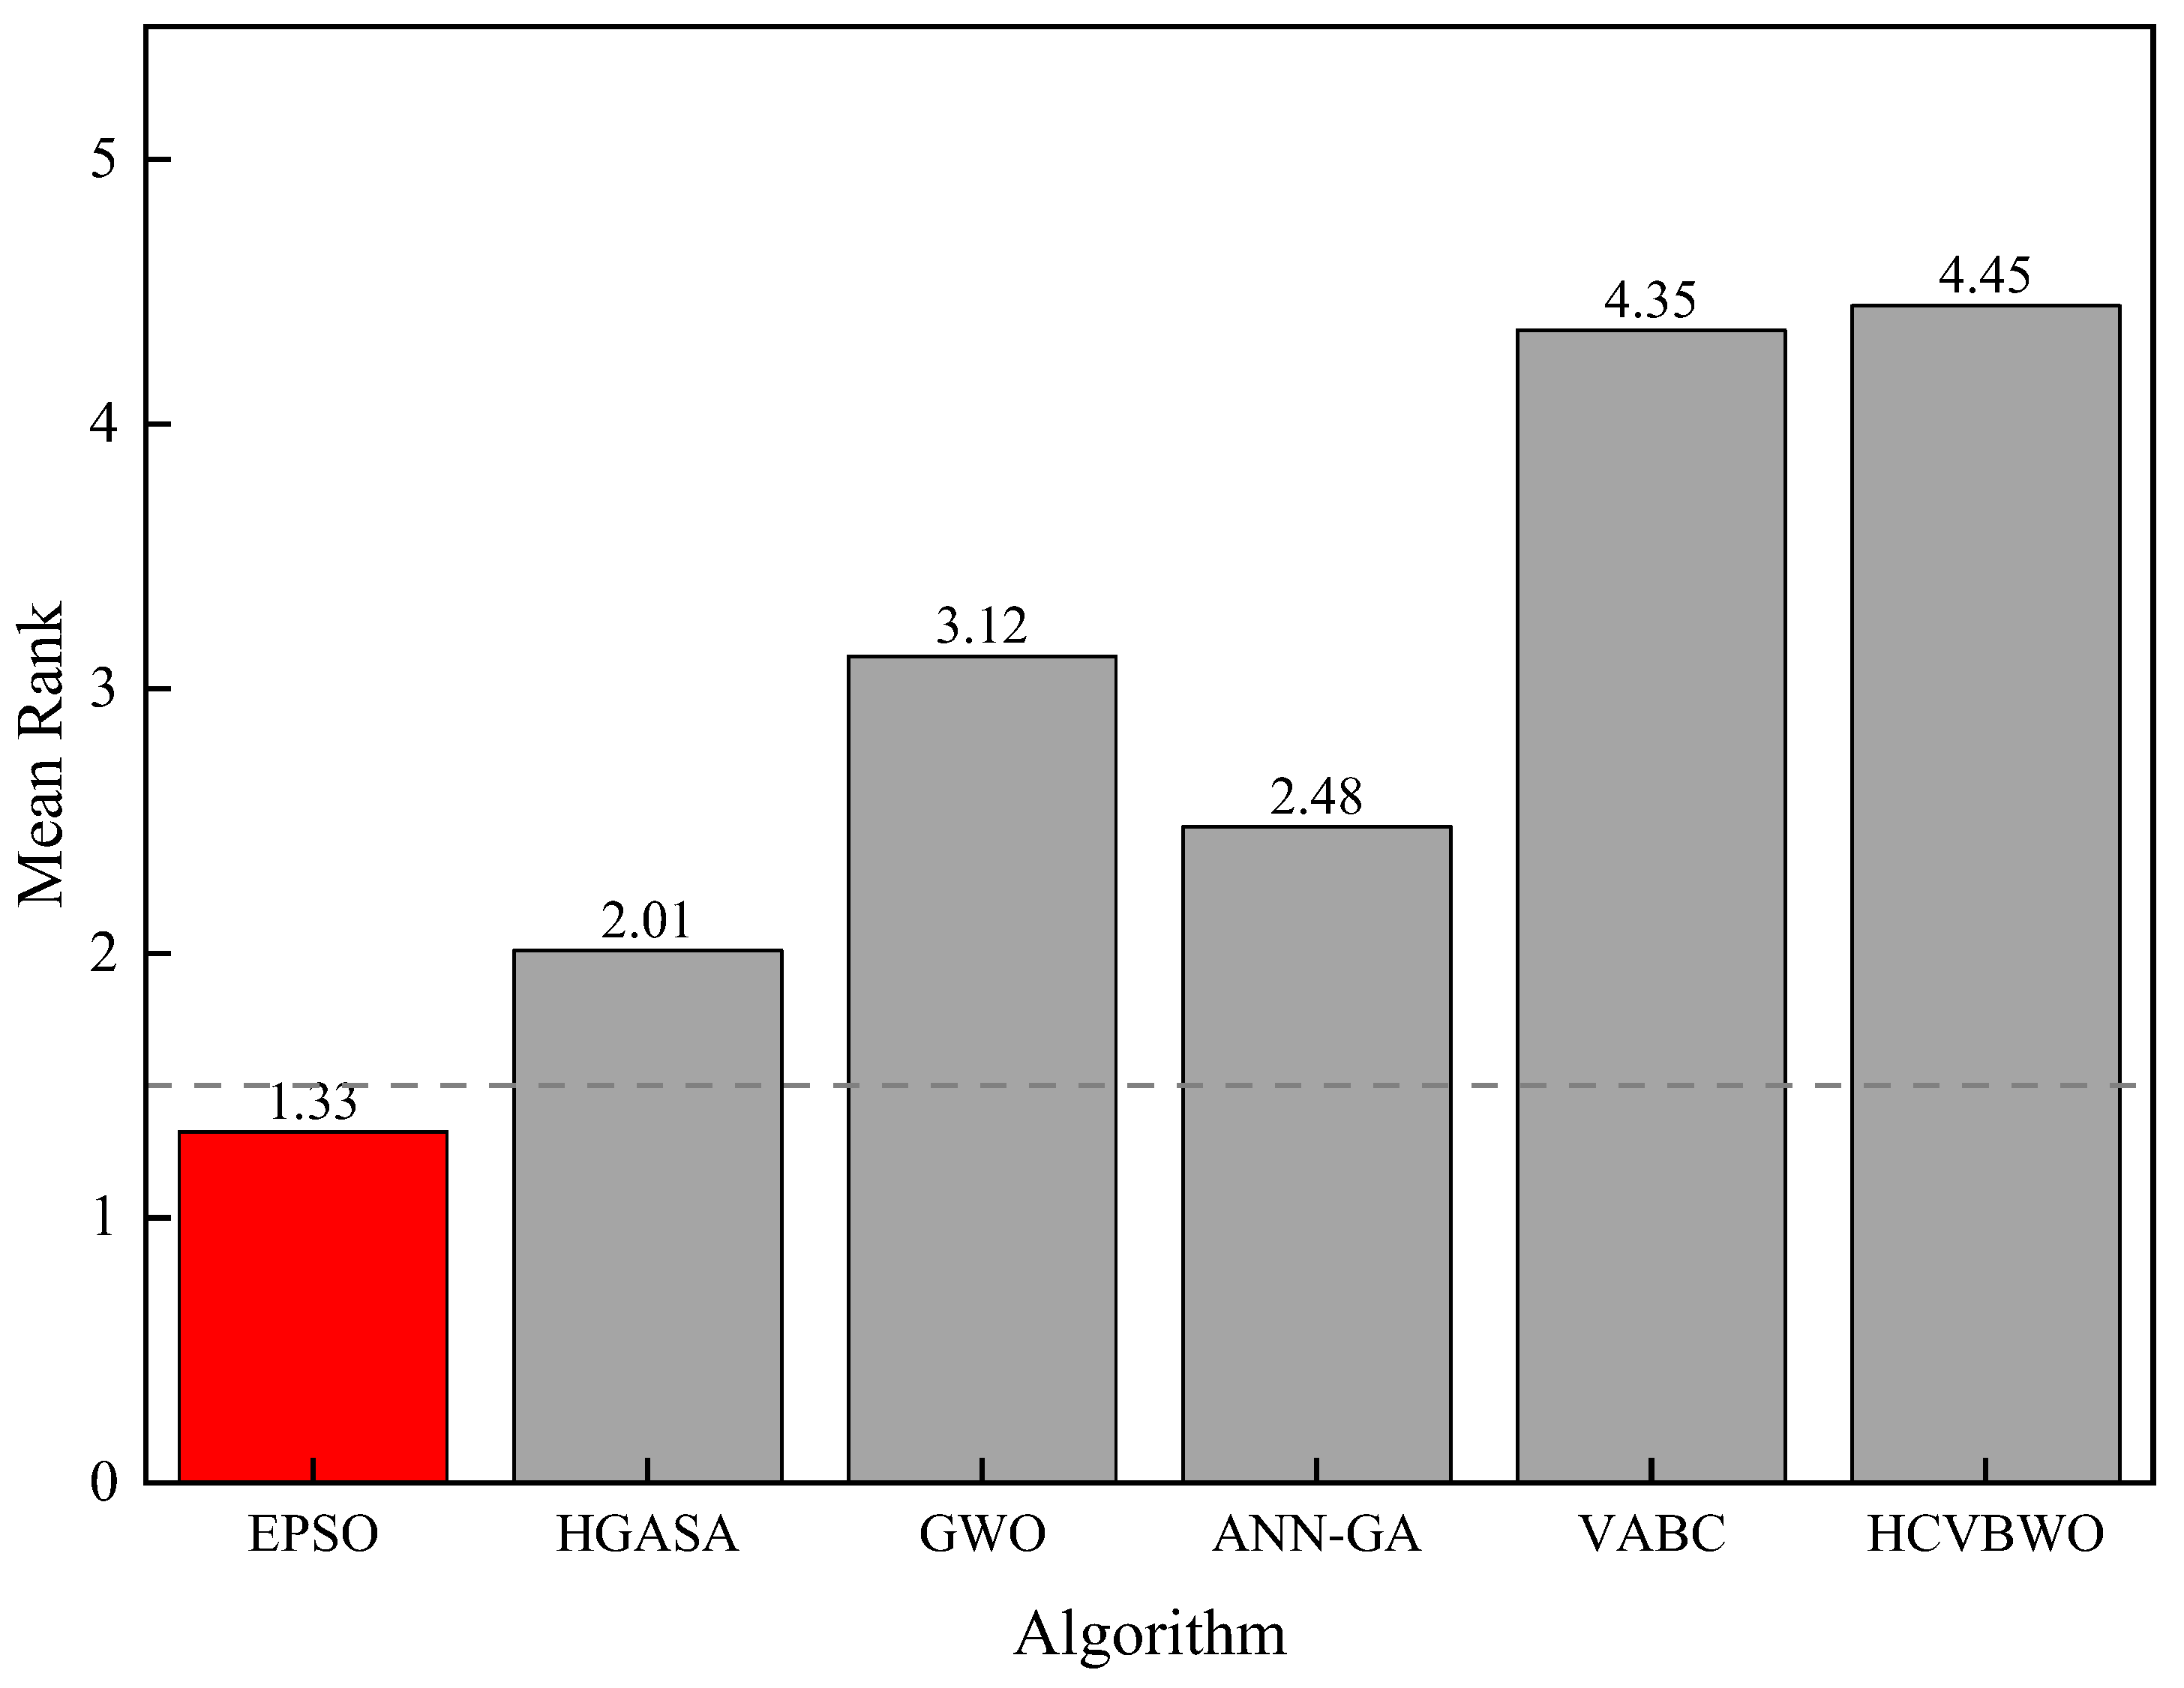
The Friedman [18] test was used to further test the results of each comparison algorithm. The results obtained by all algorithms through the Friedman test are shown in Table 6. According to the statistical test results in Table 6, the EPSO algorithm outperforms the other algorithms. Its average ranking is the smallest (1.326), and the performance of the HGASA (2.011) is similar to that of the ANN-GA (2.478), followed by GWO (3.122) and the VABC algorithm (4.354). The average ranking value of the HCVBWO algorithm was the worst (4.447). Obviously, the EPSO algorithm has outstanding competitiveness in addressing the PFSP. In addition, the Bonferroni–Dunn method [19] was also adopted as a post hoc test. The experimental results of the Bonferroni–Dunn method are shown in Figure 10. According to Figure 10, as a control algorithm, the EPSO algorithm is significantly different from the other six comparison algorithms. The above analysis indicates that the EPSO algorithm has achieved a more satisfactory solution. Therefore, the EPSO algorithm has an advantage in competition with the other six comparison algorithms.
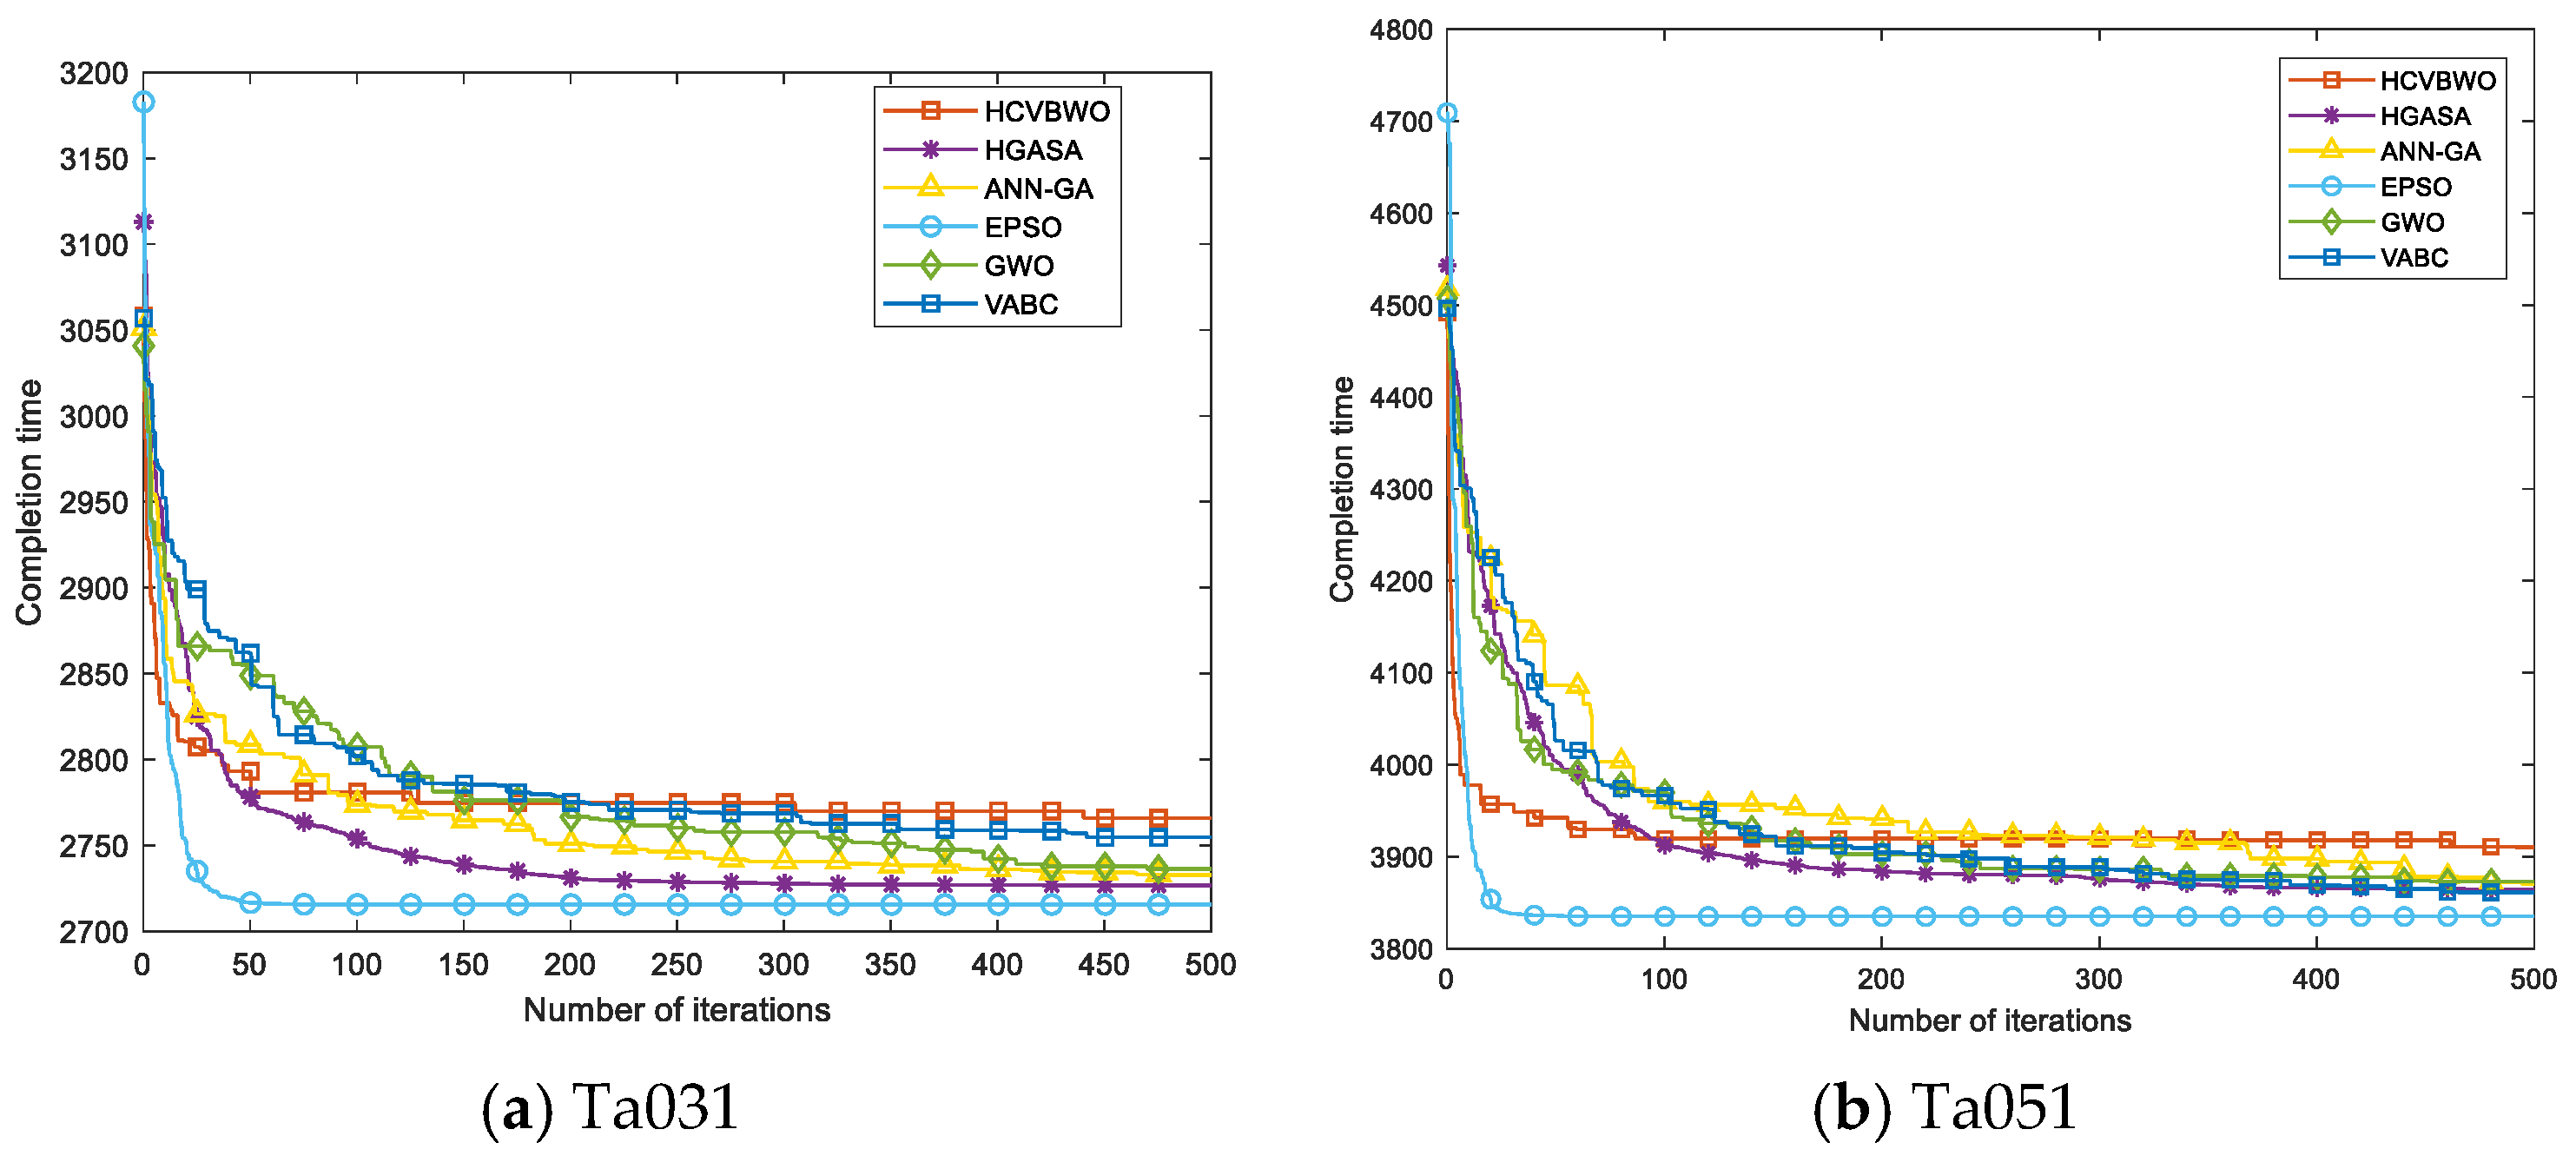
As shown in Figure 11, the convergence curves of the EPSO algorithm and the comparison algorithms in examples Ta031 and Ta051 are presented. Figure 11a shows the convergence curve of example Ta031. It can be seen from this curve that the gap between the EPSO algorithm and the initial solutions of the HGASA, ANN-GA, and GWO algorithm is not significant, while the initial solutions of the VBAC algorithm and HCVBWO algorithm take a longer time. However, the downward trend of the EPSO algorithm is the most obvious, which indicates that the EPSO algorithm has a greater advantage. The results in Figure 11b are similar to those in Figure 11a, and the same results are obtained. Therefore, it can be seen that the EPSO algorithm is also the best in terms of convergence.

4.4. Engineering Examples

This section takes the processing of the input shaft of the harmonic reducer for robot joints in a certain enterprise as an engineering case for analysis, and applies the proposed algorithm to the production scheduling of this actual case. In the production process of the input shaft of the robot joint harmonic reducer, the main task is to customize different products according to different specification requirements. This process flow includes 10 procedures, each of which is completed in sequence by 10 specialized devices. The models of connecting rod components are diverse, and the processing cycles vary greatly. Therefore, the manufacturing process of the input shaft includes the cutting of bar stock, rough turning of the outer circle and end face, quenching and tempering heat treatment, semi-precision turning of the bearing installation position, keyway milling, high-frequency quenching, fine grinding of the outer circle, ultra-precision grinding, magnetic particle flaw detection, anti-rust packaging, etc. Combining the production process of connecting rods, the processing conditions of 20 different types of input shaft components were extracted. The processing time parameters of the 20 input shaft components are shown in Table 7. Similarly, with the goal of minimizing the maximum processing time, the proposed EPSO algorithm is adopted to obtain the solution.
The enterprise’s job scheduling plan follows the principle of first come, first served. Machine allocation prioritizes the selection of machines with the shortest processing time for product processing. Figure 12 shows the workshop scheduling plan of the enterprise. As shown in Figure 12, the completion time of the workshop is 3889 min. The EPSO algorithm was adopted to solve this engineering case, and the optimized scheduling scheme was obtained as shown in Figure 13. According to the scheduling scheme for [8,17,9,11,3,15,4,13,5,16,1,18,20,6,7,19,12,10,14,2], the total completion time for the order is 3542 min. Compared with the original scheduling plan of the enterprise, the completion time was shortened by 347 min, which improved the production efficiency of the enterprise and verified the feasibility of the EPSO algorithm.

5. Conclusions

This paper proposes an EPSO algorithm to solve the PFSP problem. To enhance the diversity of the algorithm, a novel dynamic inertia weight method and an adaptive acceleration coefficient are introduced to dynamically adjust the search range of particles. Secondly, a new speed update strategy is proposed. This strategy makes full use of the information of high-quality solutions to further improve the convergence speed of the algorithm. Then, a perturbation strategy based on individual variation is designed to improve the universality of global search. Finally, the effectiveness of the EPSO algorithm is verified through the benchmark test set and the PFSP case.
After verification, it was determined that the EPSO algorithm is highly suitable for solving the PFSP problem. However, for some other scheduling scenarios, such as vehicle scheduling and energy optimization scheduling, it may not be applicable. The reason for this lies in the fact that the optimization strategies are all tailored to the specific characteristics of the problem. However, the design concept and strategy of this algorithm provide valuable references for solving the challenges of other scheduling problems.
In the future, the algorithm can be applied to other practical industrial scenarios, such as dynamic scheduling, carbon emission optimization, and energy scheduling, to further verify and enhance its practical application value.

Author Contributions

Conceptualization, T.M. and C.Z.; methodology, T.M.; software, T.M.; validation, C.Z.; formal analysis, C.Z.; writing—review and editing, C.Z.; visualization, C.Z.; supervision, T.M. All authors have read and agreed to the published version of the manuscript.

Funding

This research received no external funding.

Data Availability Statement

The original contributions presented in this study are included in the article. Further inquiries can be directed to the corresponding author(s).

Conflicts of Interest

The authors declare no conflicts of interest.

References

  1. Xiong, F.; Chen, S.; Xiong, N.; Jing, L. Scheduling distributed heterogeneous non-permutation flowshop to minimize the total weighted tardiness. Expert Syst. Appl. 2025, 272, 126713. [Google Scholar] [CrossRef]
  2. Qi, X.; Wang, H. Solving Permutation Flowshop Scheduling Problem with Cross-Selection Based Variable Neighborhood Particle Swarm Algorithm. Manuf. Technol. Mach. Tool 2023, 5, 179–187. [Google Scholar] [CrossRef]
  3. Qi, X.; Zhao, P.; Song, Y.; Wang, R. Hybrid Whale Optimization Algorithm for Solving Engineering Optimization Problems. Manuf. Technol. Mach. Tool 2024, 11, 149–159. [Google Scholar] [CrossRef]
  4. Robert, J.B.R.; Kumar, R.R. A Hybrid Algorithm for Minimizing Makespan in the Permutation Flow Shop Scheduling Environment. Asian J. Res. Soc. Sci. Humanit. 2016, 6, 1239–1255. [Google Scholar] [CrossRef]
  5. Han, N.A.; Ramanan, R.T.; Shashikant, S.K.; Sridharan, R. A hybrid neural network–genetic algorithm approach for permutation flow shop scheduling. Int. J. Prod. Res. 2010, 48, 4217–4231. [Google Scholar]
  6. Yang, Y.Y.; Qian, B.; Li, Z.; Hu, R.; Wang, L. Q-learning based hyper-heuristic with clustering strategy for combinatorial optimization: A case study on permutation flow-shop scheduling problem. Comput. Oper. Res. 2025, 173, 106833. [Google Scholar] [CrossRef]
  7. Zeng, F.; Cui, J. Improved Fruit Fly Algorithm to Solve No-Idle Permutation Flow Shop Scheduling Problem. Processes 2025, 13, 476. [Google Scholar] [CrossRef]
  8. Lemtenneche, S.; Bensayah, A.; Cheriet, A. An Estimation of Distribution Algorithm for Permutation Flow-Shop Scheduling Problem. Systems 2023, 11, 389. [Google Scholar] [CrossRef]
  9. Eberhart, R.; Kennedy, J. Particle swarm optimization. In Proceedings of the IEEE International Conference on Neural Networks, Perth, WA, Australia, 27 November–1 December 1995; Volume 4, pp. 1942–1948. [Google Scholar]
  10. Zhu, K.; Wang, Q.; Yang, W.; Yu, Q.; Wang, Z.; Wang, X. Research on Ship Collision Avoidance Based on Improved Particle Swarm Optimization Algorithm. Sens. Microsyst. 2025, 44, 40–43+47. [Google Scholar] [CrossRef]
  11. Mirjalili, S.; Lewis, A. The whale optimization algorithm. Adv. Eng. Softw. 2016, 95, 51–67. [Google Scholar] [CrossRef]
  12. Khishe, M.; Mosavi, M.R. Chimp optimization algorithm. Expert Syst. Appl. 2020, 149, 113338. [Google Scholar] [CrossRef]
  13. Xue, J.; Shen, B. Dung beetle optimizer: A new meta-heuristic algorithm for global optimization. J. Supercomput. 2023, 79, 7305–7336. [Google Scholar] [CrossRef]
  14. Mirjalili, S.; Mirjalili, S.M.; Lewis, A. Grey wolf optimizer. Adv. Eng. Softw. 2014, 69, 46–61. [Google Scholar] [CrossRef]
  15. Lijun, F. A hybrid adaptive large neighborhood search for time-dependent open electric vehicle routing problem with hybrid energy replenishment strategies. PLoS ONE 2023, 18, e0291473. [Google Scholar]
  16. Reeves, C.R. A genetic algorithm for flowshop sequencing. Comput. Oper. Res. 1995, 22, 5–13. [Google Scholar] [CrossRef]
  17. Taillard, E. Benchmarks for basic scheduling problems. Eur. J. Oper. Res. 1993, 64, 278–285. [Google Scholar] [CrossRef]
  18. Du, S.L.; Zhou, W.J.; Wu, D.K. An effective discrete monarch butterfly optimization algorithm for distributed blocking flow shop scheduling with an assembly machine. Expert Syst. Appl. 2023, 225, 120113. [Google Scholar] [CrossRef]
  19. Zhao, F.Q.; Zhou, G.; Wang, L. A cooperative scatter search with reinforcement learning mechanism for the distributed permutation flowshop scheduling problem with sequence-dependent setup times. IEEE Trans. Syst. Man Cybern. Syst. 2023, 53, 4899–4911. [Google Scholar] [CrossRef]
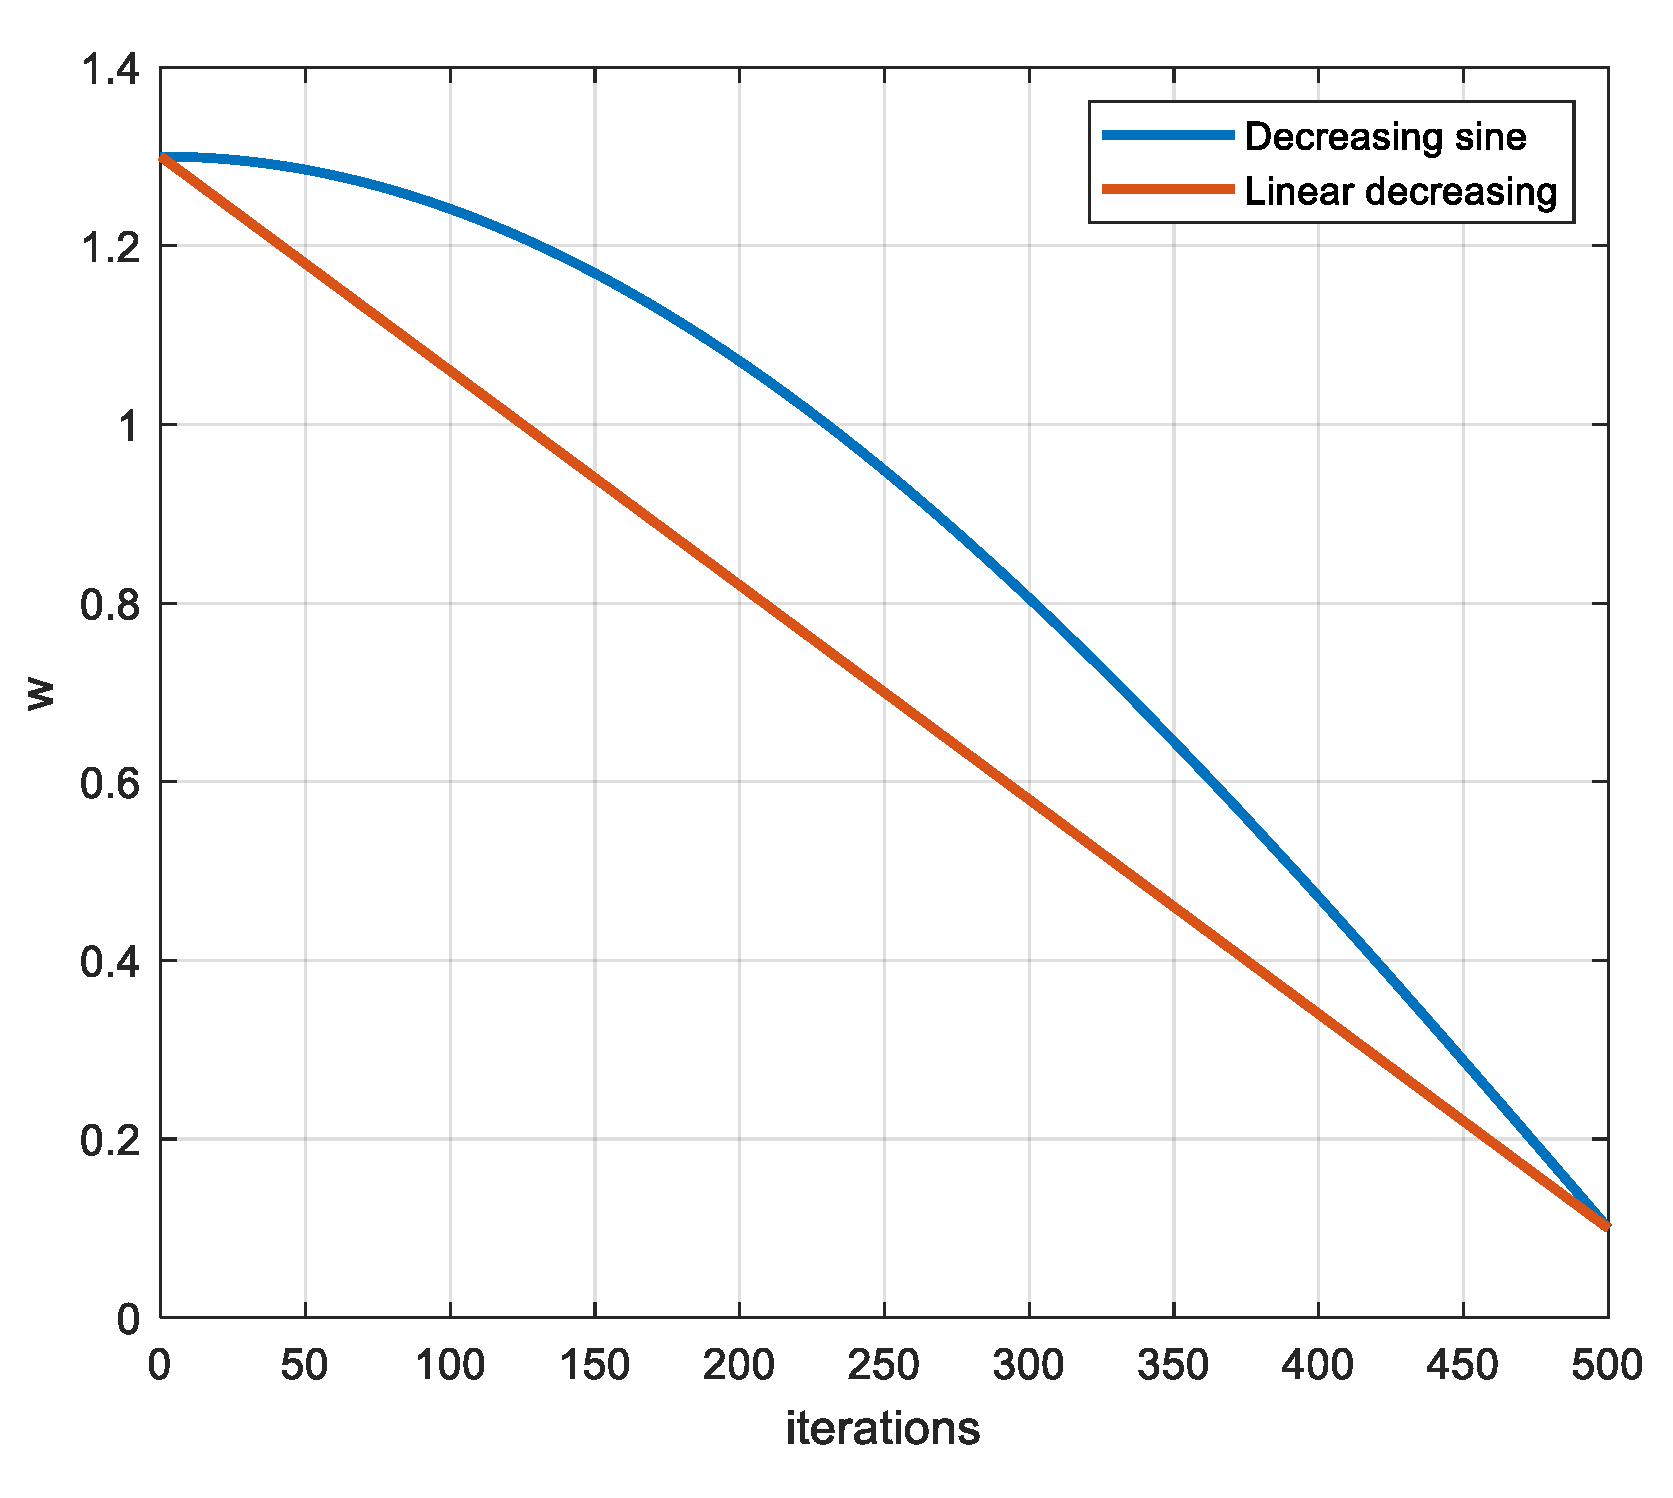
Figure 1. Graphs of inertia weight changes with sinusoidal and linear decreases.
Symmetry 17 01697 g001
Figure 2. Gaussian distribution and Cauchy distribution.
Symmetry 17 01697 g002
Figure 3. Box diagram of six algorithms running independently 30 times.
Symmetry 17 01697 g003aSymmetry 17 01697 g003b
Figure 4. Convergence curves of the six algorithms on the test function.
Symmetry 17 01697 g004aSymmetry 17 01697 g004b
Figure 5. EPSO algorithm flowchart.
Symmetry 17 01697 g005
Figure 6. Shortest processing time sorting.
Symmetry 17 01697 g006
Figure 7. Example of NEH initialization.
Symmetry 17 01697 g007
Figure 8. Variable neighborhood search operator.
Symmetry 17 01697 g008
Figure 9. The 95% confidence interval plots of each comparison algorithm.
Symmetry 17 01697 g009
Figure 10. Results of Bonferroni–Dunn test.
Symmetry 17 01697 g010
Figure 11. Convergence curve of the EPSO algorithm.
Symmetry 17 01697 g011
Figure 12. The workshop scheduling scheme of the enterprise.
Symmetry 17 01697 g012
Figure 13. The EPSO algorithm solves the scheduling scheme.
Symmetry 17 01697 g013
Table 1. Test functions.
FunctionsVariable ScopeFmin
F 1 x = i = 1 n j = 1 i x j 2 [−100,100]0
F 2 x = i = 1 n x i + 0.5 2 [−100,100]0
F 3 x = i = 1 n i x i 4 + r a n d o m 0 , 1 [−1.28,1.28]0
F 4 x = i = 1 n x i sin x i [−500,500]−418.98n
F 5 x = π n 10 sin π y 1 + i = 1 n 1 y i 1 2 1 + 10 sin 2 π y i + 1 + y n 1 2 + i = 1 n u x i , 10 , 100 , 4 y i = 1 + x i + 1 4 u x i , a , k , m = k x i a m x i > a 0 a < x i < a k x i a m x i < a
[−50,50]0
F 6 x = 0.1 sin 2 3 π x 1 + i = 1 n x i 1 2 1 + sin 2 3 π x i + 1 + x n 1 2 1 + sin 2 2 π x n + i = 1 n u x i , 5 , 100 , 4 [−50,50]0
Table 2. The operation results of different algorithms.
FunctionsEPSOPSOWOAChimpDBOGWO
F1average3.12 × 10−985.12 × 10−36.12 × 10−39.21 × 10−33.22× 10−146.21× 10⁻⁵
standard5.12 × 10−922.23 × 10−35.12 × 10−32.62 × 10−12.15× 10−143.12× 10⁻⁴
F2average9.93 × 10−12.58 × 10−02.13 × 10−02.35 × 10−09.54 × 10−01.14 × 10−0
standard5.68 × 10−13.51 × 10−12.56 × 10−11.76 × 10−15.84 × 10−11.73 × 10⁻¹
F3average4.26 × 10−136.21 × 10−65.12 × 10−65.12 × 10−63.12 × 10−61.42 × 10⁻¹
standard5.53 × 10−136.28 × 10−63.22 × 10−64.12 × 10−64.13 × 10−61.63 × 10⁻²
F4average−8.16 × 10⁻³−4.72 × 10⁻³−7.23 × 10⁻³−6.31 × 10⁻³−5.88 × 10⁻³−5.45 × 10⁻³
standard4.32 × 10+24.54 × 10+26.45 × 10+24.98 × 10+28.54 × 10+28.01 × 10+2
F5average2.13 × 10−24.99 × 10−11.51 × 10−17.11 × 10−12.35 × 10−22.96 × 10⁻¹
standard2.11 × 10−23.02 × 10−27.31 × 10−23.28 × 10−22.68 × 10−29.99 × 10⁻¹
F6average3.17 × 10−13.94 × 10−02.56 × 10−03.12 × 10−05.21 × 10−11.32 × 10−0
standard1.46 × 10−12.33 × 10−13.24 × 10−14.44 × 10−21.95 × 10−15.14 × 10−0
Table 3. The operation results of the EPSO and its variant algorithms.
FunctionsEPSOEPSO1EPSO2EPSO3
F1average3.12 × 10−986.21 × 10−324.23 × 10−364.98 × 10−44
standard5.12 × 10−927.23 × 10−236.45 × 10−924.23 × 10−43
F2average9.93 × 10−11.01 × 10−02.23 × 10−04.23 × 10−0
standard5.68 × 10−16.12 × 10−03.11 × 10−04.22 × 10−0
F3average4.26 × 10−137.22 × 10−105.12 × 10−115.89 × 10⁻¹²
standard5.53 × 10−134.23 × 10−94.56 × 10−116.42 × 10⁻¹¹
F4average−8.16 × 10⁻³−6.23 × 10⁻³−5.14 × 10⁻³−4.23 × 10⁻³
standard4.32 × 10+25.31 × 10+25.23 × 10+25.23 × 10+2
F5average2.13 × 10−23.23 × 10−23.14 × 10−23.11 × 10⁻²
standard2.11 × 10−22.19 × 10−23.03 × 10−24.11 × 10⁻²
F6average3.17 × 10−11.23 × 10−02.23 × 10−03.23 × 10−0
standard1.46 × 10−12.12 × 10−02.13 × 10−03.22 × 10−0
Table 4. Comparison of BRE and ARE for Rec instances by various algorithms.
CasesVABCHCVBWOANN-GAHGASAGWOEPSO
BREAREBREAREBREAREBREAREBREAREBREARE
Rec010.0000.526 0.000 0.5630.0000.325 0.0000.160 0.522 1.369 0.0000.000
Rec030.0000.2630.0000.056 0.0000.150 0.0000.0000.2561.365 0.0000.000
Rec050.240 1.058 0.240 0.603 0.240 0.2400.0000.2400.240 0.967 0.0000.240
Rec070.1601.326 0.0001.652 0.053 0.768 0.0000.5391.213 2.352 0.0000.635
Rec090.0002.036 0.0001.305 0.0000.126 0.0000.361 1.563 2.235 0.0000.103
Rec110.083 1.639 0.0000.852 0.0000.2690.0000.536 1.7552.890 0.0000.427
Rec130.632 1.721 1.026 1.852 0.661 1.263 0.711 1.032 2.065 3.127 0.5220.756
Rec150.956 2.130 0.845 1.632 0.0001.0650.0001.025 1.339 2.150 0.363 0.769
Rec170.659 2.153 1.056 1.320 0.951 1.066 0.796 1.216 1.856 2.901 0.6720.928
Rec192.698 3.452 0.0001.143 0.0001.606 0.3560.8123.326 4.338 0.986 1.592
Rec211.716 1.826 1.640 2.568 1.887 2.648 1.057 1.335 4.198 5.897 0.2870.919
Rec230.651 2.167 1.601 2.361 0.5931.976 1.167 1.4912.894 4.653 0.5931.608
Rec251.332 2.987 0.349 1.501 2.509 2.795 0.493 1.185 4.327 5.354 0.3460.790
Rec270.864 2.088 1.504 1.8601.807 2.272 0.0002.001 4.870 6.292 0.0002.035
Rec291.412 3.182 1.837 2.331 2.707 2.302 0.870 2.173 5.038 6.204 0.2471.788
Rec311.222 2.387 2.074 2.618 1.551 2.914 0.860 2.341 2.944 3.151 0.8201.937
Rec330.997 1.212 2.687 2.974 1.235 3.438 0.839 2.045 7.132 8.239 0.4251.876
Rec350.0000.049 0.0001.373 1.837 2.222 0.0000.829 6.095 5.137 0.0000.800
Rec370.765 1.778 0.0000.0000.0000.0000.0000.0001.630 2.864 0.0000.000
Rec392.613 2.807 4.899 5.009 2.944 3.210 2.934 4.426 11.014 11.568 2.5383.014
Rec413.255 4.068 2.944 3.072 3.576 3.882 1.768 2.519 8.989 9.829 1.7092.736
AVG0.965 1.945 1.081 1.745 1.074 1.645 0.564 1.251 3.489 4.423 0.4531.093
Table 5. Taillard test results.
ScaleVABCHCVBWOANN-GAHGASAGWOEPSO
20 × 51.14661.88351.66291.36501.43790.0132
20 × 101.15841.31711.45621.38301.56670.0125
20 × 201.18371.22561.56321.70101.73370.0072
50 × 51.64941.75861.75801.25801.78900.0158
50 × 101.94401.72201.86961.53961.17380.5362
50 × 203.14121.29561.72501.05521.24610.9640
100 × 51.48441.73511.69202.49101.67870.0351
100 × 101.88243.58631.63642.19021.74010.0802
100 × 203.90714.37471.58561.47171.96070.9513
200 × 101.24461.02191.90431.66701.60430.6945
200 × 203.75023.12672.93881.51302.25481.2757
500 × 201.92812.04172.97821.89613.12660.5777
Table 6. Friedman test results of the EPSO algorithm and the comparison algorithms.
AlgorithmMean RankingChi-Squarep-ValueCDa = 0.05CDa = 0.1
EPSO1.3261.235214.213 × 10−180.6230.687
HGASA2.011
GWO3.122
ANN-GA2.478
VABC4.354
HCVBWO4.447
Table 7. Input shaft processing time.
E1E2E3E4E5E6E7E8E9E10
O1186174114192483271123191172
O2984292363811941792931
O3132142831018912314520113456
O4696218412310316414518184179
O51821432011861761951181695445
O6111789813886723211341132
O78159168153146481035899166
O82349123261861346516412456
O91238786189961877415616484
O1013417618418668164184357985
O1174982031282011858695201184
O12163174103123187642112616839
O139520894185187164393697142
O141981341151627618669452695
O15102758916542761976413988
O16175135199861972119868164113
O1753134957517814613415818461
O181831231971591841567613594154
O1911614839647818676593439
O20187115156167991847919616837
Disclaimer/Publisher’s Note: The statements, opinions and data contained in all publications are solely those of the individual author(s) and contributor(s) and not of MDPI and/or the editor(s). MDPI and/or the editor(s) disclaim responsibility for any injury to people or property resulting from any ideas, methods, instructions or products referred to in the content.