Abstract
In order to solve the limitations of the existing bridge pier damage detection equipment, a rope-driven bridge pier damage detection robot (RDBPDR) is proposed. Firstly, the composition of the RDBPDR system was introduced. Secondly, the kinematical and dynamical model of the RDBPDR was established, and the optimization model of rope tension was given. Based on the dynamic model, the evaluation method and index of the stability of the RDBPDR were given. Finally, the distribution of the stability evaluation index of the RDBPDR in the workspace was clarified with an example calculation and analysis. The results show that the stability of the RDBPR gradually decreases from the geometric center to the boundary area in the horizontal section. With the increase in the height of the damage detection platform, the stability of the RDBPDR gradually increases in the vertical direction, but this change is not significant. It provides a basis for detection task planning, overall structure configuration, and prototype testing in the future.
1. Introduction
With the vigorous development of the current transportation industry, the increase in the transportation capacity and traffic density of automobiles, and considering the longer service time of bridges, the load-bearing capacity of bridges and the damage defects (for example, cracks, honeycomb and pockmarked surfaces, concrete carbonation, etc.) of related parts will cause significant harm to the safe operation of bridges [1,2]. As an important part of the bridge, the bridge pier is of great significance to the safe and stable operation of the overall bridge [3,4,5], so the damage detection of the bridge pier can provide an important scientific basis for the safe operation and management of the bridge to find the pier damage defects in time, make corresponding repair measures in time, and improve the overall safe operation life of the bridge [6].
Most of the traditional bridge pier detection is to transport the inspector to the relevant part to detect the damage through equipment (such as hanging baskets, cranes, etc.), but this manual detection method has certain safety problems. Moreover, the efficiency is low, and it is greatly affected by the work experience and subjective factors of the inspector [7,8]. Therefore, this method cannot fully grasp the safe operation state of the bridge pier.
At present, UAVs are developing rapidly and are also used in bridge pier detection. UAVs carry damage detection equipment to the surface of bridge piers for collecting relevant data. Xu Hao and Su Qi et al. [9,10], respectively, used UAVs to study technical methods for detecting surface defects of bridge piers and applied image processing to obtain relevant data. However, UAVs are unable to obtain high-resolution images of bridge piers at close range, the network communication under some bridge piers is poor, and they are also susceptible to interference from the external environment [11].
In order to solve the limitation problem of UAVs in bridge pier damage detection, wall-climbing robots were studied by scientific and technological personnel. Wall-climbing robots carry damage detection equipment to detect bridge pier surface damage defects. At present, there are two main types of wall-climbing robots: magnetic adsorption wall-climbing robots and negative pressure adsorption wall-climbing robots. The former mainly relies on magnetic attraction force to provide the robot’s motion climbing force, but the bridge pier is mainly composed of concrete, so it is difficult for the magnetic attraction force provided by the steel bar to support the robot’s motion [11,12]. The latter mainly realizes the adsorption of the wall-climbing robot on the bridge pier by generating vacuum adsorption force. Lan Jing and Nie Xiaolan et al. [13,14], respectively, designed a vacuum adsorption wall-climbing detection robot, but it was affected by factors such as the surface quality of the bridge pier and could not meet the load capacity of carrying related detection equipment. To this end, Wang Huifeng and Jang et al. [15,16] from Chang’an University studied a detection robot with ring belt vision, which can realize the data collection of the whole area of the bridge pier surface. In addition, the Eighth Bureau of the Engineering Research Institute of China Railway developed a visual damage detection robot with an annular belt that can adapt to the diameter of the pier, which can realize the detection of the pier with 1–1.8 m in diameter. This detection robot has high requirements for the control of its levelness. If the body structure is tilted, it is likely to be stuck on the bridge pier and unable to complete the relevant detection tasks.
Therefore, this paper proposes an RDBPDR, which has the performance advantages of simple structure, high modularity, large workspace, and so on. But the rope can only provide tension force, and the rope-driven robot has weak stability. So the study of the stability of the rope-driven robot has attracted extensive attention. Many scholars have proposed the stability of the total stiffness matrix [17], the slope stability of the moving spinor [18], the stability of force–potential and force–stiffness [19,20], a static stability evaluation method based on the mixed force–position–pose method [21,22], and the Krasovsky method [23]. In addition, H.S. Kim et al. proposed a stability measurement method for a one-degree-of-freedom wall-climbing robot based on the gradient stability margin. Considering factors such as external forces, gravity, and inertial forces acting on the wall-climbing robot, the stability margin was defined by the angle between the equivalent tip-over force and the connection lines of the support points [24]. Based on the system stiffness, J. Tao et al. defined the stability margin of a cable-driven parallel robot by using the ratio of the pose change of the moving platform under external disturbances to the maximum acceptable pose change [25]. H. Tan et al. utilized the Zero Moment Point method to determine the stability evaluation method for cable-driven robots with mobile bases [26]. However, due to the fact that the above stability evaluation methods take many factors into consideration and the calculation time is relatively long, they cannot meet the requirements of rapid calculation and quick adjustment in practical engineering applications.
In order to solve the problem of the above stability evaluation methods, the dynamics and stability of the proposed RDBPDR will be studied in this paper, and the stability evaluation of the RDBPDR will be clarified through simulation calculation, which will lay a foundation for prototype testing and practical application.
2. RDBPDR System
The RDBPDR system mainly includes the rope-driven bridge pier damage detection robot and the control center, as shown in Figure 1. In the control center, after the operator gives the detection task start command, the control command is converted and sent to the drivers to realize the coordinated motion control of the RDBPDR. The RDBPDR is composed of a damage detection platform and an RDPR platform, the overall structure of the damage detection platform is a circular arc segment combination whose diameter is larger than that of the bridge pier. The damage detection equipment is installed at different positions on the structure of the damage detection platform.
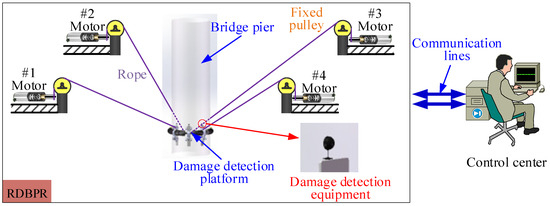
Figure 1.
The RDBPDR system.
The RDPR platform consists of four groups of rope drive units installed on the bridge deck, where one end of the rope is connected with the damage detection platform and is fixed, and the other end of the rope is connected to the drive wheel mounted on the motor through a guide pulley. According to the control commands sent by the control center, four motors drive the drive wheels to realize the control of the expected motion of the rope and the rope tension force. The expected motion of the damage detection platform can be realized through the coordinated motion of the four groups of ropes and the rope tension control, and then, the damage detection task of the bridge pier is realized by utilizing the damage detection equipment.
3. Dynamic Modeling of the RDBPDR System
The designed RDBPDR is a special rope-driven parallel robot (RDPR). Compared with the overall structure of the RDBPDR, the structure size of the damage detection platform is small. It can be regarded as a point, denoted by P. Meanwhile, compared with the mass of the damage detection platform, the selected rope mass is small and can be ignored, so the curvature caused by the weight of the rope can be neglected. Therefore, the geometric shape of the rope in the actual motion process is a straight line. At this time, the RDBPDR shown in Figure 1 can be simplified as the theoretical analysis model shown in Figure 2.
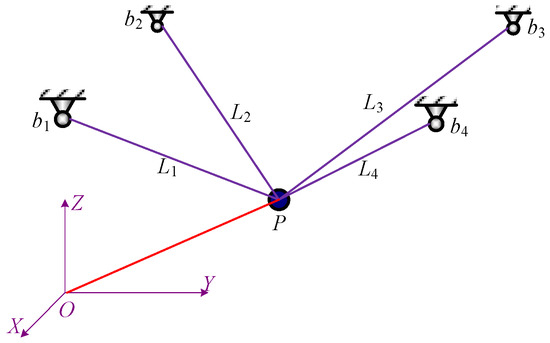
Figure 2.
The theoretical analysis model of the RDBPDR system.
In the theoretical analysis model of the RDBPDR, firstly, the global coordinate system O-XYZ is established, where bi represents the position of the guide pulley. The line OP is the position vector of the damage detection platform in the global coordinate system O-XYZ. Li represents the rope length between the damage detection platform P and the guide pulley bi. Because in the actual damage detection process, the damage detection platform only moves along the Z direction, at the same time, considering the distribution position of the bridge pier in the horizontal plane, the motion of the damage detection platform can be regarded as the motion of three linear degrees of freedom. The position of the damage detection platform P in the global coordinate system O-XYZ is (x, y, z), and the position of the guide pulley bi in O-XYZ is (xi, yi, zi). Furthermore, according to the relationship between the number of ropes m and the degrees of freedom n of the end effector, when m = n + 1, this mechanism is a fully constrained positioning mechanism. It can be seen from this that the designed RDBPDR is a fully constrained positioning mechanism. Therefore, the RDBPDR system has good positioning accuracy and stability.
According to the theoretical analysis model shown in Figure 2, it can be seen that the rope length vector between the damage detection platform P and the guide pulley bi can be represented as
where is the position vector of the guide pulley bi in O-XYZ. is the position vector of the damage detection platform P in O-XYZ.
Therefore, the length of the rope between the damage detection platform P and the guide pulley bi is
The desired motion of the damage detection platform P can be realized under the action of four rope tensions. The mechanical equilibrium equation of the RDBPDR can be expressed as
where is the structural matrix of the RDBPDR. is the external force matrix on the damage detection platform P, which contains the weight and inertial force of the damage detection platform. is the rope tension force vector. Because the rope has a safety limit tension value , simultaneously, in order to make the motion of the damage detection platform stable, the preload force needs to be applied upward in all directions of the damage detection platform. Therefore, the rope tension force needs to meet the following conditions:
According to the structure of the rope-driven bridge pier damage detection robot, it can be seen that the structural matrix is not a square matrix. Therefore, the rope tension can be solved using the generalized inverse theory of the matrix. Hence, the rope tension can be expressed as follows:
where is the generalized inverse matrix of the structural matrix of the rope-driven bridge pier damage detection robot. is the zero space vector of the structural matrix JT. is the special solution of the mechanical equilibrium Equation (2) of the rope-driven bridge pier damage detection robot. is the general solution term of the mechanical equilibrium Equation (2). is an arbitrary vector. Because the rope-driven bridge pier damage detection robot studied in this study is a fully constrained positioning mechanism, it is an arbitrary scalar.
Equation (5) shows that if the value can be determined, the rope tension can be determined. When the value range of [,] is determined, the convex combination is composed of and can be represented by . So the rope tension is as follows:
where , and is the ith term of the special solution of Equation (2).
Therefore, the value range of is as follows:
The rope tension optimization model of the rope-driven bridge pier damage detection robot can be written as
where Equation (7) is the linear constraint condition about . The distribution of the rope tension at different positions needs to be adjusted by the specific value determined by the optimization algorithm. So the optimization problem of the rope tension can be transformed into an optimization problem about . f () is the optimal objective function of the rope tension and is a polynomial about .
The distribution of rope tension plays a very key role in the motion stability of the damage detection platform. The rope tension optimization algorithms of the RDPR were studied using optimization algorithms such as minimum p-norm, minimum variance, and MIDE (Middle Extremum Method) in the reference [27], respectively. The results show that the change in the rope tension obtained by the minimum variance optimization algorithm is smooth and has a stronger ability to modify the rope tension. In this study, the minimum variance optimization algorithm is directly used to optimize the rope tension of the rope-driven bridge pier damage detection robot. The optimal objective function for the rope tension is
where is the rope tension of the ith rope. , where is the ith term of the zero space vector of the structural matrix JT.
Based on the above analysis, the rope tension of the rope-driven bridge pier damage detection robot can be obtained in real time.
4. Stability Analysis
Stability is a prerequisite for the safe operation of the robot. For the rope-driven bridge pier damage detection robot, since the rope can only provide one-way tension and cannot provide pressure, the stability of the rope-driven bridge pier damage detection robot is weak, and it cannot be analyzed using traditional system stability methods. Therefore, it is of great significance to study the stability of the rope-driven bridge pier damage detection robot and give the stability evaluation index for the detection effect of the damage detection platform.
According to the basic definition of stability, it can be seen that when the force acting on the operated object is uniform in all directions, it is difficult for external interference to change the motion state of the operating object, and the motion state of the operated object is stable. When the force acting on the operated object is uneven in all directions, external interference can easily change the motion state of the operated object, so the motion state of the operated object is unstable at this time. Similarly, the rope tension acting on the damage detection platform is regarded as the force acting on the damage detection platform, which has the same result. Therefore, the stability of the rope-driven bridge pier damage detection robot will be evaluated by the uniformity of the rope tension.
In the workspace of the rope-driven bridge pier damage detection robot, the damage detection platform realizes the desired motion under the drive of the rope tension. When the rope tension caused by the rope on the damage detection platform is evenly distributed, the damage detection platform has a stronger ability to resist external interference. The motion of the damage detection platform will be more stable, and the motion of the rope-driven bridge pier damage detection robot will be stable. Therefore, it is reasonable and reliable to measure the stability of the rope-driven bridge pier damage detection robot by using the uniformity of rope tension distribution. In addition, the motion task of the damage detection platform can be planned through the distribution law of stability.
By Equation (8), the magnitude of the rope tension (i = 1, 2, 3, 4) at different times can be obtained, and the uniformity index S of rope tension distribution can be expressed as
where and are the minimum and maximum values of the rope tension at time i.
It can be seen from Equation (10) that when the S is larger, it indicates that the closer the size value of each rope tension is at the same time, that is, the more uniform the distribution of the rope tension on the damage detection platform is, the stronger the ability to resist external interference is, and the better the motion stability of the damage detection platform is. Therefore, the S can be directly used as the evaluation index for the stability of the rope-driven bridge pier damage detection robot. Combined with Equations (4) and (10), it can be seen that the value range of stability evaluation index S is S∈(0,1]. Therefore, when S→1, the stability of the rope-driven bridge pier damage detection robot is better. On the contrary, when S→0, the stability of the rope-driven bridge pier damage detection robot is poorer. Therefore, when there are certain requirements for the stability of the rope-driven bridge pier damage detection robot, the value range of the stability evaluation index S should be specified as S∈(sl,1]. When the evaluation index of the stability obtained by calculating is within the range of (sl,1], it shows that the stability of the rope-driven bridge pier damage detection robot meets the requirements for stability. sl should be determined according to the requirements for stability, and the larger the sl value is, the higher the requirements for stability are.
5. Experiment Analysis
In order to analyze the stability law in the workspace, this study uses an example to calculate and analyze the stability law of the damage detection platform. The numerical analysis of the proposed stability was performed in the MATLAB environment. It was assumed that the positions of the guide pulley bi in O-XYZ are b1(35, 0, 15) m, b2(0, 0, 15) m, b3(0, 80, 15) m, and b4(35, 80, 15) m. The mass of the damage detection platform is m = 15 kg. The lower bound of the rope tension is [20, 20, 20, 20]TN, and the upper bound of the rope tension is [2500, 2500, 2500, 2500]TN.
It is assumed that the position of the bridge pier detected in O-XYZ is (30, 40, z) m, and the height of the bridge pier is 10 m. The trajectory of the damage detection platform in the Z direction is z = 0.05 t m/s. The trajectory of the damage detection platform (the red line) is shown in Figure 3. It can be seen from Figure 3 that the position in the horizontal section of the bridge pier is not in its geometric center, and the position is close to its boundary. The changes in the rope length and the rope tension corresponding to the expected trajectory are shown in Figure 4 and Figure 5, respectively.
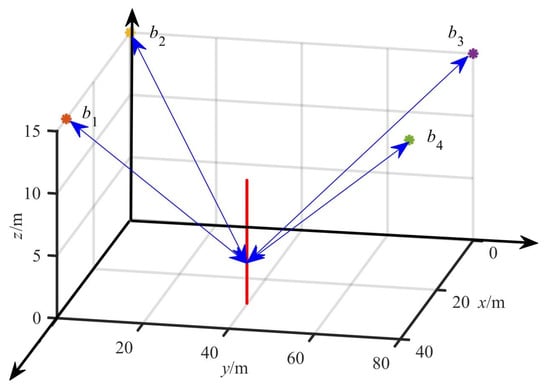
Figure 3.
The trajectory of the damage detection platform.
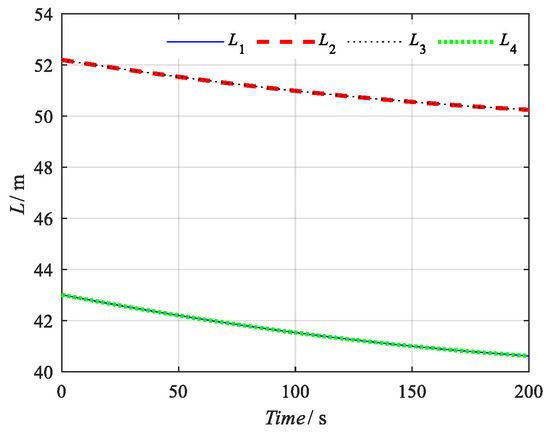
Figure 4.
The changes in rope length.
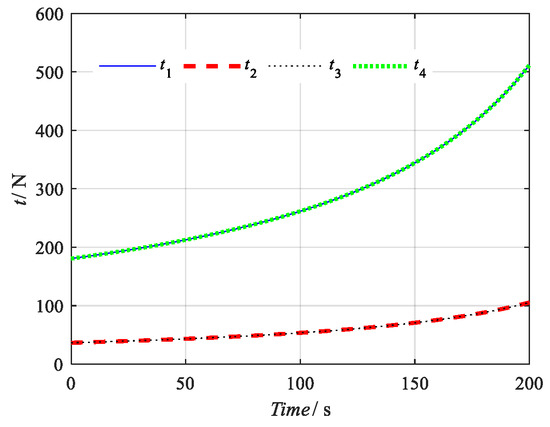
Figure 5.
The changes in rope tension.
Because the structure of the rope-driven bridge pier damage detection robot in the example is symmetrically distributed, and the expected motion trajectory displacement is a vertical straight line, the variation laws of rope length L1 and L4 and L2 and L3 are the same, and the corresponding rope tension variation laws are the same. In addition, because the expected trajectory of the damage detection platform is closer to L1 and L4, the length of changes for L1 and L4 is less, but the corresponding values and the change rates of rope tension t1 and t4 are larger.
The change in the stability index S corresponding to the expected motion trajectory of the damage detection platform is shown in Figure 6. It can be seen from Figure 6 that when the damage detection platform moves upward along the bridge pier, its stability evaluation index S also increases gradually, and with the increase in height Z value, the change rate of stability evaluation index S gradually decreases, which is mainly caused by the gradual increase in the change rate of rope tension t1 and t4 shown in Figure 5 with the increase in height Z value. Therefore, for the rope-driven bridge pier damage detection robot system, the stability evaluation index S gradually increases when the damage detection platform moves upward along the bridge pier, but the rate of its increase gradually decreases; that is, the stability is enhanced with the increase in height Z value, but the speed of enhancement is smaller.
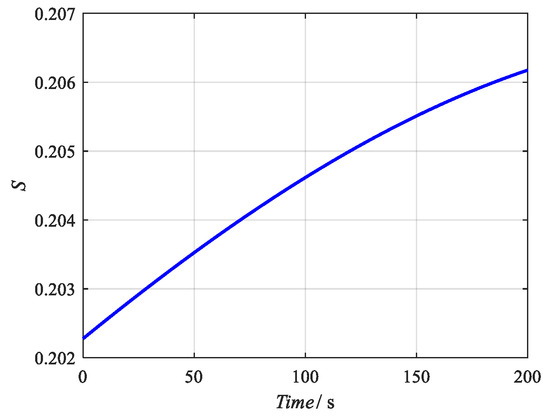
Figure 6.
The change in the stability index S.
In order to analyze the stability of the rope-driven bridge pier damage detection robot in the workspace and provide a basis for the optimization of its structural layout configuration, the distribution of stability evaluation index S in different sections was calculated, as shown in Figure 7, Figure 8, Figure 9, Figure 10 and Figure 11.
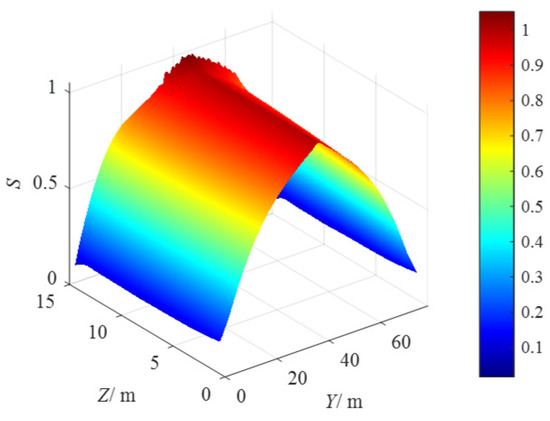
Figure 7.
The distribution of S in the vertical section of X = 17 m.
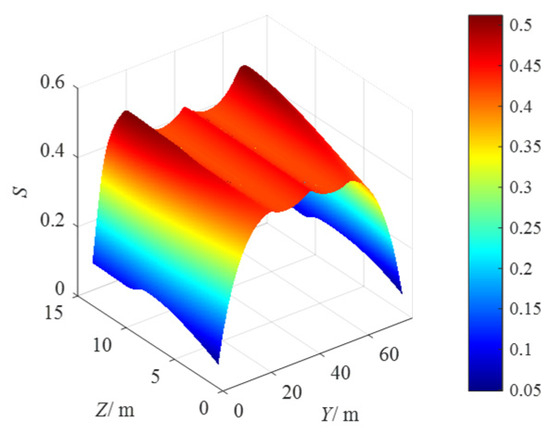
Figure 8.
The distribution of S in the vertical section of X = 25 m.
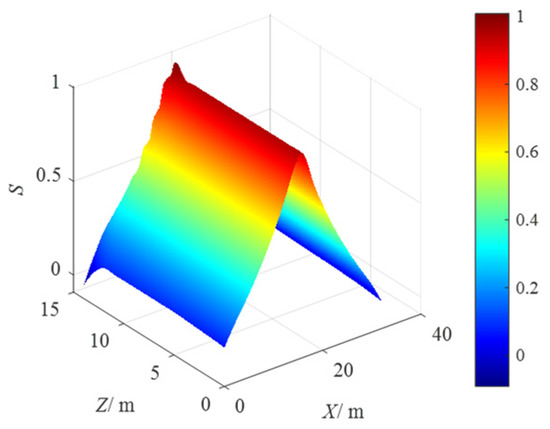
Figure 9.
The distribution of S in the vertical section of Y = 40 m.
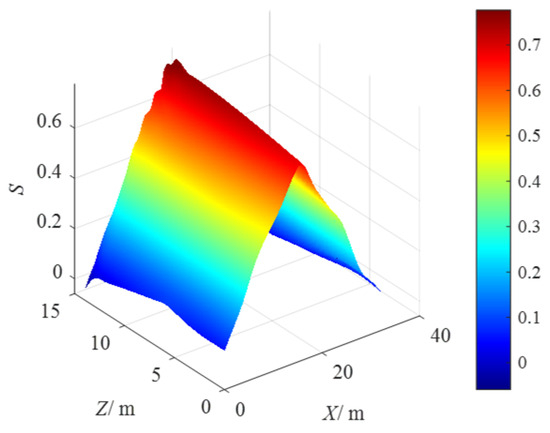
Figure 10.
The distribution of S in the vertical section of Y = 60 m.
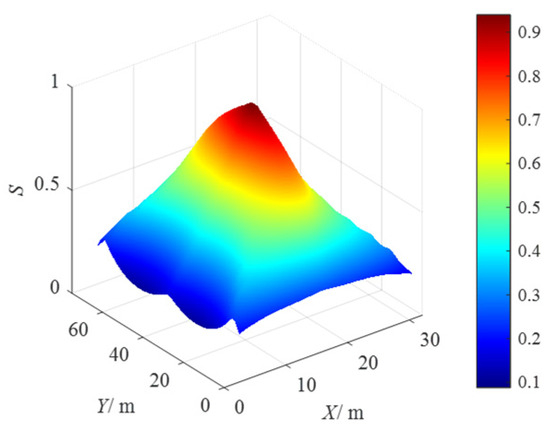
Figure 11.
The distribution of S in the horizontal section of Z = 5 m.
The distribution of S in the vertical section of X = 17 m is shown in Figure 7, and the maximum value of S is Smax = 0.99. It can be seen from Figure 7 that the distribution of S in this section is symmetrical with respect to the plane of Y = 40 m, and it increases first and then decreases with the increase in Y value. The distribution of S in the vertical section of X = 25 m is shown in Figure 8, and the maximum value of S is Smax =0.52. Similarly, the distribution of S is symmetrical about the plane of Y = 40 m, but the maximum value of S decreases significantly. The distribution of S presents a double hump distribution in the X = 25 m section, which is mainly caused by the correction of rope tension at the boundary. It also indicates the importance of rope tension optimization on the tension distribution and stability of the RDBPDR. Compared with Figure 7 and Figure 8, it can be seen that when the position of the damage detection platform moves from the center of the robot structure to the boundary, the S value decreases significantly; that is, the stability of the rope-driven bridge pier damage detection robot system is also decreased.
The distribution of S in the vertical section of Y = 40 m is shown in Figure 9, and the maximum value of S is Smax = 0.98. It can be seen from Figure 9 that the distribution of S in this section is symmetrical with respect to the plane of X = 17.5 m, and it increases first and then decreases with the increase in Y value. The distribution of S in the vertical section of Y = 60 m is shown in Figure 10, and the maximum value of S is Smax = 0.765. Similarly, the distribution of S is symmetrical with respect to the plane of X = 17.5 m, but the maximum value of S decreases significantly. Compared with Figure 9 and Figure 10, it can be seen that when the position of the damage detection platform moves from the center of the robot structure to the boundary, the S value decreases significantly; that is, the stability of the rope-driven bridge pier damage detection robot system is decreased.
It can be seen from Figure 7, Figure 8, Figure 9 and Figure 10 that when the X and Y values are the same, S also increases gradually as the Z value increases, but the increase is not obvious. With the increase in Z value, the rope tension also increases, and the constraint force acting on the damage detection platform is enhanced; therefore, with the increase in Z value, the stability of the rope-driven bridge pier damage detection robot system is also enhanced, but it is not as significant as the effect of X and Y changes.
The distribution of S in the horizontal section of Z = 5 m is shown in Figure 11, and the maximum value of S is Smax = 0.941. It can be seen from the figure that the distribution of S decreases from the geometric center of the slice to the boundary in the slice.
When the damage detection platform is in the geometric center of the structural layout, the distribution and change of the rope tension are uniform. The constraint force acting on the damage detection platform in all directions is relatively uniform the stronger the ability to resist external interference is, that is, the better the stability is. At the boundary, due to the uneven distribution of the rope tension (there is the phenomenon of the rope being pulled virtually), the constraint force acting on the damage detection platform in all directions is extremely uneven. It is difficult to resist external interference in all directions; that is, the stability is poor.
Combined with the above analysis results, it can be seen that in the workspace, when the damage detection platform is in the geometric center of the horizontal section, the stability of the rope-driven bridge pier damage detection robot system is good, and its stability will gradually decrease as the damage detection platform moves to the boundary. Therefore, in the actual task planning and the overall configuration of the detection structure, the bridge pier should be laid out in the center position of the rope-driven bridge pier damage detection robot structure as much as possible.
6. Conclusions
The stability issue of the rope-driven bridge pier damage detection robot was studied in this paper. Firstly, the configuration of the rope-driven bridge pier damage detection robot is introduced. Based on the dynamic-static equilibrium equation, the dynamic model of the rope-driven bridge pier damage detection robot is established. Based on the dynamic model of the rope-driven bridge pier damage detection robot system, the minimum variance optimization method is used to optimize the rope tension. The evaluation method and index of rope-driven bridge pier damage detection robot stability are given, and the distribution of the stability evaluation index in different planes is calculated and analyzed through examples. Some suggestions are given for the task planning and overall structure configuration of the rope-driven bridge pier damage detection robot: in the actual task planning and the overall configuration of the detection structure, the bridge pier should be laid out in the center position of the rope-driven bridge pier damage detection robot structure as much as possible. Meanwhile, based on the stability evaluation index, further research problems will consider reconfiguring the robot configuration by adjusting the cable length to improve the stability of the rope-driven bridge pier damage detection robot.
Based on the research results of this paper, we are currently developing the control system and the principle prototype of the rope-driven bridge pier damage detection robot, which lays a foundation for the prototype testing of the rope-driven bridge pier damage detection robot in the future.
Author Contributions
Conceptualization, X.Z. and Y.W.; methodology, J.X. and Y.W.; software, K.Z. and Y.W.; validation, K.Z., Y.W., and Y.H.; formal analysis, H.D.; investigation, H.D.; resources, Y.W.; data curation, J.X. and Y.W.; writing—original draft preparation, J.X., K.Z., and Y.W.; writing—review and editing, Y.W. and Y.H.; visualization, H.D.; supervision, X.Z.; project administration, Natural Science Foundation of Gansu Province of China; funding acquisition, Y.W. All authors have read and agreed to the published version of the manuscript.
Funding
This research was funded by the Natural Science Foundation of Gansu Province of China (No. 24JRRA962).
Data Availability Statement
Data are contained within the article.
Conflicts of Interest
Authors Junjie Xie and Hui Dou were employed by the company Gansu Road and Bridge Construction Group Co., Ltd. The remaining authors declare that the research was conducted in the absence of any commercial or financial relationships that could be construed as a potential conflict of interest.
References
- Ministry of Transport. Statistical Bulletin on the Development of the Transportation Industry in 2023. Available online: https://www.gov.cn/lianbo/bumen/202406/content_6957901.htm (accessed on 18 June 2024).
- Hou, J.; Xu, W.; Chen, Y.; Zhang, K.; Sun, H.; Li, Y. Typical diseases of a long-span concrete-filled steel tubulararch bridge and their effects on vehicle-induced dynamic response. Front. Struct. Civ. Eng. 2020, 14, 867–887. [Google Scholar] [CrossRef]
- Rezaie, A.; Godio, M.; Achanta, R.; Beyer, K. Machine-learning for damage assessment of rubble stone masonry piers based on crack patterns. Autom. Constr. 2022, 140, 104313. [Google Scholar] [CrossRef]
- Yang, Y.; Wang, Z.; Shi, K.; Xu, H. Survey on indirect measurement and monitoring of bridges based on vehicle response. China J. Highw. Transp. 2021, 34, 1–12. [Google Scholar]
- Zhu, C.; He, J.; Zhou, H.; Li, S. Seismic reinforcement technology of cultural relics bridge piers. Bridge Constr. 2018, 48, 108–113. [Google Scholar]
- Zhao, Y.; Su, W.; Hao, L. Disease performance and reinforcement design application of pile pier pier. Shandong Transp. Sci. Technol. 2021, 21, 15–17. [Google Scholar]
- Yang, K.; Wang, D.; Tang, S.; Li, Y.; Liu, G. Apparent disease identification method of concrete based on improved YOLO algorithm. Highw. Eng. 2021, 46, 81–86+103. [Google Scholar]
- Ding, W.; Yu, K.; Shu, J. Crack detection method of concrete structure based on deep learning and UAV. Chin. J. Civ. Eng. 2021, 54, 1–12. [Google Scholar]
- Xu, H.; Peng, X.; Lu, Z. Design of bridge crack detection system based on quadrotor UAV. J. Water Resour. Water Transp. Eng. 2018, 18, 102–110. [Google Scholar]
- Su, Q.; Wei, Y.; Jiang, L.; Zou, Y. Unmanned aerial vehicle (UAV) detection method for bridge appearance disease. Tianjin Constr. Sci. Technol. 2022, 32, 21–24. [Google Scholar]
- Tong, Y. Circular Visual Scanning Robot System for Pier Disease Climbing Detection. Doctoral Dissertation, Chang’an University, Xi’an, China, 2023. [Google Scholar]
- Ji, Z.; Tao, Y.; Wu, M. Optimal design and experimental study of adsorption structure of wind power tower wall-climbing robot. Mod. Manuf. Eng. 2023, 21, 35–42+49. [Google Scholar]
- Lan, J.; Huang, W.; Liao, G.; Su, H.; Xi, C. Bridge pier disease detection robot based on vacuum adsorption. Sci. Technol. Innov. Appl. 2019, 19, 44–45. [Google Scholar]
- Nie, X.; Zhu, H.; Gao, Q.; Zhang, J. Structural design of a bridge detection climbing robot. Equip. Manuf. Technol. 2021, 12, 124–125+138. [Google Scholar]
- Wang, H.; Du, H.; Gao, R.; Tong, Y.; Peng, L.; Zhao, Y.; Huang, H. Robot system for climbing and detecting apparent diseases of pier stud structure based on visual scanning of ring belt. China J. Highw. Transp. 2024, 37, 40–52. [Google Scholar]
- Jang, K.; An, Y.K.; Kim, B.; Cho, S. Automated crack evaluation of a high-rise bridge pier using a ring-type climbing robot. Comput.-Aided Civ. Infrastruct. Eng. 2021, 23, 14–29. [Google Scholar] [CrossRef]
- Behzadipour, S.; Khajepour, A. Stiffness of cable-based parallel manipulators with application to stability analysis. J. Mech. Des. 2006, 128, 303–310. [Google Scholar] [CrossRef]
- Bosscher, P.M.; Ebert-Uphoff, I. A stability measure for underconstrained cable-driven robots. In Proceedings of the IEEE International Conference on Robotics and Automation, New Orleans, LA, USA, 26 April–1 May 2004. [Google Scholar]
- Liu, P.; Qiu, Y. Stability evaluation method of force-position mixing of rope traction camera robot. J. Xidian Univ. (Nat. Sci. Ed.) 2016, 43, 100–106. [Google Scholar]
- Wei, H.L.; Qiu, Y.Y.; Sheng, Y. On the Cable Pseudo-Drag Problem of Cable-Driven Parallel Camera Robots at High Speeds. Robotica 2019, 37, 1695–1709. [Google Scholar] [CrossRef]
- Zhao, Z.; Wang, Y.; Li, J. Stability evaluation method of force, position and pose hybrid motion in multi-robot coordinated lifting system. J. Harbin Eng. Univ. 2018, 39, 148–155. [Google Scholar]
- Li, W.; Zhao, Z.; Zhao, X.; Li, Z.; Huang, Z. Evaluation on the Workspace Stability of Multi-robot Suspension System Based on Entropy Weight-TOPSIS. J. Beihang Univ. 2024, 50, 1–15. [Google Scholar] [CrossRef]
- Wang, Y.; Zhao, Z.; Su, C.; Li, J.; Ji, G. Analysis on the Workspace and Motion Stability of Under-constrained Multi-robot Coordinated Lifting and Transportation Systems. J. Vib. Shock. 2017, 36, 44–50. [Google Scholar]
- Yu, J.; Tao, J.; Wang, G.; Li, X.; Wang, H. Stability analysis and optimal design of a cable-driven parallel robot. Robot. Auton. Syst. 2024, 173, 104611. [Google Scholar] [CrossRef]
- Tan, H.; Muntashir, R.; Nurahmi, L.; Pramujati, B.; Kurniawan, A.; Wasiwitono, U.; Caro, S. Stability Analysis of a Reconfigurable and Mobile Cable-Driven Parallel Robot. IEEE Access 2024, 12, 14182–14193. [Google Scholar] [CrossRef]
- Seo, K.; Cho, S.; Kim, T.; Kim, H.S.; Kim, J. Design and stability analysis of a novel wall-climbing robotic platform (ROPE RIDE). Mech. Mach. Theory 2013, 70, 189–208. [Google Scholar] [CrossRef]
- Wang, Y.; Wang, K.; Chai, Y.; Mo, Z.; Wang, K. Research on Mechanical Optimization Methods of Cable-Driven Lower Limb Rehabilitation Training Robot. Robotica 2022, 40, 154–169. [Google Scholar] [CrossRef]
Disclaimer/Publisher’s Note: The statements, opinions and data contained in all publications are solely those of the individual author(s) and contributor(s) and not of MDPI and/or the editor(s). MDPI and/or the editor(s) disclaim responsibility for any injury to people or property resulting from any ideas, methods, instructions or products referred to in the content. |
© 2025 by the authors. Licensee MDPI, Basel, Switzerland. This article is an open access article distributed under the terms and conditions of the Creative Commons Attribution (CC BY) license (https://creativecommons.org/licenses/by/4.0/).