Abstract
Power converters can convert the electrical energy output by power source into specific forms required by target device. They are widely used in various fields such as electrification, transportation, and power systems, and are the core components of the systems. Power converters are composed of power semiconductor devices (such as IGBTs), which are prone to failure due to abnormal conditions and aging degradation, leading to power converter faults. Therefore, over the past twenty years, extensive fault diagnosis methods for power converters have been studied and proposed. Among them, symmetry-based methods have the characteristics of rapid diagnosis speed and strong robustness, but so far there’s no systemic summary of such methods. Therefore, this paper reviews the relevant research on fault diagnosis of power converters based on symmetry in recent years, analyzes the mathematical principles of these methods, and compares their diagnostic performance. In addition, two factors that may have an influence on the symmetry are pointed out. This paper provides references and suggestions for the future development and research of power converter fault diagnosis.
1. Introduction
Whether it is a spacecraft, high-speed train, or modern household appliance, power converters are needed to convert the power from the supply into electric energy with a specific amplitude, frequency, and other indicators that meet the requirements for use. Focusing on the research in this paper, “power converter” mainly refers to multi-phase rectifiers and inverters. Thanks to the development of power semiconductor devices and control technology, various topology power converters have been developed, meeting the needs of production and life [1]. However, at the same time, reliability has always been a major issue in converters, despite significant progress in the technology used for the preparation of power devices in recent decades. According to an industry-based survey, power transistors are the most fragile components in power converters [2,3].
Power transistor faults are mainly categorized as SC (short-circuit) and OC (open-circuit) faults. SC faults are often accompanied by overcurrent, which will trigger a circuit breaker, fuse, or other hardware-protection circuits immediately and are easy to detect. Whereas an OC fault will generally not cause the system to shutdown immediately, but degrade the system’s performance, such as by creating voltage unbalance, harmonic distortions, and system fluctuations [4,5]. Even worse, if not dealt with in a timely manner, such OC faults may lead to cascading failures or even system crashes, causing a loss of life and property [6]. Therefore, in recent decades, various methods for the diagnosis of OC faults in power converters have been proposed, especially for situations where reliability and safety are highly valued, such as in a traction converter [7,8].
The method for the diagnosis of power transistor OC faults in converters can be mainly divided into three categories: hardware-based, model-based, and signal-based methods. Hardware-based methods can detect and locate faults quickly but require additional devices such as sensors or circuits, which in turn limits the application of the method [9,10,11]. Model-based fault diagnosis methods usually establish mathematical models for power converters first and diagnose the fault by comparing the signal observed from the model with actual measured values [12,13,14]. These methods have a short diagnosis time but require knowledge and parameters related to system structure, operation model, and other aspects. Signal-based methods usually extract features first and then use these features to train the classifier or classify them directly by comparing the characteristic value with thresholds [6,15]. Requiring neither additional sensors nor precise models and parameters of the system, the signal-based methods have the advantage of a fast diagnostic speed and low computational complexity. This is a key step is the selection of diagnostic features. It should be pointed out that, although deep learning has developed rapidly in recent years, there are still many limitations in utilizing raw data as the input of classifiers due to the limited computing power of processors used in actual industrial scenarios [16].
Therefore, feature extraction is the key to signal-based fault diagnosis methods, which is also the core of most research in recent years [6,17]. If the features are well selected, good classification results can be obtained through a simple classifier; on the contrary, to achieve an equivalent performance, complex classifiers are required, and sometimes it is still difficult to obtain satisfactory results. This is because power converters often have limited information available for diagnosis, but the fault patterns are complex, making it difficult to effectively classify using a single, low dimensional feature. Taking a two-level three-phase inverter with an induction motor as an example, this is the most basic topology structure, but there are four categories and 21 types of single-transistor and double-transistor faults. In addition, the motor has a huge difference in current during the processes of starting, braking, load adjustment, acceleration, and deceleration, which can easily be confused with fault situations [18]. The power converters usually work in a complex electric-magnetic-mechanical-thermal coupling field, with numerous influencing factors. Therefore, selecting features with high discrimination is of great significance for power converter fault diagnosis. Many features, such as the average value, absolute value, effective value, skewness, kurtosis in the time domain, and the transformed coefficients such as Fourier transform and wavelet transform in the frequency domain, have been selected as features for diagnosis and have achieved certain results [19]. In addition, a widely adopted but not systematically studied feature is symmetry, which has achieved remarkable results in power converter fault diagnosis [20,21].
“Symmetry” means “the quality of being very similar or equal” or “the exact match in size and shape between two halves, parts or sides of something”. Symmetry is an important attribute of power converters. Whether it is a two-level, three-level, or multi-level converter, they all have a certain symmetry in structure. This topological symmetry means that the voltage/current output from each phase of the converter are also symmetrical, with only a specific phase angle difference [22]. But when there is a fault in the converter, the topological symmetry will be disrupted, and the symmetry of the output signals of each phase will also change accordingly [23]. So, how do we measure the change in symmetry? At present, though there is no formula for directly quantifying “symmetry”, extensive research has been conducted on “similarity”, “distance”, “entropy”, etc., and they are essentially a quantification of symmetry. The above methods of measuring symmetry and using it as a feature for diagnosis is collectively referred to as the “symmetry-based method” in this paper. Now comes the question, when there are more than ten methods for calculating distance, how do we choose which to use? And how effective are they in measuring the symmetry and diagnosing the faults? The above issues also exist when similarity and entropy are utilized to measure symmetry. In addition, are there any other methods for measuring symmetry? At present, some scholars have summarized and analyzed the methods use for diagnosing faults in power converters, which has promoted the development of research on diagnosing the faults in power converters [4,16,24]. In [4], a detailed analysis of the current path in NPC inverters under healthy and different fault conditions was conducted, and the performance of three types of diagnostic methods was summarized in depth. However, there is currently no literature that systematically summarizes the symmetry-based fault diagnosis methods.
Therefore, the main objective of this paper is to summarize the symmetry-based fault diagnosis methods that have been used for power converters. The main contributions are as follows:
- 1.
- Introduction and classification of the symmetry-based OC fault diagnostic methods for power converters;
- 2.
- The performance of some symmetry-based OC fault diagnostic methods are compared, and the advantages and disadvantages of distance, entropy, and similarity/correlation are summarized;
- 3.
- Two factors that may have an influence on the symmetry of power converters are analyzed, and other functions or methods that may be feasible for measuring symmetry are pointed out.
The paper is organized as follows. Section 2 presents an analysis of the symmetry in power converters. Section 3 presents the classification of the symmetry-based OC fault diagnosis method. The two aspects that have influence on symmetry and other feasible symmetry measurement methods are discussed in Section 4. Section 5 provides the conclusion to the overall paper.
2. Topology and Symmetry Analysis of Power Converters
2.1. Symmetry—A Common Property of Power Converters
Power conversion can usually be divided into four categories, namely rectification (AC-DC), inversion (DC-AC), chopping (DC-DC), and AC-AC conversion. As mentioned before, the power converters studied in this paper mainly include rectifiers and inverters. Figure 1 shows the topological structure of a variable frequency speed control system for an induction motor, which includes a rectifier and an inverter. The three-phase AC power provided by the left power supply is first converted into DC through the two-level rectifier, filtered by DC bus capacitors, and then converted into specific AC by the inverter to drive the induction motor (IM) on the right. Each phase of the power supply and IM corresponds to a leg, which is composed of two power transistors. The control system generates gate signals through control algorithms to control the conduction and shutdown of each power transistor, causing the inverter to generate a specific amplitude, frequency, and phase currents. In the healthy condition, the output three-phase currents , and are identical sine waves with only a phase angle difference of , so they are also called “three-phase symmetrical currents”. After the three-phase symmetrical currents pass through the symmetrical three-phase stator winding, a circular rotating magnetic field is generated, which drives the motor to rotate. This concise and elegant symmetrical design reduces system complexity, and improves output performance, which is of great significance [25].
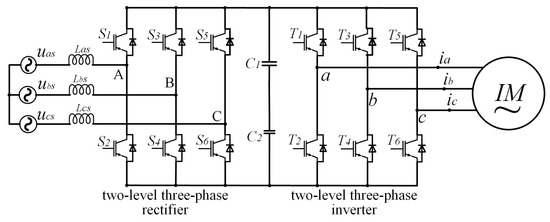
Figure 1.
A topological structure of variable frequency speed control system for induction motor, including a rectifier and an inverter.
In addition to two-level converters, symmetry is commonly present in power converters, as shown in the four types of three-level inverters in Figure 2, the multi-level cascaded inverters in Figure 3, and the matrix converters in Figure 4. In Figure 1, in terms of the overall structure, the two-level three-phase rectifier and the inverter are symmetrical, except that their input and output are exactly opposite. Within the inverter and rectifier, the legs corresponding to each phase are symmetrical, and for each leg, its upper and lower halves are also symmetrical. Compared to two-level power converters, three-level converters have multiple topologies. Figure 2 shows four typical three-level inverter topologies, namely, the neutral point clamped (NPC), the flying clamped capacitor (FC), the T-type, and the active neutral point clamped (ANPC) three-level inverter. Though different from each other, the four inverters are all highly symmetrical in structure. The same applies to other multi-level power converters, which have more diverse topological structures but always share the common property—symmetry.
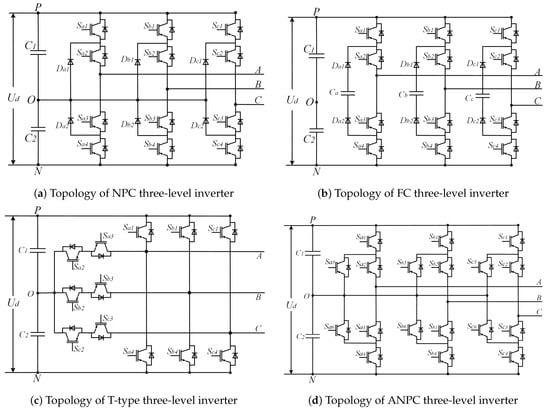
Figure 2.
The topological structures of four typical three-level inverters.
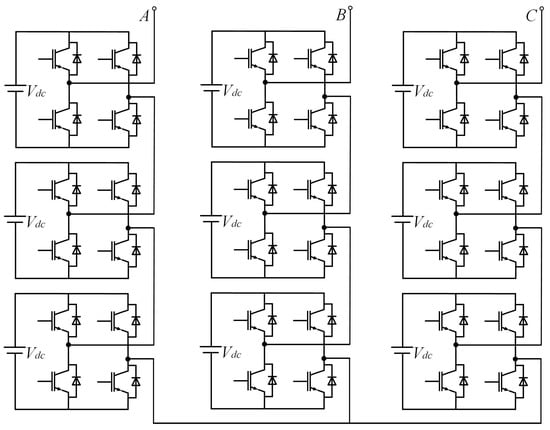
Figure 3.
A topological structure of cascaded H-bridge converter.

Figure 4.
Matrix converter.
2.2. Symmetry Analysis in Different Situations—Taking a Two-Level Three-Phase Voltage-Source-Inverter as an Example
The above shows the structures of power converters under healthy conditions. When an OC fault occurs in power transistors, the symmetry in the converter tends to change. And the degree of change varies with the number and location of the faulty transistors. As the symmetry in the topological structure cannot be directly quantified and measured, electrical signals such as voltage and current in the power converters are often collected in practical applications. The information about the symmetry of power converters is often contained in these collected time series. Taking the two-level three-phase inverter in Figure 1 as an example, a detailed analysis is conducted below.
Generally, unless there is a sharp decline in system performance or a shutdown, the three-phase currents in the inverter are periodic under both healthy and faulty conditions. Assuming that at instant t, the sampled three-phase current time series within a period is
where L is the number of sampling points within a fundamental current period T. m refers to a phase in the inverter. Let f be an abstract function for calculating the symmetry of time series, represents the symmetry between phase m and phase n, and .
Under healthy conditions, due to the fact that , , and are symmetrical sine waves, as shown in Figure 5a, then qualitatively the below formula holds,
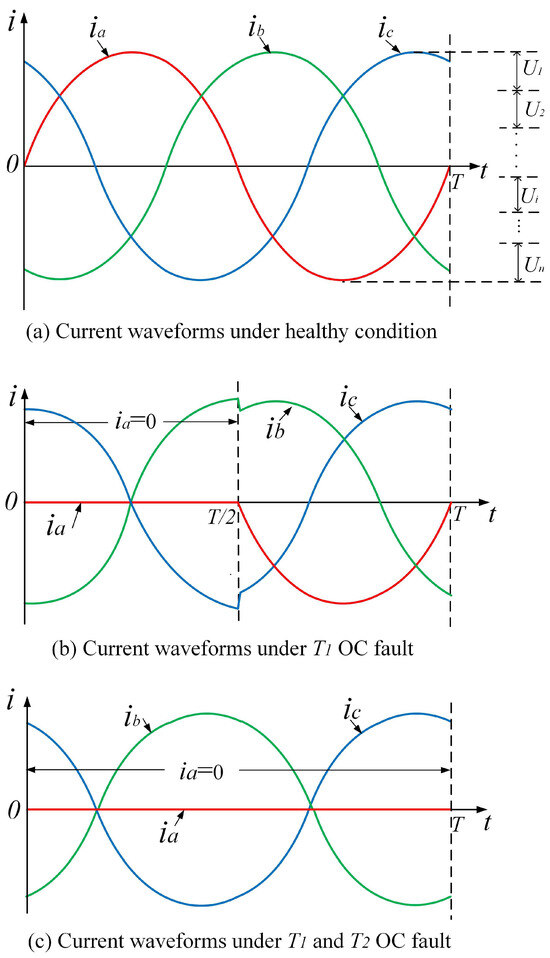
Figure 5.
Current waveforms of the inverter in different conditions.
When an OC fault occurs in a power transistor such as , the current waveform will be distorted. As shown in Figure 5b, in the later half of the period, it is ’s turn to work and should be turned off, so the OC fault has no impact on the output. While in the former half of the period, should have been working. But due to the OC fault, the actual output current in phase-a is 0. The waveforms of and will also undergo distortion due to the fault, but the degree of distortion is consistent and both are relatively small. Therefore,
When an OC fault occurs in a multi-transistor such as and , phase-a has no current in the whole period, namely , as shown in Figure 5c. According to Kirchhoff’s current law, . Therefore, . Thus, though the current in phase-b and phase-c have also undergone significant distortion, they are still symmetrical, with only opposite signs. And is always 0, without any symmetry with and . And there should be
Based on the above analysis, the symmetry of phase currents in power converters varies under healthy and different fault conditions. Therefore, symmetry can be used as a feature to distinguish different faults. Specifically, as mentioned before, distance, etc., have a clear quantitative calculation formula and are all essentially a quantification of symmetry. As such, these methods are summarized and analyzed in the next section.
3. Symmetry-Based Fault Diagnostic Methods for Power Converter
As pointed out in the introduction, symmetry is a relatively abstract concept and there is currently no direct quantitative calculation formula. In the field of power converter fault diagnosis, the distance, entropy, correlation/similarity, etc., in the timing signal are essentially a reflection of symmetry. The formulae for distance, entropy, and the correlation coefficient/similarity index can be seen as an instantiation of the abstract symmetric function f. Therefore, this paper will provide an overview of these three types of methods.
3.1. Distance-Based Diagnostic Methods
Distance plays a critical role in many problems such as clustering and classification. It is a good measurement of symmetry, and the higher the symmetry between two time series, the smaller the distance between them. Conversely, the lower the symmetry, the greater the distance.
- Euclidean Distance. Euclidean Distance (ED) is the most intuitive and widely used calculation formula for distance. Based on Equation (1), The ED between two current time series at instant t iswhere is equal to . In [26], based on zero-crossing-detection, the phase current of inverters were reconstructed and the ED between reconstructed signals under different health conditions was calculated. Then, a reasonable threshold was selected to detect the fault by comparing the distance with the threshold. This method has a low computational complexity and the diagnosis is very fast but the signal reconstruction may bring errors. In [21], the concept of “allelic points” was proposed, which was somewhat significant for power converter diagnosis. Its foundation is still based on ED and Bray–Curtis distance.Wavelet transform can remove noise from the signal, reduce the length of the sequence, and make the features more prominent. In [27], the phase current signals of inverters are decomposed by a wavelet into several layers. In layer k, after decomposition, the approximate component and the detail component were obtained, and they were both time series, containing a series of decomposed coefficients. Then was adopted as a measure of the energy in current signals. Finally, the ED between the energy sequences of each phase was calculated, and the fault was diagnosed by comparing this distance with the threshold. Under healthy conditions, although there are phase differences in the signals of each phase, due to symmetry, they have the same amplitude and period, and therefore contain the same energy. Therefore, the ED of the energy sequence is 0. When an OC fault occurs in a leg, compared to the healthy phase, the energy contained in the current in the corresponding phase will decrease due to a decrease in conduction time. Thanks to the excellent property of Wavelet transform, this paper achieved an accurate diagnosis of nine types of faults solely through ED.In addition, due to the limitation that ED is related to the amplitude of the signal, the standardized Euclidean distance (SED) has been proposed,Among them, is the standard deviation of the sequence , sometimes replaced by the amplitude of the signal for convenience. In [12], the “Euclidean similarity function” is used to measure the similarity between currents, which is also a variant of ED. ED and its variants have a wide range of applications.
- Manhattan Distance. Manhattan distance (MhtD), also known as the norm, is a measure of the distance between two points on the plane. The MhtD between time series and isIn [28], an effective diagnostic method based on the MhtD of armature current was proposed to diagnose the fault in the rotating rectifier. A similar method was also adopted in [29] and a reasonable comparison threshold for MhtD was selected through circuit model and symmetry analysis. In [15], the “similarity” between phase currents in three-phase inverters is analyzed and adopted to determine the location of the faulty leg. The “similarity” is calculated with the aid of the MhtD between normalized phase currents. The MhtD- and similarity-based fault diagnosis algorithm was implemented on the TMS320F2806 board. This paper demonstrates the significant advantages of a symmetry-based fault diagnosis method, which is fast, computationally efficient, and easy to implement in engineering. Since the similarity in the text is a reflection of symmetry, we also point out two properties of similarity:
- 1.
- symmetry
- 2.
- transitivity
- Cosine Distance. Cosine distance (CD) is the cosine value of the angle between two vectors in the same dimensional space. For time series and ,In [26], the final fault location is achieved by combining CD and ED. The range of CD is [−1,1]. A larger distance indicates a smaller angle between two vectors, while a smaller distance indicates a larger angle between two vectors. When the directions of two vectors coincide, , and when the directions of two vectors are completely opposite, . CD is independent of the modulus of the vector; that is, it is independent of the amplitude of the time series and is an excellent indicator for symmetry measurement.
- Mahalanobis Distance. Mahalanobis distance (MalD) was proposed by Indian statistician P. C. Mahalanobis as an effective method for calculating the distance between two multidimensional samples. Similar to standardized ED, MalD not only is scale-independent but also takes into account the connections between components. Consider the time series collected at instant t as a multidimensional sample, for time series and , there arewhere S is the covariance matrix of time series samples. In [30], the current and topological symmetry of the inverter were analyzed, and the normalized covariance between time series was selected to measure the symmetry of phase currents. This method has a high robustness and no misdiagnoses under various working conditions. But furthermore, a better diagnosis performance may be achieved if MalD is applied. Most power converters experience a degradation in the operation process before a fault occurs. For health monitoring and early fault diagnosis, extracting a unified and effective health index is the key issue. This is because the signals of power electronic circuits usually include various parameters in the time, frequency, and time–frequency domain, which have different dimensions and scales, making it difficult to determine the overall health status of the system through a single parameter. In [31], the MalD between multiple evaluation indexes and the mean of samples was calculated. Simulation experiments showed that MalD can effectively reflect the health condition of the converter.
A comparison is given in Table 1 for [15,21,26,27,30], all of which have the same research objectives. It can be seen that the distance-based methods have the advantage of high robustness and low computational cost. In addition, the common distance calculation methods include Chebyshev Distance, Minkowski Distance, Hamming Distance, Canberra Distance, etc. [32]. In [33], “fuzzy similarity”, which is a variant of Minkowski Distance, was used for fault diagnosis in dual buck inverter. But in summary, the researches on using these distances to measure the symmetry for fault diagnosis are few, which may be a feasible research point.

Table 1.
A comparison of distance-based fault diagnosis methods.
3.2. Entropy-Based Diagnostic Methods
Information entropy is a concept put forward by Shannon, it is applied to measure the uncertainty of information for a period of time [34]. Assuming that the phase current data generated by the inverter at each time point are random, then the data generated within a current period (i.e., time series ) contain L random samples. As is shown in Figure 5a, is divided into n sub-intervals , and is the frequency that belongs to . The information entropy contained in is
where X represents the event that L random samples were generated within one current period T from phase m of the power converter, represents (for simplification, the base 2 of the logarithm and () is omitted). The same applies below. Taking the two-level three-phase inverter in Figure 1 as an example, under normal circumstances, the three-phase symmetrical current only has phase differences, and its numerical distribution is the same. The information entropy of phase-m can be denoted as , there is . According to Figure 5b, when an OC fault occurs, the current waveform is distorted. The fault phase has the greatest distortion, and its current amplitude distribution range is only half of the original, so the degree of information entropy reduction is much greater than the other normal phases, namely . When an OC fault occurs in a multi transistor such as and , due to . According to Figure 5c, the current of phase-b and phase-c is not always 0, so . This is consistent with the symmetry analysis results in Section 2, indicating that entropy can effectively characterize the symmetry in the system.
- Information entropy. Information entropy is the basic form of entropy, and its calculation formula is Equation (12). In [35], based on topological symmetry, the information entropy of current in Neutral Point Clamped Asymmetric-Half-Bridge converter under normal and fault conditions was analyzed, and a normalized symmetry index was proposed to diagnose SC and OC faults. In [36], wavelet packet decomposition and empirical mode decomposition (EMD) were used to transform the current signals of high-speed railway traction inverters. Then, the information entropy of the decomposed coefficient sequence was extracted. Combining information entropy with some small improvements, the fault is accurately diagnosed within one current period. Similarly, in [37], discrete wavelet transform was applied to inverter bus voltage signals and the information entropy was calculated for diagnosis. While in [38], the short-term wavelet packet was adopted, and then the information entropy was calculated as the feature for further classification. Equation (12) is the first-order form of information entropy. As a higher-order extension, the Renyi entropy was introduced with an order parameter, as is shown below.In [17], the Renyi entropy is adopted in the feature selection process to deal with the hard fault and soft fault diagnosis in a superbuck converter circuit (SCC). The “signal decomposition+information entropy” based methods were also adopted in [39,40,41], demonstrating the simplicity and effectiveness of information entropy in fault diagnosis within multi-phase symmetric systems.
- Fuzzy Entropy. Fuzzy entropy is a method based on the concept of approximate entropy and sample entropy which can be to measure the complexity of a time series [34]. For a given time series composed of L data, , its Fuzzy entropy can be calculated as follows [42].Step 1. Divide into a group of sub-sequences with a length of .Step 2. Calculate the Chebyshev Distance between two sub-sequences and .Step 3. Calculate the similarity between and based on the Chebyshev Distance. Give parameters n and r. The similarity is defined asStep 4. Define the functionStep 5. The Fuzzy entropy of the time series is defined as:In [43], the phase voltage signal of the grid-connected inverter is decomposed by EMD, and the Fuzzy entropy of the decomposed signal is extracted. Then it is used as the input feature for support vector machine for fault classification, ultimately achieving high diagnostic accuracy. The drawback of Fuzzy entropy is that it requires extra parameters and is sensitive to parameters.
- Joint Entropy and Conditional Entropy. Entropy is also known as self-information. The information entropy and Fuzzy entropy of each phase only reflect the uncertainty/symmetry of its own phase current. But the converter is a whole composed of interconnected phases. As is shown in Figure 5, the fault in phase-a not only leads to the distortion of , but also causes distortion in and . And the degree of fault in phase-a varies, so does the impact on phase-b and phase-c. Considering these, conditional entropy, joint entropy, mutual information, etc. have been proposed. Their relationship is shown in Figure 6.
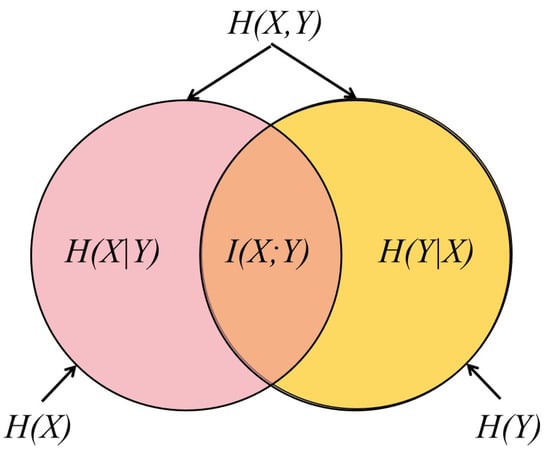 Figure 6. The relationship between information entropy, joint entropy, conditional entropy, and mutual information.Assuming X and Y are two correlated random events, their information entropy is and , respectively. Then, their joint entropy iswhere represents the sub event that belongs to . represents the sub event that belongs to and belongs to at the same time. Thus the conditional entropy is defined asIn [44], “mean conditional entropy” is proposed, which is actually an improved form of conditional entropy. The fault is diagnosed by extracting the conditional entropy between the two-phase currents of the inverter. Compared to information entropy, conditional entropy reflects the relationship between two phases and is a very effective measure of symmetry between phases.
 - Mutual information. As is shown in Figure 6, mutual information is a kind of entropy, which defines the degree of dependence between two almost random variables. It can be regarded as the amount of information about another random variable contained within a random variable, or in other words, the reduced uncertainty of a random variable due to the knowledge of another random variable. For two discrete random variables X and Y, their mutual information isBy analyzing the properties of conditional probability and combining Equations (19)–(22), it can be concluded thatIn [45], the mutual information between the phase currents was extracted, and then it was used as a feature dataset to train the classifier. This method achieves an effective diagnosis of motor bearing faults through mutual information of motor current signals, which is highly innovative and practical. One reason for the good performance of this study is that the motor itself and the inverter are both symmetrical structures, and both mechanical and electrical faults can cause symmetry to be disrupted. Mutual information effectively measures the symmetry of the system.
- Relative entropy. Relative entropy, also known as Kullback–Leibler Divergence, is used to measure the difference between the probability distributions of two random events. The larger the value, the greater the difference between the two probability distributions; when two probability distributions are completely equal, the relative entropy value is 0. For two random variables X and Y, the relative entropy between them is defined asIn [46], a relative entropy-based fault prognostic method was proposed for photovoltaic inverters. The relative entropy in this paper can be seen as a measure of the overall symmetry between inverters. For power transistor faults inside the converter, due to the fact that under healthy conditions, the current not only has a different phase but the same distribution, it is easy to infer that ( indicate the phase-m and phase-n of the converter). When there is a malfunction, the normal phase and the faulty phase are different, . Thus, compared to other forms of entropy, relative entropy has a unique advantage. In addition, the latter term in Equation (17) is usually known as “Cross Entropy”, which is often used as the cost function in machine learning. For two time series composed of phase currents, cross entropy can reflect the differences between them, indirectly reflecting the symmetry of power converters. Therefore, it can also be used for fault diagnosis.
“Entropy” has many other forms; they each have their strengths, and most of them can be used as a measurement of symmetry in power converter fault diagnosis. In [47], several kinds of entropy were analyzed and discussed, and the “multi-scale entropy” was proposed by integrating several of them. It is noted that single-scale entropy is unable to describe the complexity of the signal and does not distinguish the faults from different phases. While multi-scale analysis can fully describe the micro-structural complexity and amplitude information of the signal, making it more suitable for various time-series analyses. In addition to the ones mentioned above, commonly used entropy include Cross entropy, Fuzzy entropy, Bubble entropy, Phase Entropy, Jensen–Shannon Divergence, Entropy of entropy, etc. Morel, etc. [34] further summarized a dozen types of entropy comprehensively, and pointed out that some of them cannot be used for fault diagnosis. By introducing a mathematical model to help select the appropriate entropy functions with proper parameter values, good performance is obtained. The above researches indicate that entropy is highly useful in fault diagnosis of power converters, and there are still many issues that need to be further studied.
3.3. Similarity/Correlation-Based Diagnostic Methods
Similarity and correlation are two concepts similar to symmetry but with a broader meaning. In power converters, the correlation and similarity between its output signals come from the topological symmetry of the converter. When the topological symmetry of the converter changes due to faults, the similarity/correlation between the signals output by each phase of the converter will also change accordingly. Therefore, similarity/correlation are often extracted as features for fault diagnosis. The similarity/correlation-based methods mentioned in this section include methods based on various similarity indexes and correlation coefficients, as they are essentially a mapping of signal symmetry.
- Correlation. In statistics, various coefficients have been proposed to reflect the relationships between variables. For power converters, some coefficients such as Pearson’s correlation coefficient not only reflect the connections between signals, but also serve as a mapping of the symmetry of the signal source. Therefore, various coefficients have been adopted for fault diagnosis.For power converters, if it is symmetrical between each phase, the correlation between phase currents must be high. On the contrary, the converter may experience a decrease or even no correlation between the phases due to faults. In [48], an improved variational mode decomposition (VMD) method was proposed for the three-phase current signals to obtain an elementary function called the band-limited intrinsic mode functions (BLIMFs). Then the Pearson correlation coefficients between the original signals and theirs BLIMFs are utilized to detect and locate fault phase, ultimately promoting effective fault diagnosis. The Pearson correlation coefficient between two variables x and y is defined as the quotient of the covariance and standard deviation between the two variables [49]:Similarly to [48], the VMD + Pearson correlation coefficient-based method was also adopted in [50]. A variant form of the Pearson correlation coefficient was adopted in [20,26]. In [51], the correlations of voltage signals between various sub-modules of Modular multilevel converters (MMCs) were calculated to measure the symmetry between sub-modules. In the paper, the residual voltage was used for fault detection and the correlation coefficients were used for localization. The two-stage method is simple and practical.In [52], the gray relation analysis (GRA) theory was introduced to the field of inverter fault diagnosis and the “gray correlation” based on current signals was proposed. For converter power transistor OC fault diagnosis, set the current reference sequence as and the current comparison sequence as , then the formula for the calculation of gray correlation is:By comparing the gray correlation coefficients of the reference sequence and the comparison sequence, the fault was diagnosed. Compared to the Pearson correlation coefficient, the gray correlation coefficient is susceptible to the influence of outliers and extreme values. Therefore, from the results of this paper, it can be seen that the coefficients calculated under various faults are very similar, which may affect the accuracy of diagnosis. Various other coefficients have also been proposed in research [14,21,53,54], but they are not widely applied.
- Structural Similarity. In [55], structural similarity (SSIM) and contour similarity were successfully used for fault diagnosis in a T-type rectifier. SSIM was originally proposed for image similarity evaluation and has achieved great success in measuring image quality and classifying images [56]. Given two digital images x and y, the SSIM between the two images is calculated aswhere , are the mean of x and y; and are the variance of x and y, respectively; is the covariance of x and y; and are constants related to the pixel range of the image. If the time series is viewed as a one-dimensional image, an SSIM indicator can be applied, which well reflects the similarity between the two time series. Inspired by reference [55], there may be more indicators in image quality assessment, such as contrast, that may be applied to measure the similarity/symmetry of time series, which is worth further research.
- Distribution Similarity. In Section 3.2, the current generated at instant t is assumed to be a random variable, and therefore is a set of random variables with a one-dimensional distribution. In fact, information entropy can be considered as a statistical value of the distribution of random variables. In [57], the time series was transformed and expanded through Wigner–Ville distribution analysis, obtaining the two-dimensional distribution of the signal in the time-frequency domain. Then the two-dimensional distribution similarity between phase-a and phase-b was defined as Equation (29),where and are the two-dimensional distribution matrices of phase-a and phase-b, respectively. The time series samples under six kinds of single transistor faults are obtained. The fault was located by comparing the distribution similarity between the current sequence and each standard fault sample. The distribution similarity-based method is innovative, but the drawback is that it can only diagnose six types of faults.
In addition to the commonly used correlation coefficients/similarity indices mentioned above, there are many other coefficients used for power converter fault diagnosis. Taking the widely used kernel function in pattern recognition as an example, the Gaussian kernel function is
where and are two vectors of the same dimension, is bandwidth, controlling the radial range of action, and represents Euclidean distance. Similar to ED, for a time series composed of phase current and in a power converter, when there is no fault, the current signal is symmetrical. After removing the phase difference, it is obvious that . When there is a fault in the converter, even if the phase difference is removed, the current signal does not overlap, and . This is the principle of support vector machine (SVM)-based fault diagnosis methods. Therefore, k is a good indicator for measuring symmetry and is independent of signal amplitude. In this paper, it is defined as the “Gaussian kernel similarity” of the time series. In addition to Gaussian functions, there are many other functions that can serve as kernel functions, so many similar similarity/correlation coefficients can also be defined. In summary, methods based on correlation and similarity coefficients have certain advantages and are still being developed. Dozens of frequently used indexes and coefficients were introduced in [32], some of which may help measure symmetry and are worthwhile for research.
4. Discussion
The above introduces and summarizes three types of fault diagnosis methods related to symmetry–distance-based, entropy-based, and similarity/correlation-based diagnosis methods, each of which has its advantages and disadvantages.
The distance-based methods are simple, but they are dependent on signal amplitude. As was mentioned before, when the given values of motor speed and torque change, the period and amplitude of the current output by the inverter will also change accordingly. According to the calculation formula for distance, it is related to the length of the time series (the amount of data sampled within a period) and the amplitude of the signal. So, in some cases, distance-based methods may misdiagnose when the operating conditions change rapidly. Even if subsequent research adopts improvement measures such as amplitude normalization and resampling, the inherent shortcomings of distance-based methods cannot be completely eliminated.
The advantage of entropy is that it is independent of the length of the time series and mainly depends on the distribution form. Meanwhile, during a change in current amplitude, the corresponding range of will change, which may lead to fluctuations in entropy and misdiagnosis. When the inverter works in a stable working state after the change, the range corresponding to the will also change proportionally with the signal amplitude, and the entropy of the signal remains unchanged. Therefore, the impact of signal amplitude changes on entropy-based methods is relatively small.
The similarity/correlation-based methods are flexible to use, and are independent of the signal amplitude as their calculation formula itself contains an normalization process. But sometimes the discrimination of similarity/correlation is not very high. Meanwhile, the calculation of both distance and correlation/similarity require two time series to have the same length, while the entropy-based method does not have this problem.
A qualitative comparison of the advantages and disadvantages of the three types of methods are summarized in Table 2.
Table 2.
Comparison of the advantages and disadvantages of distance-based, entropy-based, and similarity-based diagnosis methods.
The common advantages of these three types of symmetry-based methods are their relatively small computational complexity, fast diagnosis, and ease of engineering application. Through reviewing relevant research, it has been found that there are still many forms of “distance”, “entropy”, “correlation coefficient”, and “similarity index” that have not been applied to power converter fault diagnosis, which are worthy of further research. Though these studies may not be original innovations, they are still incremental innovations with significance.
In addition, further research may be needed in the following two aspects.
- Symmetry under different time series lengths. In previous studies, the length of time series is usually chosen as the amount of current data sampled within a fundamental current period. However, analyzing the characteristics of the output signal of the power converter, it was found that the sequence length can actually be shorter. Taking the current of the inverter under healthy conditions as an example, redraw Figure 5a as shown in the Figure 7.
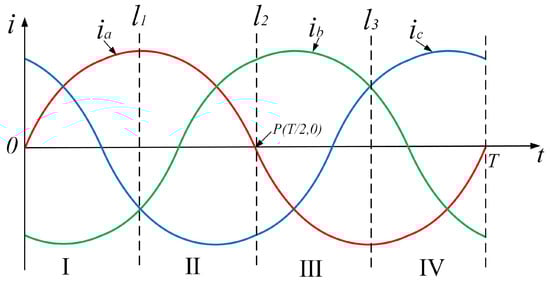 Figure 7. Current waveforms under healthy condition for analysis.Divide the current in a period T into four sub-intervals I, II, III, and IV, with each interval length . Dashed lines , , and are the dividing lines of the interval. For current signals in phase-a, the waveforms located in sub intervals I and II are symmetrical with symmetry axis . While the current waveform in intervals II and III is centrally symmetrical about , and so is the waveform in the former half and the latter half in a period. This paper refers to them as “quarter-wave symmetry (QWS)” and “half-wave symmetry (HWS)”, respectively. Moreover, in the healthy condition, in terms of the time dimension, the current waveform in the latter period is the same as or symmetrical to the previous one. Therefore, not only are the three-phase currents symmetrical, but each phase current itself is also symmetrical. Previous studies have mostly focused on the symmetry between currents in two phases, with less research on the symmetry of the current itself, which may be a worthwhile direction for further investigation.
 - The influence of reference frame on symmetry. In the time–current coordinate system, as shown in Figure 5, the current waveform is half-wave symmetrical under healthy conditions but asymmetric when a fault occurs. But if the three-phase currents are transformed into the - coordinate through Clark transformation, things will be different. The formula of Clark transformation is given in Equation (31), where k is a proportional coefficient. Clark transformation can transform the current in the three-phase abc coordinate system into the Cartesian coordinate system. Figure 8 shows the current trajectories in - coordinate under different conditions [58,59]. It can be seen that the waveforms of current trajectories under fault conditions are still symmetrical. Fault diagnosis can be performed through the axis of symmetry/center of symmetry. In the two-dimensional current–current coordinate system, the current trajectories are symmetrical for some types of faults, while others are not [60]. Therefore, it can be concluded that the symmetry is related to the reference frame, and the symmetry under different reference frames is also worth further research.
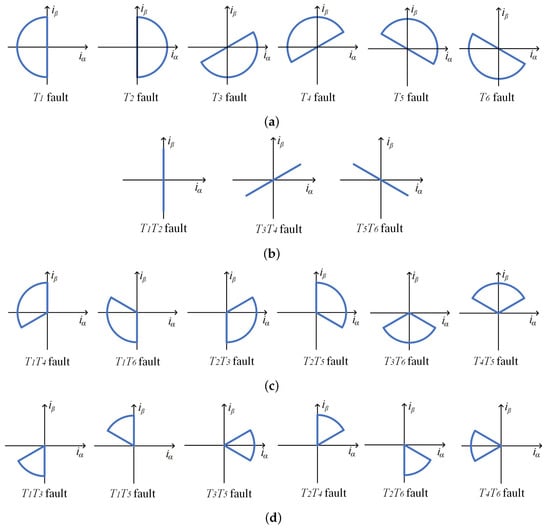 Figure 8. The current trajectories in - coordinate of a two-level three-phase inverter under four types of faults. (a) Single-transistor OC fault. (b) Double-transistor OC fault on the same leg. (c) Double-transistor OC fault on different leg (one is in the upper, the other in the lower). (d) Double-transistor OC fault occur on different leg (both are in the upper or lower).
5. Conclusions
With the widespread application of various power converters and the increasing demand for system reliability, diagnosing faults in power converters is becoming increasingly important. Symmetry is a widely present characteristic in power converters with various topological structures. Many methods such as the distance-based, entropy-based, and similarity/correlation-based diagnosis methods are essentially based on symmetry but have not been summarized and reviewed before. This paper summarizes these methods and compares their performance. Two aspects that need to be studied in the diagnosis of faults in power converters based on symmetry are pointed out. In addition to the above three types of methods, if the phase current signals are converted into a two-dimensional matrix, the rank of the matrix may be regarded as a abstract symmetric function. This may have good application prospects in multiphase multilevel power converters. In conclusion, compared to general time-domain and frequency-domain features, symmetry is directly related to the topology of power converters and contains more information. And symmetry-based fault diagnosis methods will play an increasingly important role in power converter fault diagnosis.
Author Contributions
Conceptualization and methodology, Y.Z. and J.Z.; investigation and writing—original draft preparation, Y.Z.; writing—review and editing, Z.W.; supervision and funding acquisition, J.Z. All authors have read and agreed to the published version of the manuscript.
Funding
This research was funded by the National Natural Science Foundation of China under Grant 62073147 and 61573159.
Data Availability Statement
Not applicable.
Conflicts of Interest
The authors declare no conflicts of interest.
References
- Lu, B.; Sharma, S. A Literature Review of IGBT Fault Diagnostic and Protection Methods for Power Inverters. IEEE Trans. Ind. Appl. 2009, 45, 1770–1777. [Google Scholar] [CrossRef]
- Yang, S.; Bryant, A.; Mawby, P.; Xiang, D.; Ran, L.; Tavner, P. An Industry-Based Survey of Reliability in Power Electronic Converters. IEEE Trans. Ind. Appl. 2011, 47, 1441–1451. [Google Scholar] [CrossRef]
- Wang, H.; Liserre, M.; Blaabjerg, F. Toward Reliable Power Electronics: Challenges, Design Tools, and Opportunities. IEEE. Ind. Electron. Mag. 2013, 7, 17–26. [Google Scholar] [CrossRef]
- Mullali Kunnontakath Puthiyapurayil, M.R.; Nadir Nasirudeen, M.; Saywan, Y.A.; Ahmad, M.W.; Malik, H. A Review of Open-Circuit Switch Fault Diagnostic Methods for Neutral Point Clamped Inverter. Electronics 2022, 11, 3169. [Google Scholar] [CrossRef]
- Brunson, C.; Empringham, L.; De Lillo, L.; Wheeler, P.; Clare, J. Open-Circuit Fault Detection and Diagnosis in Matrix Converters. IEEE Trans. Power Electron. 2015, 30, 2840–2847. [Google Scholar] [CrossRef]
- Zhou, Y.; Zhao, J.; Song, Y.; Sun, J.; Fu, H.; Chu, M. A Seasonal-Trend-Decomposition-Based Voltage-Source-Inverter Open-Circuit Fault Diagnosis Method. IEEE Trans. Power Electron. 2022, 37, 15517–15527. [Google Scholar] [CrossRef]
- Binu, D.; Kariyappa, B. A Survey on Fault Diagnosis of Analog Circuits: Taxonomy and State of the Art. AEU Int. J. Electron. Commun. 2017, 73, 68–83. [Google Scholar] [CrossRef]
- Ge, X.; Pu, J.; Gou, B.; Liu, Y.C. An Open-Circuit Fault Diagnosis Approach for Single-Phase Three-Level Neutral-Point-Clamped Converters. IEEE Trans. Power Electron. 2018, 33, 2559–2570. [Google Scholar] [CrossRef]
- Kim, T.-J.; Lee, W.-C.; Hyun, D.-S. Detection Method for Open-Circuit Fault in Neutral-Point-Clamped Inverter Systems. IEEE Trans. Ind. Electron. 2009, 56, 2754–2763. [Google Scholar] [CrossRef]
- Li, Z.; Wheeler, P.; Watson, A.; Costabeber, A.; Wang, B.; Ren, Y.; Bai, Z.; Ma, H. A Fast Diagnosis Method for Both IGBT Faults and Current Sensor Faults in Grid-Tied Three-Phase Inverters With Two Current Sensors. IEEE Trans. Power Electron. 2020, 35, 5267–5278. [Google Scholar] [CrossRef]
- Li, Z.; Gao, Y.; Zhang, X.; Wang, B.; Ma, H. A Model-Data-Hybrid-Driven Diagnosis Method for Open-Switch Faults in Power Converters. IEEE Trans. Power Electron. 2021, 36, 4965–4970. [Google Scholar] [CrossRef]
- Yang, C.; Gui, W.; Chen, Z.; Zhang, J.; Peng, T.; Yang, C.; Karimi, H.R.; Ding, S.X. Voltage Difference Residual-Based Open-Circuit Fault Diagnosis Approach for Three-Level Converters in Electric Traction Systems. IEEE Trans. Power Electron. 2020, 35, 3012–3028. [Google Scholar] [CrossRef]
- Wang, B.; Li, Z.; Bai, Z.; Krein, P.T.; Ma, H. A Voltage Vector Residual Estimation Method Based on Current Path Tracking for T-Type Inverter Open-Circuit Fault Diagnosis. IEEE Trans. Power Electron. 2021, 36, 13460–13477. [Google Scholar] [CrossRef]
- Xu, S.; Huang, W.; Wang, H.; Zheng, W.; Wang, J.; Chai, Y.; Ma, M. A Simultaneous Diagnosis Method for Power Switch and Current Sensor Faults in Grid-Connected Three-Level NPC Inverters. IEEE Trans. Power Electron. 2023, 38, 1104–1118. [Google Scholar] [CrossRef]
- Hang, C.; Ying, L.; Shu, N. Transistor Open-Circuit Fault Diagnosis in Two-Level Three-Phase Inverter Based on Similarity Measurement. Microelectron. Reliab. 2018, 91, 291–297. [Google Scholar] [CrossRef]
- Moradzadeh, A.; Mohammadi-Ivatloo, B.; Pourhossein, K.; Anvari-Moghaddam, A. Data Mining Applications to Fault Diagnosis in Power Electronic Systems: A Systematic Review. IEEE Trans. Power Electron. 2022, 37, 6026–6050. [Google Scholar] [CrossRef]
- Wang, L.; Lyu, F.; Su, Y.; Yue, J. Kernel Entropy-Based Classification Approach for Superbuck Converter Circuit Fault Diagnosis. IEEE Access 2018, 6, 45504–45514. [Google Scholar] [CrossRef]
- Sun, X.; Song, C.; Zhang, Y.; Sha, X.; Diao, N. An Open-Circuit Fault Diagnosis Algorithm Based on Signal Normalization Preprocessing for Motor Drive Inverter. IEEE Trans. Instrum. Meas. 2023, 72, 3513712. [Google Scholar] [CrossRef]
- Wang, Z.; Huang, Z.; Song, C.; Zhang, H. Multiscale Adaptive Fault Diagnosis Based on Signal Symmetry Reconstitution Preprocessing for Microgrid Inverter Under Changing Load Condition. IEEE Trans. Smart Grid 2018, 9, 797–806. [Google Scholar] [CrossRef]
- Wu, F.; Zhao, J.; Liu, Y. Symmetry-analysis-based Diagnosis Method with Correlation Coefficients for Open-circuit Fault in Inverter. Electron. Lett. 2015, 51, 1688–1690. [Google Scholar] [CrossRef]
- Wu, F.; Zhao, J. A Real-Time Multiple Open-Circuit Fault Diagnosis Method in Voltage-Source-Inverter Fed Vector Controlled Drives. IEEE Trans. Power Electron. 2016, 31, 1425–1437. [Google Scholar] [CrossRef]
- Huang, W.; Du, J.; Hua, W.; Fan, Q. An Open-Circuit Fault Diagnosis Method for PMSM Drives Using Symmetrical and DC Components. Chin. J. Electr. Eng. 2021, 7, 124–135. [Google Scholar] [CrossRef]
- Udovichenko, A.; Grishanov, E.; Kosykh, E.; Mekhtiyev, A. Analysis of Novel Energy-Efficient Converters to Ensure the Required Quality of Electrical Energy. Symmetry 2023, 15, 2092. [Google Scholar] [CrossRef]
- Hu, K.; Liu, Z.; Yang, Y.; Iannuzzo, F.; Blaabjerg, F. Ensuring a Reliable Operation of Two-Level IGBT-Based Power Converters: A Review of Monitoring and Fault-Tolerant Approaches. IEEE Access 2020, 8, 89988–90022. [Google Scholar] [CrossRef]
- Hinov, N. An Innovative Design Approach for Resonant DC/AC Converters, Based on Symmetry in Their Operating Modes. Symmetry 2023, 15, 1864. [Google Scholar] [CrossRef]
- Wu, F.; Zhao, J. Current Similarity Analysis-Based Open-Circuit Fault Diagnosis for Two-Level Three-Phase PWM Rectifier. IEEE Trans. Power Electron. 2017, 32, 3935–3945. [Google Scholar] [CrossRef]
- Wu, F.; Hao, Y.; Zhao, J.; Liu, Y. Current Similarity Based Open-Circuit Fault Diagnosis for Induction Motor Drives with Discrete Wavelet Transform. Microelectron. Reliab. 2017, 75, 309–316. [Google Scholar] [CrossRef]
- Zhu, P.; Liu, Y.; Fan, B. Fault Diagnosis of the Rotating Rectifier Diode Over a TSSM Based on the Armature Current Calculation and Similarity Measurement. IEEE Access 2022, 10, 48031–48038. [Google Scholar] [CrossRef]
- Wei, Z.; Liu, W.; Pang, J.; Jiao, N.; Sun, C. Open Circuit Fault Diagnosis of Rotating Rectifier Based on the Polarity and Symmetry of Armature Current. In Proceedings of the 2018 IEEE Energy Conversion Congress and Exposition (ECCE), Portland, OR, USA, 23–27 September 2018; pp. 1770–1775. [Google Scholar] [CrossRef]
- Yang, H.; Zhou, Y.; Zhao, J. Current Covariance Analysis-Based Open-Circuit Fault Diagnosis for Voltage-Source-Inverter-Fed Vector-Controlled Induction Motor Drives. J. Power Electron. 2020, 20, 492–500. [Google Scholar] [CrossRef]
- Fan, J.; Wang, Y.; Si, T.; Chang, S. Health Assessment of Two-stage Inverter Based on Multiple Evaluation Indexes Feature Optimization Model and Mahalanobis Distance. In Proceedings of the 2020 11th International Conference on Prognostics and System Health Management (PHM-2020 Jinan), Jinan, China, 23–25 October 2020; pp. 122–125. [Google Scholar] [CrossRef]
- Choi, S.S.; Cha, S.H.; Tappert, C.C. A Survey of Binary Similarity and Distance Measures. JSCI 2010, 8, 43–48. [Google Scholar]
- Huang, J.; Gao, Y. Converter Fault Diagnosis Method Based on Principal Component Analysis Combined with Improved Similarity Classifier. In Proceedings of the 2019 Chinese Automation Congress (CAC), Hangzhou, China, 22–24 November 2019; pp. 5051–5054. [Google Scholar] [CrossRef]
- Morel, C.; Rivero, S.; Le Gueux, B.; Portal, J.; Chahba, S. Currents Analysis of a Brushless Motor with Inverter Faults—Part I: Parameters of Entropy Functions and Open-Circuit Faults Detection. Actuators 2023, 12, 228. [Google Scholar] [CrossRef]
- Amaral, T.G.; Fernão Pires, V.; Foito, D.; Cordeiro, A.; Rocha, J.I.; Chaves, M.; Pires, A.J.; Martins, J.F. A Fault Detection and Diagnosis Method Based on the Currents Entropy Indexes for the SRM Drive with a Fault Tolerant Multilevel Converter. IEEE Trans. Ind. Appl. 2023, 60, 520–531. [Google Scholar] [CrossRef]
- Hu, K.; Liu, Z.; Lin, S. Wavelet Entropy-Based Traction Inverter Open Switch Fault Diagnosis in High-Speed Railways. Entropy 2016, 18, 78. [Google Scholar] [CrossRef]
- Ismail, A.; Saidi, L.; Sayadi, M. Wind Turbine Power Converter Fault Diagnosis Using DC-link Voltage Time–Frequency Analysis. Wind Eng. 2019, 43, 329–343. [Google Scholar] [CrossRef]
- Han, Y.; Qi, W.; Ding, N.; Geng, Z. Short-Time Wavelet Entropy Integrating Improved LSTM for Fault Diagnosis of Modular Multilevel Converter. IEEE Trans. Cybern. 2022, 52, 7504–7512. [Google Scholar] [CrossRef]
- Ubale, M.; Dhumale, R.B.; Dixit, V.V.; Lokhande, D.S.D. Method of Open Switch Fault Detection in Three Phase Inverter Using Artificial Neural Network. Int. J. Res. Sci. Adv. Technol. 2013, 3, 78–85. [Google Scholar]
- Wu, Y.; Zhang, Z.; Li, Y.; Sun, Q. Open-Circuit Fault Diagnosis of Six-Phase Permanent Magnet Synchronous Motor Drive System Based on Empirical Mode Decomposition Energy Entropy. IEEE Access 2021, 9, 91137–91147. [Google Scholar] [CrossRef]
- Bai, X.; Li, M.; Di, Z.; Dong, W.; Liang, J.; Zhang, J.; Sun, H. Open Circuit Fault Diagnosis of Wind Power Converter Based on VMD Energy Entropy and Time Domain Feature Analysis. Energy Sci. Eng. 2023, 1–19. [Google Scholar] [CrossRef]
- Deng, W.; Zhang, S.; Zhao, H.; Yang, X. A Novel Fault Diagnosis Method Based on Integrating Empirical Wavelet Transform and Fuzzy Entropy for Motor Bearing. IEEE Access 2018, 6, 35042–35056. [Google Scholar] [CrossRef]
- Liang, J.; Zhang, K. A New Hybrid Fault Diagnosis Method for Wind Energy Converters. Electronics 2023, 12, 1263. [Google Scholar] [CrossRef]
- Zhao, C.; Li, X. A Simple Fault Diagnosis Method for Power Switch System Based on Mean Conditional Entropy. In Proceedings of the 2021 33rd Chinese Control and Decision Conference (CCDC), Kunming, China, 22–24 May 2021; pp. 5397–5401. [Google Scholar] [CrossRef]
- Bazan, G.H.; Scalassara, P.R.; Endo, W.; Goedtel, A. Information Theoretical Measurements From Induction Motors Under Several Load and Voltage Conditions for Bearing Faults Classification. IEEE Trans. Ind. Inform. 2020, 16, 3640–3650. [Google Scholar] [CrossRef]
- He, Z.; Zhang, X.; Liu, C.; Han, T. Fault Prognostics for Photovoltaic Inverter Based on Fast Clustering Algorithm and Gaussian Mixture Model. Energies 2020, 13, 4901. [Google Scholar] [CrossRef]
- Morel, C.; Akrad, A. Open-Circuit Fault Detection and Location in AC-DC-AC Converters Based on Entropy Analysis. Energies 2023, 16, 1959. [Google Scholar] [CrossRef]
- Abdelkader, R.; Cherif, B.D.E.; Bendiabdellah, A.; Kaddour, A. An Open-circuit Faults Diagnosis Approach for Three-Phase Inverters Based on an Improved Variational Mode Decomposition, Correlation Coefficients and Statistical Indicators. IEEE Trans. Instrum. Meas. 2022, 71, 3510109. [Google Scholar] [CrossRef]
- Yang, D.; Pang, Y.; Zhou, B.; Li, K. Fault Diagnosis for Energy Internet Using Correlation Processing-Based Convolutional Neural Networks. IEEE Trans. Syst. Man, Cybern. Syst. 2019, 49, 1739–1748. [Google Scholar] [CrossRef]
- Abdelkader, R.; Chérif, B.D.E.; Bendiabdellah, A.; Kaddour, A. Three-Phase Inverters Open-Circuit Faults Diagnosis Using an Enhanced Variational Mode Decomposition, Wavelet Packet Analysis, and Scalar Indicators. Electr. Eng. 2022, 104, 4477–4489. [Google Scholar] [CrossRef]
- Zhou, D.; Qiu, H.; Yang, S.; Tang, Y. Submodule Voltage Similarity-Based Open-Circuit Fault Diagnosis for Modular Multilevel Converters. IEEE Trans. Power Electron. 2019, 34, 8008–8016. [Google Scholar] [CrossRef]
- Zhang, Y.; Guo, C.; Ma, L. Inverter Fault Diagnosis Based on Improved Grey Correlation Analysis. In Intelligent Robotics; Yu, Z., Hei, X., Li, D., Song, X., Lu, Z., Eds.; Springer Nature Singapore: Singapore, 2023; Volume 1770, pp. 228–236. [Google Scholar] [CrossRef]
- Rothenhagen, K.; Fuchs, F. Performance of Diagnosis Methods for IGBT Open Circuit Faults in Three Phase Voltage Source Inverters for AC Variable Speed Drives. In Proceedings of the 2005 European Conference on Power Electronics and Applications, Dresden, Germany, 11–14 September 2005. [Google Scholar] [CrossRef]
- Amaral, T.G.; Pires, V.F.; Pires, A.J.; Martins, J.F.; Chen, H. Power Transistor Fault Diagnosis in SRM Drives Based on Indexes of Symmetry. In Proceedings of the 2018 16th Biennial Baltic Electronics Conference (BEC), Tallinn, Estonia, 8–10 October 2018. [Google Scholar] [CrossRef]
- Wu, Z.; Zhao, J. Open-Circuit Fault Diagnosis Method for Grid-Connected Bidirectional T-Type Converter Based on Geometrical Similarity Measurement. IEEE Trans. Power Electron. 2022, 37, 15571–15582. [Google Scholar] [CrossRef]
- Wang, Z.; Bovik, A.; Sheikh, H.; Simoncelli, E. Image Quality Assessment: From Error Visibility to Structural Similarity. IEEE Trans. Image Process. 2004, 13, 600–612. [Google Scholar] [CrossRef] [PubMed]
- Rongjie, W.; Yiju, Z.; Meiqian, C.; Haifeng, Z. Fault Diagnosis Technology Based on Wigner–Ville Distribution in Power Electronics Circuit. Int. J. Electron. 2011, 98, 1247–1257. [Google Scholar] [CrossRef]
- Kim, J.M.; Lee, K.B.; Lee, D.C.; Ko, Y.J. Fault Diagnosis of Three-Parallel Voltage-Source Converter for a High-Power Wind Turbine. IET Power Electron. 2012, 5, 1058–1067. [Google Scholar] [CrossRef]
- Huang, C.; Wu, F.; Zhao, J.; Zhou, D. A Novel Fault Diagnosis Method in SVPWM Voltage-Source Inverters for Vector Controlled Induction Motor Drives. Int. J. Appl. Electromagn. Mech. 2016, 50, 97–111. [Google Scholar] [CrossRef]
- Wu, X.; Tian, R.; Cheng, S.; Chen, T.; Tong, L. A Nonintrusive Diagnostic Method for Open-Circuit Faults of Locomotive Inverters Based on Output Current Trajectory. IEEE Trans. Power Electron. 2018, 33, 4328–4341. [Google Scholar] [CrossRef]
Disclaimer/Publisher’s Note: The statements, opinions and data contained in all publications are solely those of the individual author(s) and contributor(s) and not of MDPI and/or the editor(s). MDPI and/or the editor(s) disclaim responsibility for any injury to people or property resulting from any ideas, methods, instructions or products referred to in the content. |
© 2024 by the authors. Licensee MDPI, Basel, Switzerland. This article is an open access article distributed under the terms and conditions of the Creative Commons Attribution (CC BY) license (https://creativecommons.org/licenses/by/4.0/).