Article

Revisiting the Absolute Configuration of Peyssonnoside A Using Vibrational Circular Dichroism Spectroscopy

by
Andrew R. Puente
1,
Bhuwan Khatri Chhetri
2,
Julia Kubanek
2 and
Prasad L. Polavarapu
1,*
1
Department of Chemistry, Vanderbilt University, Nashville, TN 37235, USA
2
School of Chemistry and Biochemistry, Georgia Institute of Technology, Atlanta, GA 30332, USA
*
Author to whom correspondence should be addressed.
Symmetry 2024, 16(2), 133; https://doi.org/10.3390/sym16020133
Submission received: 25 December 2023 / Revised: 14 January 2024 / Accepted: 18 January 2024 / Published: 23 January 2024

Abstract

:
Peyssonnoside A is an unusual natural product consisting of a diterpene unit and a sulfonated monosaccharide. The experimental and theoretical comparison of Optical Rotatory Dispersion (ORD) and quantitative Nuclear Magnetic Resonance (NMR) data provided strong evidence for the stereochemistry of the diterpene unit. However, predicted Vibrational Circular Dichroism (VCD) spectra of Peyssonnoside A at the B3LYP/6-311++G(2d,2p) level showed poor correlation to the corresponding experimental spectra, preventing independent absolute configuration (AC) determination from VCD analysis. New calculations using the B3PW91 functional and the 6-311G(3df,2pd) basis set suggest that we can now independently and confidently assign the AC of Peyssonnoside A through VCD analyses. The use of f-polarization functions is responsible for the current successful assignment, compared to previously failed VCD analysis. This study highlights two important points: (a) the importance of using multiple levels of theories for satisfactorily reproducing the experimental spectra and (b) for quantitative comparisons using similarity indices, it is important to consider not only the VCD spectra but also the corresponding absorption spectra.

1. Introduction

Chiroptical spectroscopy facilitates the determination of absolute configurations (ACs) of chiral molecules by making use of the differential response of chiral molecules to left vs. right circularly polarized light. Different techniques, each governed by a different phenomenon, fall under the banner of chiroptical spectroscopy. They include Electronic Circular Dichroism (ECD), Fluorescence Detected Circular Dichroism (FDCD), Optical Rotatory Dispersion (ORD) (which constitutes Optical Rotation (OR) at multiple wavelengths), Vibrational Circular Dichroism (VCD) and Vibrational Raman Optical Activity (VROA). The former three are based on electronic transitions, while the latter two are based on vibrational transitions of chiral molecules. Chiroptical spectroscopic methods are nondestructive and do not require chemical derivatization, provided one has enough samples for the experimental measurements. The challenge of obtaining well-diffracting single crystals needed for X-ray diffraction studies is also avoided. These advantages make chiroptical spectroscopy suitable for the AC determination of a variety of organic and inorganic chiral compounds, biologically relevant peptides and proteins, and natural products and also for studying solute–solvent interactions [1,2]. The reader is encouraged to refer to the books [3,4,5,6] and review articles [7,8] available on these methods, and the suggestions [9,10] for theoretical predictions of chiroptical spectra.
For scientific inquiry, it is helpful to be aware of other useful techniques that do not depend on the differential response to circularly polarized light for probing chiral molecules. Such techniques include Nuclear Magnetic Resonance (NMR) and Microwave Rotational Resonance (MRR) [11], which is also referred to as microwave three-wave mixing (M3WM) [12] spectroscopy. For the former method, the chiral sample of interest is converted to a diastereomer by complexing it with another chiral sample of known AC and then studied in the solution phase. While the NMR method has been in use for several decades, recent developments in the prediction of chemical shifts have shed new light on it [13]. MRR spectroscopy is applicable only to gas phase samples, where a weak complex with a chiral tag of known AC has to be used. In the MRR method, since solid/liquid samples have to be vaporized for gas phase measurements, it may not be possible to recover the used sample.
The AC determination of natural products is nontrivial due to their size, conformational freedom and the limited availability of samples. OR measurements at 589 nm and ECD measurements are the most commonly used chiroptical spectroscopic methods for AC determination of natural products, because OR at 589 nm is easy to measure and most natural products have appropriate ECD chromophores in the visible region. Vibrational Circular Dichroism (VCD) and Vibrational Raman Optical Activity (VROA), the chiroptical versions of infrared (IR) and Raman spectroscopies, have become more popular in recent years. In VCD and VROA, the vibrational transitions serve as chromophores and provide rich information that can be used to assign the AC. The reader is encouraged to consult the reviews available for AC determination of natural products [14,15,16,17,18,19]. AC assignment by chiroptical spectroscopic investigations relies on a thorough characterization of the low-energy conformations via quantum chemical (QC) methods. Otherwise, key experimental features that have to be compared in order to assign the AC may not be satisfactorily reproduced by the employed molecular model [9,17,20]. Generally, it is important to use as many chiroptical spectroscopic methods as possible, as sometimes a given method may not be able to successfully differentiate between enantiomers [21].
Diterpenes are one class of natural product molecules that have benefited extensively from the use of chiroptical spectroscopies in structural elucidation. They include ECD, VCD and X-ray structural investigations of Incensfuran [22], the VCD investigation of Bifurcatriol [23], ECD and VCD investigations of Andrographolide [24], the ECD investigation of Aphamines A–C [25] and the ECD study of Taxodinoid A [26].
The present work focuses on the application of VCD and ORD for Peyssonnoside A, which is an unusual diterpene glycoside that is highly substituted and features a sterically encumbered cyclopropane ring within the diterpene unit [27]. The relative configuration of the diterpene unit was determined by ROESY and HSQC–ROESY NMR data, leading to two possible diastereomers for Peyssonnoside A, 1 and 2 (Figure 1). Evidence for the AC assignment of Peyssonnoside A was obtained by quantitative ROESY [28] data using the glycoside unit as an internal probe [29] of the stereochemistry of the attached diterpene unit [27]. DFT predicted DP4+ probabilities [30] and Optical Rotatory Dispersion (ORD) at the B3LYP/6-311++G (2d,2p) level [27] also pointed to the AC assignment of 1. However, VCD predictions, at the same level used for ORD and DP4+, had a poor correlation to the corresponding experimental spectra [27]. Since that report, two total syntheses of Peyssonnoside A have been reported in the literature, making it clear that this unusual molecule has captured the attention of synthetic chemists [31,32]. These studies further confirm the AC assignment made by ORD and DP4+ correlations. However, since erroneous stereochemical assignments are usually not caught until their total synthesis [13,18,33], chiroptical spectroscopic investigations and their reliability are worthwhile.
One unique feature of Peyssonnoside A is the sulfonated saccharide unit. Recent work suggests that the S=O symmetric and antisymmetric stretching vibrational frequencies display a significant basis set dependence, resulting in red-shifted S=O stretches in the vibrational absorption (VA) and VCD spectra, if f-polarization functions are not included on the sulfur atom [34]. Since previous VCD analysis [27] did not include f-polarization functions, we now investigate their influence on the predicted VCD spectra of Peyssonnoside A using the B3PW91 functional [35,36]. The B3LYP and B3PW91 functionals are known to do well in predicting the VCD spectra [37,38].

2. Materials and Methods

2.1. Computational

The diastereomers 1 and 2 were both built in ChemDraw. Conformational analysis was performed in Pcmodel 10.0 (GMMX search algorithm) [39] at the molecular mechanics (MM) level, with a 30 kcal/mol initial search limit and a final screening limit of 10 kcal/mol. This yielded 5573 conformers for 1 and 3939 conformers for 2. Subsequent DFT calculations were performed in Gaussian 16 [40]. The single-point energies of these conformers were computed at the B3PW91/6-31G(2d, p) [41,42] level using the SG1 integration grid. All single-point, optimization and frequency calculations included a Polarizable Continuum Model (PCM) [43,44] representing the DMSO-d6 solvent used for VCD measurements. The geometries within the lowest 5.0 kcal/mol limit based on the computed single-point energies were then optimized at the same level using the default UltraFine integration grid, which was used thereafter. VCD and ORD calculations were performed on optimized structures in the lowest 2.0 kcal/mol window based on electronic energies at the B3PW91/6-31G(2d,p)/PCM level. The optimized geometries within the lowest 3.0 kcal/mol based on Gibbs energies at the B3PW91/6-31G(2d, p)/PCM level were further optimized at the B3PW91/6-311G(3df,2pd) [45,46,47]/PCM level, and VCD calculations were performed thereafter for conformers in the lowest 2.0 kcal/mol based on electronic energies. A 3.0 kcal/mol limit was chosen due to the lower computed energy difference between conformers at the B3PW91/6-311G(3df,2pd)/PCM level relative to the B3PW91/6-31G(2d,p)/PCM level. In addition to our new calculations on diastereomers 1 and 2, we also analyzed the VCD spectra that were reported previously at the B3LYP/6-311++G(2d,2p) level [27].
All spectral simulations and similarity analyses [48,49] were undertaken using the in-house developed CDSpecTech program [50]. The numerical measures of quantitative similarities for VA, VCD and vibrational dissymmetry factor (VDF) spectra were assessed from SimVA, SimVCD and SimVDF functions, respectively [48,49]. The SimVA and SimVDF values reported here are at the same scale factor that gives maximum SimVCD. Similarity analysis was performed between calculated and experimental spectra using the experimental 1100 to 1490 cm−1 region.
Additional optimizations and VCD spectral predictions were also undertaken on fragments of the lowest energy conformers for 1 at the B3PW91/6-311G(3df,2pd) level, whereby the separate diterpene and saccharide units were cleaved at the glycosidic linkage and capped with an –OC3H3 group. 3H isotope was used in place of 1H to avoid interfering vibrations from –C–1H vibrations of the capping group. VCD calculations were performed on the unique diterpene and saccharide-optimized geometries.
All molecular visualizations were made with CYLview [51].

2.2. Experimental

Optical rotations of Peyssonnoside A were measured in DMSO at a concentration of 12 mg/mL in a 1 cm pathlength cuvette using A Jasco J-815 instrument (JASCO Inc., Easton, MD USA) [27]. VCD measurements were carried out using a commercial ChiralIR instrument (BioTools Inc., Jupiter, FL USA) using a fixed pathlength (100 μm) SL3 cell at a concentration of 80 mg/mL using DMSO-d6 as solvent [27].

3. Results and Discussion

Given the size of the ensembles of 1 and 2, as well as the large number of atoms, we initially elected to rank the MM geometries based on DFT single-point energies at the B3PW91/6-31G(2d,p)/PCM level and to optimize only those within a 5.0 kcal/mol limit. This is a wider energy range than the 2.5 kcal/mol recommended by Ruud and coworkers for cyclic oligopeptides [52] and seems to work well for locating the low-energy conformers of very flexible molecules [53]. The 6-31G(2d,p) basis set was used as a reasonable compromise between the 6-31G(d) basis and those that include multiple diffuse and polarization functions that appear to be very computationally expensive for this large molecule, while still having polarization functions included in its definition. Additionally, good VCD agreement can be obtained with this basis set for dipeptides, which are very flexible molecules with several conformers [54]. We explored the use of the semi-empirical PM6 [55] method for preoptimization prior to DFT single-point ranking, but single-point energies after PM6 optimization were several kcal/mol higher than the single-point energies of the MM geometries, so we avoided the use of the PM6 method.
Optimizations of 1 and 2 at the B3PW91/6-31G(2d,p) level gave a total of 11 conformers for 1 and 10 conformers for 2 within a 2.0 kcal/mol window, which is a small number of conformers similar to the low number of low-energy conformations obtained previously (five for each diastereomer) [27]. It is likely that the diterpene unit at the anomeric carbon prevents the otherwise flexible sugar moiety from puckering, thereby limiting the ring to one favorable chair position. Additionally, the C-3 alcohol group is pointing towards one of the oxygens in the C-2 sulfate group, locking both into place and further limiting the number of obtained conformers due to this favorable intermolecular interaction. This oxygen also has a shorter S=O bond length, likely due to the stabilizing hydrogen bonding interaction from the C-3 hydroxyl group.

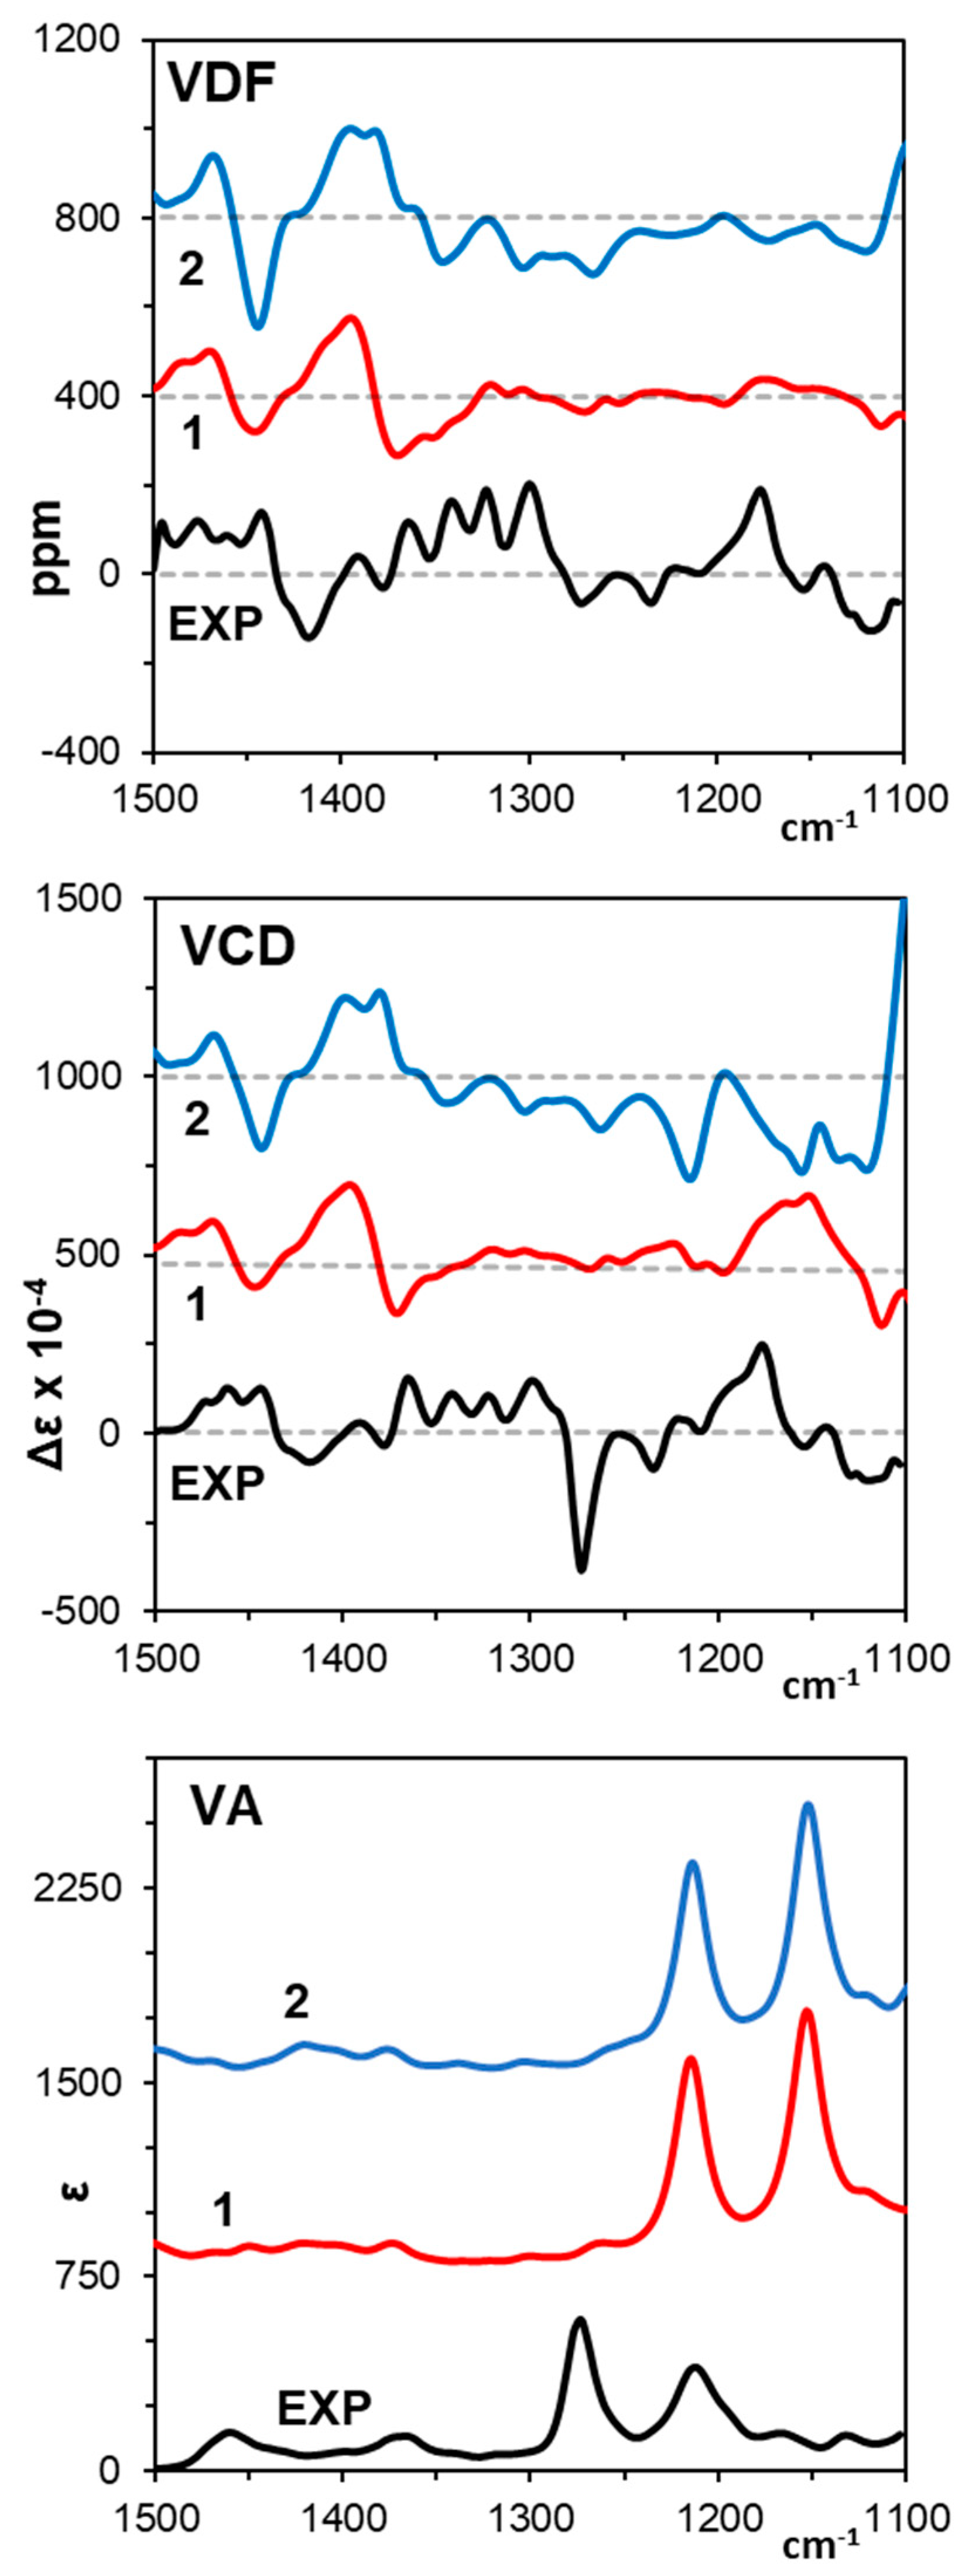
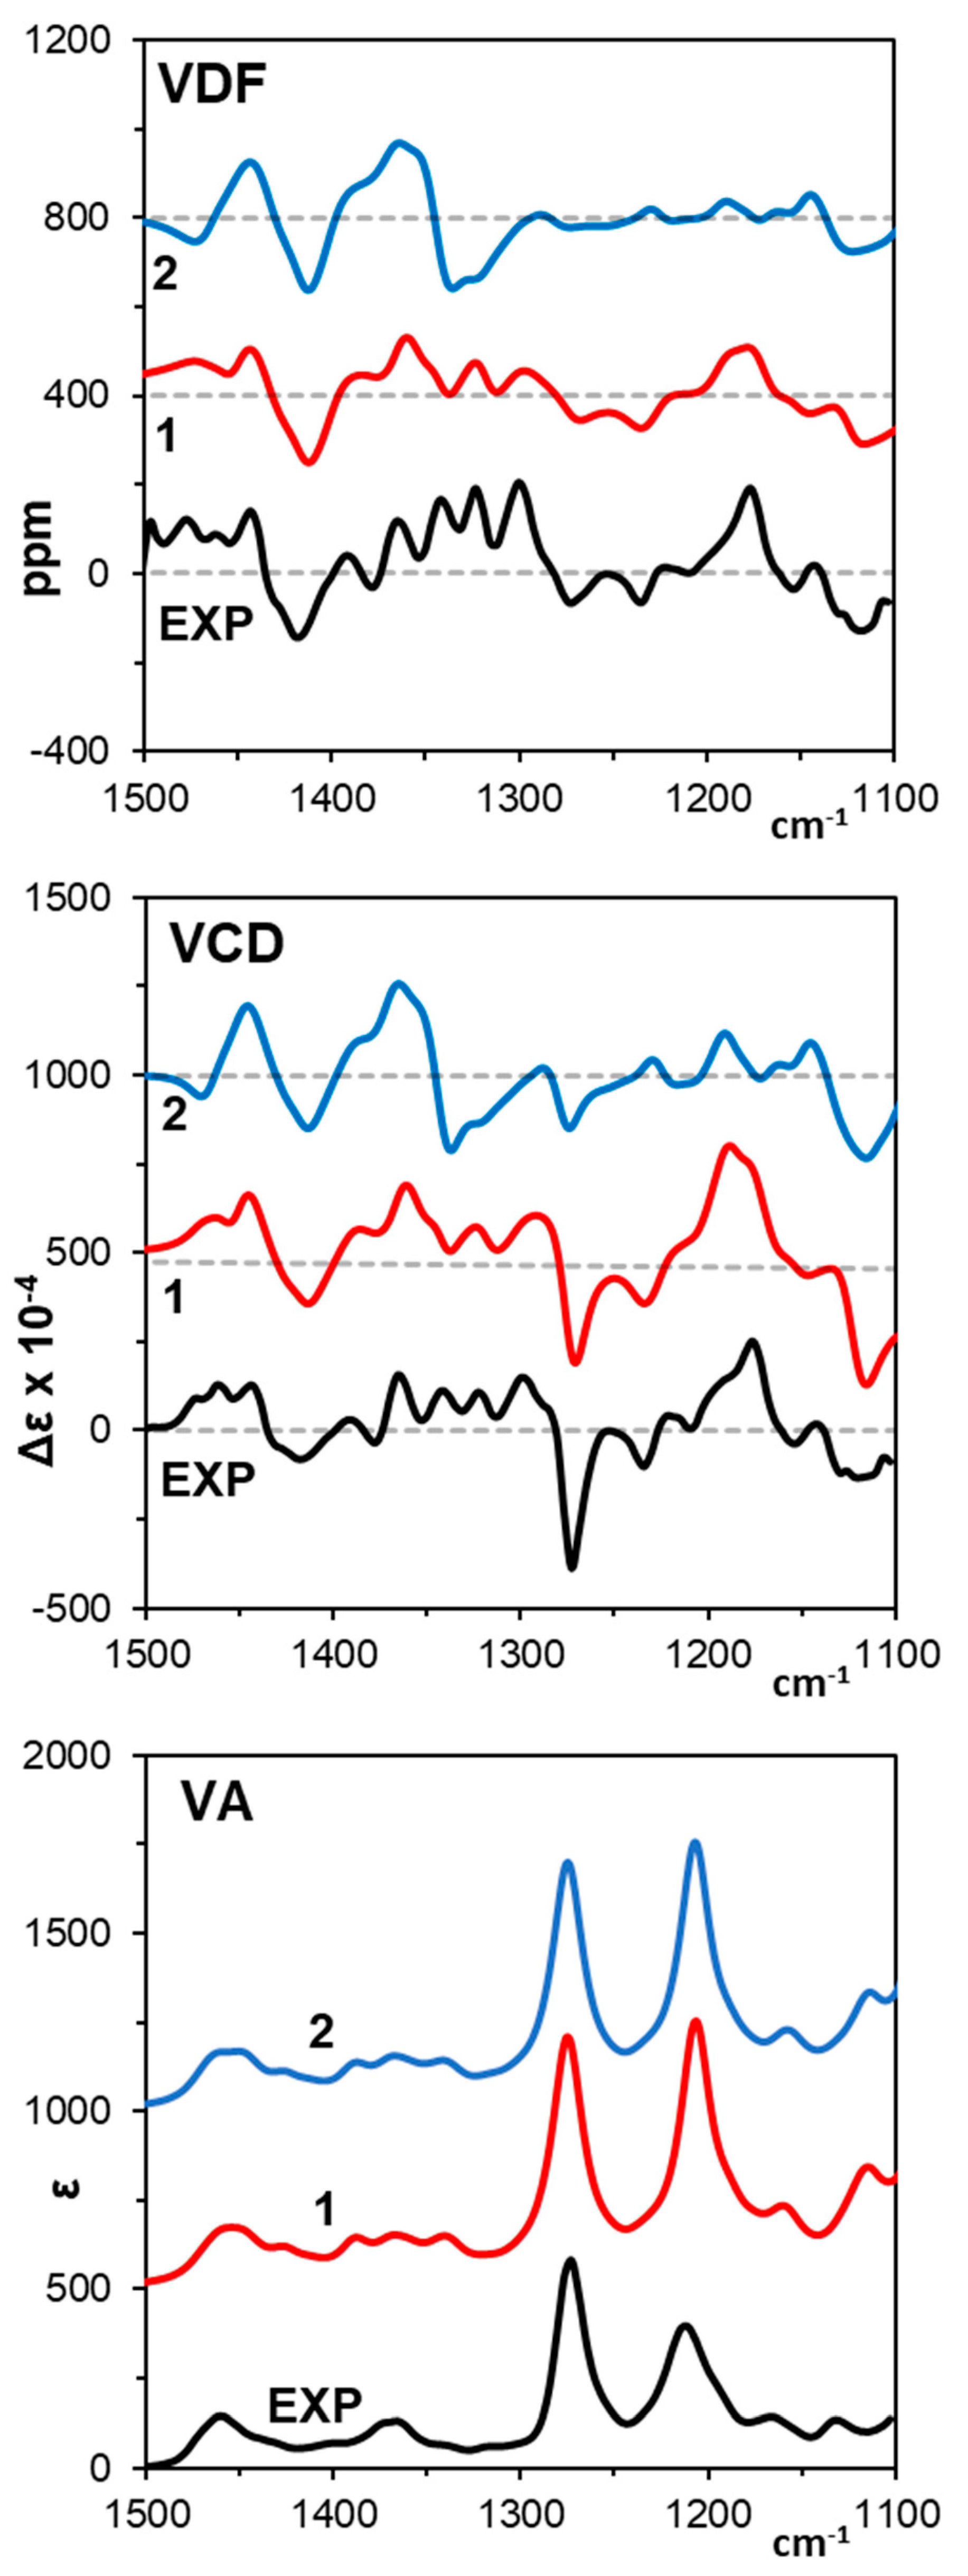
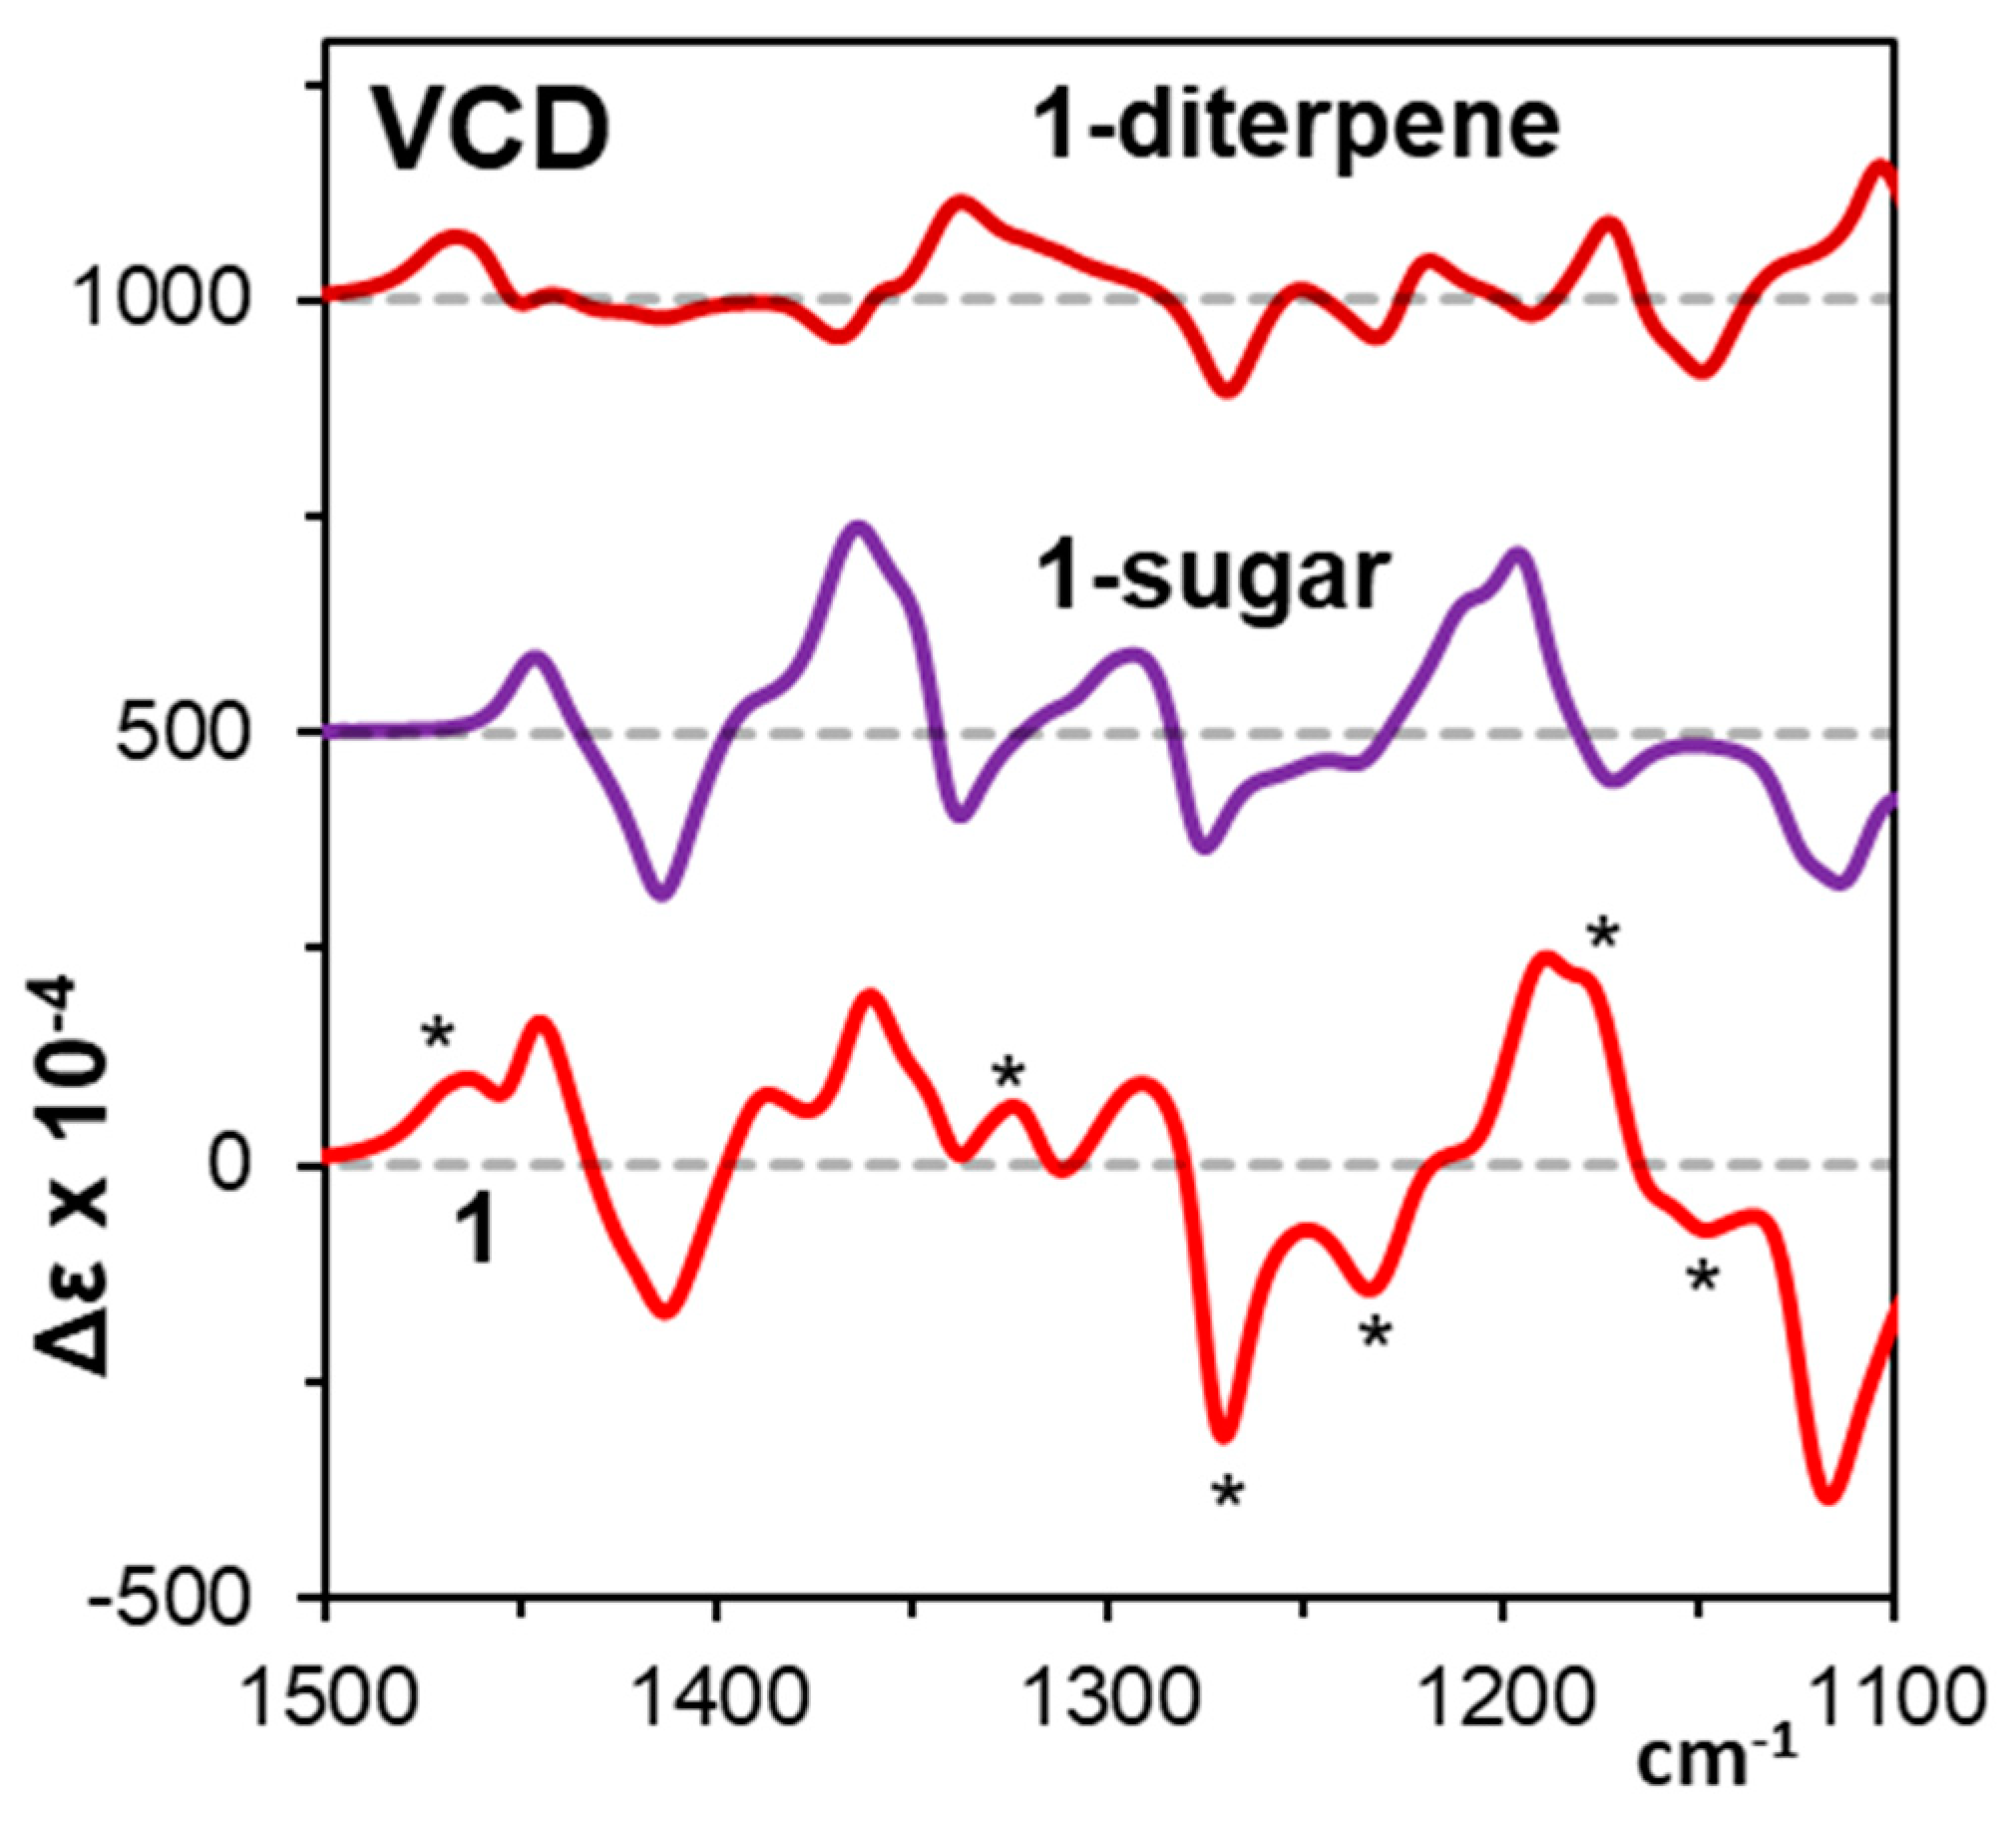
3.1. Vibrational Circular Dichroism

The simulated VCD spectra of 1 and 2 at the B3LYP/6-311++G(2d,2p)/PCM level were previously found to have a poor correlation to the corresponding experimental VCD spectrum and, therefore, AC could not be determined in that study [27]. These previously predicted spectra of 1 and 2 are compared with corresponding experimental spectra in Figure 2, and quantitative similarities are reported in Table 1. The choice of frequency scale factor for predicted spectra at B3LYP/6-311++G(2d,2p)/PCM level is not trivial, as the quantitative Sim values are very low. If the S=O vibrations, which are clearly mispredicted, are ignored, then a scale factor of 0.967 appears to be appropriate based on correlation with the weak VA bands at 1460 and 1370 cm−1. For diastereomers 1 and 2 at this level of theory, quantitative analysis of the maximum SimVCD gives two distinct scale factors: 1.035 for 1 and 0.981 for 2. Owing to the conflicting observations, we presented the simulated spectra in Figure 2 with one frequency scale factor of 1.000. The similarity values listed in Table 1 are for the frequency scale factor that yields maximum SimVCD.
The quantitative similarities between the predicted spectra of 1 and the experimental spectra are SimVCD = 0.30 and SimVDF = 0.27, while corresponding values for 2 are 0.14 and 0.23, respectively (see Table 1). These magnitudes are quite low for suggesting reliable AC, and this was the reason for not being able to assign the AC of Peyssonnoside A from VCD spectra previously [27]. This negative conclusion motivated us to explore different levels of theory for VCD predictions.
Simulated spectra of 1 and 2 at the B3PW91/6-31G(2d,p) level and comparison with experimental spectra are presented in Figure 3. The predominant difference in the two predicted spectra is that the positive experimental VCD bands at 1344, 1321 and 1298 cm−1 are all predicted to be negative for 2, and the band shape of the positive experimental 1177 cm−1 band is better reproduced by 1. Quantitative similarities between predicted and experimental spectra, which are presented in Table 1, show the maximum SimVCD (0.47) and corresponding SimVDF (0.42) for 1 to be greater than 0.4, but they are less than 0.25 for 2, pointing towards AC assignment of Peyssonnoside A as that of 1. However, the SimVA of 0.54 for diastereomer 1, at the scale factor (0.980) that yields maximum SimVCD, is not a high enough value unlike those normally found for VA spectra. Visualization of the vibrations in the simulated spectra shows that the simulated VA bands at 1253 and 1178 cm−1, as well as the corresponding VCD bands, have significant contributions from S=O symmetric and antisymmetric stretching vibrations, and these bands did not line up with experimental bands due to their red-shifted positions. These mispredicted S=O stretching vibrations have little impact on the VDF spectra due to the high associated VA intensities.
Noting the poor agreement between the experimental and simulated VA spectra of 1 and 2 at the B3LYP/6-311++G(2d,2p) level and only a marginal agreement for 1 at the B3PW91/6-31G(2d,p) level, we hoped that f-polarization functions might improve the predictions. However, the size of 1 and 2 makes the use of a larger basis set very expensive, even with relatively few conformers. Despite this limitation, we further optimized the low-energy conformers of the B3PW91/6-31G(2d,p) level (11 for 1 and 10 for 2) at the B3PW91/6-311G(3df,2dp)/PCM level. The relative energies of the conformers dropped significantly, so we expanded the energy window of the conformers to be optimized at the higher level of theory to those within 3.0 kcal/mol from the B3PW91/6-31G(2d,p)/PCM level. Additionally, we also optimized the conformers whose single-point energies at the B3PW91/6-31G(2d,p) level were within a 5.0 kcal/mol limit, so as to ensure that no conformers were missed. Ultimately, this process gave two additional conformations within 2.0 kcal/mol for both diastereomers 1 and 2, for a total of 13 conformers for 1 and 12 for 2 at the B3PW91/6-311G(3df,2pd) level.
The use of empirical dispersion corrections, such as those proposed by Grimme [56,57], is not considered in the present calculations. This is because the inclusion of these corrections typically leads to a lower overall agreement between experimental and calculated VCD spectra [52,58,59,60]. Additionally, we have not tackled in this research the possible effect that the solvent DMSO-d6 has on the orientations of the hydroxyl groups amongst the low-energy conformers. This is because our experience has been that when there are several groups participating in intramolecular hydrogen bonding, the influence of hydrogen bonding solvent is minimal and PCM model is likely to be adequate for satisfactorily reproducing the experimental spectra in methanol solvent [48]. However, this situation may change with solvent and individual solute molecules. The added consideration of solvation in VCD spectroscopy, typically by explicit solvation or microsolvation [58,61,62,63], can quickly become computationally expensive.
A comparison of spectra simulated at the B3PW91/6-311G(3df,2pd) level to the experimental spectra of Peyssonnoside A is presented in Figure 4. The simulated VDF and VCD spectra have been multiplied by 2 for better comparison with the experimental spectra. The B3PW91/6-311G(3df,2pd) predicted S=O VA and VCD bands at 1275 and 1207 cm−1 are now in line with corresponding experimental bands. The addition of f-polarization functions gives a substantial improvement in the quantitative similarity of simulated spectra of 1 with the corresponding experimental spectra (see Table 1). The similarity values of SimVA (0.94), SimVCD (0.76) and SimVCD (0.67) for 1 are among the largest Sim magnitudes seen in the literature, giving very high confidence for 1 as the AC of Peyssonnoside A.
Two of the lowest energy conformers for 1 at the B3PW91/6-311G(3df,2pd) level are presented in Figure 5 and the rest in Supplementary Materials.
Given that much of the VCD activity appears to arise from the sulfonated saccharide instead of the rigid diterpene unit, we set out to investigate the VCD activities of the respective fragments. Normally, VCD contributions from individual parts of a molecule do not necessarily add up to the VCD spectrum of the entire molecule. However, because of the different bond types in the diterpene and sugar units, we decided to check if the VCD calculations of the individual fragments may be a good approximation of the overall VCD spectrum.
One sugar and one diterpene fragment for each of the thirteen conformations of diastereomer 1 was used as the starting point. After optimization of these geometries at the B3PW91/6-311G(3df,2pd) level, there were seven unique sugar fragment conformers and two unique diterpene fragment conformers. VCD calculations were performed on these optimized geometries. The simulated VCD spectra of 1 and its optimized fragments are presented in Figure 6.
VCD contributions from the diterpene fragment are much weaker than those of the sulfonated sugar. However, from visual inspection, there are six bands that can be identified as originating from the diterpene fragment, and these bands are marked with an asterisk (*) in Figure 5. These bands are (1) a shoulder at 1464 cm−1, (2) a weak (+)-band at 1325 cm−1, (3) the S=O antisymmetric (1270 cm−1) band, (4) the S=O symmetric (1234 cm−1) band, (5) a shoulder (+)-band at 1178 cm−1 and (6) a weak (–)-band at 1148 cm−1. These bands in 1 each have a corresponding band in the experimental VCD spectrum, and these bands are either of smaller magnitude or opposite signs in the predicted spectrum of 2, indicating that these bands are sensitive to the stereochemistry of the rigid diterpene fragment. Overall, the sum of the VCD spectra of diterpene and sugar fragments appears to be a reasonably good approximation to the VCD spectrum of the whole molecule.

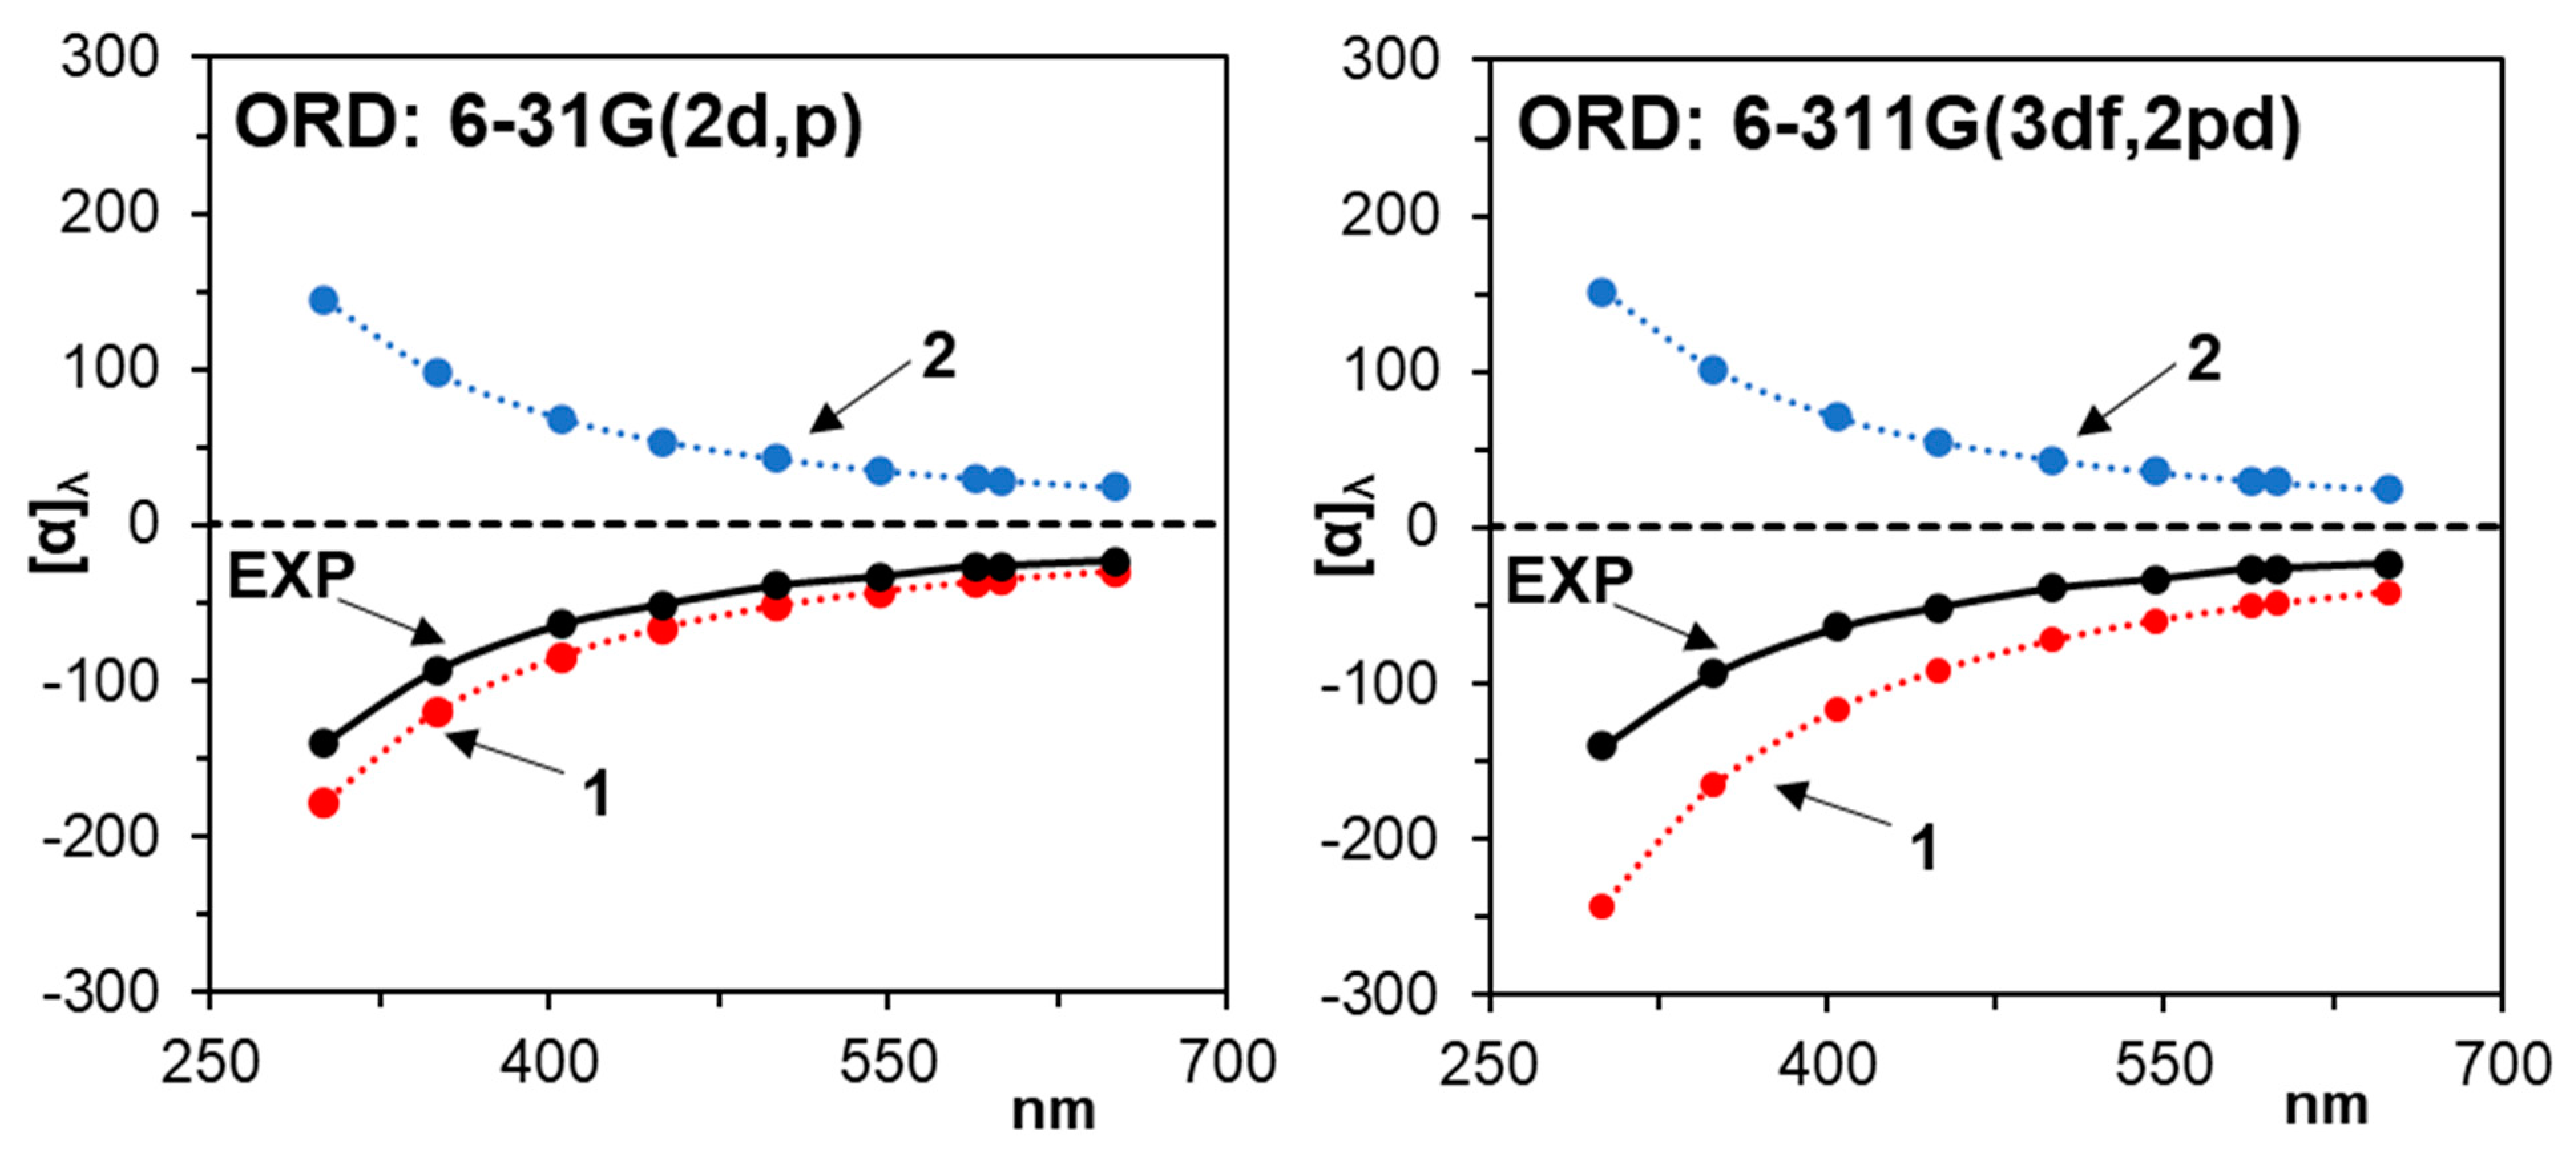
3.2. Optical Rotatory Dispersion

The good agreement between experimental and predicted ORD curves at the B3LYP/6-311++G(2d, 2p) level was one of the key pieces of evidence for the previous AC assignment of Peyssonnoside A [27], so it is important that the ORD of 1 and 2 also be computed at the same level that gives satisfactory VCD agreement as additional evidence for the AC of Peyssonnoside A. Predicted ORD curves for both 1 and 2 at the B3PW91/6-31G(2d,p) and B3PW91/6-311G(3df, 2pd) levels are displayed in Figure 7. At both levels, the Boltzmann conformer average predicted ORD curves of 1 are all negative and of 2 are all positive. Despite being diastereomers, the ORD curves for 1 and 2 are almost mirror images. These mirror-image curves suggest that ORD is more sensitive to the stereochemistry of the diterpene fragment as opposed to the saccharide fragment. The current ORD data at the B3PW91/6-31G(2d,p) and B3PW91/6-311G(3df, 2pd) levels also support the AC assignment of 1.

4. Conclusions

Overall, the large size of Peyssonnoside A makes an accurate computation of VCD spectra challenging. Despite its unusual structure, the dominant VCD activity for 1 and 2 arises from the monosaccharide unit instead of the rigid diterpene unit. The marginal quantitative similarities at a more cost-effective, double-ζ basis set pointed towards an AC assignment of 1, but low VA similarities arising from red-shifted S=O stretching vibrations posed a limitation. Calculations at a higher level of theory, including f-polarization functions, dramatically increased the quantitative similarities between 1 and the experimental spectra for both VA and VCD spectra.
Previously reported VCD analysis at the B3LYP/6-311++G(2d,2p) level was unable to establish the AC of Peyssonnoside A. On the contrary, the current VCD analysis at the B3PW91/6-311G(3df,2pd) level has provided a convincing AC assignment. This stark contrast between the failed and successful VCD analyses is attributed to the inclusion of f-functions in the basis set.
Contrary to VCD, which is dominated by the contributions from sugar fragments, ORD is dominated by contributions from stereogenic centers of diterpene fragments. Therefore, the ORD and VCD spectroscopies are sensitive to separate stereogenic fragments of Peyssonnoside A, highlighting the importance of the use of multiple chiroptical spectroscopies in the stereochemical analysis of complex natural-product molecules.
The current investigation highlights the importance of exploring multiple levels of theories for satisfactorily reproducing the experimental VA and VCD spectra. Moreover, for quantitative comparisons using similarity indices, matching the theoretical and experimental spectra for vibrational absorption is as important as matching the corresponding VCD spectra.

Supplementary Materials

The following supporting information can be downloaded at https://www.mdpi.com/article/10.3390/sym16020133/s1, Figure S1: conformers for diastereomer 1 at the B3PW91/6-311G(3df,2pd)/PCM level; Figure S2: conformers for diastereomer 2 at the B3PW91/6-311G(3df,2pd)/PCM level.

Author Contributions

Conceptualization, A.R.P.; investigation, A.R.P. and B.K.C.; data curation, A.R.P. and B.K.C.; writing—original draft preparation, A.R.P.; writing—review and editing, all authors; supervision, P.L.P. and J.K.; project administration, P.L.P. and J.K.; funding acquisition, J.K. and P.L.P. All authors have read and agreed to the published version of the manuscript.

Funding

This research was funded by National Institute of Health grant number U19 TW007401 to J. K. at Georgia Institute of Technology, and was conducted in part using the resources of the Advanced Computing Center for Research and Education at Vanderbilt University. The APC was waived by the journal.

Data Availability Statement

Data available on request.

Conflicts of Interest

The authors declare no conflict of interest.

References

  1. Berova, N.; Polavarapu, P.L.; Nakanishi, K.; Woody, R. (Eds.) Comprehensive Chiroptical Spectroscopy, Volume 1: Instrumentation, Methodologies, and Theoretical Simulations; Wiley: New York, NY, USA, 2012. [Google Scholar]
  2. Berova, N.; Polavarapu, P.L.; Nakanishi, K.; Woody, R. (Eds.) Comprehensive Chiroptical Spectroscopy. Volume 2: Applications in Stereochemical Analysis of Synthetic Compounds, Natural Products, and Biomolecules; John Wiley & Sons: Hoboken, NJ, USA, 2012. [Google Scholar]
  3. Nafie, L.A. Vibrational Optical Activity: Principles and Applications; John Wiley and Sons Inc.: New York, NY, USA, 2011. [Google Scholar]
  4. Polavarapu, P.L. Chiroptical Spectroscopy: Fundamentals and Applications; Taylor & Francis: Boca Raton, FL, USA, 2017. [Google Scholar]
  5. Barron, L.D. Molecular Light Scattering and Optical Activity; Cambridge University Press: Cambridge, UK, 2004. [Google Scholar]
  6. Stephens, P.J.; Devlin, F.J.; Cheeseman, J.R. VCD Spectroscopy for Organic Chemists; CRC Press LLC: Boca Raton, FL, USA, 2012. [Google Scholar]
  7. Keiderling, T.A. Structure of Condensed Phase Peptides: Insights from Vibrational Circular Dichroism and Raman Optical Activity Techniques. Chem. Rev. 2020, 120, 3381–3419. [Google Scholar] [CrossRef]
  8. Nafie, L.A. Vibrational Optical Activity: From Discovery and Development to Future Challenges. Chirality 2020, 32, 667–692. [Google Scholar] [CrossRef]
  9. Pescitelli, G.; Bruhn, T. Good Computational Practice in the Assignment of Absolute Configurations by TDDFT Calculations of ECD Spectra. Chirality 2016, 28, 466–474. [Google Scholar] [CrossRef]
  10. Zhu, H.; Wang, Y.; Nafie, L.A. Computational Methods and Points for Attention in Absolute Configuration Determination. Front. Nat. Prod. 2023, 1, 1086897. [Google Scholar] [CrossRef]
  11. Vang, Z.P.; Sonstrom, R.E.; Scolati, H.N.; Clark, J.R.; Pate, B.H. Assignment of the Absolute Configuration of Molecules That Are Chiral by Virtue of Deuterium Substitution Using Chiral Tag Molecular Rotational Resonance Spectroscopy. Chirality 2023, 35, 856–883. [Google Scholar] [CrossRef]
  12. Sun, W.; Schnell, M. Microwave Three-Wave Mixing Spectroscopy of Chiral Molecules in Weakly Bound Complexes. J. Phys. Chem. Lett. 2023, 14, 7389–7394. [Google Scholar] [CrossRef]
  13. de Albuquerque, A.C.F.; Martorano, L.H.; dos Santos, F.M. Are We Still Chasing Molecules That Were Never There? The Role of Quantum Chemical Simulations of NMR Parameters in Structural Reassignment of Natural Products. Front. Nat. Prod. 2024, 2, 1321043. [Google Scholar] [CrossRef]
  14. Mándi, A.; Kurtán, T. Applications of OR/ECD/VCD to the Structure Elucidation of Natural Products. Nat. Prod. Rep. 2019, 36, 889. [Google Scholar] [CrossRef]
  15. Batista, J.M.; Da, V.; Bolzani, S.; Ao, J.; Batista, M.; Blanch, E.W. Recent Advances in the Use of Vibrational Chiroptical Spectroscopic Methods for Stereochemical Characterization of Natural Products. Nat. Prod. Rep. 2015, 32, 1269–1358. [Google Scholar] [CrossRef]
  16. Polavarapu, P.L.; Santoro, E. Vibrational Optical Activity for Structural Characterization of Natural Products. Nat. Prod. Rep. 2020, 37, 1661–1699. [Google Scholar] [CrossRef]
  17. Grauso, L.; Teta, R.; Esposito, G.; Menna, M.; Mangoni, A. Computational Prediction of Chiroptical Properties in Structure Elucidation of Natural Products. Nat. Prod. Rep. 2019, 36, 1005. [Google Scholar] [CrossRef] [PubMed]
  18. Batista, A.N.L.; Angrisani, B.R.P.; Lima, M.E.D.; da Silva, S.M.P.; Schettini, V.H.; Chagas, H.A.; dos Santos, F.M.; Batista, J.M.; Valverde, A.L. Absolute Configuration Reassignment of Natural Products: An Overview of the Last Decade. J. Braz. Chem. Soc. 2021, 32, 1499–1518. [Google Scholar] [CrossRef]
  19. Del Río, R.E.; Joseph-Nathan, P. Vibrational Circular Dichroism Absolute Configuration of Natural Products From 2015 to 2019. Nat. Prod. Commun. 2021, 16, 1934578X21996166. [Google Scholar] [CrossRef]
  20. Merten, C.; Golub, T.P.; Kreienborg, N.M. Absolute Configurations of Synthetic Molecular Scaffolds from Vibrational CD Spectroscopy. J. Org. Chem. 2019, 84, 8797–8814. [Google Scholar] [CrossRef] [PubMed]
  21. Polavarapu, P.L. Why Is It Important to Simultaneously Use More than One Chiroptical Spectroscopic Method for Determining the Structures of Chiral Molecules? Chirality 2008, 20, 664–672. [Google Scholar] [CrossRef] [PubMed]
  22. Rehman, N.U.; Hussain, H.; Al-Shidhani, S.; Kumar Avula, S.; Abbas, G.; Muhammad, A.; Anwar, U.; Orecki, D.G.; Pescitelli, M.G.; Al-Harrasi, A. Incensfuran: Isolation, X-Ray Crystal Structure and Absolute Configuration by Means of Chiroptical Studies in Solution and Solid State. RSC Adv. 2017, 7, 42357–42362. [Google Scholar] [CrossRef]
  23. Smyrniotopoulos, V.; Merten, C.; Kaiser, M.; Tasdemir, D. Bifurcatriol, a New Antiprotozoal Acyclic Diterpene from the Brown Alga Bifurcaria Bifurcata. Mar. Drugs 2017, 15, 245. [Google Scholar] [CrossRef]
  24. A Kadir, M.F.; Wibowo, A.; Salim, F.; Anouar, E.H.; Awang, K.; Langat, M.K.; Ahmad, R. Conformational Analysis of Diterpene Lactone Andrographolide towards Reestablishment of Its Absolute Configuration via Theoretical and Experimental ECD and VCD Methods. Indones. J. Chem. 2020, 21, 148. [Google Scholar] [CrossRef]
  25. Zhang, P.; Xue, S.; Tang, P.; Cui, Z.; Wang, Z.; Luo, J.; Kong, L. Aphamines A-C, Dimeric Acyclic Diterpene Enantiomers from Aphanamixis Polystachya. Chin. Chem. Lett. 2021, 32, 1480–1484. [Google Scholar] [CrossRef]
  26. Wang, W.-L.; Liu, X.-Q.; Zhu, D.-R.; Chen, C.; Gong, L.-J.; Zhu, J.-M.; Zhu, T.-Y.; Luo, J.-G.; Kong, L.-Y. Taxodinoids A-D, Four Heptacyclic C 40 Diterpene Dimers from the Seeds of Taxodium Distichum. Tetrahedron 2021, 83, 131952. [Google Scholar] [CrossRef]
  27. Khatri Chhetri, B.; Lavoie, S.; Marie Sweeney-Jones, A.; Mojib, N.; Raghavan, V.; Gagaring, K.; Dale, B.; McNamara, C.W.; Soapi, K.; Quave, C.L.; et al. Peyssonnosides A−B, Unusual Diterpene Glycosides with a Sterically Encumbered Cyclopropane Motif: Structure Elucidation Using an Integrated Spectroscopic and Computational Workflow. J. Org. Chem. 2019, 84, 8431–8541. [Google Scholar] [CrossRef]
  28. Chini, M.G.; Jones, C.R.; Zampella, A.; D’Auria, M.V.; Renga, B.; Fiorucci, S.; Butts, C.P.; Bifulco, G. Quantitative NMR-Derived Interproton Distances Combined with Quantum Mechanical Calculations of 13C Chemical Shifts in the Stereochemical Determination of Conicasterol F, a Nuclear Receptor Ligand from Theonella swinhoei. J. Org. Chem. 2012, 77, 1489–1496. [Google Scholar] [CrossRef]
  29. Laskowski, T.; Szwarc, K.; Szczeblewski, P.; Sowiński, P.; Borowski, E.; Pawlak, J. Monosaccharides as Potential Chiral Probes for the Determination of the Absolute Configuration of Secondary Alcohols. J. Nat. Prod. 2016, 79, 2797–2804. [Google Scholar] [CrossRef]
  30. Grimblat, N.; Zanardi, M.M.; Sarotti, A.M. Beyond DP4: An Improved Probability for the Stereochemical Assignment of Isomeric Compounds Using Quantum Chemical Calculations of NMR Shifts. J. Org. Chem. 2015, 80, 12526–12534. [Google Scholar] [CrossRef]
  31. Chesnokov, G.A.; Gademann, K. Concise Total Synthesis of Peyssonnoside A. J. Am. Chem. Soc. 2021, 143, 14083–14088. [Google Scholar] [CrossRef]
  32. Xu, B.; Liu, C.; Dai, M. Catalysis-Enabled 13-Step Total Synthesis of (−)-Peyssonnoside A. J. Am. Chem. Soc. 2022, 144, 19700–19703. [Google Scholar] [CrossRef]
  33. Batista, A.N.L.; Santos, C.H.T.; de Albuquerque, A.C.F.; Santos, F.M., Jr.; Garcez, F.R.; Batista, J.M., Jr. Absolute Configuration Reassignment of Nectamazin A: Implications to Related Neolignans. Spectrochim. Acta A Mol. Biomol. Spectrosc. 2023, 304, 123283. [Google Scholar] [CrossRef]
  34. Scholten, K.; Engelage, E.; Merten, C. Basis Set Dependence of S=O Stretching Frequencies and Its Consequences for IR and VCD Spectra Predictions. Phys. Chem. Chem. Phys. 2020, 22, 27979–27986. [Google Scholar] [CrossRef]
  35. Becke, A.D. Density-Functional Thermochemistry. III. The Role of Exact Exchange. J. Chem. Phys. 1993, 98, 5648–5652. [Google Scholar] [CrossRef]
  36. Perdew, J.P.; Wang, Y. Accurate and Simple Analytic Representation of the Electron-Gas Correlation Energy. Phys. Rev. B 1992, 45, 13244–13249. [Google Scholar] [CrossRef]
  37. Stephens, P.J.; Devlin, F.J.; Ashvar, C.S.; Chabalowski, C.F.; Frisch, M.J. Theoretical Calculation of Vibrational Circular Dichroism Spectra. Faraday Discuss. 1994, 99, 103–119. [Google Scholar] [CrossRef]
  38. Stephens, P.J.; Devlin, F.J.; Chabalowski, C.F.; Frisch, M.J. Ab Initio Calculation of Vibrational Absorption and Circular Dichroism Spectra Using Density Functional Force Fields. J. Phys. Chem. 1994, 98, 11623–11627. [Google Scholar] [CrossRef]
  39. Gilbert, K.E. Pcmodel 10.0; Serena Software: Bloomington, IN, USA, 2013. [Google Scholar]
  40. Frisch, M.J.; Trucks, G.W.; Schlegel, H.B.; Scuseria, G.E.; Robb, M.A.; Cheeseman, J.R.; Scalmani, G.; Varone, V.; Petersson, G.A.; Nakatsuji, H.; et al. Gaussian 16 Rev. C.01; Gaussian, Inc.: Wallingford, CT, USA, 2016. [Google Scholar]
  41. Hariharan, P.C.; Pople, J.A. Accuracy of AHn Equilibrium Geometries by Single Determinant Molecular Orbital Theory. Mol. Phys. 1974, 27, 209–214. [Google Scholar] [CrossRef]
  42. Hariharan, P.C.; Pople, J.A. The Influence of Polarization Functions on Molecular Orbital Hydrogenation Energies. Theor. Chim. Acta 1973, 28, 213–222. [Google Scholar] [CrossRef]
  43. Tomasi, J.; Mennucci, B.; Cammi, R. Quantum Mechanical Continuum Solvation Models. Chem. Rev. 2005, 105, 2999–3093. [Google Scholar] [CrossRef] [PubMed]
  44. Scalmani, G.; Frisch, M.J. Continuous Surface Charge Polarizable Continuum Models of Solvation. I. General Formalism. J. Chem. Phys. 2010, 132, 6158. [Google Scholar] [CrossRef] [PubMed]
  45. Mclean, A.D.; Chandler, G.S. Contracted Gaussian Basis Sets for Molecular Calculations. I. Second Row Atoms, Z = 11–18. J. Chem. Phys. 1980, 72, 5639. [Google Scholar] [CrossRef]
  46. Frisch, M.J.; Pople, J.A.; Binkley, J.S. Self-Consistent Molecular Orbital Methods 25. Supplementary Functions for Gaussian Basis Sets. J. Chem. Phys. 1984, 80, 3265. [Google Scholar] [CrossRef]
  47. Krishnan, R.; Binkley, J.S.; Seeger, R.; Pople, J.A. Self-Consistent Molecular Orbital Methods. XX. A Basis Set for Correlated Wave Functions. J. Chem. Phys 1980, 72, 650–654. [Google Scholar] [CrossRef]
  48. Polavarapu, P.L.; Santoro, E.; Covington, C.L.; Johnson, J.L.; Puente, A.R.; Schley, N.D.; Kallingathodi, Z.; Prakasan, P.C.; Haleema, S.; Thomas, A.A.; et al. How Important Are the Intermolecular Hydrogen Bonding Interactions in Methanol Solvent for Interpreting the Chiroptical Properties? Spectrochim. Acta A Mol. Biomol. Spectrosc. 2021, 247, 119094. [Google Scholar] [CrossRef] [PubMed]
  49. Covington, C.L.; Polavarapu, P.L. Similarity in Dissymmetry Factor Spectra: A Quantitative Measure of Comparison between Experimental and Predicted Vibrational Circular Dichroism. J. Phys. Chem. A 2013, 117, 3377–3386. [Google Scholar] [CrossRef] [PubMed]
  50. Covington, C.L.; Polavarapu, P.L. CDSpecTech: A Single Software Suite for Multiple Chiroptical Spectroscopic Analyses. Chirality 2017, 29, 178–192. [Google Scholar] [CrossRef] [PubMed]
  51. Legault, C.Y. CYLview20; Université de Sherbrooke: Sherbrooke, QC, Canada, 2020. [Google Scholar]
  52. Eikås, K.D.R.; Beerepoot, M.T.P.; Ruud, K. A Computational Protocol for Vibrational Circular Dichroism Spectra of Cyclic Oligopeptides. J. Phys. Chem. A 2022, 2022, 5471. [Google Scholar] [CrossRef] [PubMed]
  53. Eikås, K.D.R.; Krupová, M.; Kristoffersen, T.; Beerepoot, M.T.P.; Ruud, K. Can the Absolute Configuration of Cyclic Peptides Be Determined with Vibrational Circular Dichroism? Phys. Chem. Chem. Phys. 2023, 25, 14520. [Google Scholar] [CrossRef] [PubMed]
  54. Vermeyen, T.; Merten, C. Solvation and the Secondary Structure of a Proline-Containing Dipeptide: Insights from VCD Spectroscopy. Phys. Chem. Chem. Phys. 2020, 22, 15640–15648. [Google Scholar] [CrossRef] [PubMed]
  55. Stewart, J.J.P. Optimization of Parameters for Semiempirical Methods V: Modification of NDDO Approximations and Application to 70 Elements. J. Mol. Model. 2007, 13, 1173–1213. [Google Scholar] [CrossRef]
  56. Grimme, S.; Ehrlich, S.; Goerigk, L. Effect of the Damping Function in Dispersion Corrected Density Functional Theory. J. Comput. Chem. 2011, 32, 1456–1465. [Google Scholar] [CrossRef]
  57. Grimme, S.; Antony, J.; Ehrlich, S.; Krieg, H. A Consistent and Accurate Ab Initio Parametrization of Density Functional Dispersion Correction (DFT-D) for the 94 Elements H-Pu. J. Chem. Phys. 2010, 132. [Google Scholar] [CrossRef]
  58. Bünnemann, K.; Merten, C. Solvation of a Chiral Carboxylic Acid: Effects of Hydrogen Bonding on the IR and VCD Spectra of α-Methoxyphenylacetic Acid. Phys. Chem. Chem. Phys. 2017, 19, 18948–18956. [Google Scholar] [CrossRef]
  59. Scholten, K.; Merten, C. Solvation of the Boc-Val-Phe-n Pr Peptide Characterized by VCD Spectroscopy and DFT Calculations. Phys. Chem. Chem. Phys. 2022, 24, 3611–3617. [Google Scholar] [CrossRef]
  60. Merten, C.; Li, F.; Bravo-Rodriguez, K.; Sanchez-Garcia, E.; Xu, Y.; Sander, W. Solvent-Induced Conformational Changes in Cyclic Peptides: A Vibrational Circular Dichroism Study. Phys. Chem. Chem. Phys. 2014, 16, 5627–5633. [Google Scholar] [CrossRef] [PubMed]
  61. Perera, A.S.; Thomas, J.; Poopari, M.R.; Xu, Y. The Clusters-in-a-Liquid Approach for Solvation: New Insights from the Conformer Specific Gas Phase Spectroscopy and Vibrational Optical Activity Spectroscopy. Front. Chem. 2016, 4, 9. [Google Scholar] [CrossRef] [PubMed]
  62. Weirich, L.; Blanke, K.; Merten, C. More Complex, Less Complicated? Explicit Solvation of Hydroxyl Groups for the Analysis of VCD Spectra. Phys. Chem. Chem. Phys. 2020, 22, 12515–12523. [Google Scholar] [CrossRef] [PubMed]
  63. Puente, A.R.; Polavarapu, P.L. Influence of Microsolvation on Vibrational Circular Dichroism Spectra in Dimethyl Sulfoxide Solvent: A Bottom-Up Approach Using Quantum Cluster Growth. Spectrochim. Acta Part A Mol. Biomol. Spectrosc. 2023, 303, 123231. [Google Scholar] [CrossRef]
Figure 1. ChemDraw renderings of the two possible diastereomers of Peyssonnoside A. Stereodescriptors of diastereomer 1: (1′S, 2′R, 3′S, 4′S, 5′R, 1S, 3R, 6S, 7R, 10S, 11S, 14S), 2: (1′S, 2′R, 3′S, 4′S, 5′R, 1R, 3S, 6R, 7S, 10R, 11R, 14R).
Symmetry 16 00133 g001
Figure 2. Comparison of simulated and experimental spectra for Peyssonnoside A at the B3LYP/6-311++G(2d,2p)/PCM level [27]; VDF and VCD spectra are multiplied by 2 for comparison with experiment. Simulated frequencies are scaled by 1.000 for both 1 and 2. Experimental conditions: concentration = 80 mg/mL, pathlength = 100 µm, DMSO-d6.
Symmetry 16 00133 g002
Figure 3. Comparison of simulated and experimental spectra for Peyssonnoside A at the B3PW91/6-31G(2d,p)/PCM level. VDF and VCD spectra are multiplied by 2 for comparison with experiment. Simulated frequencies are scaled by 0.980. Experimental conditions: concentration = 80 mg/mL, pathlength = 100 µm, DMSO-d6.
Symmetry 16 00133 g003
Figure 4. Comparison of simulated and experimental spectra for Peyssonnoside A at the B3PW91/6-311G(3df,2pd)/PCM level. VDF and VCD spectra are multiplied by two for comparison with experiment. Simulated frequencies are scaled by 0.980. Experimental conditions: concentration = 80 mg/mL, pathlength = 100 μm.
Symmetry 16 00133 g004
Figure 5. Two of the lowest energy conformers for 1. Reported energies are Gibbs energies at the B3PW91/6-311G(3df,2pd)/PCM level. The remaining 11 conformers are presented in Supplementary Materials.
Symmetry 16 00133 g005
Figure 6. VCD spectra of diastereomer 1 and its optimized sugar (1-sugar) and diterpene (1-diterpene) fragments at the B3PW91/6-311G(3df,2pd)/PCM level. All VCD intensities are scaled by 2 for consistency with the other figures. Bands denoted with an asterisk (*) have significant contributions from the diterpene unit to the spectrum of the whole molecule. Frequencies are scaled by 0.980.
Symmetry 16 00133 g006
Figure 7. ORD curves for 1 and 2 at the B3PW91/6-31G(2d,p)/PCM level (left) and at the B3PW91/6-311G(3df,2pd)/PCM level (right).
Symmetry 16 00133 g007
Table 1. Similarities between simulated and experimental (Exp.) spectra in the ~1100–1500 cm−1 region using the frequency scale factor that gives maximum SimVCD. Levels of theory are indicated above each set of similarity values.
B3LYP/6-311++G(2d, 2p)
Compared SpectraσSimVAMaxSimVCDSimVDF
1 and Exp.1.0350.62+0.30+0.27
2 and Exp.0.9810.40+0.14+0.23
B3PW91/6-31G(2d, p)/PCM
1 and Exp.0.9800.54+0.47+0.42
2 and Exp.0.9890.70+0.24–0.01
B3PW91/6-311G(3df, 2pd)/PCM
1 and Exp.0.9810.94+0.76+0.67
2 and Exp.0.9800.94+0.27+0.06
Disclaimer/Publisher’s Note: The statements, opinions and data contained in all publications are solely those of the individual author(s) and contributor(s) and not of MDPI and/or the editor(s). MDPI and/or the editor(s) disclaim responsibility for any injury to people or property resulting from any ideas, methods, instructions or products referred to in the content.

