Review

Sum-Frequency Generation Spectroscopy at Aqueous Electrochemical Interfaces

by
Ba Lich Pham
1,*,
Alireza Ranjbari
1,2,
Abderrahmane Tadjeddine
1,
Laetitia Dalstein
3 and
Christophe Humbert
1,*
1
Institut de Chimie Physique, Université Paris-Saclay, Centre National de la Recherche Scientifique (CNRS), UMR8000, 91405 Orsay, France
2
Département de Chimie, Institut Universitaire de Technologie d’Orsay, 91190 Gif-sur-Yvette, France
3
Laboratoire Ondes et Matière d’Aquitaine, Université de Bordeaux, Centre National de la Recherche Scientifique (CNRS), UMR5798, 33400 Talence, France
*
Authors to whom correspondence should be addressed.
Symmetry 2024, 16(12), 1699; https://doi.org/10.3390/sym16121699
Submission received: 8 November 2024 / Revised: 16 December 2024 / Accepted: 18 December 2024 / Published: 21 December 2024
(This article belongs to the Special Issue Chemistry: Symmetry/Asymmetry—Feature Papers and Reviews)

Abstract

:
The electrochemical interface (EI) is the determining factor in the yield and mechanism of sustainable energy storage and conversion systems due to its intrinsic functionality as a dynamic junction with the symmetry breaking of the molecular arrangement for complex reaction fields of mass transport and heterogeneous electron transfer. At the EI, the externally applied potential stimulus drives the formation of the electrical double layer (EDL) and governs the adsorption of interfacial adsorbate species in aqueous electrolyte solutions. Water and its aqueous electrolyte systems are integral and quintessential elements in the technological innovation of various fields such as environmental sciences, electrocatalysis, photocatalysis, and biochemistry. Although deciphering the structure and orientation of water molecules at the electrode–electrolyte interface in a quantitative analysis is of utmost importance, assessing chemical phenomena at the buried EI was rather challenging due to the intricacy of selecting interface-specific methodologies. Based on the non-centrosymmetry of the interfaces’ electronic properties, sum-frequency generation (SFG) spectroscopy has been manifested to be specifically well suited for probing the EI with detailed and comprehensive characteristics of adsorbates’ chemical structures and electrochemical events. In this review, we holistically engage in a methodical and scrupulous assessment of the fundamental EDL models and navigate towards the connection of the renowned Stark effect and potential dependence of SFG spectra at heterogeneous electrode–electrolyte interfaces. We dissect the development, advantages, and available geometrical configurations of in situ SFG spectroscopy in harnessing the EI. A broad spectrum of applications in unraveling the water orientations and rationalizing the convoluted mechanism of fuel-generated electrocatalytic reactions with particular encumbrances and potential resolutions is underscored by leveraging SFG spectroscopy.

1. Introduction

Water molecules are a pivotal instrumental component in aqueous chemical processes due to their ubiquitousness on Earth. In reactions, they can appear in the form of a reactant, a product, or a polar solvent for the solvation process. To exemplify, the two key electrochemical energy conversion processes based on chemical equations of water (H2O H2(g) + ½O2(g) − Δf298K = + 237.22 kJ∙mol−1 for H2O(l), + 228.66 kJ∙mol−1 for H2O(vap)) [1,2] in the electrocatalytic water splitting/water-based electrolysers (forward) and fuel cells (backward) contribute to addressing the imminent worldwide scarcities of green energy and water resources (Figure 1). Water is also the pervasive polar solvent for most physical and chemical phenomena owing to its high dielectric constant (κ ≈ 78.49 at 25 °C) [3]. Thus, their indispensable appearances bolster the technological innovation and research development for hygro-sensors, soil and mineral (de)formation, ocean acidification, and pollutants’ reduction in environmental chemistry [4,5]; for metabolism of charged biomembranes in living organisms [6,7]; for applications of colloidal nanoparticles in nanotechnology [8]; for hydrogen/oxygen evolution reaction (HER/OER) in oxide-based photocatalysis (artificial photosynthesis) [9]; and for hydrogen oxidation/oxygen reduction reaction (HOR/ORR) in solid oxide fuel cells [10,11], as depicted in Figure 1. During these chemical occurrences, there are two common underlying features: (1) water molecules interact with charged solid surfaces, and (2) the yield of chemical reactions is governed by the interaction of chemical species at the water interfaces. The reason for the first characteristic is that water molecules possess a high net dipole moment (μ = 1.85 D or C∙m) so that ions are easily dissolved, and charges on the surface of the material in aqueous solutions are generated responsively for chemical transformations. Then, the station of chemical changes here is considered to be the interface between a solid material (inorganic oxides, semiconductors, metals) and an aqueous solution.
The formation of charged interfaces in an aqueous solution can be derived from five key origins: (1) electrochemical process when applying an external potential to an electrode (Pt, Au, glassy carbon, etc.) in an electrochemical cell, (2) pH change via (de)protonation of surface groups (proteins or colloidal particles: NH 2   +   H +     NH 3 + where ≡ is surface-bound), (3) ion exchange between electrolyte solution and material surface via dissociation of surface groups (SiO2, TiO2: ≡ROH ≡RO + H+ with p K a = log R O H + l o c a l R O H ), (4) ion adsorption from surrounding aqueous solution (Al2O3), and (5) surface complexation through chemical complexion reaction [12]. Amongst these five particular ways of a charged surface generation, the charged electrode–electrolyte interface (origin (1)), which is defined as the electrochemical interface or electrified interface (EI), is the centerpiece of sustainable energy conversion and storage systems (batteries, supercapacitors, fuel cells, corrosion, etc.). Electrochemical interfaces are directly related to structural dynamics and heterogeneity, specifically, the charge and ion transfer at the interface boundary of the metal (electron conductor) and the aqueous electrolyte (ion conductor), which is the core of decisively manipulating the efficiency of electrochemical energy conversion [13]. On the one hand, the pursuit of optimizing the matching between the novel electrolyte and modified/functionalized electrode materials, and discovering next-generation electrocatalysts to improve the overall electrochemical performance is mainly inclined to more preference. On the other hand, the knowledge of the dynamic nature of aqueous electrochemical interfaces is still overlooked and insubstantial. Therefore, to understand the mechanism of electrochemical transitions under an aqueous medium, in-depth insight into water interfaces must be addressed and analyzed.
At electrochemical interfaces, the active sites are the key features that drive the electrochemical mechanism in electrocatalysis (specifically HER in Figure 2a,b and OER in Figure 2c). At the microscopic scale, adsorption layers close to the metal surface form a specific configuration for charge transfer and water reactivity. Water molecules and solvated adsorbate ions interplay in close proximity via covalent bonds and three other types of weak intermolecular interactions (van der Waals/ London dispersion interactions, electrostatic forces, and hydrogen bonds) [14,15]. Thus, knowing how to manipulate and control their structure, composition, and density could ameliorate the kinetics and robustness of the metal surface. Regarding the critical factors maneuvering the complexity of electrochemical interfaces, they can be derived from: (1) the chemical nature of the electrode surface structure, (2) the composition of the electrolyte solution (multivalent ions), and (3) the environmental conditions (concentration, pH, ionic strength, temperature) that affect the structure of adsorbed layers [12,16]. Nevertheless, the pattern of adsorbate layers (ad-layers) is primarily contingent upon an external electrical potential between the working electrode surface and a counter electrode. In principle, when applying a negative/positive potential on the working electrode, the energy level of electrons on that electrode increases/decreases (surface charge accumulation), resulting in attracting atoms that bear a partially positive (δ+) electric charge or being attracted by atoms that bear a partially negative (δ) electric charge, respectively. These propensities navigate surface charge and absorbates’ orientation and reorganization of electrochemical systems. Hence, the potential-dependent behavior of the electrochemical interface displays a kinetic and dynamic delineation of the electrode surface and adsorbed species and water molecules chemistry.
Numerous analytical electrochemical methods (differential-pulse (DPV) and square-wave (SWV) voltammetries, chronoamperometry (CA), linear sweep voltammetry, cyclic voltammetry (CV), anodic/cathodic stripping voltammetry (SV), etc.) purely determine the macroscopical bulk information of electrochemical systems without much detailing about structural changes upon any redox events. Particularly, DPV, SWV, and SV are electroanalytical techniques aiming to eliminate the residual current (comprising non-faradaic charging current from the electrical double layer and faradaic current from the redox reaction of trace interferents or impurities) and to enhance the faradaic current from the redox reaction of interest [17]. To analyze the know-how of complex electron transfer reactions on a microscopic scale, surface characterization methods such as microscopy, diffraction, or spectroscopy are required to be coupled with analytical methods. Selecting a hyphenated system that combines two classical methods, electrochemistry and microscopic/spectroscopic techniques, relies on both the requirements of high temporal and spatial resolution. Hyphenating the electrochemical interfaces with surface characterization techniques can be conducted through ex situ (off-line) or in situ (on-line) approaches. Ex situ methods refer to performing the surface characterization outside the electrochemical cell in an external device under an ambient or high vacuum environment such as transmission electron and scanning electron microscopy (TEM and SEM), while in situ methods involve the characterization measurement of the electrode surface within being immersed in the aqueous solution of the electrochemical cell, often under operating conditions such as potential control [3,18]. Provided that the electrode is removed from the electrochemical environment, leading to the possible variation of the nature and stability of the electrode surface, ex situ techniques limit the capability to be well-fitted with electrochemistry coupling. Surface characterization tools are required to study a true atomistic insight into complex electrochemical interfaces on in situ (simulated realistic operating conditions) or even operando realistic conditions during electrochemical reactions. Hence, in situ structural characterization of electrochemical interfaces provides a detailed molecular-level rationale of the electrode–electrolyte surface structure and elementary steps of the interface reactions.
Figure 2. Schematic illustrations of (a,b) the hydrogen evolution reaction (HER) mechanisms and (c) the more complex oxygen evolution reaction (OER) mechanisms in electrocatalysis or heterogeneous catalysis where M* symbolizes the active site of the metal M electrocatalyst; M*–Had is the chemically surface-adsorbed hydrogen ad-atom; M*–OH, M*–O, M*–OOH are the adsorbed metal hydroxide, oxide, hydroperoxide intermediates, respectively. In the HER, a direct coupling mechanism between the adsorbed species and the other non-adsorbed reactant (Eley–Rideal mechanism) is expressed in the Volmer–Heyrovsky pathway, while the Volmer–Tafel mechanism obeys the Langmuir–Hinshelwood type which both reactants first adsorb on the active sites before a coupling reaction occurs. Blue curved arrows denote the reaction steps in an acidic condition while orange ones are in an alkaline or a neutral medium. Dashed lines represent the formation of chemical bonding. This scheme is inspired by references [16,19,20].
Symmetry 16 01699 g002
In surface chemistry, scanning tunneling microscopy (STM) and atomic force microscopy (AFM) from the scanning probe microscopy technique are two potential candidates for providing high-resolution surface characterization tools [3]. While AFM overcomes the restriction to the electronically conductive surface of STM, which is not the case for metal electrode surfaces, it offers supplementary configuration about surface topography and surface forces. Due to the tip’s presence and its possible interaction with the surface, the electrochemistry-coupled surface techniques can probe and induce local changes in conductivity, kinetically reaction rates, thermodynamically electrical potentials, and chemical reactivity with high spatial resolution, such as scanning electrochemical microscopy (SECM) [21] and electrochemical scanning tunneling microscopy (ECSTM) [22]. Nevertheless, their diffusional broadening effect and the convolution of reactivity and topography in their electrochemical response are their limitations [23,24]. Interestingly, a recent study has revealed the dynamics of ion transport at the electrode–electrolyte interface (the EDL) by employing a transient single-particle imaging technique [25].
The introduction of spectroscopy to electrochemistry (spectroelectrochemistry) can extend even more chemical and electronic structure information of molecules at the interface. X-ray photoemission spectroscopy (XPS) [26,27], adsorption, and emission spectroscopies (XAS and XES) [28,29,30] are considered element-specific surface-sensitive techniques revealing the electronic energies and the nature of redox states of species. Likewise, energy-dispersive X-ray analysis (EDX) or Auger electron spectroscopy (AES) also render the binding energy of the emitted X-rays or Auger electrons for elemental analysis, respectively. However, electron-based spectroscopy methods generally oblige an ultra-high vacuum (UHV) framework, and it is quite challenging to characterize surfaces under liquid environments and/or buried electrodes [31]. In this context, optical spectroscopic methods such as infrared reflection absorption (IRRAS) and Raman [32] spectroscopies can be good assets. Total internal reflection (TIR) configuration for optical spectroscopies (TIR Raman scattering or attenuated total reflection (ATR) IR) is categorized as non-destructive and surface-sensitive probes for thin films and interfaces [33,34,35]. The principle of TIR-based spectroscopies relies on the generation of an evanescent wave at the interface between two media (e.g., non-metallic glass prism and air or sample solution) and the interaction of this wave with sample surface [34]. However, coupling TIR optical spectroscopies (IR and Raman) with an electrode (metal surface) encounters several issues: (1) strong adsorption of IR radiation by metals with high absorption coefficients, (2) poor penetration at sample surface and loss of evanescent field due to reflection and scattering phenomena, (3) energy diversion of surface plasmon polariton (SPP) effect from the evanescent wave, and (4) the opacity of metal to IR light [33]. As a result, the nature of light interaction at the electrochemical interface in TIR configuration is non-ideal for coupling with a metal surface because it does not support efficient Raman/IR signal generation.
With the influential breakthrough of surface- and tip-enhanced Raman scattering (SERS [36,37] and TERS [38,39]) and surface-enhanced infrared absorption spectroscopy (SEIRAS) [40,41,42,43,44,45,46], surface-plasmonic (SP) enhancement-based electrochemical vibrational spectroscopies can recently be able to potently reach down to single atomic scale for buried electrochemical interfaces probing due to their high surface specificity. The limiting factors in these techniques in the breadth of practical applications are the obligation of having (1) a rough surface of noble metal electrodes (e.g., Au, Cu, or Ag) or nanoparticles (nanostructure-based or tip-based mode) and (2) “hot spots” in the gap between the nanoparticles for surface sensitivity. Noticeably, the reproducibility and repeatability of the tips in TERS can be onerous [39]. Thus, the inevitable inhomogeneity on the surfaces yields elusive interfacial information about conformation and orientation at the molecular level. The ultrathin, pinhole-free dielectric shell-isolated nanoparticle-enhanced Raman spectroscopy (SHINERS) was devised to resolve this hurdle for flat electrodes (metal, graphite) [47,48,49,50]. Some research has also employed the principles of nuclear magnetic resonance spectroscopy (NMR) or imaging (MRI) methodology to study the phenomena of electrified interfaces [51,52,53,54] but NMR spectroscopy requires exclusive cells, and probes in the setup and still remains challenges to couple due to its nature of the bulk sensitivity and in situ MRI is relatively nascent and in its early stages of development.
One of the fundamental limitations of linear optical spectroscopies (UV-Vis and IR) in the external reflection spectroscopic mode (normal mode) is that they are bulk sensitive [55]. The selectivity and sensitivity of interface data acquisition do not yield solely from the electrical double layer (EDL) surface region but also emanate largely from bulk contributions. To address this issue, an even-order non-linear optical spectroscopy is utilized to provide a plausible solution to surface insensitivity. Vibrational sum frequency generation spectroscopy (SFG or VSFG) or sum-frequency vibrational spectroscopy (SFVS) suffices the demand for an in situ molecular-specific and inherently surface-sensitive technique for analyzing the chemical vibrational data fingerprint of molecules at electrode–electrolyte interfaces. The innate symmetry breaking at electrochemical interfaces is the hallmark of symmetry rules to achieve SFG signals. One appealing feature SFG offers is the congruence of operation on both well-defined single crystals and rough electrode surfaces. Even though SFG seems to be a potentially applicable probing method, electrochemical interface analysis remains a challenging task by virtue of the intricate nature of the interfaces and the inadequately developed and limited variety of methodologies. Traditional homodyne SFG is not able to allocate the separation of the real and imaginary parts of the interfacial vibrational signal and thereby reveal an equivocal determination of molecular organization [56]. Phase-sensitive/-specific or heterodyne-detected SFG (PS-SFG or HD-SFG) advances the surface sensitivity, reaching sub-monolayer surface coverage as low as a few percent of a monolayer compared to its predecessor (direct or homodyne SFG) [57]. These merits could be decisive elements for probing electrode–electrolyte interfaces by PS-SFG vibrational spectroscopy under operando conditions.
It is correct that heterodyne-detected (HD)-SFG offers several significant advantages over conventional SFG in some aspects. Conventional SFG with homodyne detection can only extract the absolute square of the second-order nonlinear susceptibility | χ S , e f f ( 2 ) ) | 2 in SFG spectra and the spectral distortion from the interference between resonant and non-resonant contributions and/or between distinctive vibrational resonances [58]. However, HD-SFG has addressed this issue and provided molecular-level insights into the up/down orientation of interfacial molecules from the sign of the imaginary part ( ± I m χ S , e f f ( 2 ) ). Despite all the advantages of HD-SFG mentioned above, the development of in situ HD-SFG for electrochemical systems encounters some barriers: (1) the requirement of complex and expensive setup for HD scheme with respect to the conventional ones, (2) time resolution limitation to couple with fast electrochemical techniques, (3) challenges in application to rough surfaces, and (4) high sensitivity to environmental conditions (temperature, vibrations, light interference, etc.). As a whole, HD-SFG is an advanced SFG spectroscopic technique and remains a valuable tool for studying electrochemical interfaces, particularly in energy and catalysis research. Continued developments in instrumentation and data analysis procedures may resolve the aforementioned limitations and enlarge its applicability.
Astonishingly, terahertz (THz) spectroscopy has lately been adopted in conjunction with studies about the water interfacial layers without [59] and with in situ electrochemical conditions [60,61]. Terahertz spectroscopy is a spectroscopic method using submillimeter radiation (between microwave and far-infrared regions in the electromagnetic spectrum) to study a wide variety of materials (1 THz = 33 cm−1 = 1 ps = 0.3 mm). Initial results of hydrogen-bonded water networks at the Au electrode in different aqueous pH environments [40] suggest THz as a potential and exceptional technique for further studying the structures of water at the buried EI.
This review aims to provide a thorough insight into in situ SFG–electrochemistry coupling systems to decipher the chemical occurrences and surface organization at aqueous interfacial regions under a potentiostatically controlled electrochemical environment. First and foremost, we will emphasize the classical theories of the electrical double layer in Section 2, which serves as a cornerstone for the fundamental and applied research in electrochemical energy storage and chemical conversions. Some critical limitations of mean-field theory are succinctly discussed. Furthermore, we herein address the principles of SFG spectroscopy’s symmetry selection rules in Section 3 for non-centrosymmetric electrochemical interfaces. Particularly, we also highlight the well-known vibrational Stark effect and the distinct potential-dependent attribute of the SFG signal. Some considerations for experimental configurations with respect to spectroelectrochemical cells are also supplemented. We will then delve into the particular studies (water molecules, charged molecules, and neutral molecules) of SFG at the aqueous electrochemical interfaces in Section 4, leaning towards applications of electrocatalysis, adsorption–desorption phenomena, and electrochemical transformation. Last but not least, we present some perspectives and initiatives for future research considerations to gain a better comprehension of electrochemical interface studies.

2. Descriptive Models of the Electrical Double Layer and Its Mean-Field Theory

Despite the aforesaid prominent significance of electrochemical interfaces in many fields in the Introduction, the electrical double layer (EDL) and its models must be concomitantly and indispensably discussed. To interpret structurally the arrangements of contributing species in a charged interface, it necessitates constructing a descriptive model to speculate its properties and examine the rightness and appropriateness of the model to real phenomena [3]. Irrespective of the ways in which a charged interface is formed, an electrostatic attraction to oppositely charged species (counterions) from an aqueous bulk solution originates from this interface. Electrochemically, an electric field exerting an external potential on a charged electrode will draw distant counterions towards the electrode via attractive forces. This migration accumulates counterions near the electrode, and it is contemporaneous with the coions’ diminution. This movement is associated with a flow of transient charging current. The region of two opposite charged layers at the electrode–electrolyte interface is conventionally regarded as the electrical double layer (EDL).
The aforementioned definition of the EDL is the earliest and simplest model commencing from Helmholtz’s postulate (1853) [62]. The direct binding of counterions to the electrode surface is organized in a way that their total charges are equivalent to the total charges of the electrode surface. This neutralization results in two sheets of charge with opposite polarities, referred to as a parallel-plate capacitor (the Helmholtz layer, or compact layer, or Stern layer later on) (Figure 3a). The potential in the Helmholtz layer reduces linearly, and the differential capacitance of this capacitor-like arrangement is calculated by C d = ε ε 0 d (in farads, F) where ε is the dielectric constant of the medium or relative permittivity (dimensionless), ε 0   is the vacuum permittivity (8.85 × 10⁻¹⁴ F∙cm−1), and d is the interplate spacing or thickness of the double layer (cm) [63]. This description is beneficial in elucidating the basic features of charged surfaces, but the shortcoming of the Helmholtz model directly stems from the evaluation of a constant capacitance. Utilizing electrochemical impedance spectroscopy (EIS), the capacitance C d actually depends on applied potential and electrolyte concentration, so ε and d becomes variables. A more sophisticated concept was proposed by Gouy (1910) [64] and Chapman (1913) [65], individually taking thermal fluctuations of the ions into consideration. This thermal motion partly liberates counterions apart from the electrode surface to the bulk, which causes spatially inhomogeneous ion distribution along the surface normal under potential control and establishes the expanse of the EDL rather than a molecular layer. Thus, they introduced a so-called “diffuse layer” from the thermal effect and formulated the equilibrium ions’ distribution by Poisson–Boltzmann theory to flat surfaces (Figure 3a).
In the diffuse layer (DL), the electrical potential ( φ ) obeys an exponential decay with respect to the distance starting from the outer Helmholtz plane (OHP, z = 0 + ) (Figure 3b):
φ z = φ 0 + × e κ z = φ O H P × e z κ 1
where φ O H P or δ S t e r n is the surface potential (mV) at the OHP (red dashed vertical line), κ 1 is Debye length (Å), and z is the distance from the electrochemical interface (Å). The Stern potential ( δ S t e r n / O H P ) is the boundary potential that distinguishes the potential profile discrepancies between the Stern layer (linear reduction) and the diffuse layer (exponential reduction). It is approximately assumed to be equal to the zeta potential (ζ)—electrokinetic potential at the slipping or shear plane (SP) in colloidal dispersions. The SP is the conceptual boundary within the DL of the EDL where the fluid begins to flow independently from the stationary charged surface (green dashed vertical line in Figure 3). There is an infinitesimal disparity between these two values due to the hydration shell formation. It is also noteworthy to mention that the potential/point of zero charge (PZC or particularly potential of zero total charge (PZTC) where the actual surface potential at z = 0 equals 0 ( φ 0 = 0)) in electrochemical interfaces and the isoelectric point (IEP) in colloidal sciences are also not unnecessarily tantamount to each other [70]. By definition, the IEP is the concentration of potential-determining ions (counterions) such as pH(IEP) where ζ potential is at 0 mV, inducing the electrokinetic instability of colloidal systems (e.g., rapid coagulation or flocculation of metal particles) while the surface charge at the PZC is zero (no excess charge prevailing at the electrode) (Figure 3b). The sign of ζ potential is defined as the difference between the pH at the IEP and the measured pH of the solution. This means that there are still some charged species (specifically adsorbed, partially or non-hydrated ions) at the Stern layer when reaching IEP (non-zero surface charge) so IEP and PZC are not interchangeable. The definitions of PZC and the importance of PZC determination are considered in greater detail in Section 3.4. In summary, surface potential directly refers to the solid–liquid interface, particularly the electrode–electrolyte interface whilst ζ potential is ascribed to the hydrodynamic interface.
Furthermore, whether or not the surface potential ( φ 0 ) is determined by the experiment is still debatable and ambiguous. Technically, amongst other types of electrical potentials (internal Galvani potential ϕ and external Volta potential ψ ), the surface potential φ (also known as surface potential jump or surface electrical potential) is estimated when a charged species penetrates into the internal bulk phase of metal M from a distance of approximately 1 μ m with respect to the interface (Figure 4a,b). For the treatment of the EDL, the defined surface potential simply covers all regions of the EDL (the Stern and diffuse) and can be related to the potential drop in the Stern layer and the potential from the diffuse layer by φ 0 = φ S t e r n d r o p + φ O H P [71]. In other words, the surface potential φ 0 can be trivially expressed as the electrical potential difference between the electrode surface and the bulk ( ψ = 0 ), and it does not become a paradox with the definition of internal Galvani potential ϕ due to no metal bulk intervention. Nonetheless, the assumption of an infinitely thin or sharp surface (continuum model) and the equivocality of bulk position do not effectuate a clear-cut experimental determination of φ 0 [12]. Only external potential ψ , specifically φ O H P for the EDL, can be experimentally accessible from the measurable potential difference in a common phase condition.
About a decade later, Debye and Hückel (1923) treated the non-linearized Poisson–Boltzmann equation for calculating the potential and ion distribution around spherical or curvature-like surfaces [73]. From solving the linearized Poisson–Boltzmann equation, the decay length or “Debye length”, which is a critical parameter to characterize the thickness of the diffuse layer, is extracted (Figure 3a,b).
λ D = κ 1 = ε ε 0 k B T e 2 i N C i 0 z i 2 1 2 = ε ε 0 k B T 2 e 2 I 1 2
where λ D = κ 1 is Debye length, k B is Boltzmann constant, T is the absolute temperature (in Kelvin), e is the elementary charge, C i 0 is the bulk concentration of ion i which is with the corresponding charge z i , N is the total number of charged species, and I is the ionic strength of ionic solution ( I = 1 2 i N C i 0 z i 2 ). From (2), it is evident that λ D and I are inversely proportional to each other: the Debye length decreases when ionic strength increases and vice versa. For a dilute aqueous solution ( ε  = κ ≈ 78.49) containing only z : z electrolyte ( M z + X z ) at 25 °C, λ D = 3.29 × 10 7 z C 1 / 2 (cm) where C is the bulk concentration of electrolyte M X (in M) [3].
The Poisson–Boltzmann theory is a continuum mean-field approach based on three main assumptions in the treatment of the diffuse electrical double layer: (1) all ions are distinct, individual point charges and solely interact with each other through electrostatic forces, (2) solvent, specifically water, is a continuous medium with a constant dielectric constant κ, and (3) ions in solution possess a continuous charge distribution near a planar solid surface and the interplate spacing d follows a spatial average distance from the electrode surface (Boltzmann distribution) [3,14]. The Gouy–Chapman model described sufficiently and relatively well the ions’ distribution in the EDL for many applications, especially in the aqueous system of low monovalent electrolyte concentrations (<0.2M) and low potentials (<50–80 mV) [14]. This could be merely attributed to the prevalence of Coulombic interactions in most systems and the neglect of major local structural considerations. On the other hand, the model is invalid to predict the value of C d in high electrolyte concentration systems under high potentials compared to the point where charges of surface are neutralized (potential of zero charge, PZC). The rationale for the imperfections could be ascribed from Poisson–Boltzmann theory assumptions per se by disregards of (1) finiteness of ions’ size and their non-Coulombic interactions (hydration shell, hydrogen bonding), (2) the encumberment of the electric field on water molecules at the interface and counterions’ effect to κ value of water, (3) the nature of ions and their heterogeneous surface charges, and (4) the impracticality of an ideal planar surface [14].
To address the limitations of the Gouy–Chapman model, Stern (1924) considered the finite property of counterions’ size and hydration effect by combining the ideas of two former models [74]. The Stern model (or Gouy–Chapman–Stern (GCS) model) modified double layers into two distinctive layers: (1) the inner Stern layer, or Helmholtz layer, and (2) the outer Gouy–Chapman layer, or diffuse layer (Figure 3a). The Stern layer is an adsorbed layer of possible water molecules at the interface and immobile hydrated counterions detached from the electrode surface at a defined distance ( d S t e r n ). The electric field interferes with the static dipole moment of polar water molecules, resulting in a thermodynamically favorable orientation and organization at the interfacial region. The solvation process of ions by surrounding water molecules establishes hydration shells of ions that keep them in a finite proximity to the surface. Thus, d S t e r n is the “plane of closest approach” estimated by the distance from the electrochemical interface to the core of hydration shells, which is marked as the outer Helmholtz plane (OHP) (red dashed vertical line in Figure 3a). This plane is the border separating the Stern layer from the diffuse layer. On the contrary, solvated ions (counterions and coions) in the diffuse layer are mobile in traveling in a Poisson–Boltzmann solution. This layer is characterized by the above-mentioned Debye length ( λ D ) from OHP to the bulk solution. Furthermore, the combination of the Stern layer and the Gouy–Chapman diffuse layer resembles two capacitor-like structures in series, so the total differential capacitance ( C G C S ) of the GCS model is calculated as C G C S 1 = C O H P 1 + C D L 1 where C O H P , C D L are the capacitances of the Stern and diffuse layers, respectively (Figure 3b). If the electrochemical interface is under the conditions of larger polarizations φ a p p l i e d φ P Z C and high electrolyte concentration in the aqueous solution, counter ions incline to dwell stably at OHP close to the electrode surface, which is alike to the Helmholtz model.
Later on, Grahame (1947) introduced the adsorption phenomena of specifically adsorbed species and non-specifically adsorbed solvated ions to the GCS model, which was constructed via long-range Coulombic forces and overlooked the chemical identities of counterions [75]. Grahame defined an inner plane in the Stern layer (inner Helmholtz plane, IHP) that some non-hydrated coions, partially hydrated counterions, and neutral molecules act as adsorbates to tightly attach to the electrochemical interface via peculiar short-range interactions (orange dashed vertical line in Figure 3). That determines the two sub-layers in the Stern layer: IHP consists of “specifically adsorbed” species while OHP is the plane of “non-specifically adsorbed” counterions’ residence (Figure 3a). The organization of species at IHP was totally dependent upon the applied potentials, electrolyte’s nature and concentration, and electrode characteristics. Furthermore, Bockris, Devanathan, and Müller (1963) sharpened the GCS model by designating the variation of water solvent’s relative permittivity [76]. To be more specific, the rotation intactness of water’s “effective” dipole moment from their collective alignment reduces strongly from IHP to OHP until the diffuse layer (bulk-like water is free to rotate with more or less no alignment) despite retaining the dipole moment of individual water molecules with ca. 1.85 D (Figure 3a). Within IHP, a packed monolayer of water under the influence of a strong electric field leads to its dielectric saturation, while water in hydration shells has a more randomized orientation compared to IHP but is still aligned. The dielectric strength of water, then, decreases when going further into the interface. Figure 3 demonstrates the holistic picture of the electrical double layer model. There are numerous review papers discussing the EDL elsewhere [77,78], which readers can refer to and look into in detail.
All in all, the GCS model prevailingly and widely succeeds in disentangling the EDL in dilute aqueous electrochemistry. It does not, however, suffice to explain the metal/liquid interface of non-aqueous electrolyte (the ionic liquid), and other driving forces, especially strong Coulombic interactions, should be taken into account [79].

3. Sum-Frequency Generation Spectroscopy at Electrochemical Interfaces

3.1. Fundamentals of Sum-Frequency Generation Spectroscopy

From the optical spectroscopic point of view, the polarization of materials P ( ω ) is defined as:
P ω = ε 0 χ ( 1 ) E ω + ε 0 χ ( 2 ) E ω 2 + ε 0 χ ( 3 ) E ω 3 +
where E ω is the electric field, χ ( n ) is the electric susceptibility of the nth order. In linear first-ordered optical processes such as refraction, IR/Vis absorption and emission, diffusion, and extinction employed in the study of χ ( 1 ) properties of materials, their polarization is the first term ( P ω = ε 0 χ ( 1 ) E ω ). These are one-photon spectroscopies with no frequency (color/energy) conversion. Nonetheless, the polarization of non-linear processes (normally second and third order) also contains latter terms. These multi-photon spectroscopies occur within a spectral range going from the IR to the Vis wavelengths, requiring the use of laser sources for the generation of non-linear optical processes. While third harmonic generation (THG) and Raman processes (four-photon mixing), fluorescence, optical Kerr effect, and sum-frequency generation (SFG) under a static field are third order processes, second harmonic generation (SHG) and sum/difference-frequency generation (SFG/DFG) spectroscopies are three-photon mixed second-order optical processes with a third-rank tensor χ ( 2 ) (Figure 5). To investigate the optical and electronic characteristics of materials at interface and bulk, non-linear optical spectroscopies up to χ ( 3 ) are efficient enough to analyze in practice.
Regarding the prerequisite condition for the occurrence of a second-order non-linear optical process, it requires the non-centrosymmetric materials to exhibit a non-zero susceptibility ( χ ( 2 ) 0 ) under the electric dipole approximation. For instance, susceptibility is not null at (1) anisotropic crystals, (2) chiral entities (stereoisomers, enantiomers) [80,81], or (3) at the symmetry-breaking interface of two dielectric media (a centrosymmetric crystal and an electrolyte solution), and (4) from electric-quadrupolar response of bulk materials. It is forbidden for centrosymmetric materials, such as bulk materials, due to the appearance of an inversion center (i) or a center of symmetry. From the principle of group theory, any molecules containing both symmetry elements (a C 2 axis through a ( 360 2 = 180 ) 0 rotation angle and a mirror plane at right angles) under the symmetry operation of inversion (i) are described as being centrosymmetric [82,83]. The vanishing of χ ( 2 ) at a centrosymmetry medium yields non-linear processes of even parity (second-order), becoming an ideal surface-sensitive optical technique to probe the molecular responses (electronic and/or vibrational information of materials) at electrochemical interfaces. While SHG is a prominent surface-specific second-order non-linear optical tool to study the electronic properties of molecular structures near surfaces, SFG is considered an in situ vibro-electronic spectroscopic probing tool from atomic to complex interfaces [84].
Figure 5. Molecular energy diagrams for linear (IR) and non-linear optical spectroscopies (Raman, CARS/CSRS, SFG/DFG and SHG). (g: ground state, v: vibrational state, e: virtual electronic states (e1 and e2); IR: infrared, CARS: coherent anti-Stokes Raman scattering, CSRS: coherent Stokes Raman scattering, SFG: sum-frequency generation, DFG: difference-frequency generation, SHG: second-harmonic generation; Vis: visible, NIR: near-infrared, S: Stokes, AS: anti-Stokes. This figure is inspired by reference [85], Copyright © 2019 MDPI.
Symmetry 16 01699 g005
Sum-frequency generation (SFG) spectroscopy is a second-order nonlinear optical probe describing a conversion of two processes: an absorption of an infrared (IR) photon, proceeded by an anti-Stokes (AS) Raman scattering of a visible (Vis) photon (or near IR 800 nm which historically was defined as visible in femtosecond SFG setups). Provided that the generated photon acquires ω A S = ω V i s + ω I R , incident laser beams, a sum-frequency photon is detected. Therefore, to efficiently generate an SFG photon from combining 106 Vis photons and 106 IR photons, it is a must for two intense laser beams to spatially and temporally overlap at the probed interface so that two conservation laws are met: ω S F G = ω V i s + ω I R (energy) and k S F G = k V i s + k I R (momentum or phase matching condition) [85]. By convention, the energy conservation law is stated in frequency ( ν ) but expressed in wavenumber ( ω in cm−1) in the practical sense. The frequency terms, henceforward, will literally mean the energy marked in cm−1 in SFG spectra and other analyses. A detailed comparison between SFG and two individual constituent spectroscopies (IR and Raman) is represented in Table 1.
At the molecular level, an SFG process can be active if and only if the molecular hyperpolarizability β (non-linear second-order electric polarizability) is simultaneously Raman and Infrared active (selection rules). In other words, from the macroscopic view of the non-linear second-order susceptibility of a structured surface (a set of molecules at an interface), χ l m n ( 2 ) is always different from zero because of the symmetry breaking of the electronic properties at this specific location, so β i j k 0 at the microscopic point of view. Thus, there must be a change in both Raman polarizability α and IR dipole moment μ of the vibrational transitions of structured molecular systems during SFG spectroscopy at interfaces. While Two-Color SFG (2C-SFG) spectroscopy, where both IR and visible beams are tuned, can assess the vibro-electronic spectroscopic information of non-centrosymmetric interfaces, SFG can also operate in the mode of one-color tuning (either ω V i s or ω I R ) [86]. With a fixed visible wavelength ( ω V i s is constant) in the vibrational SFG without electronic specificity, χ l m n ( 2 ) is written as:
χ l m n 2 = N s i j k T i j k l m n β i j k 0
where N s is the surface density of the adsorbed molecules, T i j k l m n indicates the coordinate transformation from molecular framework to structured sample, and
β i j k = v = 1 n 1 2 ω v α i j Q v Q v = 0 μ k Q v Q v = 0 ω I R ω v + i Γ v
where α i j is anti-Stokes Raman polarizability, μ k is IR dipole moment, Q v is v th vibration normal coordinate, ω I R   is the incident IR frequency, ω v   is the resonant vibration frequency of v th mode or the position of the v t h peak (in cm−1), and Γ v   is the damping coefficient of v th vibration mode or half width at half height (HWHH) of the v t h peak (in cm−1). When the excitation of IR wavelength or frequency ( ω I R ) coincides with the eigenfrequency ω v , the resonance of vibrational frequency occurs.
SFG is a versatile technique to study the fundamental characteristics of interfaces: electrochemical interface, nanostructured metal interfaces (plasmonic), and semiconductors (excitons) for the development of biosensors and electrocatalysts [87]. SFG is known as intrinsically surface-sensitive spectroscopy, which is almost the case for species adsorbed at interfaces [88]. In the case of functionalized nanoparticles (Au or functionalized quantum dots, CdTe) grafted with anchoring molecules on a solid substrate (metal, glass, prism...), the SFG signal is derived from grafted or functionalized molecules, substrate, and nanoparticle responses. However, inorganic components (e.g., substrate and nanoparticles) are generally non-resonant to IR vibrational frequencies of the examined range. Taking mercaptopropionic acid ligand-capped CdTe quantum dots (QDs) grafted on the glass substrate through (3-aminopropyl)triethoxysilane (APTES) molecules as an actual instance, it is a combined contribution of the inorganic components of the samples (glass slide and CdTe core) ( A e i Φ ) and the remaining part from organic components (APTES or functionalized molecules on QDs) (Figure 6). As a result, the effective surface second-order non-linear susceptibility χ i n t e r f a c e ( 2 ) or χ S , e f f ( 2 ) of the interface is expressed as below.
χ i n t e r f a c e 2 = χ s u b s t r a t e 2 + χ a d s o r b a t e 2 = χ n o n r e s o n a n t 2 + χ m o l e c u l e s 2
with χ n o n r e s o n a n t ( 2 ) = A e i Φ and χ m o l e c u l e s ( 2 ) = v = 1 n a v e i ψ v ω I R ω v + i Γ v (the sum of Lorentizian-shape functions), where A   is the contribution of amplitude of the background, Φ is the phase of the background, v is the index of peaks (vibrational modes), a v is the amplitude of the v t h peak, and ψ v is the phase of the v t h peak, which is assumed to be zero for the sake of simplicity. Then, the SFG intensity is calculated as:
I ( ω S F G ) χ i n t e r f a c e ( 2 ) : E ( ω I R ) E ( ω V i s ) 2     I ( ω S F G ) P ( ω S F G ) 2  
I ( ω S F G ) = 8 π 3 ω S F G 2 s e c 2 θ S F G c 3 n a i r ω S F G n a i r ( ω I R ) n a i r ( ω V i s ) | χ i n t e r f a c e ( 2 ) | 2 I I R I V i s  
where
| χ i n t e r f a c e ( 2 ) | 2 = | χ n o n r e s o n a n t ( 2 ) | 2 + | χ m o l e c u l e s ( 2 ) | 2 + 2 cos a r g χ m o l e c u l e s 2 a r g χ n o n r e s o n a n t 2  
χ i n t e r f a c e 2 2 = A 2 + a v 2 ( ω I R ω v ) 2 + Γ v 2 + 2 A a v ( ω I R ω v ) 2 + Γ v 2 1 2 cos ψ v Φ 2 a r c t a n Γ v ω I R ω v + ( ω I R ω v ) 2 + Γ v 2 1 2   B
with I I R and I V i s the intensities of the incident IR and visible laser beams, respectively. θ S F G is the outgoing angle of incidence of the SFG beam travelling to the monochromator. c is the speed of light in vacuum, n a i r is the refractive index of the upper medium (ambient air) at frequency ω , and B is the value of the cosine function in Equation (10).
As can be seen, the square norm of the effective second-order susceptibility of a single vibrational mode has the attendance of the non-resonant background, the IR vibrational resonance, and interference factor (phase shift between the substrate and the adsorbed molecules) contributions pertain to the first, second, and third term, respectively. Depending on whether it is a constructive or destructive resonance, the SFG spectrum shapes as a peak (B = +1), a dip (B = −1), or a Fano resonance (B is between −1 and +1) [84].

3.2. The Electric Field-Dependent Vibrational Stark Effect at Electrochemical Interfaces

The vibrational Stark effect is an induced energy-level shifting effect (vibrational frequency shifts) of a particular molecular vibrational mode of a molecule experiencing a perturbation of an external electric field [91,92,93]. An associated transition dipole moment change between the levels is also induced. However, this slight peak shift of a vibrational mode in vibrational Stark spectroscopy does not yield a spectral line shape change [94]. The vibrational responses under the influence of E (vibrational mode variations) were found to be equal to the sum of a linear vibrational dipole moment change Δ μ and a quadratic vibrational polarizability change Δ α (Equation (11)). The first term is named the linear Stark effect (first-order component) while the latter is referred to as the quadratic Stark effect (in second order) (Figure 7).
Δ ω = ω ω 0 = 1 h c Δ μ · E + 1 2 E · Δ α · E  
where h is the Planck’s constant (6.626 × 10⁻³⁴ J∙s), c is the speed of light in vacuum (~3 × 10 8 m∙s−1), ω   ( ω 0 ) is the frequency of a molecular vibrational mode with (without) an external electric field, E is the amplitude of interfacial field strength, and Δ μ and Δ α are the differences in dipole moment (charge separation or charge transfer) and polarizability between the ground and excited vibrational states of a molecular vibrational mode, respectively.
Both of Δ μ and Δ α are entirely affected by the circumambient chemical environment of the molecules. Due to field-induced bond changes, the acquired values of Δ μ and Δ α are not identical to the expected values [95]. Thus, these notations are not precisely accurate in the technical sense but acceptable for simplicity. It is worth mentioning that Δ μ is also termed as the Stark tuning rate, which signifies the environmentally induced sensitivity of a vibrational frequency to local fields [96]. The amplitude of the Stark tuning rate can be determined experimentally or computationally. This electric-field-induced Stark effect is an analogous principle to the previously renowned magnetic-field-induced Zeeman effect with the splitting of spectral lines of a sample.
In addition, another highlight that should be noted here is that the local electrostatic fields can spring not only from externally applied electric fields from the electrode surfaces but also from solvation field (the Onsager reaction field model [97]), such as solute–solvent interactions, which is also a factor causing the vibrational shift. Therefore, the local field imposed on the molecule is greater than the average interfacial electric field ( E e x t e r n a l = φ s where φ , s are potential changes and electrode spacing in that direction, respectively), and the measured shifts deviate from the calculated ones. Thus, an introduction of a local field correction factor ( f L F ) —an empirical scaling factor to Equation (11)—necessitates calibrating the bias, and the effective local electric field is expressed as follows: E = f L F E e x t e r n a l , then (11) becomes:
Δ ω = 1 h c Δ μ · f L F E e x t e r n a l + 1 2 f L F E e x t e r n a l · Δ α · f L F E e x t e r n a l  
This denoted f L F correction factor is estimated from the data fitting procedure of experimented vibrational spectra under the umbrella of the Stark effect (normally between 1.1 and 1.3) [95,98]. Meanwhile, there are other polarization effects devoted to the frequency shift Δ ω of a particular vibrational mode, such as dipole–dipole coupling, hydrogen bonding, ionic strength effect, etc. As water is a common polar solvent with strong associated hydrogen bonds between moieties containing high-electronegativity atoms (F, O, N…) in solute molecules and hydrogen atoms in water molecules, these interactions are likely to alter the chemical nature and electronic structure of the vibrational mode leading to the shifting of ω . Furthermore, it is known that the internal solvation field is E e x t e r n a l –driven field ( f L F is not constant) when imposing an electric field bias. Within the scope of this review, other contributing parameters to Δ ω variation stated above are negligible by keeping them constant, so the primary variable is the influence of the interfacial electric field E e x t e r n a l produced from the electrode surface on the vibrational probe.
It is stated that when the permanent dipole moment of the molecule is nonzero, the second-order Stark effect contribution is negligible and generally not taken into account [99]. To be more specific, the strength of the electric field is relatively weak (smaller than 100 MV∙cm−1), the second-order contribution of Δ α (quadratic term) is insignificant, and Δ ω becomes directly proportional to the magnitude of   E via a linear relationship (Equation (13)) (Figure 7). This means that the linear Stark shift increases when a higher external electric field impinges on the electrode system.
Δ ω Δ μ · E e x t e r n a l  
In the electrochemical Stark shift experiments, the interfacial electric field is dependent on two variables, which are applied potential and the ionic strength of the solution E = f φ , I . If I is kept constant, E e x t e r n a l = E φ   without letting any current flow through the system, and it was found that the vibrational frequency of the adsorbate molecule varies ( Δ ω ) as a function of electrode potential ( φ ) via a linear dependence [100,101].
d ω d φ = μ × d E d φ  
Knowing the values of μ and the Stark tuning slope d ω d φ , the absolute E φ can be determined through a linear correlation with φ described in Equation (16).
d E d φ = 1 μ d ω d φ  
E φ = 1 μ d ω d φ φ φ P Z C
where φ P Z C is the potential of zero charge.

3.3. Potential-Dependent Sum-Frequency Generation (SFG) Spectroscopy

When studying the SFG spectroscopy of an electrochemical interface, a charged solid/liquid interface in general, a quadrupole contribution of bulk centrosymmetric component under the influence of a static electric DC field ( E D C ) through a surface non-specific χ ( 3 ) process is also recognized in the generation of SFG resonances rather than the symmetry-breaking interface contribution itself. In the early 1990s, Eisenthal et al. proved that the signal of second harmonic generation (SHG) depends on the χ ( 3 ) -bulk component with a significant contribution [102,103]. As discussed previously in Section 2 about the EDL models of an electrochemical interface, the interface contribution to χ S , e f f ( 2 ) can be regarded from the Stern layer ( χ S t e r n 2 ) with the interface-specific hydrogen-bonding network of water molecules [68]. On the other hand, the bulk quadrupole contribution is referred to as bulk-like water molecules in the diffuse layer (DL) under the effect of a static electrical field. The effective surface second-order non-linear optical susceptibility χ S , e f f ( 2 ) , therefore, is expressed via the relation below:
χ S , e f f ( 2 ) = χ S t e r n 2 + O H P χ B u l k 2 + χ B u l k 3 z · E D C z e i k z z d z  
where χ B u l k 2 and χ B u l k 3 ( z )   designate the second-order electric-quadrupole bulk non-linear susceptibility and the third-order bulk non-linear susceptibility of the aqueous solution, respectively, E D C ( z ) is the z -dependent static electric field, represents the bulk solution and k z = k V i s , z + k I R , z k S F G , z = k S F G , z + k V i s , z + k I R , z represents the phase mismatch of reflected SFG light along the surface normal (with O z direction) (Figure 8).
It has been estimated that χ B u l k 2 is insignificant in (S:SP) polarization configuration for SFG of water [68], thus we have the χ S , e f f ( 2 )   or χ i n t e r f a c e ( 2 ) coefficient as a combination of two surface second-order non-linear susceptibilities [105]:
χ S , e f f ( 2 ) = χ S t e r n 2 + O H P χ B u l k 3 ( z ) · E D C ( z ) e i k z z d z = χ S t e r n 2 + χ D L 2  
by assuming that: (1) χ B u l k 3 is more predominantly from mean-field-induced reorientation of bulk water molecules rather than field-induced alignment of hydrogen bonds and electron polarizabilities of molecules [68], and (2) χ B u l k 3 ( z ) is approximated as the third-order non-linear susceptibility of bulk water ( χ B u l k 3 z = χ B u l k 3 ) [106]. The second assumption has not been proved yet. Given these approximations, we replace E D C z = d φ ( z ) d z and φ O H P = δ S t e r n = O H P E D C ( z ) d z = O H P d φ ( z ) d z d z = φ + φ O H P into Equation (18) (with the assumption of φ = 0 at a bulk solution), then it turns out χ D L 2 is calculated as
χ D L 2 = χ B u l k 3 O H P d φ z d z e i k z z d z = χ B u l k 3 φ z e i k z z | O H P + O H P φ z × i k z × e i k z z d z  
χ D L 2 = χ B u l k 3 φ O H P + i k z O H P φ z × e i k z z d z
Furthermore, as discussed previously in Equation (1), φ z = φ O H P × e κ z at the diffuse double layer ( κ is the inverse of the Debye screening length and the potential is decayed to 2% of its maximum value at z = 4 κ 1 36 nm corresponding to 120 layers of water [104]), then we have:
χ D L 2 = χ B u l k 3 φ O H P φ O H P × i k z O H P e κ z × e i k z z d z  
χ D L 2 = χ B u l k 3 φ O H P φ O H P × i k z O H P e ( κ + i k z ) z d z  
χ D L 2 = χ B u l k 3 × φ O H P 1 i k z κ + i k z e κ + i k z z | O H P = χ B u l k 3 × φ O H P 1 + i k z κ i k z  
Finally,
χ D L 2 = κ κ i k z χ B u l k 3 × φ O H P  
Therefore, the intensity of SFG signal is directly proportional to the square of the surface potential from diffuse layer to the bulk via the equation below.
I ( ω S F G ) χ S , e f f 2 2 I I R I V i s χ S t e r n 2 + κ κ i k z χ B u l k 3 × φ O H P 2 I I R I V i s  
Applying the Euler formula, e i x = cos x + i s i n ( x ) , to Equation (25), we have:
I ( ω S F G ) χ S t e r n 2 + κ κ 2 + k z 2 e i arctan k z κ × χ B u l k 3 × φ O H P 2  
Fundamentally, to acquire an optimum reflected SFG signal, the polarization triplet (SFG:Vis IR) (where the configuration is in order of increasing wavelength, Figure 6) must be selected so that it can leverage and maximize the substrate reflectivity [84]. The influence of surface reflectivity is mathematically expressed by the Fresnel coefficients (R) for reflection. R naturally depends on the refractive indices of two media at the interface n and the incident angles θ (Figure 8). Aside from χ S t e r n 2 and χ B u l k 3   tensors, the R values should also be considered in calculating I ( ω S F G ) in principle (Equation (26)), but they are neglected here at solid/liquid electrochemical interfaces to avoid further complications. Due to the O z -depth dependence of the real surface electrostatic field (potential) E D C ( z ) and complex phase matching factor e i k z z , the total χ ( 3 ) term is defined as
κ κ i k z χ B u l k 3 = C F × χ B u l k 3 = χ r e a l 3 + i χ i m a g i n a r y 3  
where κ and k z are denoted as the inverse of the Debye screening length and the coherence length of SFG process, respectively; C F κ κ i k z has been called as the correction factor, χ r e a l 3 = κ 2 κ 2 + ( k z ) 2 χ B u l k 3   , χ i m a g i n a r y 3 = κ k z κ 2 + ( k z ) 2 χ B u l k 3 [107].
Depending on the relative values of κ and k z , one can separate three cases:
(i)
If κ k z , meaning that the coherence length (usually between 20 and 50 nm depending on the optical configurations) of the SFG process is much bigger than the effective thickness of the diffuse layer. In other words, the Debye length is much smaller than the coherence length. This is the case for very high electrolyte concentration (I > 10−1 M) and χ r e a l 3 is predominant ( χ r e a l 3 χ B u l k 3 and χ i m a g i n a r y 3 k z κ χ B u l k 3 ). This leads to the exponential phase matching term close to a unity O H P e i k z d z 1 , then
χ S , e f f ( 2 ) χ S t e r n 2 + χ B u l k 3 O H P E D C z d z χ S t e r n 2 + χ B u l k 3 × φ O H P  
(ii)
When κ k z ( π k z 1 4 κ 1 ), the Debye length is bigger than the coherence length thick, which corresponds to very low electrolyte concentration (I < 10−4 M) and the significant term is thus χ i m a g i n a r y 3 with small value since χ r e a l 3 0 and χ i m a g i n a r y 3 κ k z χ B u l k 3 . This complete destructive interference results in the sole dependence of SFG intensity on χ S t e r n 2 contribution [104].
(iii)
Otherwise, the coherence length k z 1 is comparable to the Debye screening length κ 1 ( 4 κ 1 π k z 1 when I ≈ 10−3–10−4 M), so the total χ ( 3 ) term remains as a complex value with both contributions from the real and imaginary terms.
To sum up, the SFG resonances generation in the aqueous solution stems from two particular regions: (1) hydrogen bonding of water molecules and other noncovalent interactions (van der Waals and electrostatic forces) within the electrochemical interface (the Stern layer) and (2) reoriented/aligned and polarized water molecules perturbed by a surface static electric field E D C (diffuse layer).

3.4. Some Controversial Issues Using the Definition of Surface Potential in the SFG Measurements

Due to the disunity of the surface/interface potential definition, it leads to the misnomer of φ 0 . As illustrated earlier in reference [102,103], the interface potential is written in the term of φ 0 which actually refers to the potential at the OHP or the Stern potential (Gouy–Chapman–Stern model) (Figure 3a,b). Therefore, to be more precise, φ 0 denotes the interfacial or “surface” potential estimated between the diffuse layer and the bulk ( φ O H P ). It is visually located at the specific location 0 + referred in Figure 3 (red dashed vertical line) and Figure 8 (red dashed horizontal line). This so-called “surface” potential is not synonymous with the defined φ 0 potential standardized from the electrode surface (Figure 4), and they are actually correlated via this formula:
φ 0 = φ 0 0 + + φ 0 + = φ S t e r n d r o p + φ O H P = φ S t e r n d r o p + δ S t e r n
where φ S t e r n d r o p = σ C O H P = σ   ×   d S t e r n ε ε 0 ( σ is the surface charge density). All of the “surface” potential terms or potential with a subscript of 0 appeared in the references [68,104,106,107,108,109,110,111,112,113,114] refer to φ O H P . In summary, when undergoing the influence of a static electric field, the bulk contribution to χ S , e f f ( 2 ) depends on ( χ B u l k 3 . φ O H P ) where the surface potential is the Stern potential. The misnomer of using unspecified surface potential has misled some research [115,116] about φ 0 and brought about the false usage. For instance, Tan et al. [115] investigated the thickness of interfacial water by time-resolved SFG with implementing Equations (26) and (29). However, the “surface potential” term expressed in the Equation (26) in their paper unfortunately corresponds to φ 0 . Using variable-angle surface spectroscopy, Uddin et al. [116] recently reported on the water structure in the Stern layer, encompassing with the correct “Stern potential” in the third-order susceptibility in the diffuse layer (DL). Even so, they employed a silica deprotonation model to determine the surface potential ( φ 0 ), which should instead have denoted the Stern potential under the theory of the EDL [3]. Even in the review paper [12] mentioning the experimental methods to determine surface potential φ 0 , it would be erroneous to state that SFG can extract the real φ 0 surface potential under the auspices of the GCS model.
To estimate the value of φ O H P , there are two approaches to do so: (1) the approximation approach and (2) the absolute approach. Approach (1) is based on the assumption that the Stern potential can be approximately equal to the measurable potential or potential difference. As discussed earlier in Section 2, ζ potential from the electrokinetic measurement [117,118] is frequently more or less equivalent to δ S t e r n ( φ O H P = δ S t e r n   ζ ) so φ 0   φ S t e r n d r o p + ζ (purple and black dashed horizontal line in Figure 3b). In addition, from Equation (16) in the vibrational Stark effect shown in Section 3.2 and Equation (28) in the case of κ k z , it offers another approximation strategy to determine φ O H P via the relation below.
φ O H P O H P B u l k E D C z d z = a φ φ P Z C  
where a is a constant, φ is the applied potential, φ P Z C is the potential at the PZC. In principle, if φ φ P Z C 0 (high electric fields), a rigid and highly oriented water adlayer disposes at the electrochemical interface, which kinetically hampers the charge transfer. If φ φ P Z C 0 (close to the PZC, low electric fields), the dipoles of water molecules have an entropically higher degree of freedom. At the PZC ( φ φ P Z C = 0 ), the disorder of water molecules reaches the highest (quantitatively ascends to the maximum entropy, S = kB × lnΩ, where Ω is the number of microstates). Some research has employed this formula to access the potential dependence study [119,120].
This estimation is pertained to the equivalence of the interfacial electric field strength as the potential drop across the interface (the difference between the actual applied electrode potential and the PZC) [120,121]. At this point, it is critical to emphasize that the PZC in this formula and henceforth in the following sections of this review paper refers to the potential of zero free charge (PZFC), not to the potential of zero total charge (PZTC). The conceptual disparity between them is the considered range of charge density ( σ ), principally in the attendance of specifically adsorbed species (Had and OHad) at non-ideally polarized electrodes (Pt, Cu, Ag). While the PZFC displays the potential where only the truly free, electronic excess charge density on the electrode surface equals zero ( σ d i f f u s e = 0 , σ t o t a l = σ I H P + σ d i f f u s e 0, φ O H P = 0), the PZTC expresses the potential at which the sum of both surface charge and the charge portion localized in polar adsorption process dissipates ( σ d i f f u s e 0 , σ t o t a l = σ I H P + σ d i f f u s e = 0 , φ 0 = 0) [122,123]. This means that the PZFC does not comprise the additional contributions from adsorbed species (ions, dipoles, etc.) or surface phenomena to the total charge balance. Thus, the PZTC is typically larger than the PZFC. They become homogeneous (PZC = PZFC = PZTC) when no specific adsorption exists ( σ I H P = 0 ). It is discernible that the existence of a specific adlayer with/without charges maneuvers the electrode surface potential, leading to dissimilar values of the PZFC. For instance, the PZFC of absorbate-free Pt(111) surface and OH-covered Pt(111) surface are 0.26 V vs. standard hydrogen electrode (SHE) [124] and 0.84 V vs. reversible hydrogen electrode (RHE) [125], respectively. Hence, φ P Z C is an essential quantity for gauging the strength of the interfacial electric field (the EDL field), and determining it is not always straightforward. To acquire the PZFC, it can be experimentally determined by applying several methods: (1) classical double-layer capacitance minimum method by electrochemical impedance spectroscopy (EIS) [126], (2) laser-induced temperature jump [127,128,129], and (3) electric field-induced second-harmonic generation (SHG) [120]. Meanwhile, the PZTC can be obtained using the following approaches: (1) CO charge displacement method [130,131], (2) immersion method [122], and (3) N2O reduction method [132].
On the other hand, the absolute approach (2) relies on solving the Poisson–Boltzmann equation in the diffuse layer of only a symmetrical electrolyte or z : z electrolyte ( M z + X z ) with the total bulk concentration of C (M) (Grahame equation).
φ O H P = 2 k B T z e s i n h 1 σ 8 k B T ε ε 0 × C 1 2  
For a symmetrical single charge (1:1) electrolyte system where C = I , then φ O H P = 2 k B T e s i n h 1 σ 8 k B T ε ε 0 × I 1 2 [3,133,134]. In general, the surface potential φ O H P generated from the surface charge is directly proportional to the arcsin of the surface charge density σ and inversely proportional to the ionic strength I of the aqueous solution ( b and c are two constants, sinh−1 is the inverse hyperbolic sine).
φ O H P b   s i n h 1 σ c × I  

3.5. Experimental Considerations on Spectroelectrochemical Cells Adapted to Sum-Frequency Generation Spectroscopy

3.5.1. Sum-Frequency Generation Experimental Setups

In the ω I R -tuned vibrational SFG or 2C-SFG (both tunable IR and Vis sources), a tunable IR beam is generated in two ways: (1) two conversion stages (optical parameter generator/amplifier, OPG/OPA) or (2) a single stage (optical parametric oscillator, OPO). In general, OPG/OPA system is a single-pass pulse of IR beam at a given excitation repetition rate f e x (MHz), which stands out for its simplicity, flexibility, broad tunability, and robustness [135]. Meanwhile, OPO is a versatile device of ω -tunable IR-Vis-UV radiation converting pump laser wave into signal and idler (lower frequency compared to signal) waves through a cavity for reverberation and intensity amplification of the conversion process. Despite the merits of OPG/OPA, its broad-linewidth property can lead to a low signal-to-noise (S/N) ratio for detection due to the high gain of the signal-idler pairs associated with the process of OPG/OPA for the phase-matching requirement in comparison with OPO. Furthermore, OPO can generate either a continuous-wave (CW) output or pulses of nanosecond (10−9 s), picosecond (10−12 s), and femtosecond (10−15 s) duration [136].
A conventional SFG setup is based on two short delivering laser pulse systems: Q-switched nanosecond (ns)/locked-mode picosecond (ps) and ultrashort locked-mode femtosecond (fs) produced from a flashlamp-pumped laser, for example, neodymium-doped yttrium-aluminum garnet (Nd:Y3Al5O12 or Nd3+:YAG) laser with emitted wavelength of 1064 nm. The rationale for the two preferential pulsed laser systems is that SFG is a three-wave-mixing process, so the detected signal is proportional to δ t 1 ( δ t is the laser pulse width) [137,138]. In the SFG measurement of a ns/ps input pulse, the narrowband scheme (narrow linewidth) is employed with a spectral resolution of a few cm−1 in terms of IR bandwidth (typically < 1 cm−1 for ns systems, 1–20 cm−1 for ps systems). To eliminate efficiently the reflected input beam (normally Vis light from the wavelength of 532 nm, SHG from Nd:YAG), spatial and spectral filters and a monochromator are utilized during the scan of IR vibrational resonances of the molecule of interest (Figure 9a). However, the IR ps-scanning with a single channel and acquisition time of an SFG spectrum recording is time-consuming in practice. Thus, the design of a broadband scheme (fs-SFG) for IR laser first proposed by Richter et al. resolved the frequency tuning issue by operating in a high-power fs pulsed laser system (Ti:Al2O3-sapphire) with a high repetition rate of 1 kHz [139]. This IR broadband scheme covering a wide range of ω I R (multi-channel) increases the bandwidth to more than 100 cm−1 in an ultrashort pulse duration of 100 fs without the need of IR scanning. The acquired non-linear SFG signal is self-dispersive in a spectrograph, then detected by a charge-coupled device (CCD) camera, which is suitable for sub-monolayer detection (Figure 9b). In general, the conventional schemes are based on the homodyne detection. Although multiplex broadband SFG (BB-SFG) ameliorates the single-channel narrowband SFG (NB-SFG) by offering a shorter acquisition time, they provide only the mod square of second-order non-linear susceptibility, i.e., | χ i n t e r f a c e ( 2 ) | 2 , not the complex quantity of χ i n t e r f a c e ( 2 ) . Developed by Shen and co-workers, phase-sensitive SFG (PS-SFG) is a technique that enables the extraction of both the real (Re) and imaginary (Im) parts of the χ i n t e r f a c e ( 2 ) independently [140]. The SFG radiation is generated through narrow bandwidth ps pulses of both ω I R and ω V i s . Later on, a pioneered design with the combination of narrowband ps-scheme of ω V i s and broadband fs-scheme of ω I R was extended by several groups [56,57] and named as heterodyne-detected SFG (HD-SFG) by Tahara and his colleagues [141,142]. In either PS- or HD-SFG system, a local SF oscillator (LO, reference beam) for field interference with the SFG signal is involved through the use of non-centrosymmetric crystals working as a phase-known reference sample (e.g., Au, crystalline quartz SiO2, ZnO, KNbO3) (Figure 9c). One of the outstanding merits of PS- or HD-SFG is that more information about a vibrational resonance can be inferred and elucidated from the Im χ i n t e r f a c e ( 2 ) spectrum, such as the absorptive band shape and the up/down orientation of interfacial molecules ( ± Im χ i n t e r f a c e ( 2 ) ) [143]. Another scheme for SFG investigation is the time-resolved SFG, in which its broadband signal is generated by fs input pulses and followed by a Fourier transformation of the “free induction decay” into the resonance spectral domain. The free induction decay occurs when the time resolution of the input pulse is drastically shorter than the relaxation of the resonance. Hence, this feature can address the problem of non-resonant response overwhelming by suppressing the nearly instantaneous SFG signal from the metal electrode and potentially aid to adopt in the two-dimensional (2D) coherent transient spectroscopy [144]. The details of these schemes can be found in some seminal textbooks [145] and elsewhere [137,144,146].

3.5.2. Hyphenated Spectroelectrochemical Cell Configurations

The unprecedented demonstration of the potential-dependent SFG study was investigated by P. Guyot-Sionnest and A. Tadjeddine in a reflected spectroelectrochemical cell [148]. Broadly speaking, to investigate the SFG signal under controlled electrochemical conditions, it is a requisite to design and fabricate a spectrochemical cell that meets the requirement for the overlapping in space (spatially) and time (temporally) of IR and visible beams as well as specifically probing the electrochemical interface. To circumvent any chemical interactions (oxidation or corrosion) with the cell material during the experiment, the base of the cell is necessarily made of an inert material such as Kel-F (polychlorotrifluoroethylene -[CFCl-CF2]-n), polytetrafluoroethylene (PTFE), or polypropylene (-[CH2-CH(CH3)]-n). The transparent window that must enable both IR and visible pulses to transmit through and reflect the generated SF can be the prism of CaF2 (close to 7 µm of wavelength) or BaF2 (up to 9 µm) [149]. Due to the ion’s size compatibility of Ca2+ with F more than Ba2+ (hard and soft acids and bases theory), the molar solubility of BaF2 is larger than CaF2 in the aqueous solution (pKsp of CaF2 is 10.41 and BaF2 is 5.82 at 25 °C). For that reason, CaF2 is more commonly to be selected [66,150,151]. The prismatic windows can be in distinctive shapes: triangular or hemisphere prism. For the in situ SFG study of electrochemical reaction with gaseous products, the cell can be adjusted with two gas paths (inlet and outlet) towards a gas detection instrument. This configuration can also offer a way to deaerate the solution by inert gases (N2 or Ar) if the presence of O2 intervenes in the oxygen reduction reactions (O2/H2O2 and H2O2/H2O).
Regarding the optical configurations of an SFG-coupled spectroelectrochemical cell, the reflection geometry is adopted more commonly than other types (Figure 10a,b).
Depending upon the natural properties of the working electrode, it consists of two particular modes: internal and external (frontside) geometric strategies (Figure 10c and Figure 10d, respectively), which were also commonly adopted in in situ Fourier transform infrared spectroscopy (FTIR) spectroelectrochemical investigations [155,156]. To exemplify, the external reflection configuration refers to the thin-layer (< 50 μ m) formation of an electrolyte solution by slightly pressing the working electrode against the optical window (Figure 10d). The optical window and working electrode are separate components, and a very thin electrolyte layer (micron-thick) is sandwiched between them. Thus, the well-suited material of the working electrode should be non-transparent and possess a high reflectivity, such as metal bulk electrodes (Pt, Au...) or monocrystalline electrodes. This thin electrolyte layer (a few µm of thickness) is maneuvered by a Teflon –[CF2-CF2]-n spacer. The key advantage of this mode is that it attenuates the strong water adsorption of the IR pulse in the aqueous electrolyte solution, which can cause a severe diminution of the SFG signal. This geometry is quite analogous to the one used in infrared reflection absorption spectroscopy (IRRAS) [138]. Nevertheless, the benefit of implementing a thin layer appears to be the demerits of the electrochemical mechanism by distortion effect (sluggish mass transport and rapid reactant consumption). Thus, an internal reflection mode will tackle the issues encountered in the external one with a thin film deposited working electrode on the optical window surface (window/electrode/electrolyte) (Figure 10c). To do so, being optically transparent in both IR and visible radiations is a must for the working electrode. Because of that, this internal method is practically valid for limited electrode materials, particularly for battery materials (LiCoO2, single-layer graphene, or ultrathin-film carbon). The limitations of this geometry are (1) poor signal-to-noise because of the unfavorable Fresnel factor and (2) instability of the ultrathin film electrode sustaining with a low current density [157]. Although typical metal electrodes are not favorable to use in this geometry, there are still some studies coating metal or silicon (Si) on the transparent window for potential-dependent SFG experiments [158,159,160]. The design principle is similar to the commonly used spectroelectrochemical cell conducted in surface-enhanced infrared absorption spectroscopy (SEIRAS) [161]. Figure 11 depicts a scheme of an external thin-layer spectroelectrochemical cell coupled with a broadband SFG system.

4. SFG at Aqueous Electrochemical Interfaces

In general, the study of SFG at the electrochemical interfaces can be categorized into three specific major subjects pertaining to the applications of (1) fundamental electrical double layer and interfacial water structures, (2) fuel-generated electrocatalysis (HER/HOR in water oxidation, CO2 reduction, CO conversion, and methanol (MeOH)/ ethanol (EtOH) alcohol oxidation/decomposition), and (3) rechargeable batteries (Li-ion or Li-O2 batteries for instance). One of the indispensable discussions in these fields is to elucidate the reaction mechanism and intermediates’ identification. There are several reviews about vibrational SFG spectroscopy at electrochemical interfaces but they are unspecific towards water solutions [100,146,153,162,163]. In this review, we only pay attention to the electrochemical interfaces in aqueous electrolyte solutions rather than the ionic liquid electrolytes [164,165,166,167,168] or solid–electrolyte interphase (SEI) in the Li battery field, thus we encourage readers to read some previously published reviews and articles [154,169,170,171]. Also, we will not elaborate on our discussion with the study of theoretical simulations in regard to these fields. However, there are copious relevant articles about theoretical studies of water structures at the EDL and SFG at aqueous interfaces [172,173,174,175,176,177,178,179,180,181,182,183,184,185,186,187] if readers are interested. Hence, we will organize our discussion based on three pillars: (1) interfacial structures of water molecules on the electrode surface, (2) interfacial structures of charged adsorbates and mechanism, and (3) interfacial structures of neutral or uncharged adsorbates and mechanism.

4.1. Interfacial Water Molecules on Electrode Surfaces

Water is the reactant in the electrochemical water splitting towards establishing a sustainable society with a net-zero-emission “green” hydrogen economy and directly related to the mechanistic comprehensions of HER (2H+(aq) + 2e ⇄ H2 or 2H2O(l) + 2e ⇄ H2 + 2OH(aq)) and OER (H2O(l) ⇄ ½O2 + 2H+(aq) + 2e or 2OH(aq) ⇄ ½O2 + H2O(l) + 2e) in an acidic or a basic medium, respectively. A holistic knowledge about the orientation, organization, and dynamics of water itself at the electrode/water interface could, therefore, reinforce and enrich the discernment and efficiency of electrocatalytic reactions. At charged interfaces, an exhaustive and profound literatures utilizing SFG in the study of water molecules in the presence of an EDL were exhibited at (1) conductive metal oxide surface In2O3/SnO2 (ITO) [188], (2) nonconducting inorganic solid surfaces such as calcium fluoride CaF2 [185,189,190,191,192,193,194], oxides (silica/quartz SiO2 [195,196,197,198,199,200,201], alumina/sapphire Al2O3 [202,203], TiO2 [204,205,206]), or even mica mineral [207], and (3) organic surfaces (charged surfactant monolayer [68,142,208,209], nonionic long-chain alcohol monolayer [210], and biomembranes [113,211,212,213,214,215]). A very recent investigation of the photocatalyst strontium titanate (SrTiO3)/water interface has also been demonstrated [109]. Take the CaF2 surface as an example of an ionic inorganic solid surface; the dissolution of F or Ca2+ is the origin of triggering the surface charge (Scheme 1 which ≡ denotes the solid surface-bound). The mechanism of F liberation is thermodynamically more favorable than Ca2+ dissolution (hydration enthalpy) [193]. Otherwise, if these water interfaces are not inherently charged surfaces, they are favorable for surface hydrolysis or water dissociative chemisorption to form hydrophilic OH groups on the surface. Varying the pH of the water solution (acid–base reaction) will generate a charged surface (protonation and deprotonation) [216]. This results in a pH-dependent behavior of SFG at these surfaces. For instance, siloxane bridges (Si-O-Si bonds) in SiO2 surface structure experience a hydrolytic reaction leading to orthosilicic acid or its salt release into solution [217,218] (Scheme 2) or TiO2 surface exhibits a formation of the chemisorbed hydroxyl layer (Scheme 3) [70,219,220,221,222,223,224].
From SFG vibrational spectra of water interfaces, the peculiarity exists of three distinctive bands in the O-H stretching region of well-aligned interfacial water molecules corresponding to: (1) symmetric O-H stretching mode ( v 1 ) of tetrahedrally coordinated “ice-like” water structures (hexamer) in a highly ordered hydrogen-bonding arrangement (a broad peak centered ≈ 3200 cm−1), (2) asymmetric O-H stretching mode ( v 3 ) of three-coordinated hydrogen-bonded “liquid-like” water molecules in a disordered network (a strong broad 3400–3500 cm−1 peak), and (3) forbidden antisymmetric O-H stretching mode of “free” or “dangling” non-hydrogen bonded O-H bonds from water itself or surface (a sharp ≈ 3700 cm−1 peak) [143,225,226,227,228] (Figure 12a,b). While these first two resonant features were initially denoted by Shen et al. [200], the latter is normally recorded at the suppressed water– hydrophobic interfaces where the hydrogen atom must protrude from the surface [201,229,230,231]. The terminology of the first two hydrogen-bonded peaks (ice-like and liquid-like) remains controversial due to the existence of an alternate interpretation by theoretical calculations for ice and water clusters [225]. This causes unalike pictures of water at the interface to a certain extent and the reconcilement of the controversy, therefore, awaits further experiment evidence and simulation results. In the scope of this review, we will still label them as commonly accepted “ice-like” and “liquid-like” terms as appeared in the original papers. From Figure 12, it is evident that a higher order of hydrogen bonding network possesses a lower energy of the OH stretching mode. As a result, the ratio of SFG signals between ice-like and liquid-like water will serve as an indicator for the interfacial water arrangement. Another characteristic vibrational mode in the water vibrational spectrum at a lower frequency ~1600 cm−1 is the H-O-H bending band (scissoring) δ(HOH) and this intramolecular vibration mode of isolated water molecules is also proved as a key identifier in the dynamics of the intermolecular hydrogen bonding organization [112,232].
Due to the dependence of a charged surface on the pH of the solution, most research has focused on the pH-dependent [210], or ion-identity-dependent properties [235] of water at these oxide surfaces. On the other hand, the temperature-dependent singularity of surface behavior at the air/water interface also highlights significant interfacial properties of water and various electrolyte solutions [236]. Intriguingly, a few research groups [68,111,237] have endeavored to distinguish the interfacial information of water molecules between two particular layers of the EDL (the Stern and diffuse) in a charged surface but mainly from pH dependence. Recently, Montenegro et al. demonstrated the spectroelectrochemical study of water interface at graphene electrode via an internal reflection mode of SFG to separate the surface χ S t e r n 2   contribution and bulk χ B u l k 3 contribution [110]. Regarding the study of water structure at electrochemical interfaces a few decades ago, Tadjeddine and co-workers reported the water adsorption on hydrogenated monocrystalline (single crystal) Pt electrodes suggesting a water dimer structure chemisorbs on Pt via three hydrogen bonding interactions [238]. Nevertheless, SFG spectra of Pt(hkl) electrodes in the range of OH bonds in HClO4 solutions were stated infinitesimal and the prevailing water signal was attributed to ion-solvating water [239]. H+ cations and ClO4 anions are believed to inhibit the co-adsorption of interfacial water and its derivatives (H3O+ or OH) [240]. Thus, we will herein mention some practical issues regarding the spectroelectrochemical study of SFG of the interfacial water and elaborate on some adopted strategies by providing some case studies from different research groups.
There are some perturbing hurdles for the water adlayers’ investigation at electrochemical interfaces in the traditional SFG setup: (1) the strong absorption of water molecules at the electrode surface and the bulk in the spectral range of mid-IR laser pulse, and (2) the dominance of non-resonant background signal referred as noise (Equations (6) and (10)) from metallic electrode (e.g., Au [241]) or metal oxide (e.g., transparent conductive indium tin oxide, ITO [242]) surfaces over the SFG signal of our interested interfacial water in the EDL. The rationale for the strong non-resonant contribution from the metal surface is the electronic intraband and interband electronic transitions in the electronic band structure. To tackle the first practical issue, it was a must to design and fabricate a spectroelectrochemical cell with a micron-thin layer of electrolyte between the working electrode and the window of the cell to mitigate the attenuation effect of the IR input. It was suggested that the total internal reflection geometry with a ≈40–60 nm thick Au electrode for in situ SFG measurement under potential control could be a promising solution for this IR absorption phenomenon [243]. In addition, Liu and Shen have lately proposed another initiative to eliminate the deficiencies of unwanted and desired reflected SFG signal separation from the interface by modifying the IR beam geometry [158]. They designed the electrochemical SFG experiments in the Kretschmann configuration to exploit the planar surface plasmon (SP) excitation from the backside of flat Au film. To be more accurate, the IR input incident is from the prism side and the visible input and SFG output are on the opposite side, as depicted in Figure 13. The surface plasmon resonance (SPR) boosts the IR field at the electrochemical interface and resolves the need of having a very thin layer of electrolyte in the spectroelectrochemical cell. Liu et al. further developed the in situ SFG scheme utilizing plasmonic nanogratings engraved on the Au electrode to study interfacial water molecules [244]. They found that the adsorption of hydroxyl ions (OH) on Au during the anodic scan rather reinforces the interfacial hydrogen-bonding network of water from +0.4 V to +1.2 V (vs. RHE). After +1.2 V, this network is possibly undermined by either the surface roughening of Au-O bonds or flipped water orientation with hydrogen directing towards the oxidized Au.
However, employing the ultrathin film of Au as a working electrode virtually lowers the limit of detection (LOD) of the weak resonant signal from the interfacial water, as mentioned in the second difficulty. The 5d-6s inter-band electronic transition (ΔE = 2.3 eV) at around 550 nm is the reason for the case of Au [245,246]. There are a few possible approaches to achieve effective suppression of the non-resonant response by: (1) utilizing a Two-Color SFG (2C-SFG) spectroscopy where visible input light is also tuned to suppress the Au signal and enhance the water molecule’s signal, (2) adopting a temporal delay (several hundred of fs) between visible pulse and IR pulse (greater than the introduced IR pulse duration) to let the non-resonant signal decay, (3) selecting a low non-resonant responded electrode such as graphene or platinum (Pt), or (4) conducting the spectroelectrochemical study with time-resolved SFG or phase-sensitive SFG (Section 3.5.1).
The first-ever interfacial water study of the potential-dependent 2C-SFG at the Au electrode/ aqueous 10−3 M H2SO4 solution interface estimated by Nihonyanagi et al. applied the first strategy [245]. They employed a 470 nm visible excitation to acquire the highest signal-to-noise ratio of OH stretching bands of Au film/water interfaces. To be more specific, the dominating tendency of SFG signal at around 3500 cm−1 over that of 3250 cm−1 at −0.2 V vs. Ag/AgCl (saturated KCl) manifested the preferable structure of water molecules in the disordered “liquid-like” form at the negative charged Au electrode with water dipole towards to the bulk and perpendicular to the electrode surface (Figure 14a). At +0.6V which is close to the PZC ( ~ 0.3V), it was observed that the SFG intensity reached the lowest, suggesting that water molecules are entropically higher and tend to align parallel to the surface. Furthermore, the unvariation of the relative phase angle (peak-dip transformation) of SFG spectra of the interfacial water molecules in the range of −0.2 V to +1.0 V indicates that they did not flip their dipole when scanning from negative to positive potentials across the PZC. It is ascribed to the adsorption of a sulfate (SO42−), not bisulfate (HSO4) adlayer at the Au electrode. This leads the net charge of the SO42−/Au interface to become negative at a positively applied potential, which draws H2O molecules to adsorb with SO42− through hydrogen bonds (Figure 14c).
Almost a year later, Schultz et al. published the investigation of water orientations at the Ag(100)/water interface in 0.1 M NaF electrolyte solutions, using an external thin-layer reflected SFG under the electrochemical conditions [247]. The SFG spectra over a potential range from 0.0 V to −1.3 V vs. Ag/AgCl (for the purpose of minimizing Ag surface oxidation and HER production) illustrates more OH stretching peaks, including the presence of (1) 3370 cm−1, (2) 3250 cm−1, (3) 2970 cm−1 frequencies, and (4) a 2800 cm−1 peak at the proximate PZC (−0.8 V) (Figure 14b). The first peak is designated to the disorganized “liquid-like” water structure in the diffuse layer of the EDL with a lower level of hydrogen bonding and a weak interaction with the Ag surface. Peak 1 also exhibits a low dependence on the applied potential and presents a higher signal at 0.0 V. While the 3250 cm−1 peak (peak 2) is normally linked to ice-like tetrahedral geometry, but particularly in the hydration shell of counterions with respect to the surface charge at OHP in the EDL, the specifically absorbed water molecules on the Ag surface at IHP are responsible for the attribution to the OH stretching at 2970 cm−1 (peak 3). Across the PZC, these chemisorbed water molecules can basically bond with the Ag metal electrode via (1) Ag-H bonds (H atoms are the surface pointing atoms) at the negative side of the PZC ( φ φ P Z C < 0 ) or (2) lone pair electronic orbitals on O atoms (O atoms are the surface pointing atoms) at the positive side of the PZC φ φ P Z C > 0 (Figure 14d) [248]. The deciphering for lowering of the OH stretching frequency/energy stems from the electron-withdrawing effect of the electrode surface charge in the water O-H bonds (electron density reduction). For instance, the charge density accumulates on the Ag side of Ag-H bonds and consequently disperses the electron from the O atom side and weakens the O-H bonds in water. It is reasonable to recognize from the potential-dependent behavior that the SFG intensities of both peaks 2 and 3 reveal a minimum value at the PZC and show an increasing pattern towards either positive or negative potentials. Finally, the 2800 cm−1 peak (peak 4) is only tangible when applying a potential at the PZC or a bit lower (−1.0 V). This observation implies that this OH stretching roots from a positively charged ion adsorbed on the negatively charged surface, and therefore it is labeled for hydronium cations (H3O+) (Figure 14d). It seems that PZC here, albeit being defined as electrode potential at zero charge, refers to PZFC in particular (PZFC ≈ IEP). Even though this study evinced more information about four distinctive water structures in the EDL region at electrified Ag electrode, it contains a paucity of quantitative evidence about the molecular net dipole orientation of water as the previous research in Au. This is due to the fact that Ag does not exhibit a strong non-resonant response to extract the phase of the water resonant signal.
Going further to other thin film metal electrodes, Noguchi et al. continued to develop the potential dependence of SFG spectra in internal reflection mode at Pt/water [249] and Au/water [159] interfaces in 0.1 M HClO4 solution and juxtapose to highlight the unique structures at these interfaces. The minimum of SFG intensity, close to the PZC is determined around 300 mV and 200 mV (vs. Ag/AgCl) at the Au and Pt electrodes, respectively. These PZC values are in the double layer region. At electrified Pt/H2O interface, broad SFG bands at ca. 3200 cm−1 and ca. 3400 cm−1 express the presence of two structural systems of typical hydrogen-bonding water solvent: four-coordinated ice-like water and three-coordinated liquid-like water, respectively (Figure 15a). However, a solely major peak at 3400 cm−1 in the Au electrode’s study indicates interfacial water molecules structurally oriented more ordered at the Pt surface than at the Au electrode (Figure 15b). The higher oriented organization of water at the Pt surface supports a hypothesis of a stronger interaction between Pt-H2O (well-ordered) than Au-H2O (amorphous), which is in accordance with the previous findings from STM images [250,251]. Furthermore, the discrepancy between the SFG spectra of the Pt/H2O interface in this study and from Tadjeddine’s group might be due to the configuration of the spectroelectrochemical cell [249].
In this study, the authors do not focus only on the interfacial water at the EDL or double layer region, but the potential dependence of SFG spectra covers all the regions of electrified electrodes (hydrogen and oxygen regions) (Figure 16). Specifically, at the oxide region, SFG intensities of OH stretching decrease for both Pt and Au electrodes because of the formation of metal oxide species when moving towards more positive potentials. Several reasonings for this decrease are proposed: (1) the breach of highly ordered network of interfacial water due to the electrode surface transformation from atomically flat surface to roughened oxides surface, (2) the electric effect derived from the nature of metal oxides (insulating or semiconducting), which causes an additional potential drop at oxygen layer and a smaller electric field within the double layer, and/or (3) the surface charge variation coming from the oxide layer. In addition, an uncharacteristic sharp peak at approximately 3550 cm−1 was distinguished in the Au oxide formation region (from + 1.0 V vs. Ag/AgCl) except for the broad band centered around 3400 cm−1. It is attributed to the OH stretching band of Au(OH)2 (3565 cm−1) and AuOH (3569 cm−1), rather than the “free OH” peak, which is originally from the ClO4 anion adsorption potential region. Despite all the useful information discussed above, this study is still lacking the details of the net molecular dipole change of water molecules across the PZC to verify the water orientation movement.
Implementing a Fabry–Pérot etalon for the visible pulse delaying strategy, developed by Dlott and his colleagues [252,253] (second strategy) to suppress the non-resonant signal, Tong et al. unraveled the first experimental indication of free -OH stretching band (3680 cm−1) at thin film Au/H2O interface [254] (Figure 17a). In theory, the resonant signal could be attenuated by a factor of ≈(1 t p T 2 ) where tp is the IR pulse duration, T2 is the vibrational dephasing time [146]. Their results depicted that the interfacial water molecules orient with one OH group towards Au surface perpendicularly without hydrogen bonding with another moiety of other water molecules (Figure 17b). The interaction of free OH bonds with the Au surface is relatively weak at all biases and vanishes in the oxygen region. This finding suggests that the Au thin film possesses rather the property of a hydrophobic surface at a molecular level.
To omit the complexity of the non-resonant signal from metal substrate, the third method adopts the non-metallic, highly conductive substances for being electrode’s materials. An inherently atomically thin, chemically inert monolayer of graphene seems to be a promising candidate for the bias-dependent study of interfacial water structures with SFG. Following that idea, Dreier et al. sharpened the detection of interfacial water structure in contact with a chemical vapor deposited (CVD) grown graphene surface [255]. The SFG data of the OH stretching region evince the existence of water intercalation between graphene and CaF2, which causes complications in the pH- and voltage-dependent SFG interpretation of mere graphene/H2O interface. Additionally, the presence of free-OD response (where D is the deuterium isotope H 1 2 in heavy water) is not recorded due to the centrosymmetric character (SFG inactive) coming from the presence of water molecules on both sides of graphene. Continuing to characterize the graphene/heavy water (D2O) interface by homodyne-detected SFG, Montenegro et al. unveiled the marked asymmetry of the OD stretching in SFG spectra between negative and positive potentials [110]. At the negatively charged surface (smaller than −1.0 V vs. Ag/AgCl), they denote the narrow characteristic peak (around 2700 cm−1) for the “free-OD” moiety of heavy water possibly pointing towards graphene while SFG spectra exhibit a swift vanishing of this band and follow an appearance of two broad hydrogen-bonded bands (roughly 2350 cm−1 and 2500 cm−1) at neutral or positive potentials [256] (Figure 18a). This asymmetric transformation is rationalized by the reorientation of O-D bonds towards the bulk (away from the graphene surface), favoring the hydrogen-bonding interactions with proximate water molecules when the EDL field increases.
Lately, the designation of the 2700 cm−1 peak to interfacial D2O (corresponding to around 3640 cm−1 for the OH stretch) has galvanized Wang et al. into a dispute with Montenegro et al. They conducted the same measurements in the interfacial H2O but used heterodyne-detected SFG (HD-SFG) [257]. From the negative sign of Im χ i n t e r f a c e ( 2 ) spectra, it infers the down orientation of the OH group at 3630 cm−1 (heading to the bulk water), in contrast to the positive Lorentzian fitted Im χ i n t e r f a c e ( 2 ) spectra of Montenegro et al. [110]. Thus, they ascribe this negative peak to the OH group of the Ca-OH species at the CaF2/H2O interface rather than free-OD at the CaF2-supported graphene/D2O interface (Figure 18b). The hydroxylation of the CaF2 surface, which is a positively charged surface at neutral pH 5.6, can be deciphered via the equation below (Equation (33)), and the proton transfer is supposed to take place between two interfaces (≡ is surface-bound) [258]. The disagreement and ambiguity of the OH stretch assignment suggest that further demonstrations of the interfacial water behaviors at the graphene/water interface are needed.
  Ca + F H 2 O     Ca ( O H ) F   +   H + ( aq ) ( Ca F 2 / graphene )
H + ( aq )   ( Ca F 2 / graphene )     H + ( aq )   ( graphene / water )
Overall, it can be seen in all examined studies that the applied potential (surface charge of electrode) is the driving force of interfacial water structuring. Although there are some technical impediments and shortcomings in the electrochemical SFG coupling (spectroelectrochemical cell or SFG configuration) to study the water structures at interfaces, potential-dependent SFG spectroscopy is still resourceful and a prime tool to deepen our fundamental knowledge of electrochemical phenomena at an electrified electrode/water interface. In addition, the segregation of interfacial information between the Stern and diffuse layer in the EDL in the potential dependent SFG is still deficient and cumbersome. Thus, these initial findings serve as preparation steps to unbolt a direction in probing and investigating the water splitting reactions (HER and OER) and their mechanisms on numerous electrocatalysts under more realistic conditions (operando).

4.2. Interfacial Charged Adsorbates on Electrode Surfaces (Electrolytes)

Historically, the electrochemical SFG spectroscopy was delved into experimenting with straightforward, small prototypical species such as CO, CN, and SCN first, followed up with larger molecules (alcohols), complex structures (aromatic molecules), and ionic compounds. In this section, we emphasize the pivotal significance of the chemisorption of ions in aqueous solutions as a model for electrochemical interface events. Firstly, cyanide (CN) was originally and later thoroughly studied on a polycrystalline Pt electrode by Tadjeddine’s group [148,259]. They found two distinct bands of chemisorbed CN ions, an asymmetrical broad band around 2070–2100 cm−1 where N-adsorbed CN bound to Pt atoms Pt-NC and another sharp band around 2150 cm−1 corresponding to C-adsorbed CN stretch Pt-CN. Daum et al. argued about the assignment of the second band in a higher frequency of CN adsorption on Pt(111) and Pt(110) from the disappearance of vibration at negative potentials and likely gravitated towards the idea of microscopic disorder of Pt surface after repeated oxidation-reduction cyclic voltammetric (CV) scans [260]. This disordered, microscopically rough surface favors the formation of surface cyano complexes [Pt(CN)2]2−. In addition, Tadjeddine et al. also strived for CN/Ag interface in ClO4 solutions, and they could extract the PZC of systems (−1.20 V with CN and −0.95 V without CN where the applied potential (E) vs. saturated calomel electrode (SCE)) from the parabolic shaped potential dependence of the non-resonant and the resonant components of χ S , e f f ( 2 ) [261]. It is plausible to see the negative shift of PZC values induced by CN chemisorption.
Simultaneously, thiocyanate SCN was also well-probed in the spectroelectrochemical study of CN due to its simple structure and strong adsorption on the electrode surface. In the same study, Tadjeddine et al. indicated that the first band at ca. 2070 cm−1 with a large potential tuning rate at −1.0 V vs. SCE belongs to N-bound adsorbed SCN, while a smaller tuning rate band localized around 2140 cm−1 is attributed to S-bound adsorbed SCN [259]. The chemisorption varied from N-bound to S-bound configurations as potential elevated. These are two terminal configurations of complexes deduced from the mesomeric (resonance) effect. Broadly speaking, SCN can possibly be able to complex with metal via bridging arrangements of S- or N-bonding [262]. Wang et al. further examined the adsorption and oxidation of SCN in HClO4 acidic electrolyte on polycrystalline Au surface [263]. It was suggested that the adsorption of SCN on the Au surface is through the S-bound framework in the double layer region (−0.2 V to 0.5 V vs. SCE) and undergoes a phase change of around 0.3 V in both cathodic and anodic sweeps. At a higher potential of 0.7 V, the speculated oxidation of SCN on Au and product’s adsorption occurs in the anodic scan: SCN(aq) → CN(aq) + SO42−(aq) ((1); this equation only serves as a depiction for main products but is not balanced), then Au + CN(aq) ⇄ AuCNad (2) and AuCNad + CN(aq) ⇄ [Au(CN)2]ad (3). In the cathodic scan, the desorption of AuCNad (reverse (2)) and [Au(CN)2]ad (reverse (3)) or the dissolution of [Au(CN)2]ad ([Au(CN)2]ad ⇄ [Au(CN)2](aq) (4)) free the Au surface. The electrochemical Stark shift is drastically different in the anodic scan and in the cathodic scan.
Another anion chemisorption that can be of paramount importance in varying reaction pathways and electrochemical yield of rechargeable batteries (lead–acid) or even in the Nafion-based ethanol fuel cell technology [264,265] is (bi)sulfate species (HSO4 and SO42−) adsorption. As previously discussed in water structures at the Au surface in H2SO4 solution [245], sulfate plays a role as an adlayer in regulating the interfacial water structure under potential control. It is remarked in the ethanol fuel cell study that the co-adsorption of (bi)sulfate species simultaneously fortifies the adsorption of acetate anions CH3COOad and constrains them within a more well-defined rigid structure. The particular case of lead–acid batteries, commonly known as lead batteries, consists of two electrodes submersed in aqueous sulfuric acid H2SO4 solution with an overall reaction as the battery discharges as follows: PbO2(s) + Pb(s) + 2HSO4(aq) + 2H+(aq) ⇄ 2PbSO4(s) + 2H2O(l) with K r x n = 10 2 ( E P b O 2 / P b S O 4 0 E P b S O 4 / P b 0 ) 0.0592 = 10 2 ( 1.62 + 0.29 ) 0.0592 = 10 64.53 where E°(Pb2+/Pb) = −0.126 V, E°(PbO2/Pb2+) = 1.455 V, pKsp(PbSO4) = 7.66 and the cell diagram is (−) Pb|PbSO4, H+, HSO4|PbO2 (Pb) (+). Bisulfate and sulfate ions are chemically unleashed from the dissociation equilibrium of sulfuric acid: H2SO4(aq) → H+(aq) + HSO4(aq) with K a 1 >> 1, then HSO4(aq) ⇄ H+(aq) + SO42−(aq) with pK a 2 = 1.99 at 25 °C. Due to the prominence of H2SO4 in electrochemical processes, Braunschweig et al. presented the first broadband SFG spectra of (bi)sulfate adlayers on Pt(111) surfaces and marked a dominating vibrational band of symmetric S−O stretching of absorbed (bi)sulfate around 1245–1290 cm−1 only when E > 0.2 V vs. Ag/AgCl [266]. Apart from three specific regions stated in Figure 16, a broad feature centered at 0.16 V in the cyclic voltammogram (CV) is leaned towards the near-saturation coverages of the (bi)sulfate adlayer on Pt(111) (Figure 19a). These ions adsorb on Pt via bidentate or didentate binding geometry and possess a subtle μ dipole moment perpendicular to the Pt surface, which is SFG inactive by virtue of the selection rule. At positively stronger polarization ca. 0.21 V, it experienced an abrupt transition from two-fold into a three-fold coordinated configuration (Pt3≡O3SO Symmetry 16 01699 i001) of (bi)sulfate anions where the intense band is detected (Figure 19a–c). A second dramatic augment in SFG intensity is observed at E > 0.5 V (Figure 19a–c) and ascribed to the surface hydroxyl (Pt-OH) formation from co-absorbed water molecules via: 2H2O(l) + Pt → Pt-OHad + e + H3O+(aq). This weaker hydrogen-bonding of Pt-OH in relation to the hydrogen network of co-adsorbed H2O with sulfate absorbate (at the PtOx formation region in Figure 16) and the released hydronium cations incorporated in the double layer cause the decrease of interfacial electric field and a blue-shift of the vibrational band (reduction of the electrical Stark shift) (Figure 19b–d). One of the intriguing angles in terms of the potential-dependent shift in (bi)sulfate center frequency and intensity that Zwaschka et al. pursued to comprehend experimentally and theoretically is the dipole–dipole interaction. They emphasized the alterations of macroscopic external bias, which linearly change the local field sensed by individual adsorbates dipole–dipole coupling (molecular polarizability), could induce the nonlinearity of the SFG frequency and intensity [267].

4.3. Interfacial Uncharged Adsorbates and Fuel-Generated Oxidation on Electrode Surfaces (Molecules)

Fuel cells have been researched omnipresently to a greater extent in the substitution of the rapidly exhausted fossil fuels. The electricity is generated from the hydrogen-containing fuel oxidation (hydrogen H2, E°cell,298K = 1.229 V; methanol MeOH, E°cell,298K = 1.213 V; ethanol EtOH, E°cell,298K = 1.145 V; methane CH4, E°cell,298K = 1.06 V; or even carbon monoxide CO, E°cell,1073K = 0.9846 V) by ambient air O2 [268]. Some of the advantages of fuel cells in comparison with Galvanic cells are the high efficiency of electricity manufacture and environmentally friendly products (H2O) [269]. Due to the import of hydrogen deposition close to the HER on Pt electrodes in H2-O2/Pt fuel cells, Peremans and Tadjeddine conducted bias-evolved SFG experiments on different Pt electrodes (polycrystalline and monocrystalline of (111), (100), and (110) orientation) in H2SO4 aqueous solution at underpotential (E > EHER) and overpotential (E < EHER) [238,270]. There are a few common features observed for all electrodes: (1) an increase of SFG signals from 1800 to 2100 cm−1 in the cathodic scan from the EDL to the HER onset (≈0.5 V vs. normal hydrogen electrode (NHE)), and (2) the advent of extra 1770 cm−1 resonance peak at overpotential, suggesting its role as an intermediate in the HER. This additional orientation-independent H-Pt SFG resonance frequency is assigned to the bond in dihydride complexes (H2Pt-Ln where H-Pt vibration at 1735 cm−1) due to the off-range spectral values of onefold or multifold coordinated bound (Figure 20). At underpotential, double resonance peaks exhibit the adsorption of a water dimer at the EDL as reviewed in Section 4.1 while only polycrystalline Pt (Pt(poly)) and Pt(110) electrodes manifest the highest vibration at 2050 cm−1, which is inferred from the corrugations of surfaces.
CO electrochemistry has been immensely researched at Pt electrodes [273,274,275] and served as a model for surface adsorption phenomena [276] and electro-oxidation reaction (CO oxidation to CO2 or an intermediate in fuel cells [264,277], which will be discussed later). Lu et al. reported a ~28 cm−1∙V−1 Stark tuning rate of CO vibrational peak until the proximity of the CO oxidation onset potential [278]. Later, Noguchi et al. further observed the oxidation mechanism of adsorbed CO on Pt(111) electrode in both 0.1 M HClO4 acid solution and 0.1 M NaOH alkaline solution [279]. A peak in the SFG spectra is assigned to the stretch of CO adsorbed on-top site of Pt (around 2000–2100 cm−1) in both media. They concluded that anodic CO oxidation in the HClO4 environment obeys the Langmuir–Hinshelwood (L-H) mechanism with Pt*-OHad being an intermediate: H2O(l) + Pt ⇄ Pt-OHad + H+(aq) + e, then Pt-COad + Pt-OHad ⇄ CO2 + H+(aq) + e + 2Pt* where Pt* is the free Pt sites. On the contrary, COad is oxidized in a random Eley–Rideal (E-R) mechanism with OH ions in the pre-peak region as follows: Pt-COad + 2OH(aq) ⇄ CO2 + H2O(l) + 2e + Pt*, which is consistent with the previous investigation [280]. These two L-H and E-R mechanisms are similar to those presented in Figure 2c.
Amongst several genres of fuel cells, direct methanol/ethanol fuel cells (DMFC/DEFC) garner huge interest because CH3OH and C2H5OH are hydrogen-abundant bio-liquids and they can operate at room temperature (298 K). In DMFC, the electro-oxidation of MeOH occurs at anodic wave as follows: CH3OH(l) + H2O(l) ⇄ CO2 + 6H+(aq) + 6e. The challenging hindrance during this reaction is the incomplete oxidation of MeOH forming adsorbed CO species on the surface of the Pt electrode: CH3OH(l) ⇄ COad + 4H+(aq) + 4e. Two-fold consequences of the COad layer deserve attention: (1) the reaction of CH3OH is kinetically slower around 1.5 times, and (2) COad species block active sites of Pt for further reactions (CO poisoning). Using Pt-Ru alloy as electrode material or applying really high overpotentials to galvanize the CO oxidation to CO2 enables us to resolve the CO poisoning [276]. Preliminary studies pointed out the existence of Pt-CO bound types of bonding during the oxidation of MeOH in acidic solutions (HClO4 and H2SO4) [261,270,281]. COad can not only bond with a single atom of Pt via a linear single bond (terminal Pt-C=O), but also with bridge bonds with two Pt atoms (Pt2-C=O) at a lower vibrational frequency, higher steric hindrance. The dominance of particular COad bounded species relies on the concentration of MeOH: both terminal bonding mode (linearly bonded) and μ 2 -bridging mode (multi-bonded where µ denotes the bridging ligand in coordination chemistry and a subscript of 2 means that the number of Pt metals bound to carbonyl ligand CO is 2) of carbonyl group at high concentration ( 0.1 M) and solely μ 2 -bridging mode at lower concentration (4 × 10⁻³ M).
Acting as a model in the fuel cell’s anode compartment, Pt/CH3OH interface in acidic media was examined by Vidal et al. [282]. Vidal et al. proved that another critical factor rather than bias voltage in the dissociative chemisorption of MeOH and CO oxidation on Pt(110) surfaces is the structural surface quality of electrodes [282]. The MeOH dissociative chemisorption majorly takes place at low potentials on defect sites (steps) and shows a tight packing of COad on the terrace sites when the concentration of MeOH is around 0.1 M. At higher potentials (vs. Ag/AgCl), the signal of CO adsorbed diminishes more acutely on terraces than on defects, suggesting that the CO oxidation occurred at less-densely-populated steps/defects and there is a diffusion process of COad hopping from terraces to defects to sustain CO density at defect sites. Furthermore, Humbert et al. proposed a novel procedure to assess the steady-state stability of CO adlayer on Pt(110) electrode regarding the poisoning in alcohol-based fuel cells [119] as sketched in Figure 21. The potential dependence of the CO layer deposited from CO/ HClO4 solution on Pt(110) is estimated in the range from −800 mV until 1.0 V (vs. Ag/AgCl, 3M KCl). While Pt is polarized negatively, highly concentrated adsorbed CO species block and then quench the HER, the CO oxidation is inhibited by a “frozen” dense layer in positive potentials. In a CO-diluted solution, a dominant spectroscopic feature at around 2060–2080 cm−1 in the range from −500 mV to 600mV is well-known for C-O stretch, signifying the chemisorption of CO on the atop sites of Pt terraces. The weakening of CO bond during the chemical absorption of CO on Pt is explained by the synergistic effect of σ donation and π acceptance (backbonding or backdonation) of carbonyl ligand ( ω of free CO is 2143 cm−1) and consequently characterizes CO bonds in a metal–carbonyl complex more like a “partial” double bond (bond order close to 2), rather than a pure triple bond in free CO [151]. The gradual red shifting merely underwent in two regions of potential range except the HER and CO oxidation (from −500 to −50mV with a usual Stark shift Δ ω 1   31 cm−1 and between −50mV and 600mV with a peculiar Δ ω 2   15 cm−1). This occurrence is ascribed to the dipole–dipole coupling inside the CO layer: more dense packing results in a stronger coupling and induces a higher resonance frequency shift. The region of densely packed COad species encumbers ions accessing the electrode surface. As a result, it broadens the OHP (thicker EDL) and lessens the effective electric field. On top of that, an additional shoulder detected at 1955 cm−1 around −200 mV is assigned to Pt-H stretching mode (gray arrow in Figure 21). The co-adsorption of H and CO on Pt is only stable from −250 mV to −50 mV before desorption of hydrogen at higher potentials. The weak intensity of this peak assists the quenching effect of dense CO coverage to the HER. A PZC value of +650 mV is determined, which is also a threshold potential before CO is oxidized.
Due to the high toxicity of MeOH, DEFC can be an appealing alternative to MeOH-O2 fuel cells. In addition, it yields more electrons, and more electricity (12e from a complete oxidation of one EtOH molecule). Exemplarily, the cell notation of a DEFC is
(−) Pt-Ru alloy|C2H5OH(l), OH/H+(aq)|AEM/PEM|OH/H+(aq), O2(g)|Pt-Ru alloy (+)
Anode (−): C2H5OH(l) + 3H2O(l) ⇄ 2CO2(g) + 12H+(aq) + 12e in PEM
C2H5OH(l) + 12OH(aq) ⇄ 2CO2(g) + 9H2O(l) + 12e in AEM
Cathode (+): 3O2(g) + 12H+(aq) + 12e ⇄ 6H2O(l) in PEM
3O2(g) + 6H2O(l) + 12e ⇄ 12OH(aq) in AEM
where PEM is the proton exchange membrane, and AEM is the anion exchange membrane [283]. From the composition of this fuel cell, the metallic electrode is in contact with an aqueous electrolyte solution, and the efficiency of EtOH oxidation counts upon the electrochemical interaction with a Pt or Pt-based catalyst layer at high overpotentials [284]. Plenty of works endeavoring to analyze the EtOH oxidation mechanism are reviewed substantially elsewhere [285], but Kutz et al. [277] and later Gomes et al. [264] attempted to dig deep into the reaction intermediates identification by potential-dependence SFG spectroscopy. These groundbreaking innovations have unveiled a better deciphering of this EtOH oxidation. Owing to its greater complexity than MeOH oxidation, they identified the vibrational mode of adsorbed intermediates of isotope-labeled EtOH during the reaction steps by applying different potentials on the Pt electrode in an acidic condition. Their investigations support the conclusion that acetaldehyde (AcH or MeCHO) and acetyl (Ac- or MeCO-) are two predominant intermediate species. All in all, Kutz et al. claimed that ethanol may undergo a catalytic oxidation by dehydrogenation to form MeCHO (acetate pathway), or these EtOH and newly formed MeCHO can simultaneously adsorb and quickly decompose into surface adsorbed fragments of -CHx or short lifetime -CHxO (CO pathway). Following the dehydrogenation in the pathway (1) (Figure 22), MeCHO is oxidized further and produces adsorbed acetate, which can only diffuse from the surface by CH3COOH conversion. On the other hand, adsorbed CO species are formed after the C-C breaking (pathway (1’)) and further oxidized to generate the final desired CO2 molecules. Gomes et al. unraveled various new adsorbed intermediates, shown in red colors in Figure 22. At higher potentials of 0.9 V vs. RHE, the EtOH adsorption and C-C breaking are blocked by the formation of hydroxyl or oxide species of Pt in the oxygen region (anodic scan from 0.5 to 1.0 V vs. Ag/AgCl in Figure 16). Aside from the breakthrough of the new intermediate’s assignment, this work also shows the presence of HCHO or HCOOH as the final product of the reaction. By combining density functional theory (DFT) calculations, they indicate for the first time that the mechanism of EtOH under electro-oxidation conditions on the Pt electrode is much more sophisticated than believed so far. The application of SFG in decoding the electrochemical reaction mechanism in aqueous solutions can also be applicable to other organic acids such as formic acid HCOOH [286] or acetic acid CH3COOH [287].
Beyond addressing the cutting-edge fuel cell technology, anthropogenic global warming and climate change related to greenhouse gas (CO2) emission is another pressing and exigent issue and huge efforts have been devoted to boosting CO2 electrolysis. In principle, the overall mechanism of CO2 electrolysis resembles the electrochemical water splitting (water electrolysis) with the occurrence of the reduction reaction of carbon dioxide (CO2RR) at the cathode to transform into valid-added C1, C2, or long-chain products such as CO, hydrocarbons (CH4, C2H4…), short-chain alcohols (MeOH, EtOH), or even organic acids (HCOOH, (COOH)2…) via multiple electron transfers coupled with proton transfer steps in aqueous HCO3 electrolyte solution [288,289,290]. The major challenges for the CO2RR under ambient environments are that (1) O=C=O is a linear molecule ( D h point group) and chemically inert, so electrocatalysts are needed to overcome the high activation energy barrier (Ea) of bent-structured CO2 radical intermediate formation ( C 2 v point group, represented in Equation (1), Table 2), and (2) low faradaic efficiency and poor product selectivity due to the metal electrocatalyst-dependent property of the reaction yield [291]. To be particular, Cu electrochemically reduces CO2 to hydrocarbons, and post-transition metals such as In and Pb favor forming formate HCOO while Au and Ag can selectively convert CO2 into CO [51,292,293,294]. This CO product can further fuel the Fischer–Tropsch synthesis with H2 (syngas mixture) to produce mainly higher-chain hydrocarbons. In CO2 chemistry, the reduction potentials of CO2RR are pH dependent, and the acid–base equilibria of CO2 in aqueous solutions include the appearance of bicarbonate HCO3 and carbonate CO32− as follows: (where k H or H C is the concentration-based Henry solubility constant).
C O 2 ( g )     C O 2 ( aq )     [ CO 2 ] aq = k H × P C O 2
C O 2 ( aq )   +   H 2 O ( l )     HCO 3 ( aq )   +   H + ( aq )     p K a 1 = 6.35
HCO 3 ( aq )     CO 3 2 ( aq )   +   H + ( aq )     p K a 2   =   10.33
The pH of the electrolyte solution can shift the equilibrium of (36) and (37), and thus it is a vital parameter for optimizing CO2RR. While CO2(aq) completely transforms into its associated (bi)carbonate ions at high pH values (>pK a 2 ), carbonic acid (H2CO3) and HCO3 are the predominant proton donors to favor the HER at low pH values (<pK a 1 ). Hence, the pH of the electrolyte for CO2RR is favorable in the intermediate range from 7 to 9 to ensure the prevalence of HCO3(aq) species and reach the solubility threshold of CO2 in water ([CO2]aq   0.034 M at 25 °C and 1 atm) [51]. However, the competitiveness in limiting the faradaic current of CO2 conversion between the HER and CO2RR in aqueous electrolyte solutions is still widely recognized due to the adjacency of the equilibrium potentials of CO2RR and the HER (Table 2). For 2H+/H2 couple, the reductive potential at pH 7, 25 °C or the “formal” or “effective” reduction potential E° follows the Nernst equation below.
E 2 H + / H 2 = E   =   E °   +   0.0592 2 log [ H + ] 2 P H 2   = 0.0592 pH = 0.0592 ×   7   =   0.414   ( V )
For other CO2-based couples, E°(pH 7) = E° = E° + 0.0592 n log P C O 2 [ H + ] n K = E° + E 2 H + / H 2 0 = E° − 0.0592pH = E° − 0.414 (V) where P( C O 2 ) is a unity (1 atm), and K is the pressure or concentration of the associated product at standard condition (P = 1 atm, C is a unity). There are insignificant differences between values based on the theoretical calculation and measured values.
To promote proton-assisted CO2RR’s selectivity and reactivity, (a) specific catalysts and (b) varying electrolyte and environmental conditions are required to concurrently (1) stabilize the one-electron reduced radical (CO2) and (2) suppress the HER by increasing its Ea. Considering the recent developments of in situ potential-dependent SFG experiments on CO2RR, Huang-fu et al. analyzed the reaction intermediates on Cu(poly) and Au electrodes in 0.1 M CO2-saturated NaHCO3 solution [292] and found that surface-adsorbed *CO species (around 2100 cm−1 corresponding to the linearly bonded CO) are the key intermediate in CO2 electrochemical reduction processes only on Au while the ethoxy intermediate (Cu-OEt) with the presence of two asymmetric C-H stretching bands (2936 cm−1 for methylene group and 2996 cm−1 for methyl group) is detected only on Cu. Later, Wallentine et al. also demonstrated in the same system of Au/H2O interfaces under CO2RR conditions but evinced the atop-surface-bound adsorbed *CO spectra (from 2088 to 2116 cm−1) with zero non-resonant contribution [298]. It is interestingly reasonable because they adopted a temporal delay strategy (as mentioned in Section 4.1) between 800 nm pulse and the infrared pulse to suppress the non-resonant signal of Au. Additionally, they also introduced a backside geometry of the SFG-electrochemical system to generate the surface plasmon resonance (SPR) coupling to SFG and enhance the sensitivity with a significant signal-to-noise (S/N) improvement [157]. It is noticed that detection limits (LOD) of less than 1% of a surface monolayer can be achievable during CO2 reduction on Au by utilizing plasmon-enhanced SFG. This technique was first employed by Liu and Shen [158] (also mentioned in Section 4.1). Electrochemically, this report considered the CO2RR on Au to the CO end-product via the following elementary reaction steps (* is a surface-bound species): CO2(g) + e  *CO2 (1), *CO2 + H+(aq) *COOH (2), *COOH + H+(aq) + e  *CO + H2O(l) (3), and *CO CO(g) (4). It counts on the assumptions that (2) and (3) limit the overall CO2RR, and (1) is the rate-determining step (RDS). To directly probe the interfacial water species and further distinguish the proton origin between water and (bi)carbonate species during competing HER/CO2RR, Deng et al. recently attempted to utilize plasmon-enhanced SFG at Au/H2O interfaces in different aqueous solutions: 0.05 M Na2SO4 with Ar and CO2 purging and Ar-purged 0.1 M NaHCO3 [299]. To be particular in measuring the interfacial water spectra, one sharp peak observed at 3730 cm−1 is appointed to the “free” non-hydrogen bonded OH band in both Ar-purged and CO2-purged Na2SO4 solution (Figure 23a,b). This finding is in harmony with the previous result of Tong et al. [254]. Another sharp peak (ca. 3650 cm−1) appears when reaching near the onset of HER (−0.8 V vs. Ag/AgCl) in only Ar-purged sulfate solution (Figure 23a). This special feature is assigned to the “free” OH stretch of surface-bound hydroxide (OH) produced during HER for the first time. In the CO2-purged Na2SO4 solution, instead of the OH origin, a broad 3630 cm−1 peak is believed to come from a weakly H-bonded or singly H-bonded water (Figure 23b). Interestingly, an additional peak is seen around 3400 cm−1 when lowering negative potentials, suggesting the attribution to the interfacial water in the hydrated CO32− ions in the Stern layer of the EDL (Figure 23b,c).
In addition, it is concluded that CO2 purging appreciably improves the kinetics of active HER via two possible CO2-purged hydrogen production mechanisms: interfacial pH buffering (1) and direct (bi)carbonate reduction (2) with water and (bi)carbonate species serving as proton donor sources, respectively. In mechanism (1), the OH anions produced from the direct reduction of H2O (Equation (39) or presented in Figure 2a,b in a basic medium) are assumed to diffuse out of the Stern layer and react with CO2(aq) and HCO3(aq) species (Equations (40) and (41)). These acid-role species will neutralize the accumulation of OH at the EI and buffer the pH of the interfacial region. Based on Le Chatelier’s principle, the pH buffering of CO2(aq) and HCO3(aq) favors a shift of Equation (39) in the direction that produces more H2. Otherwise, H2CO3/HCO3 are directly reduced to produce H2 (Equations (42) and (43)) without the assistance of pH buffering in mechanism (2), then OH can be indirectly liberated from the aqueous equilibria of base-role species: HCO3 (Kb2) and CO32− (Kb1) with water (the reverse reactions of Equations (40) and (41)). These two mechanisms are summarized in Table 3.
Based on all observations, the results suggest that the kinetics of active HER in CO2-saturated Na2SO4 solution follows mechanism (2), with a transition from mechanism (2), specifically Equation (43), between −0.8 V to −1.0 V (vs. Ag/AgCl) to the mechanism (1) at lower potentials (from −1.0 to −1.2 V) in 0.1 M NaHCO3 electrolyte solution. After −1.2 V, the dominant mechanism is the direct water reduction with the support of interfacial pH buffering. These findings indicate the competition of possible proton donors in relation to their acidity and their potential-dependent interfacial concentrations. Although pure water (C = 55 M) is much more concentrated than HCO3 (C = 0.1 M) in 0.1 M NaHCO3 electrolyte, HCO3 (pK a 2 = 10.33) is more acidic than water (pKW = 14) and consequently HCO3 ions is the predominant proton donor at low overpotential. At higher overpotentials (more negative), water claims the leading role in donating protons, and HCO3 anions are repelled from the interface due to Coulombic repulsion forces. Therefore, it is necessary to decrease the concentration of interfacial water to suppress HER below −1.2 V for electrocatalytically high overpotential CO2RR.
Another essential development of electrochemical SFG spectroscopy is the adsorption and molecular orientation analyses of adsorbed organic molecules in an aqueous electrolyte solution. It consists of copious investigations of CN-containing class from small to big molecules, such as cyanoacetylene HC≡C-C≡N [300], acetonitrile CH3-CN [301], 4-cyanopyridine NC-C5H4N [302], or even aromatic diisocyanides [101] on Pt or Au electrodes. In detail, the electrode potential dependence of the HCCCN/Au(111) interface in 5 × 10⁻⁴ M NaClO4 was scrutinized from +0.1 V to +0.5V vs. NHE and reversely to −1.0 V applied voltage vs. NHE by Humbert et al. [300], as depicted in Figure 24(1). The major signature of the stretching mode of CN moiety is seen at 2225 cm−1 in the shape of a dip. Triple C≡C bond is impalpable due to the very low IR cross-section nature (low dipole moment change). The dip-shaped characteristic attests to the solution-headed -CN orientation and the dominant SFG contribution of the Au surface. From SFG spectra, the -CN vibrational frequencies blue shifted slightly from initial voltage 0.1 V to 0.5 V, and the Stark effect is attributed to this shift ( Δ ω   20 cm−1), which were in agreement with the value from the previous report on CN/Au(hkl) interface [303]. It is surmised that the Au surface is saturated and passivated by adsorbed HCCCN molecules at threshold polarization (+0.5 V) until reaching the manifestation of HER. At highly negative potentials beyond −0.5 V, disappearance of the CN vibrational signal is elucidated by the desorption of those molecules. With a more complex organic structure with a pyridine ring (C2v point group), Pluchery and Tadjeddine had already long before published an investigation on the same electrode in 0.1 M NaClO4. The SFG spectra are acquired from −1.0 until 0.7 V vs. Ag/AgCl in the range of pyridine ring (830–1250 cm−1, nine resonances) and CN (2050–2250 cm−1) stretching modes [302]. From the pyridine region, the “in plane” vibrational modes are predominant at potentially positive and negative polarizations whilst the “out of plane” ones are destructed there and reach the maximum at transitional potentials. These observations are interpreted with the molecular reorganization of 4-cyanopyridine (C2v symmetry axis) with respect to the surface of Au. They adsorb (a) perpendicularly on positively and negatively charged Au surfaces (upright orientation) and (b) parallel on roughly neutrally charged surfaces (horizontal orientation). As the spectral lineshapes of the CN stretching region switch from a dip (at −0.4 V) to a peak (at +0.4 V) as observed in Figure 24(2,3), it demonstrates that the -CN group flipped their N ending atom from heading towards the solution at negative voltages [300,303] to adsorbing closely to the positive charged surface. Furthermore, the weak SFG activity of the CN signal is possibly credited to the hydrolysis of a small amount of absorbed species. Not long ago, Ge et al. studied the bias-dependent SFG spectroscopy of isocyanide (-NC) groups rather complex systems with benzene ring(s), including 1,4-phenylene diisocyanide (PDI), 4,4″-biphenyl diisocyanide (BPDI), and 4,4’’-p-terphenyl diisocyanide (TPDI) [101]. It is known that these aromatic para-substituted diisocyanide molecules bind covalently with Au flat surface to form highly ordered self-assembled monolayers (SAMs) [304,305]. They reported that there is a linearly increasing pattern in frequencies of surface-bound NC stretching from −0.7 to +0.1 V (vs. Ag/AgCl) under the electrochemical Stark effect. Strikingly, they relate the potential dependent behavior to the structure of the electrical double layer by extracting the Stern layer thickness (dStern). It is indicated that dStern of PDI SAM is in the ballpark of the molecular length of PDI, deducing to the electrolyte’s non-intrusiveness of the close-packed structure of SAM. This observation is in line with the statement from the previous study on CO poisoning [119]. On the other hand, the values of dStern in BPDI and TPDI cases are smaller than their absorbed monolayer, inferring the infiltration of 0.1 M NaClO4 electrolyte into the SAM.
Likewise, in the case of 4-cyanopyridine, Schultz and Gewirth also disclosed the phenomena of molecular inversion of an adsorbed zwitterionic species, p-aminobenzoic acid p-H2N-C6H5-COOH (PABA) under the external potential stimuli at PABA/Ag(111) interface in 0.1 M KF solution [306] as sketched in Figure 25. From potentiodynamic SFG spectra, there are some detected vibrational modes: a symmetric mode of COO at 1405 cm−1 and a bending mode of NH3+ at around 1609 cm−1 in the region from 1350 to 1675 cm−1, and an aromatic CH stretching mode between 2900 and 3450 cm−1. Nonetheless, the latter is vague by the IR adsorption attenuation of water (OH bending mode), so the analysis counts on the COO and CH peaks. The transition from a peak at a positive surface to a dip at a negative surface depicts the molecular flipping of this zwitterion. At negative scanning to the PZC, PABA orients with its COO group pointing away from the surface. Around PZC, it is more relaxed and has a more random orientation. Remarkably, the experience of a blue shift in COO stretching at more positive potentials is preferable to be elucidated by a more condensed phase system (higher packing density but still less than the solid-state) rather than a Stark shift or coordination variation. Thus, this supports the conclusion that PABA forms a dense film with COO adsorbed on the Ag surface at highly positive potentials.

5. Conclusions and Future Perspectives

From the perspective of group theory, electrochemical interfaces (electrode–electrolyte interfaces) break the symmetry elements of a centrosymmetric structure. Sum-frequency generation (SFG) is a non-invasive optical probe providing interface-specific vibrational spectra with sub-monolayer sensitivity, so in situ hyphenation of SFG spectroscopy with electrochemical systems will not only assist in unveiling the adsorption of interfacial species at the EDL, but also sharpen the mechanistic understanding of electrocatalytic and photocatalytic reactions via chemical intermediates identification. Whilst water is the sine qua non for driving environmentally sustainable and green-energy-oriented electrochemical processes, probing of the fundamental water structures at electrochemical interfaces by SFG is hardly experimentally demonstrated due to several hurdles: (1) the strong IR adsorption of water molecules and (2) the overwhelming of non-resonant contribution with respect to the resonance of interested species, and (3) the challenges to differentiate the structural orientation of water molecules between two distinctive layers of the EDL (the Stern and diffuse layer) under electrochemical control. The development of SFG with groundbreaking and advanced configurations can offer unprecedented opportunities for potentially addressing these challenges. The complexity of electrocatalytic reactions has been evidenced by SFG spectroscopy. A novel and promising methodology of using THz spectroscopy coupled with the electrochemical–SFG system could also polarize the water molecules rather than applying an external bias on the electrode. Thus, it could offer innovative results in decoding the water structuring at the regime of the electrical double layer.

Author Contributions

Writing—original draft preparation, writing—review and editing, figures drawing, visualization, conceptualization, B.L.P.; writing—review and editing, co-supervision, A.R.; writing—review and editing, A.T.; writing—review and editing, co-supervision, funding acquisition, L.D.; writing—review and editing, supervision, funding acquisition, C.H. All authors have read and agreed to the published version of the manuscript.

Funding

This research was financially supported by the “Mission pour les Initiatives Transverses et Interdisciplinaires” (MITI-CNRS), grant number “80PRIME2023” through the research project “EMOSEINE”. L.D. thanks the French State in the framework of the Investments for the Future programme IdEx University of Bordeaux for its financial support.

Data Availability Statement

Not applicable.

Conflicts of Interest

The authors declare no conflicts of interest.

Abbreviations

Physical Constants, Symbols
Universal gas constantR = 8.314 J∙mol–1∙K–1 = 0.08314 L∙bar∙mol–1∙K–1 = 0.08205 atm∙L∙K–1∙mol–1
Faraday’s constantF = 96,500 C∙mol–1
Avogadro’s constantNA = 6.0221 × 10²³ mol–1
The elementary chargee = 1.6021 × 10⁻¹⁹ C
Speed of lightc = 2.998 × 10⁸ m∙s–1
Planck’s constanth = 6.626 × 10⁻³⁴ J∙s
Boltzmann constantkB = 1.3807 × 10⁻²³ J∙K–1
Zero of the Celsius scale0 °C = 273.15 K
Standard pressurep° = 1 bar = 105 Pa
Atmospheric pressure1 atm = 1.013 bar = 1.013 × 10⁵ Pa = 760 mm Hg = 760 Torr
Electron-volt1 eV = 1.6022∙10−19 J
Euler’s numbere = 2.7183
Conversion1 pm = 10–12 m; 1 Å = 10−10 m; 1 nm = 10–9 m
Equations
Planck–Einstein relation E = h c λ = h ν = h c ω   where   λ   [ nm ] ,   ν   [ Hz   or   s 1 ] ,   ω   [cm−1]
Relation between standard Gibbs (free) energy, equilibrium constant, and standard cell potential (electromotive force)∆G° = −RTlnK = −nE°F
or K = e G ° R T = e n F E ° R T = 10   n E ° 0.0592
where   2.303 R T F = 0.0592   V at 25 °C
and ln(x) = 2.303log(x)
Relation between Gibbs energy and reaction quotient for a reactionaA(aq) + bB(aq)  cC(aq) + dD(aq)
G = G ° + RTlnQ   where   Q = a C c a D d a A a a B b = [ C ] c [ D ] d [ A ] a [ B ] b
when   a M = [ M ] (a is the activity of species M),
Nernst equationEox/red = E ° ox / red   +   2.303 R T m F log [ O x ] a [ R e d ] b   = E ° ox / red   +   0.0592 m log [ O x ] a [ R e d ] b
( when   the   activity   coefficient   γ M of species M is 1),
E = E° + 2.303 R T n F log Q 1 = E + °   0.0592 n log Q 1 at 25 °C
Henderson–Hasselbalch equationpH = pKa + log [ A ] [ H A ] when Ka · C H A o , Kb · C A o >> Kw   and   [ H +
] ,   [ O H ]   < <   C H A o ,   C A o ( when   γ M = 1)
where pKa = −logKa; pKsp = −logKsp; pKw = −logKw = 14 at 25 °C.

References

  1. Stamenkovic, V.R.; Strmcnik, D.; Lopes, P.P.; Markovic, N.M. Energy and fuels from electrochemical interfaces. Nat. Mater. 2017, 16, 57–69. [Google Scholar] [CrossRef] [PubMed]
  2. Millet, P. Fundamentals of Water Electrolysis. In Hydrogen Production; Wiley: Hoboken, NJ, USA, 2015; pp. 33–62. [Google Scholar]
  3. Bard, A.J.; Faulkner, L.R. Electrochemical Methods: Fundamentals and Applications, 2nd ed.; Wiley: Hoboken, NJ, USA, 2000. [Google Scholar]
  4. Crittenden, J.C.; Trussell, R.R.; Hand, D.W.; Howe, K.J.; Tchobanoglous, G. Physical and Chemical Quality of Water. In MWH’s Water Treatment: Principles and Design, 3rd ed.; John Wiley & Sons: Hoboken, NJ, USA, 2012; pp. 17–71. [Google Scholar]
  5. Ruiz-Lopez, M.F.; Francisco, J.S.; Martins-Costa, M.T.C.; Anglada, J.M. Molecular reactions at aqueous interfaces. Nat. Rev. Chem. 2020, 4, 459–475. [Google Scholar] [CrossRef]
  6. Lang, X.; Shi, L.; Zhao, Z.; Min, W. Probing the structure of water in individual living cells. Nat. Commun. 2024, 15, 5271. [Google Scholar] [CrossRef]
  7. Tarun, O.B.; Okur, H.I.; Rangamani, P.; Roke, S. Transient domains of ordered water induced by divalent ions lead to lipid membrane curvature fluctuations. Commun. Chem. 2020, 3, 17. [Google Scholar] [CrossRef] [PubMed]
  8. Shi, G.; Wang, H.; Zhang, Y.; Cheng, C.; Zhai, T.; Chen, B.; Liu, X.; Jono, R.; Mao, X.; Liu, Y.; et al. The effect of water on colloidal quantum dot solar cells. Nat. Commun. 2021, 12, 4381. [Google Scholar] [CrossRef]
  9. Chen, S.; Takata, T.; Domen, K. Particulate photocatalysts for overall water splitting. Nat. Rev. Mater. 2017, 2, 17050. [Google Scholar] [CrossRef]
  10. Duan, C.; Kee, R.; Zhu, H.; Sullivan, N.; Zhu, L.; Bian, L.; Jennings, D.; O’Hayre, R. Highly efficient reversible protonic ceramic electrochemical cells for power generation and fuel production. Nat. Energy 2019, 4, 230–240. [Google Scholar] [CrossRef]
  11. Yousaf, M.; Lu, Y.; Akbar, M.; Lei, L.; Jing, S.; Tao, Y. Advances in solid oxide fuel cell technologies: Lowering the operating temperatures through material innovations. Mater. Today Energy 2024, 44, 101633. [Google Scholar] [CrossRef]
  12. Gonella, G.; Backus, E.H.G.; Nagata, Y.; Bonthuis, D.J.; Loche, P.; Schlaich, A.; Netz, R.R.; Kühnle, A.; McCrum, I.T.; Koper, M.T.M.; et al. Water at charged interfaces. Nat. Rev. Chem. 2021, 5, 466–485. [Google Scholar] [CrossRef]
  13. Shin, S.-J.; Kim, D.H.; Bae, G.; Ringe, S.; Choi, H.; Lim, H.-K.; Choi, C.H.; Kim, H. On the importance of the electric double layer structure in aqueous electrocatalysis. Nat. Commun. 2022, 13, 174. [Google Scholar] [CrossRef]
  14. Butt, H.-J.; Graf, K.; Kappl, M. The Electric Double Layer. In Physics and Chemistry of Interfaces; John Wiley & Sons: Hoboken, NJ, USA, 2003; pp. 42–56. [Google Scholar]
  15. Harris, D.C. Chapter 16. Electroanalytical techniques. In Quantitative Chemical Analysis, 8th ed.; W.H. Freeman: New York, NY, USA, 2010. [Google Scholar]
  16. Chatenet, M.; Pollet, B.G.; Dekel, D.R.; Dionigi, F.; Deseure, J.; Millet, P.; Braatz, R.D.; Bazant, M.Z.; Eikerling, M.; Staffell, I.; et al. Water electrolysis: From textbook knowledge to the latest scientific strategies and industrial developments. Chem. Soc. Rev. 2022, 51, 4583–4762. [Google Scholar] [CrossRef]
  17. Harvey, D. Chapter 11. Electrochemical Methods. In Modern Analytical Chemistry; McGraw-Hill Companies: New York, NY, USA, 2016; Volume 2.1, p. 1122. [Google Scholar]
  18. Pastor, E.; Lian, Z.; Xia, L.; Ecija, D.; Galán-Mascarós, J.R.; Barja, S.; Giménez, S.; Arbiol, J.; López, N.; García de Arquer, F.P. Complementary probes for the electrochemical interface. Nat. Rev. Chem. 2024, 8, 159–178. [Google Scholar] [CrossRef] [PubMed]
  19. Zhang, L.; Kuang, P.; Yu, J. Introductory chapter: Fundamentals of photocatalysis and electrocatalysis. In Graphene Oxide-Metal Oxide and Other Graphene Oxide-Based Composites in Photocatalysis and Electrocatalysis; Elsevier: Amsterdam, The Netherlands, 2022; pp. 1–30. [Google Scholar]
  20. Millet, P. Chapter 2—Fundamentals of water electrolysis. In Electrochemical Power Sources: Fundamentals, Systems, and Applications; Elsevier: Amsterdam, The Netherlands, 2022; pp. 37–62. [Google Scholar]
  21. Santana Santos, C.; Jaato, B.N.; Sanjuán, I.; Schuhmann, W.; Andronescu, C. Operando Scanning Electrochemical Probe Microscopy during Electrocatalysis. Chem. Rev. 2023, 123, 4972–5019. [Google Scholar] [CrossRef]
  22. Bard, A.J.; Abruna, H.D.; Chidsey, C.E.; Faulkner, L.R.; Feldberg, S.W.; Itaya, K.; Majda, M.; Melroy, O.; Murray, R.W. The electrode/electrolyte interface—A status report. J. Phys. Chem. 1993, 97, 7147–7173. [Google Scholar] [CrossRef]
  23. Wang, Y.; Skaanvik, S.A.; Xiong, X.; Wang, S.; Dong, M. Scanning probe microscopy for electrocatalysis. Matter 2021, 4, 3483–3514. [Google Scholar] [CrossRef]
  24. Liu, R.-Z.; Shen, Z.-Z.; Wen, R.; Wan, L.-J. Recent advances in the application of scanning probe microscopy in interfacial electroanalytical chemistry. J. Electroanal. Chem. 2023, 938, 117443. [Google Scholar] [CrossRef]
  25. Wang, L.-X.; Sun, C.; Huang, S.-L.; Kang, B.; Chen, H.-Y.; Xu, J.-J. Single-Particle Imaging Reveals the Electrical Double-Layer Modulated Ion Dynamics at Crowded Interface. Nano Lett. 2024, 24, 9743–9749. [Google Scholar] [CrossRef] [PubMed]
  26. Favaro, M.; Jeong, B.; Ross, P.N.; Yano, J.; Hussain, Z.; Liu, Z.; Crumlin, E.J. Unravelling the electrochemical double layer by direct probing of the solid/liquid interface. Nat. Commun. 2016, 7, 12695. [Google Scholar] [CrossRef]
  27. Velasco-Velez, J.J.; Pfeifer, V.; Hävecker, M.; Weatherup, R.S.; Arrigo, R.; Chuang, C.-H.; Stotz, E.; Weinberg, G.; Salmeron, M.; Schlögl, R.; et al. Photoelectron Spectroscopy at the Graphene–Liquid Interface Reveals the Electronic Structure of an Electrodeposited Cobalt/Graphene Electrocatalyst. Angew. Chem. Int. Ed. 2015, 54, 14554–14558. [Google Scholar] [CrossRef] [PubMed]
  28. Favaro, M.; Drisdell, W.S.; Marcus, M.A.; Gregoire, J.M.; Crumlin, E.J.; Haber, J.A.; Yano, J. An Operando Investigation of (Ni–Fe–Co–Ce)Ox System as Highly Efficient Electrocatalyst for Oxygen Evolution Reaction. ACS Catal. 2017, 7, 1248–1258. [Google Scholar] [CrossRef]
  29. Velasco-Velez, J.-J.; Wu, C.H.; Pascal, T.A.; Wan, L.F.; Guo, J.; Prendergast, D.; Salmeron, M. The structure of interfacial water on gold electrodes studied by X-Ray absorption spectroscopy. Science 2014, 346, 831–834. [Google Scholar] [CrossRef] [PubMed]
  30. Grespi, A.; Larsson, A.; Abbondanza, G.; Eidhagen, J.; Gajdek, D.; Manidi, J.; Tayal, A.; Pan, J.; Merte, L.R.; Lundgren, E. Probing the electrode-liquid interface using operando total-reflection X-ray absorption spectroscopy. Surf. Sci. 2024, 748, 122538. [Google Scholar] [CrossRef]
  31. Shimizu, T.K.; Maier, S.; Verdaguer, A.; Velasco-Velez, J.-J.; Salmeron, M. Water at surfaces and interfaces: From molecules to ice and bulk liquid. Prog. Surf. Sci. 2018, 93, 87–107. [Google Scholar] [CrossRef]
  32. Fleischmann, M.; Hendra, P.J.; Hill, I.R.; Pemble, M.E. Enhanced Raman spectra from species formed by the coadsorption of halide ions and water molecules on silver electrodes. J. Electroanal. Chem. Interfacial Electrochem. 1981, 117, 243–255. [Google Scholar] [CrossRef]
  33. Nyamekye, C.K.A.; Bobbitt, J.M.; Zhu, Q.; Smith, E.A. The evolution of total internal reflection Raman spectroscopy for the chemical characterization of thin films and interfaces. Anal. Bioanal. Chem. 2020, 412, 6009–6022. [Google Scholar] [CrossRef] [PubMed]
  34. Woods, D.A.; Bain, C.D. Total internal reflection Raman spectroscopy. Analyst 2012, 137, 35–48. [Google Scholar] [CrossRef]
  35. Weiling, M.; Pfeiffer, F.; Baghernejad, M. Vibrational Spectroscopy Insight into the Electrode|electrolyte Interface/Interphase in Lithium Batteries. Adv. Energy Mater. 2022, 12, 2202504. [Google Scholar] [CrossRef]
  36. Shen, A.; Pemberton, J.E. Investigation of trace interfacial water at silver electrodes in a series of normal alcohols using surface enhanced Raman scattering. Phys. Chem. Chem. Phys. 1999, 1, 5677–5684. [Google Scholar] [CrossRef]
  37. Cui, L.; Liu, Z.; Duan, S.; Wu, D.-Y.; Ren, B.; Tian, Z.-Q.; Zou, S.-Z. Orientation Change of Adsorbed Pyrazine on Roughened Rhodium Electrodes as Probed by Surface-Enhanced Raman Spectroscopy. J. Phys. Chem. B 2005, 109, 17597–17602. [Google Scholar] [CrossRef]
  38. Martín Sabanés, N.; Ohto, T.; Andrienko, D.; Nagata, Y.; Domke, K.F. Electrochemical TERS Elucidates Potential-Induced Molecular Reorientation of Adenine/Au(111). Angew. Chem. Int. Ed. 2017, 56, 9796–9801. [Google Scholar] [CrossRef]
  39. Verma, P. Tip-Enhanced Raman Spectroscopy: Technique and Recent Advances. Chem. Rev. 2017, 117, 6447–6466. [Google Scholar] [CrossRef] [PubMed]
  40. Ataka, K.-I.; Yotsuyanagi, T.; Osawa, M. Potential-Dependent Reorientation of Water Molecules at an Electrode/Electrolyte Interface Studied by Surface-Enhanced Infrared Absorption Spectroscopy. J. Phys. Chem. 1996, 100, 10664–10672. [Google Scholar] [CrossRef]
  41. Wandlowski, T.; Ataka, K.; Pronkin, S.; Diesing, D. Surface enhanced infrared spectroscopy—Au(111-20nm)/sulphuric acid—New aspects and challenges. Electrochim. Acta 2004, 49, 1233–1247. [Google Scholar] [CrossRef]
  42. Cuesta, A. ATR-SEIRAS for time-resolved studies of electrode–electrolyte interfaces. Curr. Opin. Electrochem. 2022, 35, 101041. [Google Scholar] [CrossRef]
  43. Nakamura, M.; Kato, H.; Hoshi, N. Infrared Spectroscopy of Water Adsorbed on M(111) (M = Pt, Pd, Rh, Au, Cu) Electrodes in Sulfuric Acid Solution. J. Phys. Chem. C 2008, 112, 9458–9463. [Google Scholar] [CrossRef]
  44. Osawa, M.; Tsushima, M.; Mogami, H.; Samjeské, G.; Yamakata, A. Structure of Water at the Electrified Platinum−Water Interface:  A Study by Surface-Enhanced Infrared Absorption Spectroscopy. J. Phys. Chem. C 2008, 112, 4248–4256. [Google Scholar] [CrossRef]
  45. Hou, J.; Xu, B.; Lu, Q. Influence of electric double layer rigidity on CO adsorption and electroreduction rate. Nat. Commun. 2024, 15, 1926. [Google Scholar] [CrossRef] [PubMed]
  46. Tian, Y.; Huang, B.; Song, Y.; Zhang, Y.; Guan, D.; Hong, J.; Cao, D.; Wang, E.; Xu, L.; Shao-Horn, Y.; et al. Effect of ion-specific water structures at metal surfaces on hydrogen production. Nat. Commun. 2024, 15, 7834. [Google Scholar] [CrossRef]
  47. Li, J.F.; Huang, Y.F.; Ding, Y.; Yang, Z.L.; Li, S.B.; Zhou, X.S.; Fan, F.R.; Zhang, W.; Zhou, Z.Y.; Wu, D.Y.; et al. Shell-isolated nanoparticle-enhanced Raman spectroscopy. Nature 2010, 464, 392–395. [Google Scholar] [CrossRef]
  48. Li, C.-Y.; Le, J.-B.; Wang, Y.-H.; Chen, S.; Yang, Z.-L.; Li, J.-F.; Cheng, J.; Tian, Z.-Q. In situ probing electrified interfacial water structures at atomically flat surfaces. Nat. Mater. 2019, 18, 697–701. [Google Scholar] [CrossRef]
  49. Li, C.-Y.; Chen, M.; Liu, S.; Lu, X.; Meng, J.; Yan, J.; Abruña, H.D.; Feng, G.; Lian, T. Unconventional interfacial water structure of highly concentrated aqueous electrolytes at negative electrode polarizations. Nat. Commun. 2022, 13, 5330. [Google Scholar] [CrossRef]
  50. Wang, Y.-H.; Zheng, S.; Yang, W.-M.; Zhou, R.-Y.; He, Q.-F.; Radjenovic, P.; Dong, J.-C.; Li, S.; Zheng, J.; Yang, Z.-L.; et al. In situ Raman spectroscopy reveals the structure and dissociation of interfacial water. Nature 2021, 600, 81–85. [Google Scholar] [CrossRef] [PubMed]
  51. Jovanovic, S.; Jakes, P.; Merz, S.; Daniel, D.T.; Eichel, R.-A.; Granwehr, J. In operando NMR investigations of the aqueous electrolyte chemistry during electrolytic CO2 reduction. Commun. Chem. 2023, 6, 268. [Google Scholar] [CrossRef] [PubMed]
  52. Mohammadi, M.; Jerschow, A. In situ and operando magnetic resonance imaging of electrochemical cells: A perspective. J. Magn. Reson. 2019, 308, 106600. [Google Scholar] [CrossRef]
  53. Griffin, J.M.; Forse, A.C.; Tsai, W.-Y.; Taberna, P.-L.; Simon, P.; Grey, C.P. In situ NMR and electrochemical quartz crystal microbalance techniques reveal the structure of the electrical double layer in supercapacitors. Nat. Mater. 2015, 14, 812–819. [Google Scholar] [CrossRef] [PubMed]
  54. Wang, Y.; Malveau, C.; Rochefort, D. Solid-state NMR and electrochemical dilatometry study of charge storage in supercapacitor with redox ionic liquid electrolyte. Energy Storage Mater. 2019, 20, 80–88. [Google Scholar] [CrossRef]
  55. Bols, M.L.; Ma, J.; Rammal, F.; Plessers, D.; Wu, X.; Navarro-Jaén, S.; Heyer, A.J.; Sels, B.F.; Solomon, E.I.; Schoonheydt, R.A. In Situ UV–Vis–NIR Absorption Spectroscopy and Catalysis. Chem. Rev. 2024, 124, 2352–2418. [Google Scholar] [CrossRef] [PubMed]
  56. Pool, R.E.; Versluis, J.; Backus, E.H.G.; Bonn, M. Comparative Study of Direct and Phase-Specific Vibrational Sum-Frequency Generation Spectroscopy: Advantages and Limitations. J. Phys. Chem. B 2011, 115, 15362–15369. [Google Scholar] [CrossRef] [PubMed]
  57. Stiopkin, I.V.; Jayathilake, H.D.; Bordenyuk, A.N.; Benderskii, A.V. Heterodyne-Detected Vibrational Sum Frequency Generation Spectroscopy. J. Am. Chem. Soc. 2008, 130, 2271–2275. [Google Scholar] [CrossRef]
  58. Sayama, A.; Nihonyanagi, S.; Ohshima, Y.; Tahara, T. In situ observation of the potential-dependent structure of an electrolyte/electrode interface by heterodyne-detected vibrational sum frequency generation. Phys. Chem. Chem. Phys. 2020, 22, 2580–2589. [Google Scholar] [CrossRef]
  59. Singh, A.K.; Doan, L.C.; Lou, D.; Wen, C.; Vinh, N.Q. Interfacial layers between ion and water detected by terahertz spectroscopy. J. Chem. Phys. 2022, 157, 054501. [Google Scholar] [CrossRef] [PubMed]
  60. Nemes, C.T.; Swierk, J.R.; Schmuttenmaer, C.A. A Terahertz-Transparent Electrochemical Cell for In Situ Terahertz Spectroelectrochemistry. Anal. Chem. 2018, 90, 4389–4396. [Google Scholar] [CrossRef] [PubMed]
  61. Isogai, T.; Uranagase, M.; Motobayashi, K.; Ogata, S.; Ikeda, K. Probing collective terahertz vibrations of a hydrogen-bonded water network at buried electrochemical interfaces. Chem. Sci. 2023, 14, 6531–6537. [Google Scholar] [CrossRef] [PubMed]
  62. Helmholtz, H. Uber einige Gesetze der Vertheilung elektrischer Strome in korperlichen Leitem mit Anwendung auf die thierisch-elektrischen Versuche. Ann. Phys. Chem. 1853, 89, 211–233. [Google Scholar] [CrossRef]
  63. Helmholtz, H Studien über electrische Grenzschichten. Ann. Phys. Chem. 1879, 243, 337–382. [CrossRef]
  64. Gouy, M. Sur la constitution de la charge électrique à la surface d’un électrolyte. J. Phys. Theor. Appl. 1910, 9, 457–468. [Google Scholar] [CrossRef]
  65. Chapman, D.L. A contribution to the theory of electrocapillarity. Lond. Edinb. Dublin Philos. Mag. J. Sci. 1913, 25, 475–481. [Google Scholar] [CrossRef]
  66. Housecroft, C.E.; Sharpe, A.G. Inorganic Chemistry, 5th ed.; Pearson Prentice Hall: Harlow, England, 2018; p. 1137. [Google Scholar]
  67. Mills, I.; Cvitas, T.; Homann, K.; Kallay, N.; Kuchitsu, K. Electric dipole moment. In Quantities, Units and Symbols in Physical Chemistry, 2nd ed.; International Union of Pure and Applied Chemistry (IUPAC): Zürich, Switzerland, 1993. [Google Scholar]
  68. Wen, Y.-C.; Zha, S.; Liu, X.; Yang, S.; Guo, P.; Shi, G.; Fang, H.; Shen, Y.R.; Tian, C. Unveiling Microscopic Structures of Charged Water Interfaces by Surface-Specific Vibrational Spectroscopy. Phys. Rev. Lett. 2016, 116, 016101. [Google Scholar] [CrossRef]
  69. Rey, N.G.; Dlott, D.D. Studies of electrochemical interfaces by broadband sum frequency generation. J. Electroanal. Chem. 2017, 800, 114–125. [Google Scholar] [CrossRef]
  70. Beranek, R. (Photo)electrochemical Methods for the Determination of the Band Edge Positions of TiO2-Based Nanomaterials. Adv. Phys. Chem. 2011, 2011, 786759. [Google Scholar] [CrossRef]
  71. Brown, M.A.; Abbas, Z.; Kleibert, A.; Green, R.G.; Goel, A.; May, S.; Squires, T.M. Determination of Surface Potential and Electrical Double-Layer Structure at the Aqueous Electrolyte-Nanoparticle Interface. Phys. Rev. X 2016, 6, 011007. [Google Scholar] [CrossRef]
  72. Matsumoto, K.; Miyazaki, K.; Hwang, J.; Yamamoto, T.; Sakuda, A. Electrode Potentials Part 1: Fundamentals and Aqueous Systems. Electrochemistry 2022, 90, 102001. [Google Scholar] [CrossRef]
  73. Debye, P.H.E.; Zur Theorie der Elektrolyte, I. Gefrierpunktserniedrigung und verwandte Erscheinungen. Phys. Z. 1923, 24, 185–206. [Google Scholar]
  74. Stern, O. Zur theorie der elektrolytischen doppelschicht. Z. Für Elektrochem. Und Angew. Phys. Chem. 1924, 30, 508–516. [Google Scholar] [CrossRef]
  75. Grahame, D.C. The Electrical Double Layer and the Theory of Electrocapillarity. Chem. Rev. 1947, 41, 441–501. [Google Scholar] [CrossRef]
  76. Bockris, J.O.; Devanathan, M.A.V.; Müller, K. On the structure of charged interfaces. Proc. R. Soc. Lond. A Math. Phys. Sci. 1963, 274, 55–79. [Google Scholar]
  77. Limaye, A.; Suvlu, D.; Willard, A.P. Water molecules mute the dependence of the double-layer potential profile on ionic strength. Faraday Discuss. 2024, 249, 267–288. [Google Scholar] [CrossRef]
  78. Kornyshev, A.A.; Spohr, E.; Vorotyntsev, M.A. Electrochemical Interfaces: At the Border Line. In Encyclopedia of Electrochemistry; Wiley: Hoboken, NJ, USA, 2007. [Google Scholar]
  79. Baldelli, S. Probing Electric Fields at the Ionic Liquid−Electrode Interface Using Sum Frequency Generation Spectroscopy and Electrochemistry. J. Phys. Chem. B 2005, 109, 13049–13051. [Google Scholar] [CrossRef]
  80. Nafie, L.A. Vibrational optical activity: From discovery and development to future challenges. Chirality 2020, 32, 667–692. [Google Scholar] [CrossRef]
  81. Ishibashi, T.-a.; Okuno, M. Chapter 9—Heterodyne-detected chiral vibrational sum frequency generation spectroscopy of bulk and interfacial samples. In Molecular and Laser Spectroscopy; Gupta, V.P., Ozaki, Y., Eds.; Elsevier: Amsterdam, The Netherlands, 2020; pp. 315–348. [Google Scholar]
  82. Molloy, K.C. Group Theory for Chemists: Fundamental Theory and Applications, 2nd ed.; Horwood: Chichester, UK, 2004. [Google Scholar]
  83. McQuarrie, D.A.; Simon, J.D. Physical Chemistry: A Molecular Approach; University Science Books: Sausalito, CA, USA, 1997. [Google Scholar]
  84. Humbert, C.; Noblet, T. A Unified Mathematical Formalism for First to Third Order Dielectric Response of Matter: Application to Surface-Specific Two-Colour Vibrational Optical Spectroscopy. Symmetry 2021, 13, 153. [Google Scholar] [CrossRef]
  85. Humbert, C.; Noblet, T.; Dalstein, L.; Busson, B.; Barbillon, G. Sum-Frequency Generation Spectroscopy of Plasmonic Nanomaterials: A Review. Materials 2019, 12, 836. [Google Scholar] [CrossRef] [PubMed]
  86. Humbert, C.; Pluchery, O.; Lacaze, E.; Busson, B.; Tadjeddine, A. Two-Colour Sum-Frequency Generation Spectroscopy Coupled to Plasmonics with the CLIO Free Electron Laser. Photonics 2022, 9, 55. [Google Scholar] [CrossRef]
  87. Noblet, T.; Dreesen, L.; Boujday, S.; Méthivier, C.; Busson, B.; Tadjeddine, A.; Humbert, C. Semiconductor quantum dots reveal dipolar coupling from exciton to ligand vibration. Commun. Chem. 2018, 1, 76. [Google Scholar] [CrossRef]
  88. Lambert, A.G.; Davies, P.B.; Neivandt, D.J. Implementing the Theory of Sum Frequency Generation Vibrational Spectroscopy: A Tutorial Review. Appl. Spectrosc. Rev. 2005, 40, 103–145. [Google Scholar] [CrossRef]
  89. Noblet, T.; Boujday, S.; Méthivier, C.; Erard, M.; Hottechamps, J.; Busson, B.; Humbert, C. Two-Dimensional Layers of Colloidal CdTe Quantum Dots: Assembly, Optical Properties, and Vibroelectronic Coupling. J. Phys. Chem. C 2020, 124, 25873–25883. [Google Scholar] [CrossRef]
  90. Pham, B.L.; Piard, A.; Erard, M.; Gayral, A.; Noblet, T.; Dreesen, L.; Humbert, C. Quantum efficiency of excitonic enhancement in nanosensors by rainbow nonlinear optical spectroscopy. In Proceedings of the French, Swiss and German Conference on Photochemistry, Photophysics and Photosciences CP2P’23, Mulhouse, France, 15–17 May 2023. [Google Scholar]
  91. Takashima, K.; Furukawa, Y. Vibrational Stark effect (VSE) on the infrared spectrum of a poly(methyl methacrylate) thin film. Vib. Spectrosc. 2015, 78, 54–59. [Google Scholar] [CrossRef]
  92. Andrews, S.S.; Boxer, S.G. Vibrational Stark Effects of Nitriles, I. Methods and Experimental Results. J. Phys. Chem. A 2000, 104, 11853–11863. [Google Scholar] [CrossRef]
  93. Lambert, D.K. Vibrational Stark effect of adsorbates at electrochemical interfaces. Electrochim. Acta 1996, 41, 623–630. [Google Scholar] [CrossRef]
  94. Kang, B.J.; Rohwer, E.J.; Rohrbach, D.; Zyaee, E.; Akbarimoosavi, M.; Ollmann, Z.; Sorohhov, G.; Borgoo, A.; Cascella, M.; Cannizzo, A.; et al. Time-resolved THz Stark spectroscopy of molecules in solution. Nat. Commun. 2024, 15, 4212. [Google Scholar] [CrossRef] [PubMed]
  95. Hush, N.S.; Reimers, J.R. Vibrational Stark Spectroscopy. 1. Basic Theory and Application to the CO Stretch. J. Phys. Chem. 1995, 99, 15798–15805. [Google Scholar] [CrossRef]
  96. Fica-Contreras, S.M.; Charnay, A.P.; Pan, J.; Fayer, M.D. Rethinking Vibrational Stark Spectroscopy: Peak Shifts, Line Widths, and the Role of Non-Stark Solvent Coupling. J. Phys. Chem. B 2023, 127, 717–731. [Google Scholar] [CrossRef] [PubMed]
  97. Sorenson, S.A.; Patrow, J.G.; Dawlaty, J.M. Solvation Reaction Field at the Interface Measured by Vibrational Sum Frequency Generation Spectroscopy. J. Am. Chem. Soc. 2017, 139, 2369–2378. [Google Scholar] [CrossRef]
  98. García Rey, N.; Dlott, D.D. Effects of water on low-overpotential CO2 reduction in ionic liquid studied by sum-frequency generation spectroscopy. Phys. Chem. Chem. Phys. 2017, 19, 10491–10501. [Google Scholar] [CrossRef] [PubMed]
  99. Verma, N.; Tao, Y.; Zou, W.; Chen, X.; Chen, X.; Freindorf, M.; Kraka, E. A Critical Evaluation of Vibrational Stark Effect (VSE) Probes with the Local Vibrational Mode Theory. Sensors 2020, 20, 2358. [Google Scholar] [CrossRef]
  100. Bhattacharyya, D.; Videla, P.E.; Cattaneo, M.; Batista, V.S.; Lian, T.; Kubiak, C.P. Vibrational Stark shift spectroscopy of catalysts under the influence of electric fields at electrode–solution interfaces. Chem. Sci. 2021, 12, 10131–10149. [Google Scholar] [CrossRef] [PubMed]
  101. Ge, A.; Videla, P.E.; Lee, G.L.; Rudshteyn, B.; Song, J.; Kubiak, C.P.; Batista, V.S.; Lian, T. Interfacial Structure and Electric Field Probed by in Situ Electrochemical Vibrational Stark Effect Spectroscopy and Computational Modeling. J. Phys. Chem. C 2017, 121, 18674–18682. [Google Scholar] [CrossRef]
  102. Ong, S.; Zhao, X.; Eisenthal, K.B. Polarization of water molecules at a charged interface: Second harmonic studies of the silica/water interface. Chem. Phys. Lett. 1992, 191, 327–335. [Google Scholar] [CrossRef]
  103. Zhao, X.; Ong, S.; Eisenthal, K.B. Polarization of water molecules at a charged interface. Second harmonic studies of charged monolayers at the air/water interface. Chem. Phys. Lett. 1993, 202, 513–520. [Google Scholar] [CrossRef]
  104. Gonella, G.; Lütgebaucks, C.; de Beer, A.G.F.; Roke, S. Second Harmonic and Sum-Frequency Generation from Aqueous Interfaces Is Modulated by Interference. J. Phys. Chem. C 2016, 120, 9165–9173. [Google Scholar] [CrossRef]
  105. Nagata, Y.; Mukamel, S. Electrical Double Layer Probed by Surface-Specific Vibrational Technique. Chem 2018, 4, 1484–1485. [Google Scholar] [CrossRef]
  106. Dalstein, L.; Chiang, K.-Y.; Wen, Y.-C. Surface Potential at Electrolyte/Air Interfaces: A Quantitative Analysis via Sum-Frequency Vibrational Spectroscopy. J. Phys. Chem. B 2023, 127, 4915–4921. [Google Scholar] [CrossRef]
  107. Ohno, P.E.; Wang, H.-f.; Geiger, F.M. Second-order spectral lineshapes from charged interfaces. Nat. Commun. 2017, 8, 1032. [Google Scholar] [CrossRef]
  108. Wang, H.-F. Sum frequency generation vibrational spectroscopy (SFG-VS) for complex molecular surfaces and interfaces: Spectral lineshape measurement and analysis plus some controversial issues. Prog. Surf. Sci. 2016, 91, 155–182. [Google Scholar] [CrossRef]
  109. Buessler, M.; Maruyama, S.; Zelenka, M.; Onishi, H.; Backus, E.H.G. Unravelling the interfacial water structure at the photocatalyst strontium titanate by sum frequency generation spectroscopy. Phys. Chem. Chem. Phys. 2023, 25, 31471–31480. [Google Scholar] [CrossRef] [PubMed]
  110. Montenegro, A.; Dutta, C.; Mammetkuliev, M.; Shi, H.; Hou, B.; Bhattacharyya, D.; Zhao, B.; Cronin, S.B.; Benderskii, A.V. Asymmetric response of interfacial water to applied electric fields. Nature 2021, 594, 62–65. [Google Scholar] [CrossRef] [PubMed]
  111. Darlington, A.M.; Jarisz, T.A.; DeWalt-Kerian, E.L.; Roy, S.; Kim, S.; Azam, M.S.; Hore, D.K.; Gibbs, J.M. Separating the pH-Dependent Behavior of Water in the Stern and Diffuse Layers with Varying Salt Concentration. J. Phys. Chem. C 2017, 121, 20229–20241. [Google Scholar] [CrossRef]
  112. Seki, T.; Chiang, K.-Y.; Yu, C.-C.; Yu, X.; Okuno, M.; Hunger, J.; Nagata, Y.; Bonn, M. The Bending Mode of Water: A Powerful Probe for Hydrogen Bond Structure of Aqueous Systems. J. Phys. Chem. Lett. 2020, 11, 8459–8469. [Google Scholar] [CrossRef]
  113. Seki, T.; Sun, S.; Zhong, K.; Yu, C.-C.; Machel, K.; Dreier, L.B.; Backus, E.H.G.; Bonn, M.; Nagata, Y. Unveiling Heterogeneity of Interfacial Water through the Water Bending Mode. J. Phys. Chem. Lett. 2019, 10, 6936–6941. [Google Scholar] [CrossRef]
  114. Ohno, P.E.; Saslow, S.A.; Wang, H.-F.; Geiger, F.M.; Eisenthal, K.B. Phase-referenced nonlinear spectroscopy of the α-quartz/water interface. Nat. Commun. 2016, 7, 13587. [Google Scholar] [CrossRef] [PubMed]
  115. Tan, J.; Wang, M.; Zhang, J.; Ye, S. Determination of the Thickness of Interfacial Water by Time-Resolved Sum-Frequency Generation Vibrational Spectroscopy. Langmuir 2023, 39, 18573–18580. [Google Scholar] [CrossRef]
  116. Uddin, M.M.; Azam, M.S.; Hore, D.K. Variable-Angle Surface Spectroscopy Reveals the Water Structure in the Stern Layer at Charged Aqueous Interfaces. J. Am. Chem. Soc. 2024, 146, 11756–11763. [Google Scholar] [CrossRef]
  117. Brown, M.A.; Goel, A.; Abbas, Z. Effect of Electrolyte Concentration on the Stern Layer Thickness at a Charged Interface. Angew. Chem. Int. Ed. 2016, 55, 3790–3794. [Google Scholar] [CrossRef]
  118. Rehl, B.; Ma, E.; Parshotam, S.; DeWalt-Kerian, E.L.; Liu, T.; Geiger, F.M.; Gibbs, J.M. Water Structure in the Electrical Double Layer and the Contributions to the Total Interfacial Potential at Different Surface Charge Densities. J. Am. Chem. Soc. 2022, 144, 16338–16349. [Google Scholar] [CrossRef] [PubMed]
  119. Humbert, C.; Busson, B.; Tadjeddine, A. Enhanced Stability of a Carbon Monoxide Monolayer Adsorbed on Platinum under Electrochemical Control Probed by Sum-Frequency Generation Spectroscopy. J. Phys. Chem. C 2016, 120, 16211–16220. [Google Scholar] [CrossRef]
  120. Xu, P.; von Rueden, A.D.; Schimmenti, R.; Mavrikakis, M.; Suntivich, J. Optical method for quantifying the potential of zero charge at the platinum–water electrochemical interface. Nat. Mater. 2023, 22, 503–510. [Google Scholar] [CrossRef] [PubMed]
  121. Auer, A.; Ding, X.; Bandarenka, A.S.; Kunze-Liebhäuser, J. The Potential of Zero Charge and the Electrochemical Interface Structure of Cu(111) in Alkaline Solutions. J. Phys. Chem. C 2021, 125, 5020–5028. [Google Scholar] [CrossRef] [PubMed]
  122. Mohandas, N.; Bawari, S.; Shibuya, J.J.T.; Ghosh, S.; Mondal, J.; Narayanan, T.N.; Cuesta, A. Understanding electrochemical interfaces through comparing experimental and computational charge density–potential curves. Chem. Sci. 2024, 15, 6643–6660. [Google Scholar] [CrossRef]
  123. Chen, Q.-S.; Solla-Gullón, J.; Sun, S.-G.; Feliu, J.M. The potential of zero total charge of Pt nanoparticles and polycrystalline electrodes with different surface structure: The role of anion adsorption in fundamental electrocatalysis. Electrochim. Acta 2010, 55, 7982–7994. [Google Scholar] [CrossRef]
  124. Cuesta, A. Measurement of the surface charge density of CO-saturated Pt(111) electrodes as a function of potential: The potential of zero charge of Pt(111). Surf. Sci. 2004, 572, 11–22. [Google Scholar] [CrossRef]
  125. Huang, J.; Malek, A.; Zhang, J.; Eikerling, M.H. Non-monotonic Surface Charging Behavior of Platinum: A Paradigm Change. J. Phys. Chem. C 2016, 120, 13587–13595. [Google Scholar] [CrossRef]
  126. Xu, P.; Huang, A.; Suntivich, J. Phase-Sensitive Second-Harmonic Generation of Electrochemical Interfaces. J. Phys. Chem. Lett. 2020, 11, 8216–8221. [Google Scholar] [CrossRef] [PubMed]
  127. Sebastián-Pascual, P.; Sarabia, F.J.; Climent, V.; Feliu, J.M.; Escudero-Escribano, M. Elucidating the Structure of the Cu-Alkaline Electrochemical Interface with the Laser-Induced Temperature Jump Method. J. Phys. Chem. C 2020, 124, 23253–23259. [Google Scholar] [CrossRef]
  128. Ding, X.; Sarpey, T.K.; Hou, S.; Garlyyev, B.; Li, W.; Fischer, R.A.; Bandarenka, A.S. Prospects of Using the Laser-Induced Temperature Jump Techniques for Characterisation of Electrochemical Systems. ChemElectroChem 2022, 9, e202101175. [Google Scholar] [CrossRef]
  129. Ledezma-Yanez, I.; Wallace, W.D.Z.; Sebastián-Pascual, P.; Climent, V.; Feliu, J.M.; Koper, M.T.M. Interfacial water reorganization as a pH-dependent descriptor of the hydrogen evolution rate on platinum electrodes. Nat. Energy 2017, 2, 17031. [Google Scholar] [CrossRef]
  130. Ganassin, A.; Sebastián, P.; Climent, V.; Schuhmann, W.; Bandarenka, A.S.; Feliu, J. On the pH Dependence of the Potential of Maximum Entropy of Ir(111) Electrodes. Sci. Rep. 2017, 7, 1246. [Google Scholar] [CrossRef]
  131. Rebollar, L.; Intikhab, S.; Zhang, S.; Deng, H.; Zeng, Z.; Snyder, J.D.; Tang, M.H. On the relationship between potential of zero charge and solvent dynamics in the reversible hydrogen electrode. J. Catal. 2021, 398, 161–170. [Google Scholar] [CrossRef]
  132. Attard, G.A.; Ahmadi, A. Anion—Surface interactions Part 3. N2O reduction as a chemical probe of the local potential of zero total charge. J. Electroanal. Chem. 1995, 389, 175–190. [Google Scholar] [CrossRef]
  133. Zhao, X.; Ong, S.; Wang, H.; Eisenthal, K.B. New method for determination of surface pKa using second harmonic generation. Chem. Phys. Lett. 1993, 214, 203–207. [Google Scholar] [CrossRef]
  134. Gragson, D.E.; McCarty, B.M.; Richmond, G.L. Ordering of Interfacial Water Molecules at the Charged Air/Water Interface Observed by Vibrational Sum Frequency Generation. J. Am. Chem. Soc. 1997, 119, 6144–6152. [Google Scholar] [CrossRef]
  135. Vodopyanov, K.L. Mid-IR by Nonlinear Optical Frequency Conversion. In Laser-Based Mid-Infrared Sources and Applications; Wiley: Hoboken, NJ, USA, 2020; pp. 109–188. [Google Scholar]
  136. Boyd, R.W. Nonlinear Optics, 4th ed.; Elsevier Science: Amsterdam, The Netherlands, 2020; p. 634. [Google Scholar]
  137. Vidal, F.; Tadjeddine, A. Sum-frequency generation spectroscopy of interfaces. Rep. Prog. Phys. 2005, 68, 1095. [Google Scholar] [CrossRef]
  138. Tadjeddine, A.; Vidal, F. Chapter 9—Vibrational and Electronic Spectroscopic Investigation of the Electrochemical Interface using IR-Visible Sum-Frequency Generation and Related Nonlinear Optical Techniques. In In-Situ Spectroscopic Studies of Adsorption at the Electrode and Electrocatalysis; Sun, S.-G., Christensen, P.A., Wieckowski, A., Eds.; Elsevier Science, B.V.: Amsterdam, The Netherlands, 2007; pp. 273–298. [Google Scholar]
  139. Richter, L.J.; Petralli-Mallow, T.P.; Stephenson, J.C. Vibrationally resolved sum-frequency generation with broad-bandwidth infrared pulses. Opt. Lett. 1998, 23, 1594–1596. [Google Scholar] [CrossRef] [PubMed]
  140. Ji, N.; Ostroverkhov, V.; Chen, C.-Y.; Shen, Y.-R. Phase-Sensitive Sum-Frequency Vibrational Spectroscopy and Its Application to Studies of Interfacial Alkyl Chains. J. Am. Chem. Soc. 2007, 129, 10056–10057. [Google Scholar] [CrossRef] [PubMed]
  141. Yamaguchi, S.; Tahara, T. Heterodyne-detected electronic sum frequency generation: “Up” versus “down” alignment of interfacial molecules. J. Chem. Phys. 2008, 129, 101102. [Google Scholar] [CrossRef]
  142. Nihonyanagi, S.; Yamaguchi, S.; Tahara, T. Direct evidence for orientational flip-flop of water molecules at charged interfaces: A heterodyne-detected vibrational sum frequency generation study. J. Chem. Phys. 2009, 130, 204704. [Google Scholar] [CrossRef] [PubMed]
  143. Perakis, F.; De Marco, L.; Shalit, A.; Tang, F.; Kann, Z.R.; Kühne, T.D.; Torre, R.; Bonn, M.; Nagata, Y. Vibrational Spectroscopy and Dynamics of Water. Chem. Rev. 2016, 116, 7590–7607. [Google Scholar] [CrossRef] [PubMed]
  144. Li, X.; Rupprechter, G. Sum frequency generation (SFG) spectroscopy at surfaces and interfaces: Adsorbate structure and molecular bond orientation. Surf. Sci. Rep. 2024, 79, 100645. [Google Scholar] [CrossRef]
  145. Shen, Y.-R. Second Harmonic and Sum-Frequency Spectroscopy; World Scientific Publishing: London, UK, 2023. [Google Scholar]
  146. Gardner, A.M.; Saeed, K.H.; Cowan, A.J. Vibrational sum-frequency generation spectroscopy of electrode surfaces: Studying the mechanisms of sustainable fuel generation and utilisation. Phys. Chem. Chem. Phys. 2019, 21, 12067–12086. [Google Scholar] [CrossRef] [PubMed]
  147. Tang, F.; Seki, T.; Yu, C.-C.; Nagata, Y. Microscopic Structure of Ice Surface Viewed through Sum Frequency Generation Spectroscopy. In Chemistry in the Cryosphere; World Scientific Publishing: London, UK, 2022; pp. 139–171. [Google Scholar]
  148. Guyot-Sionnest, P.; Tadjeddine, A. Spectroscopic investigations of adsorbates at the metal—Electrolyte interface using sum frequency generation. Chem. Phys. Lett. 1990, 172, 341–345. [Google Scholar] [CrossRef]
  149. Hahn, D. Calcium Fluoride and Barium Fluoride Crystals in Optics. Opt. Photonik 2014, 9, 45–48. [Google Scholar] [CrossRef]
  150. Nguyen, T.D.; Dao, T.P.D. Analytical Chemistry, Questions and Problems in Ionic Equilibrium in Aqueous Solutions; Hanoi National University of Education Publishers: Hanoi, Vietnam, 2005; p. 363. [Google Scholar]
  151. Miessler, G.L.; Fischer, P.J.; Tarr, D.A. Inorganic Chemistry, 5th ed.; Pearson: Boston, MA, USA, 2021; pp. xiv, 682p. [Google Scholar]
  152. León, L.; Mozo, J.D. Designing spectroelectrochemical cells: A review. TrAC Trends Anal. Chem. 2018, 102, 147–169. [Google Scholar] [CrossRef]
  153. Li, C.-Y.; Tian, Z.-Q. Sixty years of electrochemical optical spectroscopy: A retrospective. Chem. Soc. Rev. 2024, 53, 3579–3605. [Google Scholar] [CrossRef] [PubMed]
  154. Ge, A.; Inoue, K.-I.; Ye, S. Probing the electrode–solution interfaces in rechargeable batteries by sum-frequency generation spectroscopy. J. Chem. Phys. 2020, 153, 170902. [Google Scholar] [CrossRef]
  155. Beden, B.; Lamy, C.; Bewick, A.; Kunimatsu, K. Electrosorption of methanol on a platinum electrode. IR spectroscopic evidence for adsorbed CO species. J. Electroanal. Chem. Interfacial Electrochem. 1981, 121, 343–347. [Google Scholar] [CrossRef]
  156. Furuya, N.; Motto, S.; Kunimatsu, K. Vibrational spectroscopy on platinum single-crystal electrodes: Part, I. In-situ infrared spectroscopic studies of the adsorption and oxidation of CO on Pt (111) in sulphuric acid. J. Electroanal. Chem. Interfacial Electrochem. 1988, 239, 347–360. [Google Scholar] [CrossRef]
  157. Wallentine, S.; Bandaranayake, S.; Biswas, S.; Baker, L.R. Plasmon-Resonant Vibrational Sum Frequency Generation of Electrochemical Interfaces: Direct Observation of Carbon Dioxide Electroreduction on Gold. J. Phys. Chem. A 2020, 124, 8057–8064. [Google Scholar] [CrossRef]
  158. Liu, W.-T.; Shen, Y.R. In situ sum-frequency vibrational spectroscopy of electrochemical interfaces with surface plasmon resonance. J. Chem. Phys. 2014, 111, 1293–1297. [Google Scholar] [CrossRef]
  159. Noguchi, H.; Okada, T.; Uosaki, K. Molecular structure at electrode/electrolyte solution interfaces related to electrocatalysis. Faraday Discuss. 2009, 140, 125–137. [Google Scholar] [CrossRef]
  160. Horowitz, Y.; Han, H.-L.; Soto, F.A.; Ralston, W.T.; Balbuena, P.B.; Somorjai, G.A. Fluoroethylene Carbonate as a Directing Agent in Amorphous Silicon Anodes: Electrolyte Interface Structure Probed by Sum Frequency Vibrational Spectroscopy and Ab Initio Molecular Dynamics. Nano Lett. 2018, 18, 1145–1151. [Google Scholar] [CrossRef] [PubMed]
  161. Chen, Y.X.; Miki, A.; Ye, S.; Sakai, H.; Osawa, M. Formate, an Active Intermediate for Direct Oxidation of Methanol on Pt Electrode. J. Am. Chem. Soc. 2003, 125, 3680–3681. [Google Scholar] [CrossRef]
  162. De, R.; Dietzek-Ivanšić, B. A Happy Get-Together—Probing Electrochemical Interfaces by Non-Linear Vibrational Spectroscopy. Chem. Eur. J. 2022, 28, e202200407. [Google Scholar] [CrossRef]
  163. Han, H.L.; Horowitz, Y.; Somorjai, G.A. A Review on In Situ Sum Frequency Generation Vibrational Spectroscopy Studies of Liquid–Solid Interfaces in Electrochemical Systems. In Encyclopedia of Interfacial Chemistry; Wandelt, K., Ed.; Elsevier: Oxford, UK, 2018; pp. 1–12. [Google Scholar]
  164. Iwahashi, T.; Miwa, Y.; Zhou, W.; Sakai, Y.; Yamagata, M.; Ishikawa, M.; Kim, D.; Ouchi, Y. IV-SFG studies on the effect of Li+ in extending the electrochemical window at the Pt|[C2mim][FSA] interface. Electrochem. Commun. 2016, 72, 54–58. [Google Scholar] [CrossRef]
  165. Zhou, W.; Xu, Y.; Ouchi, Y. Hysteresis Effects in the In Situ SFG and Differential Capacitance Measurements on Metal Electrode/Ionic Liquids Interface. ECS Trans. 2013, 50, 339. [Google Scholar] [CrossRef]
  166. Zhou, W.; Inoue, S.; Iwahashi, T.; Kanai, K.; Seki, K.; Miyamae, T.; Kim, D.; Katayama, Y.; Ouchi, Y. Electrochemical Double-Layer Structure of Pt Electrode/Ionic Liquids Interface Studied by in situ IR-visible Sum Frequency Generation Spectroscopy. ECS Trans. 2009, 16, 545. [Google Scholar] [CrossRef]
  167. Baldelli, S. Surface Structure at the Ionic Liquid−Electrified Metal Interface. Acc. Chem. Res. 2008, 41, 421–431. [Google Scholar] [CrossRef] [PubMed]
  168. Sakhtemanian, L.; Duwadi, A.; Baldelli, S.; Ghatee, M.H. Simulating the ionic liquid mixing with organic-solvent clarifies the mixture’s SFG spectral behavior and the specific surface region originating SFG. Sci. Rep. 2024, 14, 23220. [Google Scholar] [CrossRef] [PubMed]
  169. Chowdhury, A.U.; Muralidharan, N.; Daniel, C.; Amin, R.; Belharouak, I. Probing the electrolyte/electrode interface with vibrational sum frequency generation spectroscopy: A review. J. Power Sources 2021, 506, 230173. [Google Scholar] [CrossRef]
  170. Horowitz, Y.; Han, H.-L.; Ross, P.N.; Somorjai, G.A. In Situ Potentiodynamic Analysis of the Electrolyte/Silicon Electrodes Interface Reactions—A Sum Frequency Generation Vibrational Spectroscopy Study. J. Am. Chem. Soc. 2016, 138, 726–729. [Google Scholar] [CrossRef]
  171. Mukherjee, P.; Lagutchev, A.; Dlott, D.D. In Situ Probing of Solid-Electrolyte Interfaces with Nonlinear Coherent Vibrational Spectroscopy. J. Electrochem. Soc. 2012, 159, A244. [Google Scholar] [CrossRef]
  172. Björneholm, O.; Hansen, M.H.; Hodgson, A.; Liu, L.-M.; Limmer, D.T.; Michaelides, A.; Pedevilla, P.; Rossmeisl, J.; Shen, H.; Tocci, G.; et al. Water at Interfaces. Chem. Rev. 2016, 116, 7698–7726. [Google Scholar] [CrossRef] [PubMed]
  173. Wu, J. Understanding the Electric Double-Layer Structure, Capacitance, and Charging Dynamics. Chem. Rev. 2022, 122, 10821–10859. [Google Scholar] [CrossRef] [PubMed]
  174. Chen, S.-H.; Singer, S.J. Molecular Dynamics Study of the Electric Double Layer and Nonlinear Spectroscopy at the Amorphous Silica–Water Interface. J. Phys. Chem. B 2019, 123, 6364–6384. [Google Scholar] [CrossRef] [PubMed]
  175. Joutsuka, T.; Morita, A. Electrolyte and Temperature Effects on Third-Order Susceptibility in Sum-Frequency Generation Spectroscopy of Aqueous Salt Solutions. J. Phys. Chem. C 2018, 122, 11407–11413. [Google Scholar] [CrossRef]
  176. Groß, A.; Sakong, S. Ab Initio Simulations of Water/Metal Interfaces. Chem. Rev. 2022, 122, 10746–10776. [Google Scholar] [CrossRef]
  177. Magnussen, O.M.; Groß, A. Toward an Atomic-Scale Understanding of Electrochemical Interface Structure and Dynamics. J. Am. Chem. Soc. 2019, 141, 4777–4790. [Google Scholar] [CrossRef]
  178. Ishiyama, T.; Imamura, T.; Morita, A. Theoretical Studies of Structures and Vibrational Sum Frequency Generation Spectra at Aqueous Interfaces. Chem. Rev. 2014, 114, 8447–8470. [Google Scholar] [CrossRef] [PubMed]
  179. Litman, Y.; Lan, J.; Nagata, Y.; Wilkins, D.M. Fully First-Principles Surface Spectroscopy with Machine Learning. J. Phys. Chem. Lett. 2023, 14, 8175–8182. [Google Scholar] [CrossRef] [PubMed]
  180. Ungerer, M.J.; Santos-Carballal, D.; Cadi-Essadek, A.; van Sittert, C.G.C.E.; de Leeuw, N.H. Interaction of H2O with the Platinum Pt(001), (011), and (111) Surfaces: A Density Functional Theory Study with Long-Range Dispersion Corrections. J. Phys. Chem. C 2019, 123, 27465–27476. [Google Scholar] [CrossRef] [PubMed]
  181. Schwarz, K.; Sundararaman, R. The electrochemical interface in first-principles calculations. Surf. Sci. Rep. 2020, 75, 100492. [Google Scholar] [CrossRef]
  182. Olivieri, J.-F.; Hynes, J.T.; Laage, D. Water dynamics and sum-frequency generation spectra at electrode/aqueous electrolyte interfaces. Faraday Discuss. 2024, 249, 289–302. [Google Scholar] [CrossRef] [PubMed]
  183. Souna, A.J.; Motevaselian, M.H.; Polster, J.W.; Tran, J.D.; Siwy, Z.S.; Aluru, N.R.; Fourkas, J.T. Beyond the electrical double layer model: Ion-dependent effects in nanoscale solvent organization. Phys. Chem. Chem. Phys. 2024, 26, 6726–6735. [Google Scholar] [CrossRef]
  184. Sulpizi, M.; Salanne, M.; Sprik, M.; Gaigeot, M.-P. Vibrational Sum Frequency Generation Spectroscopy of the Water Liquid–Vapor Interface from Density Functional Theory-Based Molecular Dynamics Simulations. J. Phys. Chem. Lett. 2013, 4, 83–87. [Google Scholar] [CrossRef]
  185. Khatib, R.; Backus, E.H.G.; Bonn, M.; Perez-Haro, M.-J.; Gaigeot, M.-P.; Sulpizi, M. Water orientation and hydrogen-bond structure at the fluorite/water interface. Sci. Rep. 2016, 6, 24287. [Google Scholar] [CrossRef]
  186. Li, X.; Brigiano, F.S.; Pezzotti, S.; Liu, X.; Chen, W.; Chen, H.; Li, Y.; Li, H.; Lin, X.; Zheng, W.; et al. Unconventional structural evolution of an oxide surface in water unveiled by in situ sum-frequency spectroscopy. Nat. Chem. 2024. [Google Scholar] [CrossRef]
  187. Pezzotti, S.; Galimberti, D.R.; Shen, Y.R.; Gaigeot, M.P. Structural definition of the BIL and DL: A new universal methodology to rationalize non-linear χ(2)(ω) SFG signals at charged interfaces, including χ(3)(ω) contributions. Phys. Chem. Chem. Phys. 2018, 20, 5190–5199. [Google Scholar] [CrossRef]
  188. Verreault, D.; Kurz, V.; Howell, C.; Koelsch, P. Sample cells for probing solid/liquid interfaces with broadband sum-frequency-generation spectroscopy. Rev. Sci. Instrum. 2010, 81, 063111. [Google Scholar] [CrossRef]
  189. Becraft, K.A.; Richmond, G.L. In Situ Vibrational Spectroscopic Studies of the CaF2/H2O Interface. Langmuir 2001, 17, 7721–7724. [Google Scholar] [CrossRef]
  190. Becraft, K.A.; Moore, F.G.; Richmond, G.L. In-situ spectroscopic investigations of surfactant adsorption and water structure at the CaF2/aqueous solution interface. Phys. Chem. Chem. Phys. 2004, 6, 1880–1889. [Google Scholar] [CrossRef]
  191. Schrödle, S.; Moore, F.G.; Richmond, G.L. Surface Speciation at Solid/Liquid Interfaces:  A Vibrational Sum-Frequency Study of Acetate Adsorption at the Fluorite/Water Interface. J. Phys. Chem. C 2007, 111, 10088–10094. [Google Scholar] [CrossRef]
  192. Ober, P.; Boon, W.Q.; Dijkstra, M.; Backus, E.H.G.; van Roij, R.; Bonn, M. Liquid flow reversibly creates a macroscopic surface charge gradient. Nat. Commun. 2021, 12, 4102. [Google Scholar] [CrossRef] [PubMed]
  193. Lis, D.; Backus, E.H.G.; Hunger, J.; Parekh, S.H.; Bonn, M. Liquid flow along a solid surface reversibly alters interfacial chemistry. Science 2014, 344, 1138–1142. [Google Scholar] [CrossRef] [PubMed]
  194. Lesnicki, D.; Zhang, Z.; Bonn, M.; Sulpizi, M.; Backus, E.H.G. Surface Charges at the CaF2/Water Interface Allow Very Fast Intermolecular Vibrational-Energy Transfer. Angew. Chem. Int. Ed. 2020, 59, 13116–13121. [Google Scholar] [CrossRef] [PubMed]
  195. Shen, Y.R.; Ostroverkhov, V. Sum-Frequency Vibrational Spectroscopy on Water Interfaces:  Polar Orientation of Water Molecules at Interfaces. Chem. Rev. 2006, 106, 1140–1154. [Google Scholar] [CrossRef] [PubMed]
  196. Ostroverkhov, V.; Waychunas, G.A.; Shen, Y.R. New Information on Water Interfacial Structure Revealed by Phase-Sensitive Surface Spectroscopy. Phys. Rev. Lett. 2005, 94, 046102. [Google Scholar] [CrossRef] [PubMed]
  197. Myalitsin, A.; Urashima, S.-H.; Nihonyanagi, S.; Yamaguchi, S.; Tahara, T. Water Structure at the Buried Silica/Aqueous Interface Studied by Heterodyne-Detected Vibrational Sum-Frequency Generation. J. Phys. Chem. C 2016, 120, 9357–9363. [Google Scholar] [CrossRef]
  198. Urashima, S.-h.; Myalitsin, A.; Nihonyanagi, S.; Tahara, T. The Topmost Water Structure at a Charged Silica/Aqueous Interface Revealed by Heterodyne-Detected Vibrational Sum Frequency Generation Spectroscopy. J. Phys. Chem. Lett. 2018, 9, 4109–4114. [Google Scholar] [CrossRef] [PubMed]
  199. Ostroverkhov, V.; Waychunas, G.A.; Shen, Y.R. Vibrational spectra of water at water/α-quartz (0001) interface. Chem. Phys. Lett. 2004, 386, 144–148. [Google Scholar] [CrossRef]
  200. Du, Q.; Freysz, E.; Shen, Y.R. Vibrational spectra of water molecules at quartz/water interfaces. Phys. Rev. Lett. 1994, 72, 238–241. [Google Scholar] [CrossRef] [PubMed]
  201. Dalstein, L.; Potapova, E.; Tyrode, E. The elusive silica/water interface: Isolated silanols under water as revealed by vibrational sum frequency spectroscopy. Phys. Chem. Chem. Phys. 2017, 19, 10343–10349. [Google Scholar] [CrossRef]
  202. Yeganeh, M.S.; Dougal, S.M.; Pink, H.S. Vibrational Spectroscopy of Water at Liquid/Solid Interfaces: Crossing the Isoelectric Point of a Solid Surface. Phys. Rev. Lett. 1999, 83, 1179–1182. [Google Scholar] [CrossRef]
  203. Zhang, L.; Tian, C.; Waychunas, G.A.; Shen, Y.R. Structures and Charging of α-Alumina (0001)/Water Interfaces Studied by Sum-Frequency Vibrational Spectroscopy. J. Am. Chem. Soc. 2008, 130, 7686–7694. [Google Scholar] [CrossRef]
  204. Kataoka, S.; Gurau, M.C.; Albertorio, F.; Holden, M.A.; Lim, S.-M.; Yang, R.D.; Cremer, P.S. Investigation of Water Structure at the TiO2/Aqueous Interface. Langmuir 2004, 20, 1662–1666. [Google Scholar] [CrossRef]
  205. Schlegel, S.J.; Hosseinpour, S.; Gebhard, M.; Devi, A.; Bonn, M.; Backus, E.H.G. How water flips at charged titanium dioxide: An SFG-study on the water–TiO2 interface. Phys. Chem. Chem. Phys. 2019, 21, 8956–8964. [Google Scholar] [CrossRef]
  206. Hosseinpour, S.; Tang, F.; Wang, F.; Livingstone, R.A.; Schlegel, S.J.; Ohto, T.; Bonn, M.; Nagata, Y.; Backus, E.H.G. Chemisorbed and Physisorbed Water at the TiO2/Water Interface. J. Phys. Chem. Lett. 2017, 8, 2195–2199. [Google Scholar] [CrossRef] [PubMed]
  207. Tuladhar, A.; Chase, Z.A.; Baer, M.D.; Legg, B.A.; Tao, J.; Zhang, S.; Winkelman, A.D.; Wang, Z.; Mundy, C.J.; De Yoreo, J.J.; et al. Direct Observation of the Orientational Anisotropy of Buried Hydroxyl Groups inside Muscovite Mica. J. Am. Chem. Soc. 2019, 141, 2135–2142. [Google Scholar] [CrossRef] [PubMed]
  208. Nihonyanagi, S.; Yamaguchi, S.; Tahara, T. Water Hydrogen Bond Structure near Highly Charged Interfaces Is Not Like Ice. J. Am. Chem. Soc. 2010, 132, 6867–6869. [Google Scholar] [CrossRef] [PubMed]
  209. Dutta, C.; Mammetkuliyev, M.; Benderskii, A.V. Re-orientation of water molecules in response to surface charge at surfactant interfaces. J. Chem. Phys. 2019, 151, 034703. [Google Scholar] [CrossRef]
  210. Wen, Y.-C.; Zha, S.; Tian, C.; Shen, Y.R. Surface pH and Ion Affinity at the Alcohol-Monolayer/Water Interface Studied by Sum-Frequency Spectroscopy. J. Phys. Chem. C 2016, 120, 15224–15229. [Google Scholar] [CrossRef]
  211. Mondal, J.A.; Nihonyanagi, S.; Yamaguchi, S.; Tahara, T. Structure and Orientation of Water at Charged Lipid Monolayer/Water Interfaces Probed by Heterodyne-Detected Vibrational Sum Frequency Generation Spectroscopy. J. Am. Chem. Soc. 2010, 132, 10656–10657. [Google Scholar] [CrossRef]
  212. Mondal, J.A.; Nihonyanagi, S.; Yamaguchi, S.; Tahara, T. Three Distinct Water Structures at a Zwitterionic Lipid/Water Interface Revealed by Heterodyne-Detected Vibrational Sum Frequency Generation. J. Am. Chem. Soc. 2012, 134, 7842–7850. [Google Scholar] [CrossRef]
  213. Chen, X.; Hua, W.; Huang, Z.; Allen, H.C. Interfacial Water Structure Associated with Phospholipid Membranes Studied by Phase-Sensitive Vibrational Sum Frequency Generation Spectroscopy. J. Am. Chem. Soc. 2010, 132, 11336–11342. [Google Scholar] [CrossRef] [PubMed]
  214. Sovago, M.; Vartiainen, E.; Bonn, M. Observation of buried water molecules in phospholipid membranes by surface sum-frequency generation spectroscopy. J. Chem. Phys. 2009, 131, 161107. [Google Scholar] [CrossRef]
  215. Jubb, A.M.; Hua, W.; Allen, H.C. Environmental Chemistry at Vapor/Water Interfaces: Insights from Vibrational Sum Frequency Generation Spectroscopy. Annu. Rev. Phys. Chem. 2012, 63, 107–130. [Google Scholar] [CrossRef]
  216. Trasatti, S. Electrochemical Theory | Oxygen Evolution. In Encyclopedia of Electrochemical Power Sources; Garche, J., Ed.; Elsevier: Amsterdam, The Netherlands, 2009; pp. 49–55. [Google Scholar]
  217. Philipossian, A.; Mustapha, L. Tribological Attributes of Post-CMP Brush Scrubbing. J. Electrochem. Soc. 2004, 151, G456. [Google Scholar] [CrossRef]
  218. Brinker, C.J. Hydrolysis and condensation of silicates: Effects on structure. J. Non-Cryst. Solids 1988, 100, 31–50. [Google Scholar] [CrossRef]
  219. Kang, X.; Chatzitakis, A.; Aarholt, T.; Sun, X.; Negri, C.; Norby, T. Facet-engineered TiO2 nanomaterials reveal the role of water–oxide interactions in surface protonic conduction. J. Mater. Chem. A 2022, 10, 218–227. [Google Scholar] [CrossRef]
  220. Huang, L.; Gubbins, K.E.; Li, L.; Lu, X. Water on Titanium Dioxide Surface: A Revisiting by Reactive Molecular Dynamics Simulations. Langmuir 2014, 30, 14832–14840. [Google Scholar] [CrossRef] [PubMed]
  221. Fasulo, F.; Piccini, G.; Muñoz-García, A.B.; Pavone, M.; Parrinello, M. Dynamics of Water Dissociative Adsorption on TiO2 Anatase (101) at Monolayer Coverage and Below. J. Phys. Chem. C 2022, 126, 15752–15758. [Google Scholar] [CrossRef]
  222. Wu, C.-Y.; Tu, K.-J.; Deng, J.-P.; Lo, Y.-S.; Wu, C.-H. Markedly Enhanced Surface Hydroxyl Groups of TiO2 Nanoparticles with Superior Water-Dispersibility for Photocatalysis. Materials 2017, 10, 566. [Google Scholar] [CrossRef]
  223. Hanawa, T. Biofunctionalization of Metallic Materials: Creation of Biosis–Abiosis Intelligent Interface. In Proceedings of the Interface Oral Health Science, Tokyo, Japan, 20–21 January 2014; pp. 53–64. [Google Scholar]
  224. Lai, L.; Lei, E.; Hu, C.; Zhao, D.; Zhao, W.; Guo, Z.; Huang, D. A facile hydrothermal synthesis and properties of TiO2 nanosheet array films. Mater. Res. Express 2020, 7, 015053. [Google Scholar] [CrossRef]
  225. Schultz, M.J.; Baldelli, S.; Schnitzer, C.; Simonelli, D. Aqueous Solution/Air Interfaces Probed with Sum Frequency Generation Spectroscopy. J. Phys. Chem. B 2002, 106, 5313–5324. [Google Scholar] [CrossRef] [PubMed]
  226. Litman, Y.; Chiang, K.-Y.; Seki, T.; Nagata, Y.; Bonn, M. Surface stratification determines the interfacial water structure of simple electrolyte solutions. Nat. Chem. 2024, 16, 644–650. [Google Scholar] [CrossRef] [PubMed]
  227. Nihonyanagi, S.; Ishiyama, T.; Lee, T.-k.; Yamaguchi, S.; Bonn, M.; Morita, A.; Tahara, T. Unified Molecular View of the Air/Water Interface Based on Experimental and Theoretical χ(2) Spectra of an Isotopically Diluted Water Surface. J. Am. Chem. Soc. 2011, 133, 16875–16880. [Google Scholar] [CrossRef]
  228. Smit, W.J.; Tang, F.; Nagata, Y.; Sánchez, M.A.; Hasegawa, T.; Backus, E.H.G.; Bonn, M.; Bakker, H.J. Observation and Identification of a New OH Stretch Vibrational Band at the Surface of Ice. J. Phys. Chem. Lett. 2017, 8, 3656–3660. [Google Scholar] [CrossRef] [PubMed]
  229. Gaigeot, M.-P.; Sprik, M.; Sulpizi, M. Oxide/water interfaces: How the surface chemistry modifies interfacial water properties. J. Phys. Condens. Matter 2012, 24, 124106. [Google Scholar] [CrossRef]
  230. Isaienko, O.; Borguet, E. Hydrophobicity of Hydroxylated Amorphous Fused Silica Surfaces. Langmuir 2013, 29, 7885–7895. [Google Scholar] [CrossRef] [PubMed]
  231. Wang, C.-y.; Groenzin, H.; Shultz, M.J. Molecular Species on Nanoparticulate Anatase TiO2 Film Detected by Sum Frequency Generation:  Trace Hydrocarbons and Hydroxyl Groups. Langmuir 2003, 19, 7330–7334. [Google Scholar] [CrossRef]
  232. Yu, C.-C.; Chiang, K.-Y.; Okuno, M.; Seki, T.; Ohto, T.; Yu, X.; Korepanov, V.; Hamaguchi, H.-o.; Bonn, M.; Hunger, J.; et al. Vibrational couplings and energy transfer pathways of water’s bending mode. Nat. Commun. 2020, 11, 5977. [Google Scholar] [CrossRef]
  233. Chen, L.; Qian, L. Role of interfacial water in adhesion, friction, and wear—A critical review. Friction 2021, 9, 1–28. [Google Scholar] [CrossRef]
  234. Spasojevic, I.; Verdaguer, A.; Catalan, G.; Domingo, N. Effect of Humidity on the Writing Speed and Domain Wall Dynamics of Ferroelectric Domains. Adv. Electron. Mater. 2022, 8, 2100650. [Google Scholar] [CrossRef]
  235. Lovering, K.A.; Bertram, A.K.; Chou, K.C. New Information on the Ion-Identity-Dependent Structure of Stern Layer Revealed by Sum Frequency Generation Vibrational Spectroscopy. J. Phys. Chem. C 2016, 120, 18099–18104. [Google Scholar] [CrossRef]
  236. Sakhtemanian, L.; Dashti, N.; Ghatee, M.H. A singular behavior at the electrolytes solution surfaces: Experimental and simulation investigation over an extended range of temperature. Fluid Phase Equilibria 2022, 555, 113347. [Google Scholar] [CrossRef]
  237. Parshotam, S.; Rehl, B.; Busse, F.; Brown, A.; Gibbs, J.M. Influence of the Hydrogen-Bonding Environment on Vibrational Coupling in the Electrical Double Layer at the Silica/Aqueous Interface. J. Phys. Chem. C 2022, 126, 21734–21744. [Google Scholar] [CrossRef]
  238. Peremans, A.; Tadjeddine, A. Electrochemical deposition of hydrogen on platinum single crystals studied by infrared-visible sum-frequency generation. J. Chem. Phys. 1995, 103, 7197–7203. [Google Scholar] [CrossRef]
  239. Zheng, W.; Tadjeddine, A. Adsorption processes and structure of water molecules on Pt(110) electrodes in perchloric solutions. J. Chem. Phys. 2003, 119, 13096–13099. [Google Scholar] [CrossRef]
  240. Zheng, W.Q.; Pluchery, O.; Tadjeddine, A. SFG study of platinum electrodes in perchloric acid solutions. Surf. Sci. 2002, 502–503, 490–497. [Google Scholar] [CrossRef]
  241. Piontek, S.M.; Naujoks, D.; Tabassum, T.; DelloStritto, M.J.; Jaugstetter, M.; Hosseini, P.; Corva, M.; Ludwig, A.; Tschulik, K.; Klein, M.L.; et al. Probing the Gold/Water Interface with Surface-Specific Spectroscopy. ACS Phys. Chem. Au 2023, 3, 119–129. [Google Scholar] [CrossRef]
  242. Backus, E.H.G.; Garcia-Araez, N.; Bonn, M.; Bakker, H.J. On the Role of Fresnel Factors in Sum-Frequency Generation Spectroscopy of Metal–Water and Metal-Oxide–Water Interfaces. J. Phys. Chem. C 2012, 116, 23351–23361. [Google Scholar] [CrossRef]
  243. Ye, S.; Nihonyanagi, S.; Fujishima, K.; Uosaki, K. Conformational Order of Octadecanethiol (ODT) Monolayer at Gold/Solution Interface: Internal Reflection Sum Frequency Generation (SFG) Study. In Studies in Surface Science and Catalysis; Iwasawa, Y., Oyama, N., Kunieda, H., Eds.; Elsevier: Amsterdam, The Netherlands, 2001; Volume 132, pp. 705–710. [Google Scholar]
  244. Liu, Z.; Li, Y.; Xu, Q.; Wang, H.; Liu, W.-T. Coherent Vibrational Spectroscopy of Electrochemical Interfaces with Plasmonic Nanogratings. J. Phys. Chem. Lett. 2020, 11, 243–248. [Google Scholar] [CrossRef]
  245. Nihonyanagi, S.; Ye, S.; Uosaki, K.; Dreesen, L.; Humbert, C.; Thiry, P.; Peremans, A. Potential-dependent structure of the interfacial water on the gold electrode. Surf. Sci. 2004, 573, 11–16. [Google Scholar] [CrossRef]
  246. Wang, W.; Fang, J.; Huang, X. Different behaviors between interband and intraband transitions generated hot carriers on g-C3N4/Au for photocatalytic H2 production. Appl. Surf. Sci. 2020, 513, 145830. [Google Scholar] [CrossRef]
  247. Schultz, Z.D.; Shaw, S.K.; Gewirth, A.A. Potential Dependent Organization of Water at the Electrified Metal−Liquid Interface. J. Am. Chem. Soc. 2005, 127, 15916–15922. [Google Scholar] [CrossRef] [PubMed]
  248. Petek, H.; Zhao, J. Ultrafast Interfacial Proton-Coupled Electron Transfer. Chem. Rev. 2010, 110, 7082–7099. [Google Scholar] [CrossRef]
  249. Noguchi, H.; Okada, T.; Uosaki, K. SFG study on potential-dependent structure of water at Pt electrode/electrolyte solution interface. Electrochim. Acta 2008, 53, 6841–6844. [Google Scholar] [CrossRef]
  250. Morgenstern, M.; Michely, T.; Comsa, G. Anisotropy in the adsorption of H2O at low coordination sites on Pt(111). Phys. Rev. Lett. 1996, 77, 703–706. [Google Scholar] [CrossRef] [PubMed]
  251. Ikemiya, N.; Gewirth, A.A. Initial stages of water adsorption on Au surfaces. J. Am. Chem. Soc. 1997, 119, 9919–9920. [Google Scholar] [CrossRef]
  252. Lagutchev, A.; Hambir, S.A.; Dlott, D.D. Nonresonant Background Suppression in Broadband Vibrational Sum-Frequency Generation Spectroscopy. J. Phys. Chem. C 2007, 111, 13645–13647. [Google Scholar] [CrossRef]
  253. Lagutchev, A.; Lozano, A.; Mukherjee, P.; Hambir, S.A.; Dlott, D.D. Compact broadband vibrational sum-frequency generation spectrometer with nonresonant suppression. Spectrochim. Acta Part A Mol. Biomol. Spectrosc. 2010, 75, 1289–1296. [Google Scholar] [CrossRef] [PubMed]
  254. Tong, Y.; Lapointe, F.; Thämer, M.; Wolf, M.; Campen, R.K. Hydrophobic Water Probed Experimentally at the Gold Electrode/Aqueous Interface. Angew. Chem. Int. Ed. 2017, 56, 4211–4214. [Google Scholar] [CrossRef]
  255. Dreier, L.B.; Liu, Z.; Narita, A.; van Zadel, M.J.; Müllen, K.; Tielrooij, K.J.; Backus, E.H.G.; Bonn, M. Surface-Specific Spectroscopy of Water at a Potentiostatically Controlled Supported Graphene Monolayer. J. Phys. Chem. C 2019, 123, 24031–24038. [Google Scholar] [CrossRef] [PubMed]
  256. Sovago, M.; Campen, R.K.; Wurpel, G.W.H.; Müller, M.; Bakker, H.J.; Bonn, M. Vibrational Response of Hydrogen-Bonded Interfacial Water is Dominated by Intramolecular Coupling. Phys. Rev. Lett. 2008, 100, 173901. [Google Scholar] [CrossRef]
  257. Wang, Y.; Seki, T.; Yu, X.; Yu, C.-C.; Chiang, K.-Y.; Domke, K.F.; Hunger, J.; Chen, Y.; Nagata, Y.; Bonn, M. Chemistry governs water organization at a graphene electrode. Nature 2023, 615, E1–E2. [Google Scholar] [CrossRef]
  258. Wang, Y.; Seki, T.; Liu, X.; Yu, X.; Yu, C.-C.; Domke, K.F.; Hunger, J.; Koper, M.T.M.; Chen, Y.; Nagata, Y.; et al. Surface-specific vibrational spectroscopy of interfacial water reveals large pH change near graphene electrode at low current densities. arXiv 2022, arXiv:2210.02532. [Google Scholar] [CrossRef]
  259. Tadjeddine, A.; Guyot-Sionnest, P. Spectroscopic investigation of adsorbed cyanide and thiocyanate on platinum using sum frequency generation. Electrochim. Acta 1991, 36, 1849–1854. [Google Scholar] [CrossRef]
  260. Daum, W.; Friedrich, K.A.; Klünker, C.; Knabben, D.; Stimming, U.; Ibach, H. Sum-frequency generation at electrochemical interfaces: Cyanide vibrations on Pt(111) and Pt(110). Appl. Phys. A Solids Surf. 1994, 59, 553–562. [Google Scholar] [CrossRef]
  261. Tadjeddine, A.; Peremans, A.; Guyot-Sionnest, P. Vibrational spectroscopy of the electrochemical interface by visible-infrared sum-frequency generation. Surf. Sci. 1995, 335, 210–220. [Google Scholar] [CrossRef]
  262. Altowyan, M.S.; Fathalla, E.M.; Albering, J.H.; Abu-Youssef, M.A.M.; Kassem, T.S.; Barakat, A.; Haukka, M.; Badr, A.M.A.; Soliman, S.M. Synthesis, X-ray Structures and Hirshfeld Analysis of Two Novel Thiocyanate-Bridged Ag(I) Coordination Polymers. Inorganics 2023, 11, 417. [Google Scholar] [CrossRef]
  263. Wang, J.; Xu, M.; Huangfu, Z.; Wang, Y.; He, Y.; Guo, W.; Wang, Z. Observation of gold electrode surface response to the adsorption and oxidation of thiocyanate in acidic electrolyte with broadband sum-frequency generation spectroscopy. Vib. Spectrosc. 2016, 85, 122–127. [Google Scholar] [CrossRef]
  264. Gomes, J.F.; Bergamaski, K.; Pinto, M.F.S.; Miranda, P.B. Reaction intermediates of ethanol electro-oxidation on platinum investigated by SFG spectroscopy. J. Catal. 2013, 302, 67–82. [Google Scholar] [CrossRef]
  265. Subbaraman, R.; Strmcnik, D.; Stamenkovic, V.; Markovic, N.M. Three Phase Interfaces at Electrified Metal−Solid Electrolyte Systems 1. Study of the Pt(hkl)−Nafion Interface. J. Phys. Chem. C 2010, 114, 8414–8422. [Google Scholar] [CrossRef]
  266. Braunschweig, B.; Mukherjee, P.; Dlott, D.D.; Wieckowski, A. Real-Time Investigations of Pt(111) Surface Transformations in Sulfuric Acid Solutions. J. Am. Chem. Soc. 2010, 132, 14036–14038. [Google Scholar] [CrossRef] [PubMed]
  267. Zwaschka, G.; Wolf, M.; Campen, R.K.; Tong, Y. A Microscopic Model of the Electrochemical Vibrational Stark Effect: Understanding VSF Spectroscopy of (bi)Sulfate on Pt(111). Surf. Sci. 2018, 678, 78–85. [Google Scholar] [CrossRef]
  268. Omar, Z. Sharaf and Mehmet F. Orhan, An overview of fuel cell technology: Fundamentals and applications. Renew. Sustain. Energy Rev. 2014, 32, 810–853. [Google Scholar] [CrossRef]
  269. Qasem, N.A.A.; Abdulrahman, G.A.Q. A Recent Comprehensive Review of Fuel Cells: History, Types, and Applications. Int. J. Energy Res. 2024, 2024, 7271748. [Google Scholar] [CrossRef]
  270. Tadjeddine, A.; Peremans, A. Vibrational spectroscopy of the electrochemical interface by visible infrared sum-frequency generation. Surf. Sci. 1996, 368, 377–383. [Google Scholar] [CrossRef]
  271. Clayden, J.; Greeves, N.; Warren, S. Organic Chemistry; OUP Oxford: Oxford, UK, 2012. [Google Scholar]
  272. Dutta, S. Phosphine supported metal-dihydrogen complexes: Elongation of H−H bond to reversible release of H2. Comptes Rendus Chim. 2011, 14, 1029–1053. [Google Scholar] [CrossRef]
  273. Rizo, R.; Herrero, E.; Climent, V.; Feliu, J.M. On the nature of adsorbed species on platinum single-crystal electrodes. Curr. Opin. Electrochem. 2023, 38, 101240. [Google Scholar] [CrossRef]
  274. Rizo, R.; Fernández-Vidal, J.; Hardwick, L.J.; Attard, G.A.; Vidal-Iglesias, F.J.; Climent, V.; Herrero, E.; Feliu, J.M. Investigating the presence of adsorbed species on Pt steps at low potentials. Nat. Commun. 2022, 13, 2550. [Google Scholar] [CrossRef] [PubMed]
  275. Yang, S.; Noguchi, H.; Uosaki, K. Electronic Structure of the CO/Pt(111) Electrode Interface Probed by Potential-Dependent IR/Visible Double Resonance Sum Frequency Generation Spectroscopy. J. Phys. Chem. C 2015, 119, 26056–26063. [Google Scholar] [CrossRef]
  276. Vidal, F.; Busson, B.; Six, C.; Pluchery, O.; Tadjeddine, A. SFG study of methanol dissociative adsorption at Pt(100), Pt(110) and Pt(111) electrodes surfaces. Surf. Sci. 2002, 502–503, 485–489. [Google Scholar] [CrossRef]
  277. Kutz, R.B.; Braunschweig, B.; Mukherjee, P.; Behrens, R.L.; Dlott, D.D.; Wieckowski, A. Reaction pathways of ethanol electrooxidation on polycrystalline platinum catalysts in acidic electrolytes. J. Catal. 2011, 278, 181–188. [Google Scholar] [CrossRef]
  278. Lu, G.Q.; Lagutchev, A.; Dlott, D.D.; Wieckowski, A. Quantitative vibrational sum-frequency generation spectroscopy of thin layer electrochemistry: CO on a Pt electrode. Surf. Sci. 2005, 585, 3–16. [Google Scholar] [CrossRef]
  279. Noguchi, H.; Ishimaru, T.; Uosaki, K. Potential and time dependent broad band sum frequency generation spectroscopic study on electrochemical oxidation of adsorbed CO on Pt(111) electrode surface in pre-peak region in alkaline solution. J. Electroanal. Chem. 2021, 896, 115478. [Google Scholar] [CrossRef]
  280. Peremans, A.; Tadjeddine, A. Spectroscopic investigation of electrochemical interfaces at overpotential by infrared-visible sum-frequency generation: Platinum in bare and methanol-containing electrolyte. J. Electroanal. Chem. 1995, 395, 313–316. [Google Scholar] [CrossRef]
  281. Vidal, F.; Busson, B.; Six, C.; Tadjeddine, A.; Dreesen, L.; Humbert, C.; Peremans, A.; Thiry, P. Methanol dissociative adsorption on Pt(100) as studied by nonlinear vibrational spectroscopy. J. Electroanal. Chem. 2004, 1, 9–14. [Google Scholar] [CrossRef]
  282. Vidal, F.; Tadjeddine, A.; Humbert, C.; Dreesen, L.; Peremans, A.; Thiry, P.A.; Busson, B. The influence of surface defects in methanol dissociative adsorption and CO oxidation on Pt(110) probed by nonlinear vibrational SFG spectroscopy. J. Electroanal. Chem. 2012, 672, 1–6. [Google Scholar] [CrossRef]
  283. Roy, S.; Bellamkonda, S. Chapter 10—Oxygen reduction reaction in ethanol fuel cells. In Oxygen Reduction Reaction; Sengupta, K., Chatterjee, S., Dutta, K., Eds.; Elsevier: Amsterdam, The Netherlands, 2022; pp. 337–378. [Google Scholar]
  284. Cao, L.; Soto, F.A.; Li, D.; Deng, T.; Hu, E.; Lu, X.; Cullen, D.A.; Eidson, N.; Yang, X.-Q.; He, K.; et al. Pd-Ru pair on Pt surface for promoting hydrogen oxidation and evolution in alkaline media. Nat. Commun. 2024, 15, 7245. [Google Scholar] [CrossRef] [PubMed]
  285. Braunschweig, B.; Mukherjee, P.; Kutz, R.B.; Rumpel, A.; Engelhardt, K.; Peukert, W.; Dlott, D.D.; Wieckowski, A. Spectroscopy of Electrified Interfaces with Broadband Sum Frequency Generation: From Electrocatalysis to Protein Foams. In Vibrational Spectroscopy at Electrified Interfaces; Wiley: Hoboken, NJ, USA, 2013; pp. 120–150. [Google Scholar]
  286. Braunschweig, B.; Wieckowski, A. Surface spectroscopy of Pt(111) single-crystal electrolyte interfaces with broadband sum-frequency generation. J. Electroanal. Chem. 2014, 716, 136–144. [Google Scholar] [CrossRef]
  287. Braunschweig, B.; Mukherjee, P.; Kutz, R.B.; Wieckowski, A.; Dlott, D.D. Sum-frequency generation of acetate adsorption on Au and Pt surfaces: Molecular structure effects. J. Chem. Phys. 2010, 133, 234702. [Google Scholar] [CrossRef] [PubMed]
  288. Lin, J.; Zhang, Y.; Xu, P.; Chen, L. CO2 electrolysis: Advances and challenges in electrocatalyst engineering and reactor design. Mater. Rep. Energy 2023, 3, 100194. [Google Scholar] [CrossRef]
  289. Birdja, Y.Y.; Pérez-Gallent, E.; Figueiredo, M.C.; Göttle, A.J.; Calle-Vallejo, F.; Koper, M.T.M. Advances and challenges in understanding the electrocatalytic conversion of carbon dioxide to fuels. Nat. Energy 2019, 4, 732–745. [Google Scholar] [CrossRef]
  290. Xie, C.; Niu, Z.; Kim, D.; Li, M.; Yang, P. Surface and Interface Control in Nanoparticle Catalysis. Chem. Rev. 2020, 120, 1184–1249. [Google Scholar] [CrossRef] [PubMed]
  291. Das, S.; Pérez-Ramírez, J.; Gong, J.; Dewangan, N.; Hidajat, K.; Gates, B.C.; Kawi, S. Core–shell structured catalysts for thermocatalytic, photocatalytic, and electrocatalytic conversion of CO2. Chem. Soc. Rev. 2020, 49, 2937–3004. [Google Scholar] [CrossRef]
  292. Huang-fu, Z.-C.; Song, Q.-T.; He, Y.-H.; Wang, J.-J.; Ye, J.-Y.; Zhou, Z.-Y.; Sun, S.-G.; Wang, Z.-H. Electrochemical CO2 reduction on Cu and Au electrodes studied using in situ sum frequency generation spectroscopy. Phys. Chem. Chem. Phys. 2019, 21, 25047–25053. [Google Scholar] [CrossRef] [PubMed]
  293. Zhan, C.; Dattila, F.; Rettenmaier, C.; Herzog, A.; Herran, M.; Wagner, T.; Scholten, F.; Bergmann, A.; López, N.; Roldan Cuenya, B. Key intermediates and Cu active sites for CO2 electroreduction to ethylene and ethanol. Nat. Energy 2024, 9, 1485–1496. [Google Scholar] [CrossRef] [PubMed]
  294. Liu, X.; Ma, Y.; Song, Q.; Huang, H.; He, Y.; Sun, S.; Wang, Z. Direct Observation of Surface-Bound Intermediates in CO/CO2 Reduction on a Polycrystalline Cu Electrode Using Broad-Band SFG Spectroscopy. J. Phys. Chem. C 2023, 127, 23675–23686. [Google Scholar] [CrossRef]
  295. Ma, Y.; Wang, J.; Yu, J.; Zhou, J.; Zhou, X.; Li, H.; He, Z.; Long, H.; Wang, Y.; Lu, P.; et al. Surface modification of metal materials for high-performance electrocatalytic carbon dioxide reduction. Matter 2021, 4, 888–926. [Google Scholar] [CrossRef]
  296. Singh, P.; Srivastava, R. Utilization of bio-inspired catalyst for CO2 reduction into green fuels: Recent advancement and future perspectives. J. CO2 Util. 2021, 53, 101748. [Google Scholar] [CrossRef]
  297. Feng, D.-M.; Zhu, Y.-P.; Chen, P.; Ma, T.-Y. Recent Advances in Transition-Metal-Mediated Electrocatalytic CO2 Reduction: From Homogeneous to Heterogeneous Systems. Catalysts 2017, 7, 373. [Google Scholar] [CrossRef]
  298. Wallentine, S.; Bandaranayake, S.; Biswas, S.; Baker, L.R. Direct Observation of Carbon Dioxide Electroreduction on Gold: Site Blocking by the Stern Layer Controls CO2 Adsorption Kinetics. J. Phys. Chem. Lett. 2020, 11, 8307–8313. [Google Scholar] [CrossRef] [PubMed]
  299. Deng, G.-H.; Zhu, Q.; Rebstock, J.; Neves-Garcia, T.; Baker, L.R. Direct observation of bicarbonate and water reduction on gold: Understanding the potential dependent proton source during hydrogen evolution. Chem. Sci. 2023, 14, 4523–4531. [Google Scholar] [CrossRef]
  300. Humbert, C.; Busson, B.; Six, C.; Gayral, A.; Gruselle, M.; Villain, F.; Tadjeddine, A. Sum-frequency generation as a vibrational and electronic probe of the electrochemical interface and thin films. J. Electroanal. Chem. 2008, 621, 314–321. [Google Scholar] [CrossRef]
  301. Baldelli, S.; Mailhot, G.; Ross, P.N.; Somorjai, G.A. Potential-Dependent Vibrational Spectroscopy of Solvent Molecules at the Pt(111) Electrode in a Water/Acetonitrile Mixture Studied by Sum Frequency Generation. J. Am. Chem. Soc. 2001, 123, 7697–7702. [Google Scholar] [CrossRef]
  302. Pluchery, O.; Tadjeddine, A. Investigation of the adsorption of 4-cyanopyridine on Au(111) by in situ visible–infrared sum frequency generation. J. Electroanal. Chem. 2001, 500, 379–387. [Google Scholar] [CrossRef]
  303. Le Rille, A.; Tadjeddine, A.; Zheng, W.Q.; Peremans, A. Vibrational spectroscopy of a Au(hkl)-electrolyte interface by in situ visible-infrared difference frequency generation. Chem. Phys. Lett. 1997, 271, 95–100. [Google Scholar] [CrossRef]
  304. Angelici, R.J.; Lazar, M. Isocyanide Ligands Adsorbed on Metal Surfaces: Applications in Catalysis, Nanochemistry, and Molecular Electronics. Inorg. Chem. 2008, 47, 9155–9165. [Google Scholar] [CrossRef] [PubMed]
  305. Swanson, S.A.; McClain, R.; Lovejoy, K.S.; Alamdari, N.B.; Hamilton, J.S.; Scott, J.C. Self-Assembled Diisocyanide Monolayer Films on Gold and Palladium. Langmuir 2005, 21, 5034–5039. [Google Scholar] [CrossRef] [PubMed]
  306. Schultz, Z.D.; Gewirth, A.A. Potential-Dependent Adsorption and Orientation of a Small Zwitterion:  p-Aminobenzoic Acid on Ag(111). Anal. Chem. 2005, 77, 7373–7379. [Google Scholar] [CrossRef] [PubMed]
Figure 1. Schematic representations of electrochemical reactions in the solid oxide (a) fuel cells (SOFCs), (b) electrolytic cells (SOECs), and (c) photocatalytic water splitting regarding the water cycle. Green and red arrows in (a,b) indicate the half-reactions at the anode and cathode of the fuel cell and electrolytic cell, respectively. Two types of conductors (proton and oxygen ions) exist in solid oxide-based cells. SOFC and SOEC are two key components in the energy transition, corresponding to gas to power (G2P) and power to gas (P2G) processes, respectively. In (c), oxide-based photocatalytic water splitting occurs via three mechanistic steps: (1) exciton (electron–hole) excitation through light absorption (photocatalyst + h ν e + h+), (2) charge separation and migration of charge carriers toward the photocatalyst’s surface, and (3) surface reactions (HER at the conduction band (CB) and OER at the valence band (VB)). NHE refers to the normal hydrogen electrode.
Symmetry 16 01699 g001
Figure 3. (a) Schematic representation of the electrical double layer (EDL) description according to the Gouy–Chapman–Stern model (GCS) and (b) the illustrative potential profile through the Stern layer (a linear drop) and diffuse layer (an exponential decrease) to the bulk. IHP: inner Helmholtz plane or Stern plane, OHP: outer Helmholtz plane, DL: diffuse layer, SP: slipping or shear plane/shear zone or hydrodynamic plane of shear. Due to the negatively charged surface of the working electrode (WE), the electrical potential is negative. For the sake of simplicity, the dipole moments of only some water molecules are presented. It is noteworthy to highlight that, in long-established chemical practice, the dipole moment direction (arrow) points from the atom with a partial positive charge (δ+) to the atom with a partial negative charge (δ) to indicate the electron density shift, which is contrary to the International Union of Pure and Applied Chemistry (IUPAC) definition or the convention in physics [66,67]. In the context of this review, the arrow of dipole moment obeys the chemistry convention. Depending on the way of elucidating the phenomena, the Stern layer is also considered as the binding interfacial layer (BIL) [68] or inner region according to [69].
Symmetry 16 01699 g003
Figure 4. Schematic illustrations of the discrepancies among (a) surface potential ( φ ), outer/external potential ( ψ ), and inner/internal potential ( ϕ ) of metal M, as well as (b) the Volta ( ψ ) and Galvani ( ϕ ) potential differences between two metals M1 and M2. This figure is adapted from the reference [72], Copyright © 2022 The Electrochemical Society of Japan.
Symmetry 16 01699 g004
Figure 6. Sketch of sum-frequency generation (SFG) spectroscopy at a nanostructured interface sample: Glass substrate/grafted APTES + HOOC-functionalized quantum dots CdTe/ambient air. Symmetry 16 01699 i001NH3+ is the protonated form of APTES (EtO)3Si-(CH2)3-NH2 (3-aminopropyl)triethoxysilane and Symmetry 16 01699 i001COO represents the carboxylate form of mercaptocarboxylic acids HS-(CH2)n-COOH (n   3). Symmetry 16 01699 i002 denotes the vibro-electronic dipolar coupling of the exciton (electron–hole pair) of QDs to the vibrational resonances of surrounding ligands. From geometry investigation, the optimized angles for Visible and Infrared photons are 55o and 65o, respectively. The polarization scheme is (S:SP) for the SFG, Vis, and IR beams, where the polarization plane of P(x,0,z) and S(0,y,0) is illustrated. Light can be polarized parallel (P polarization) or perpendicular (S polarization) to the plane of incidence (Oxz plane). This figure is inspired by references [87,89,90].
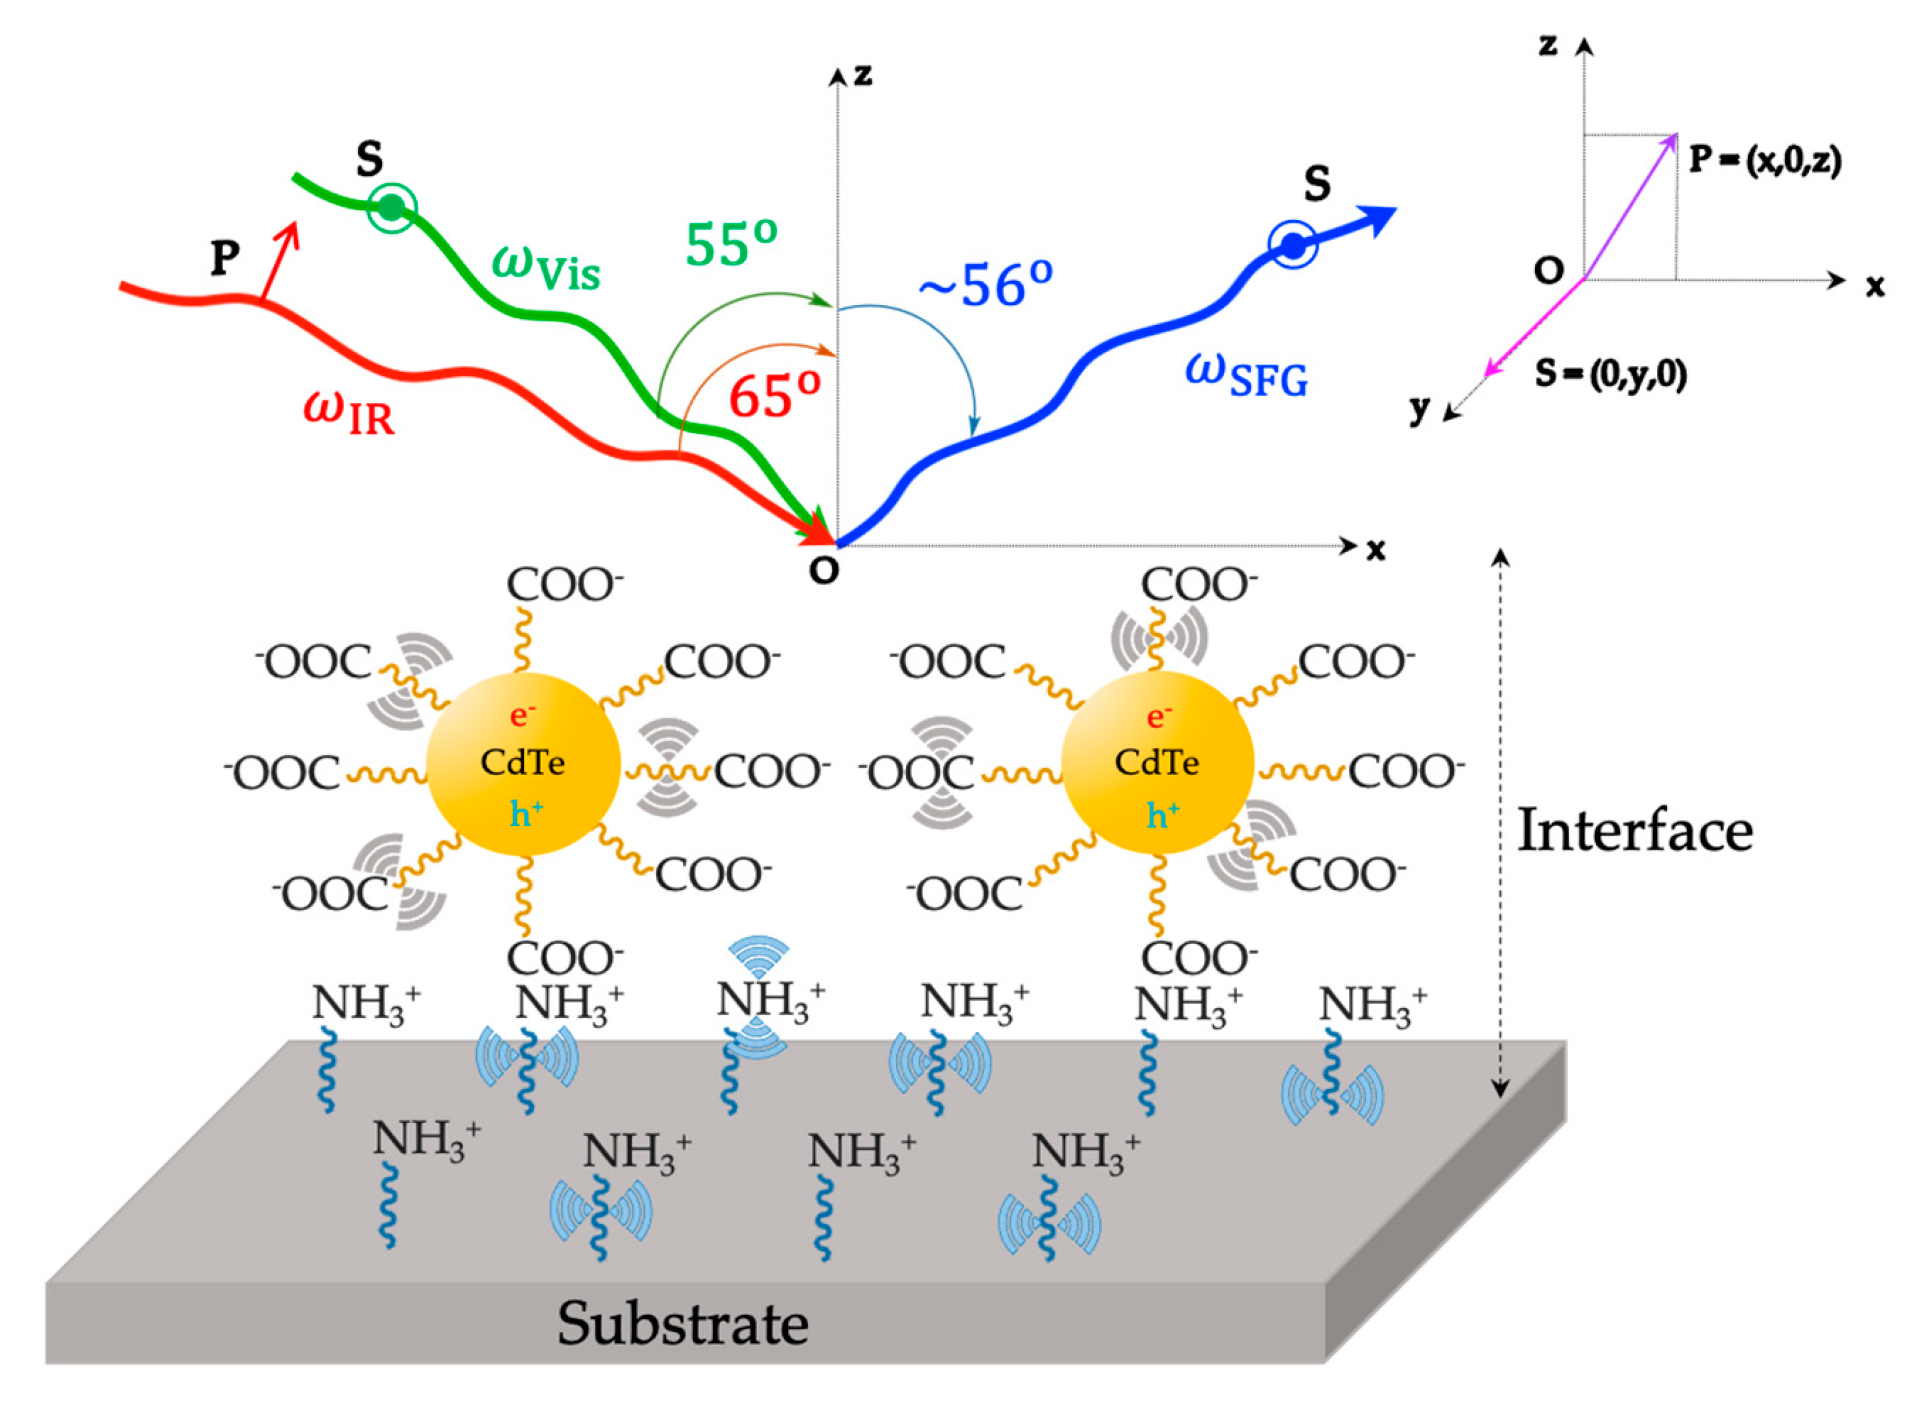
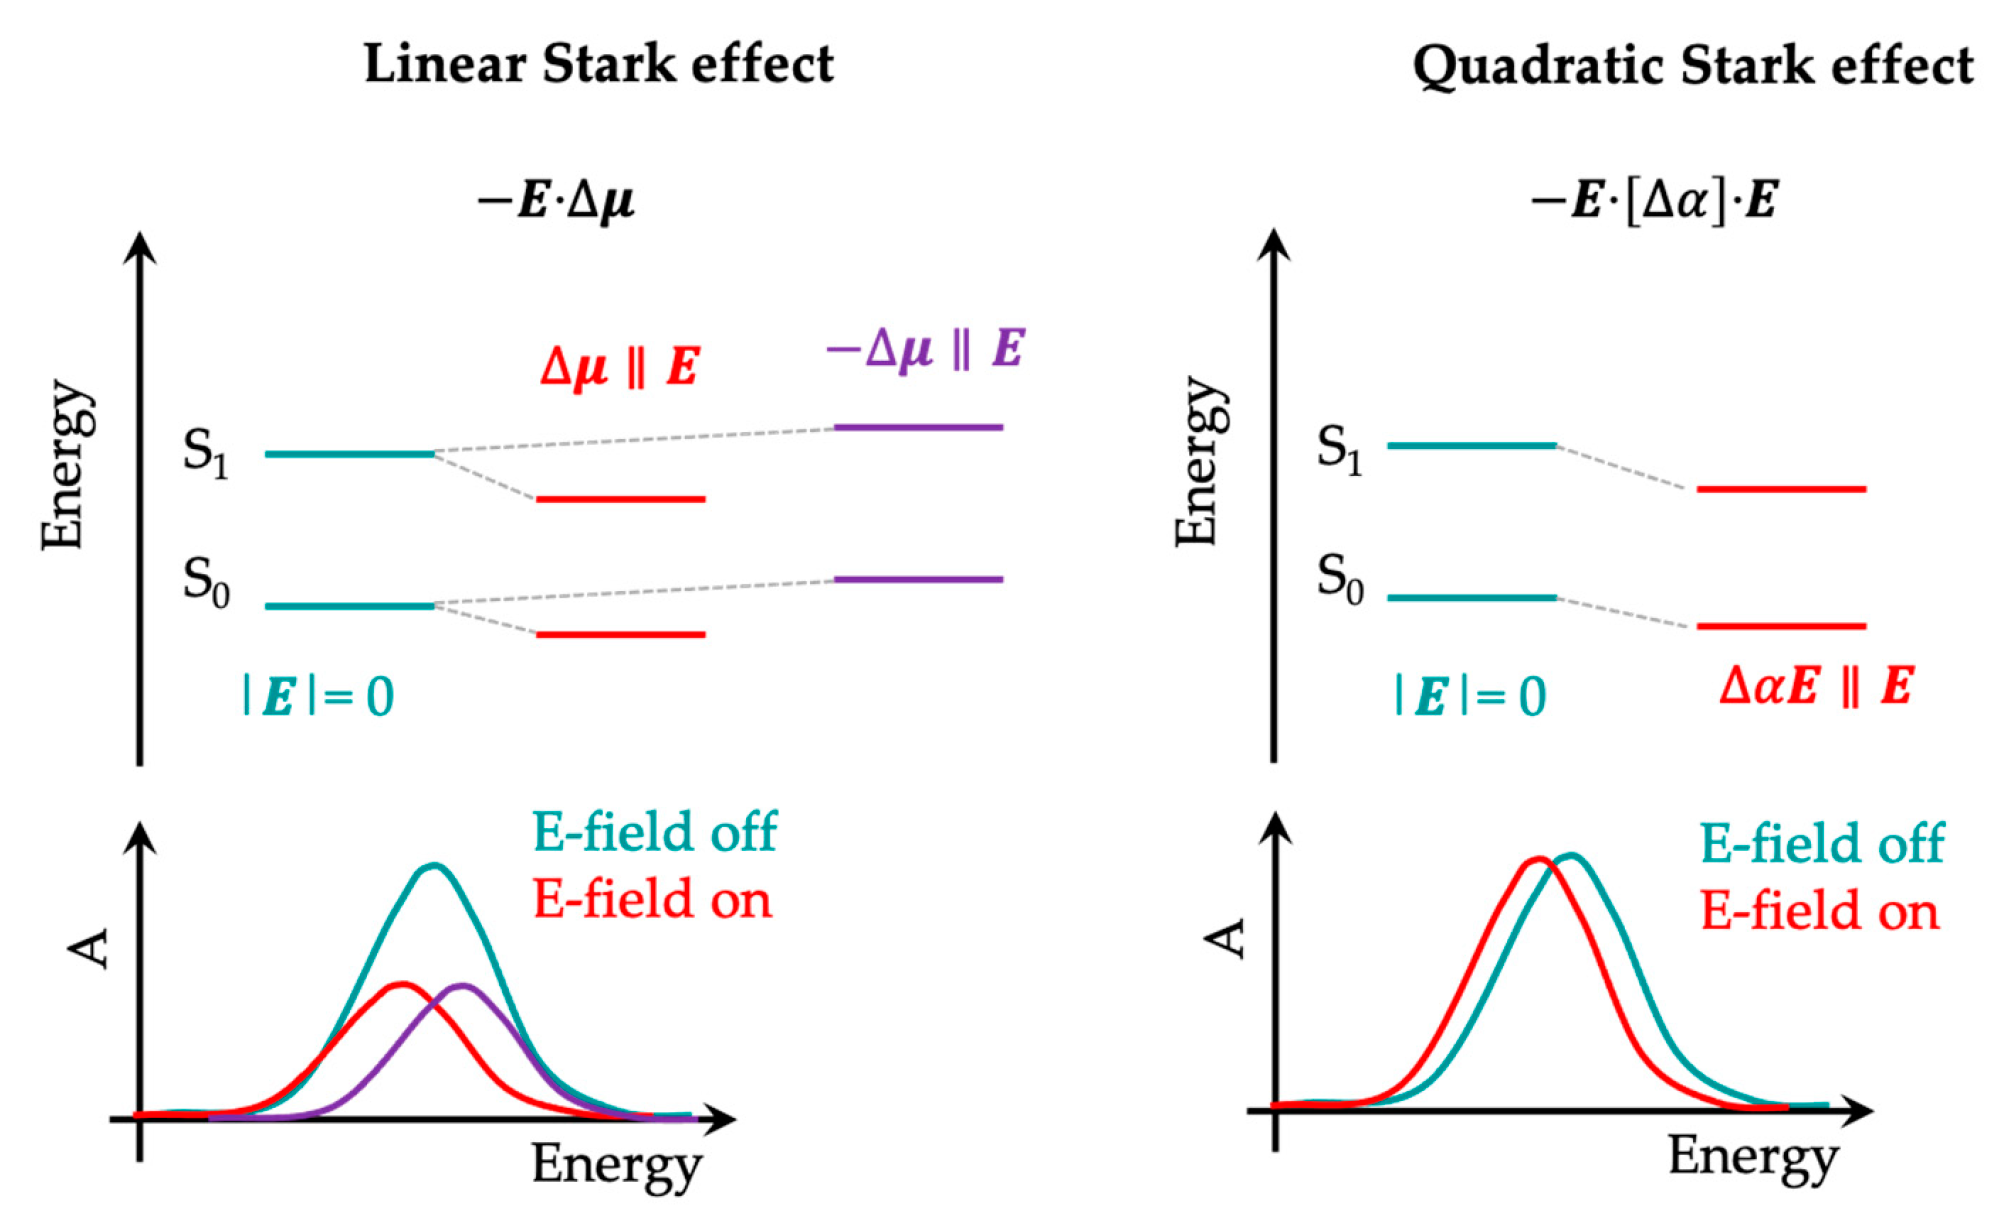
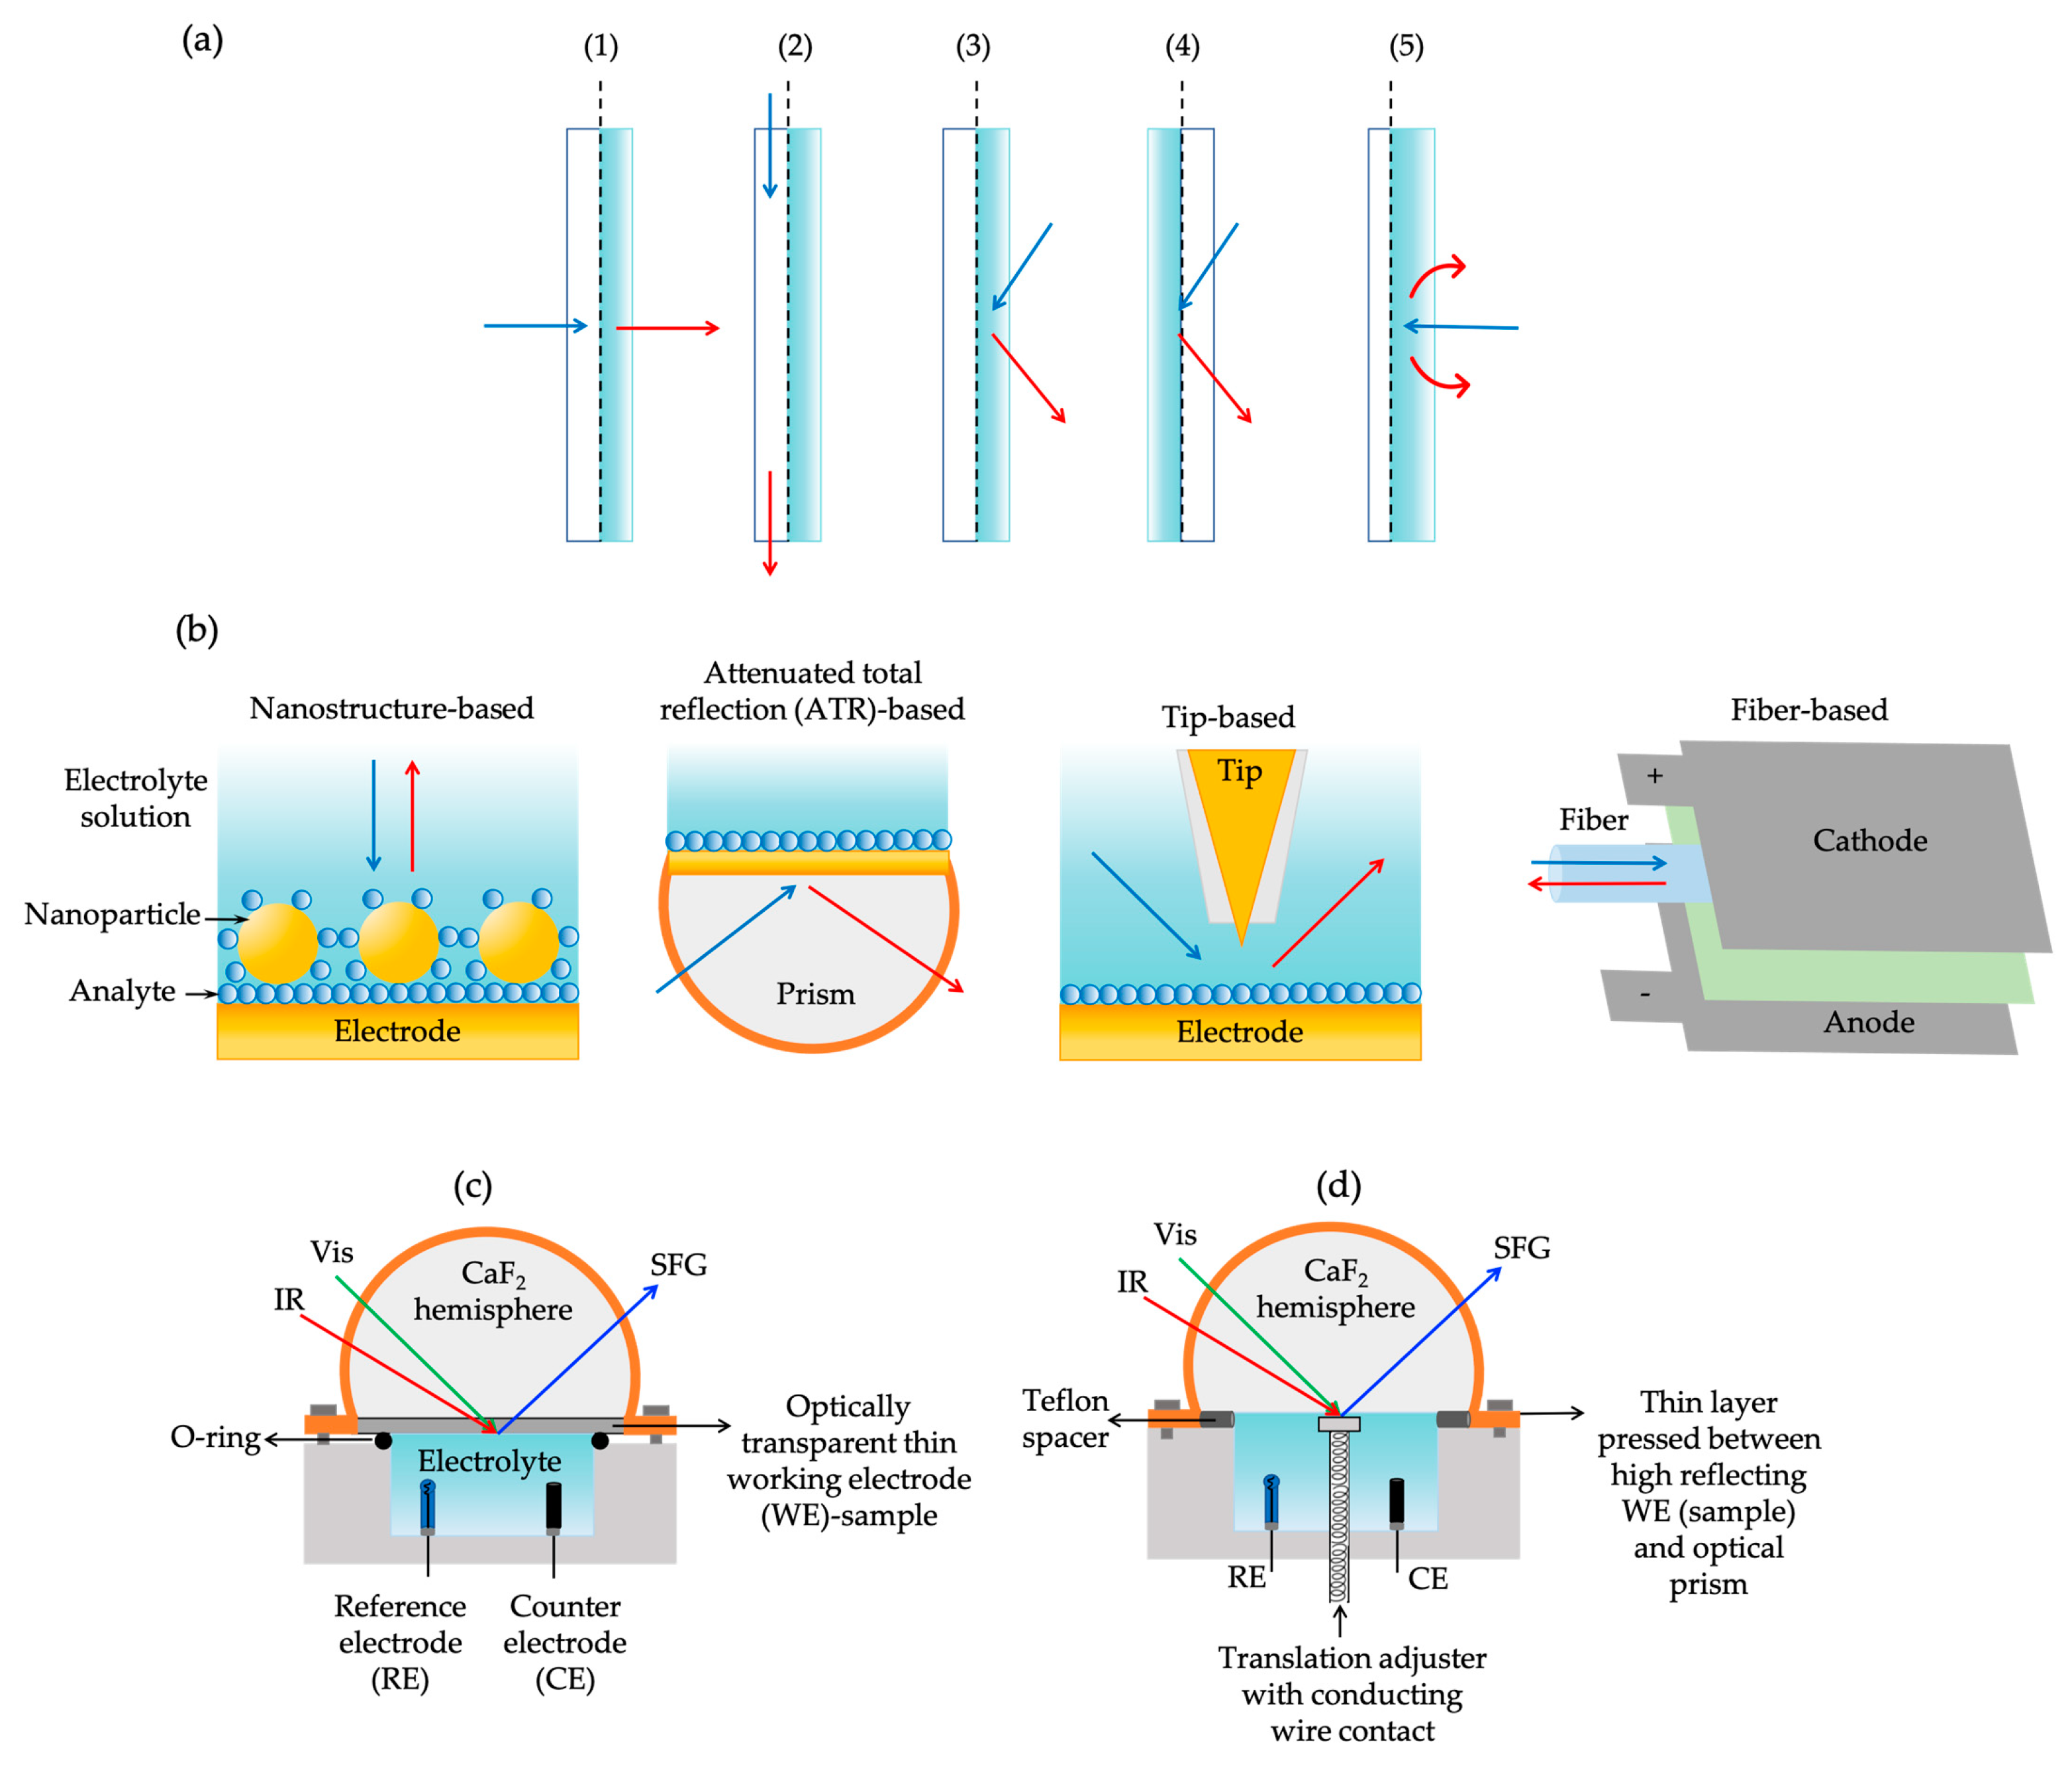
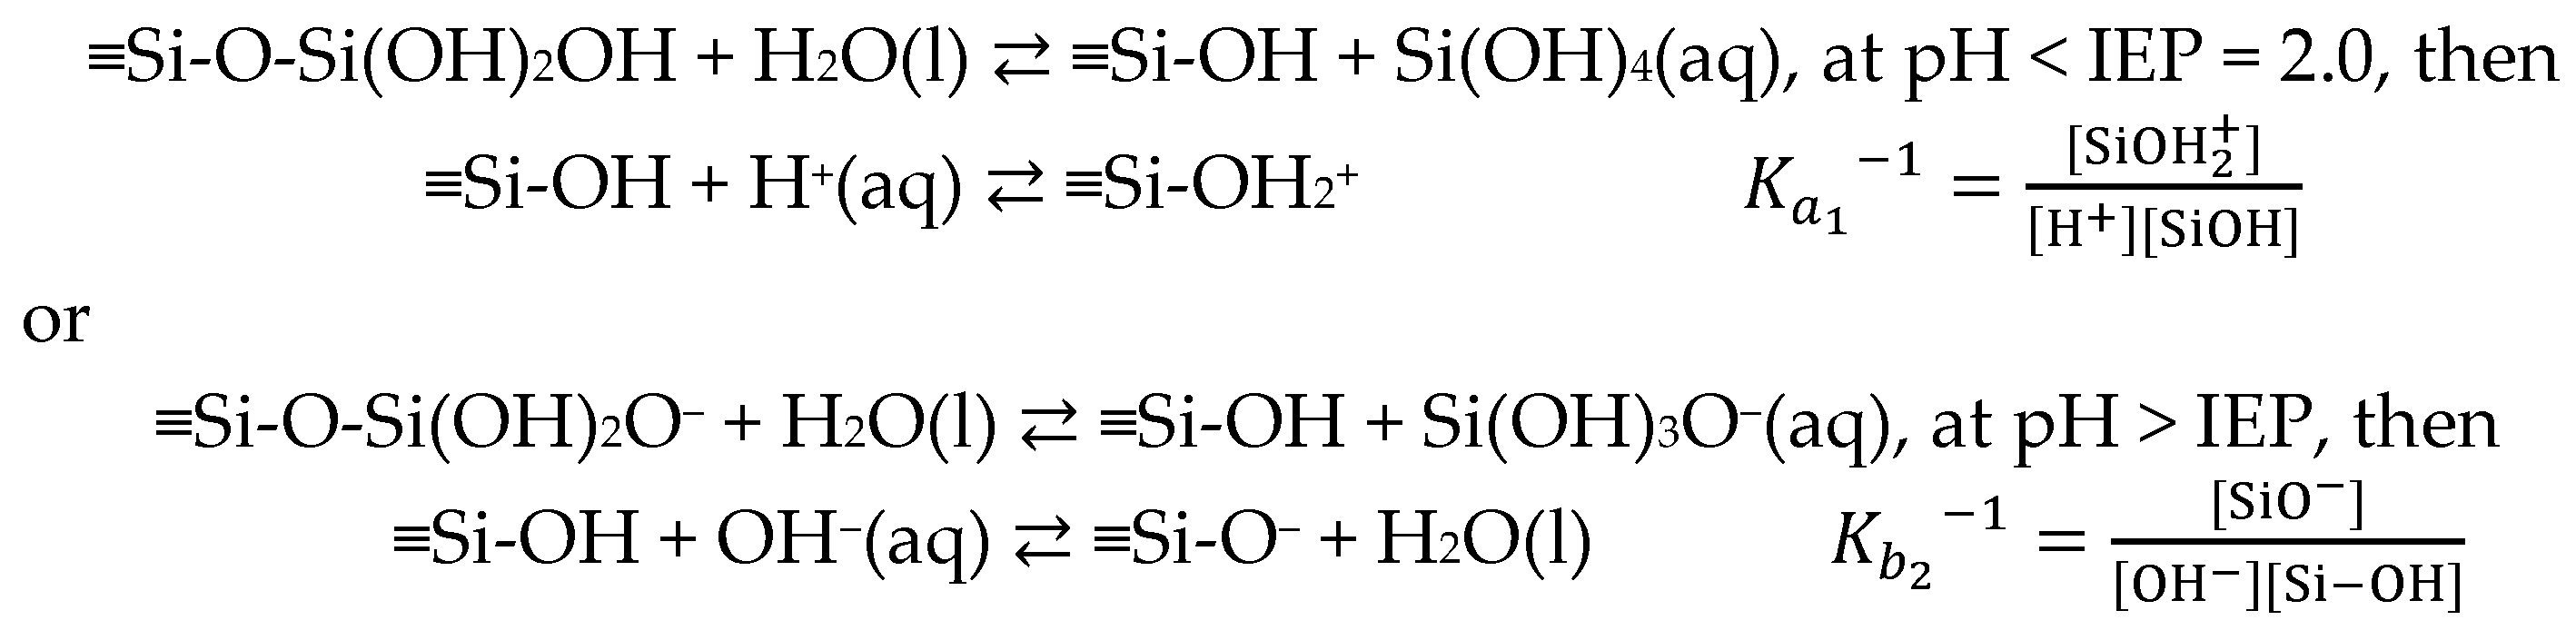
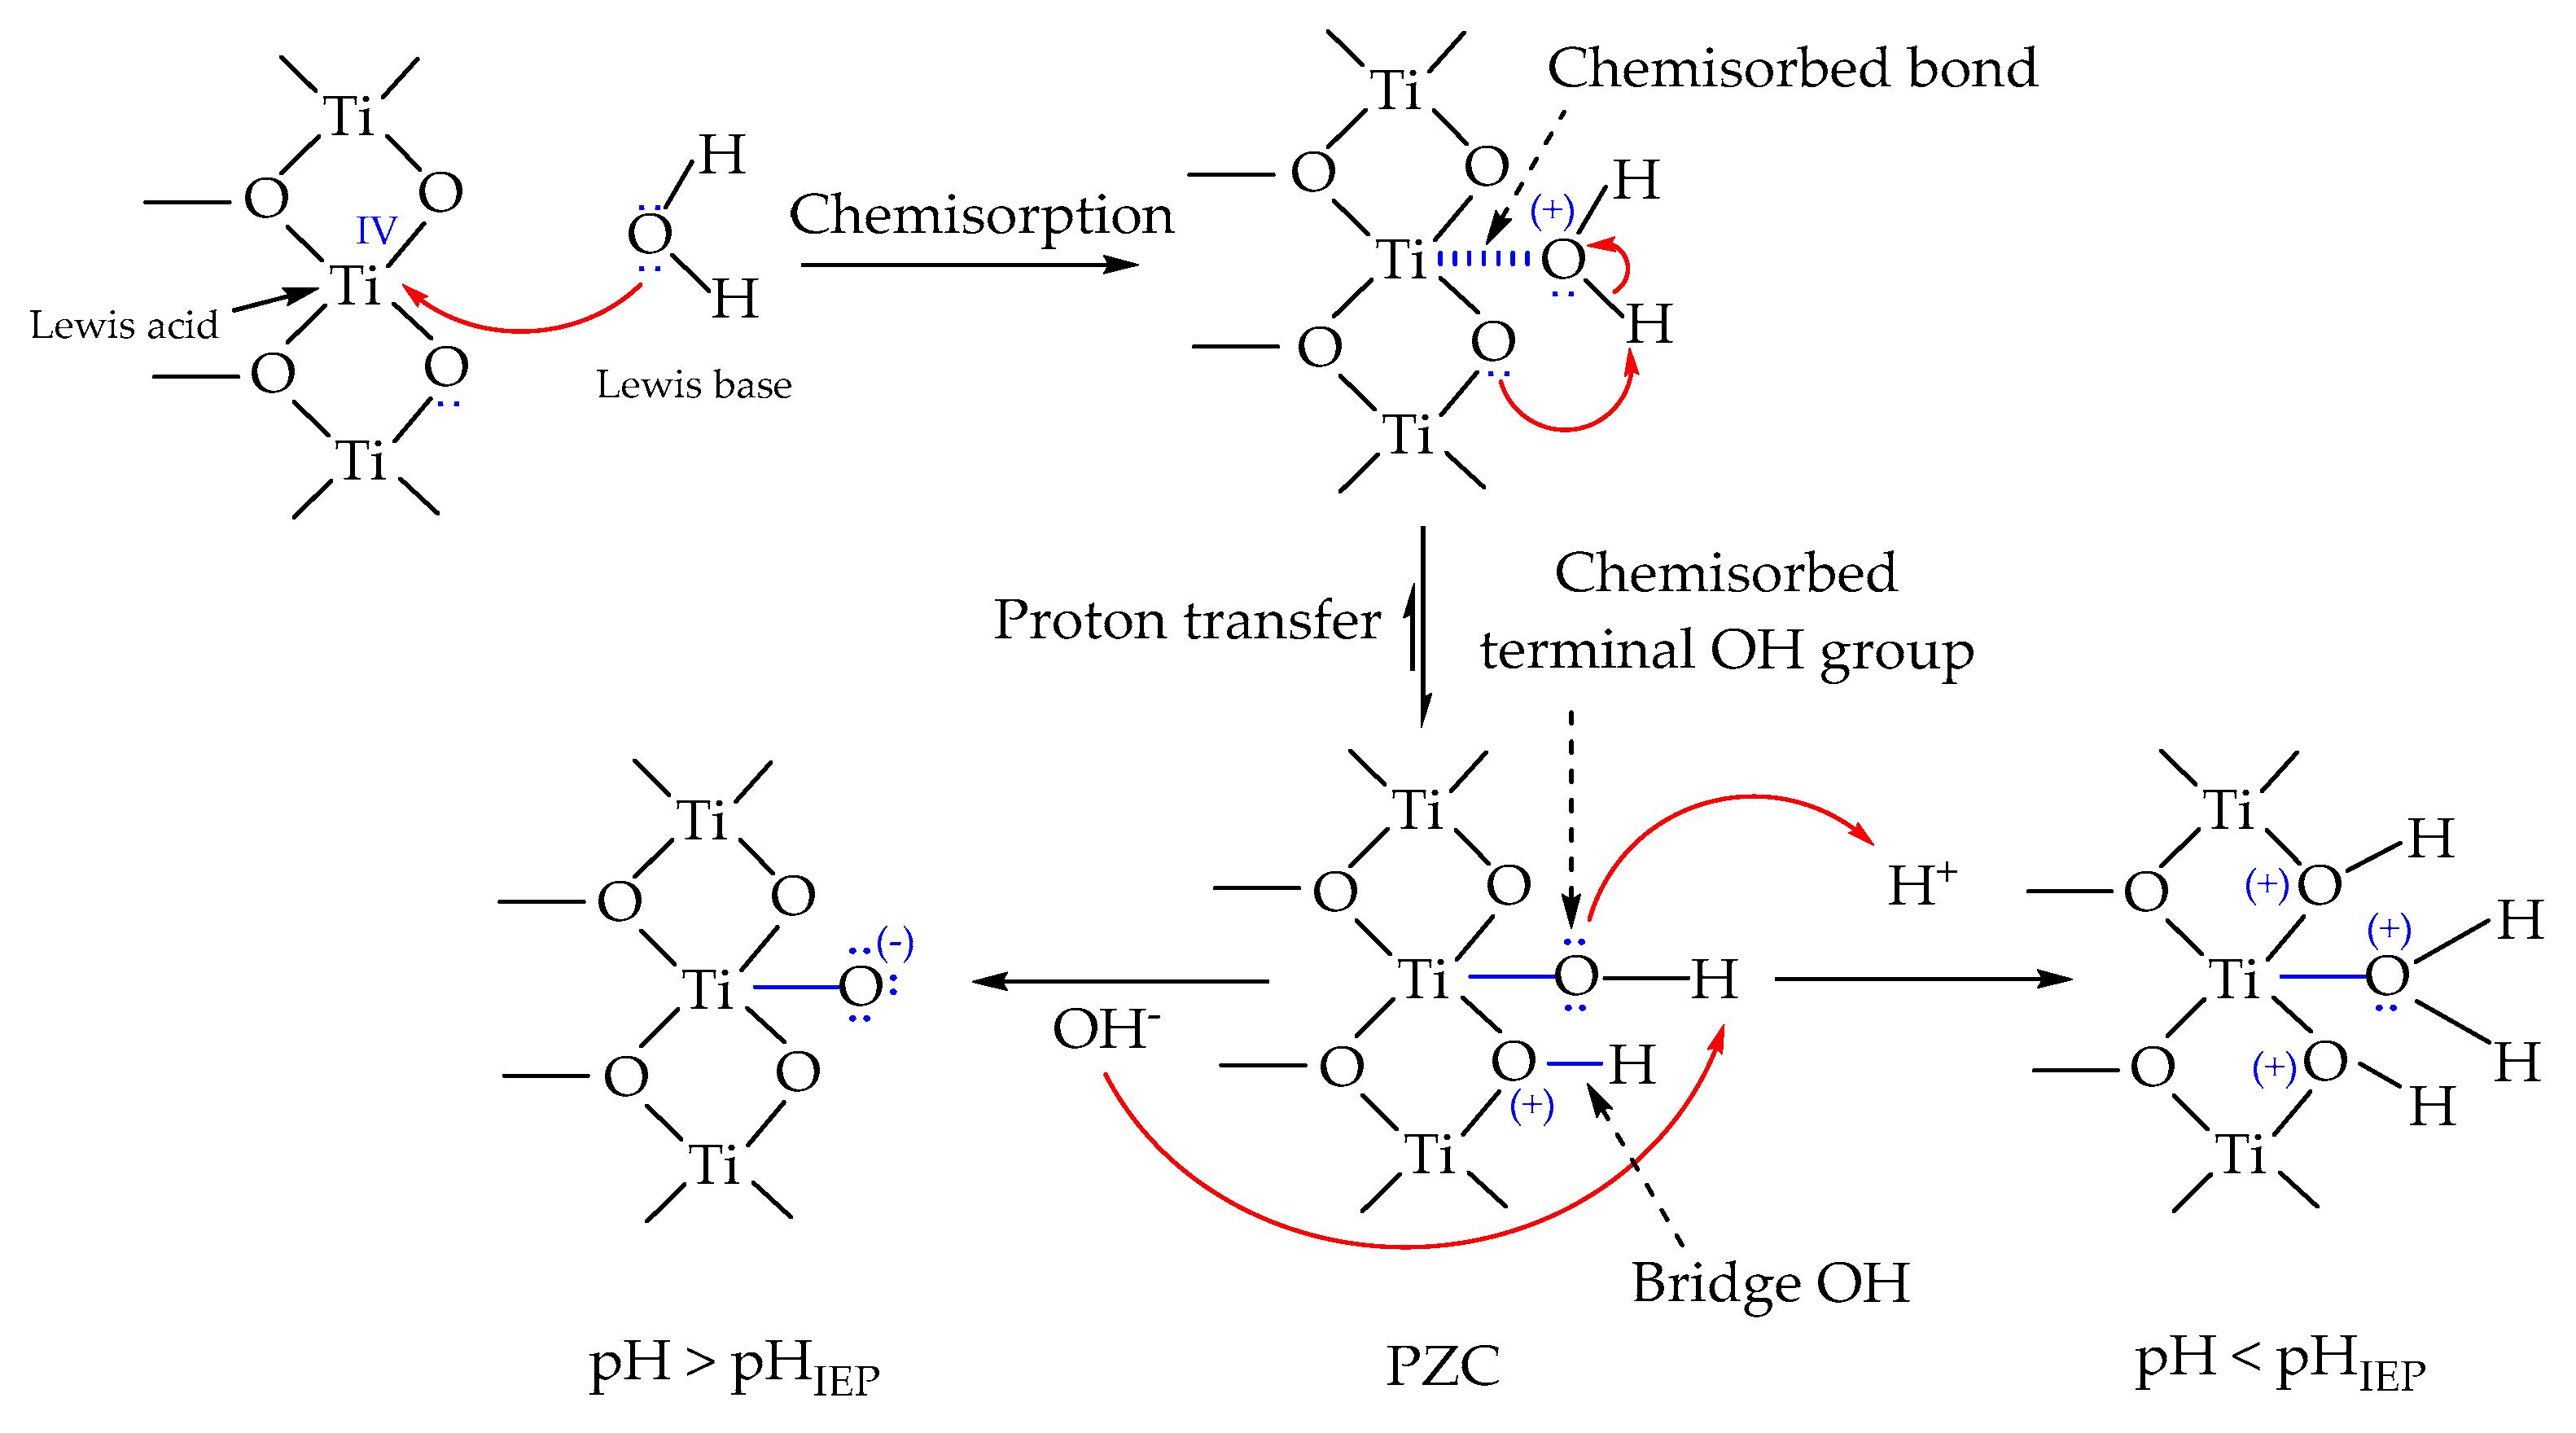
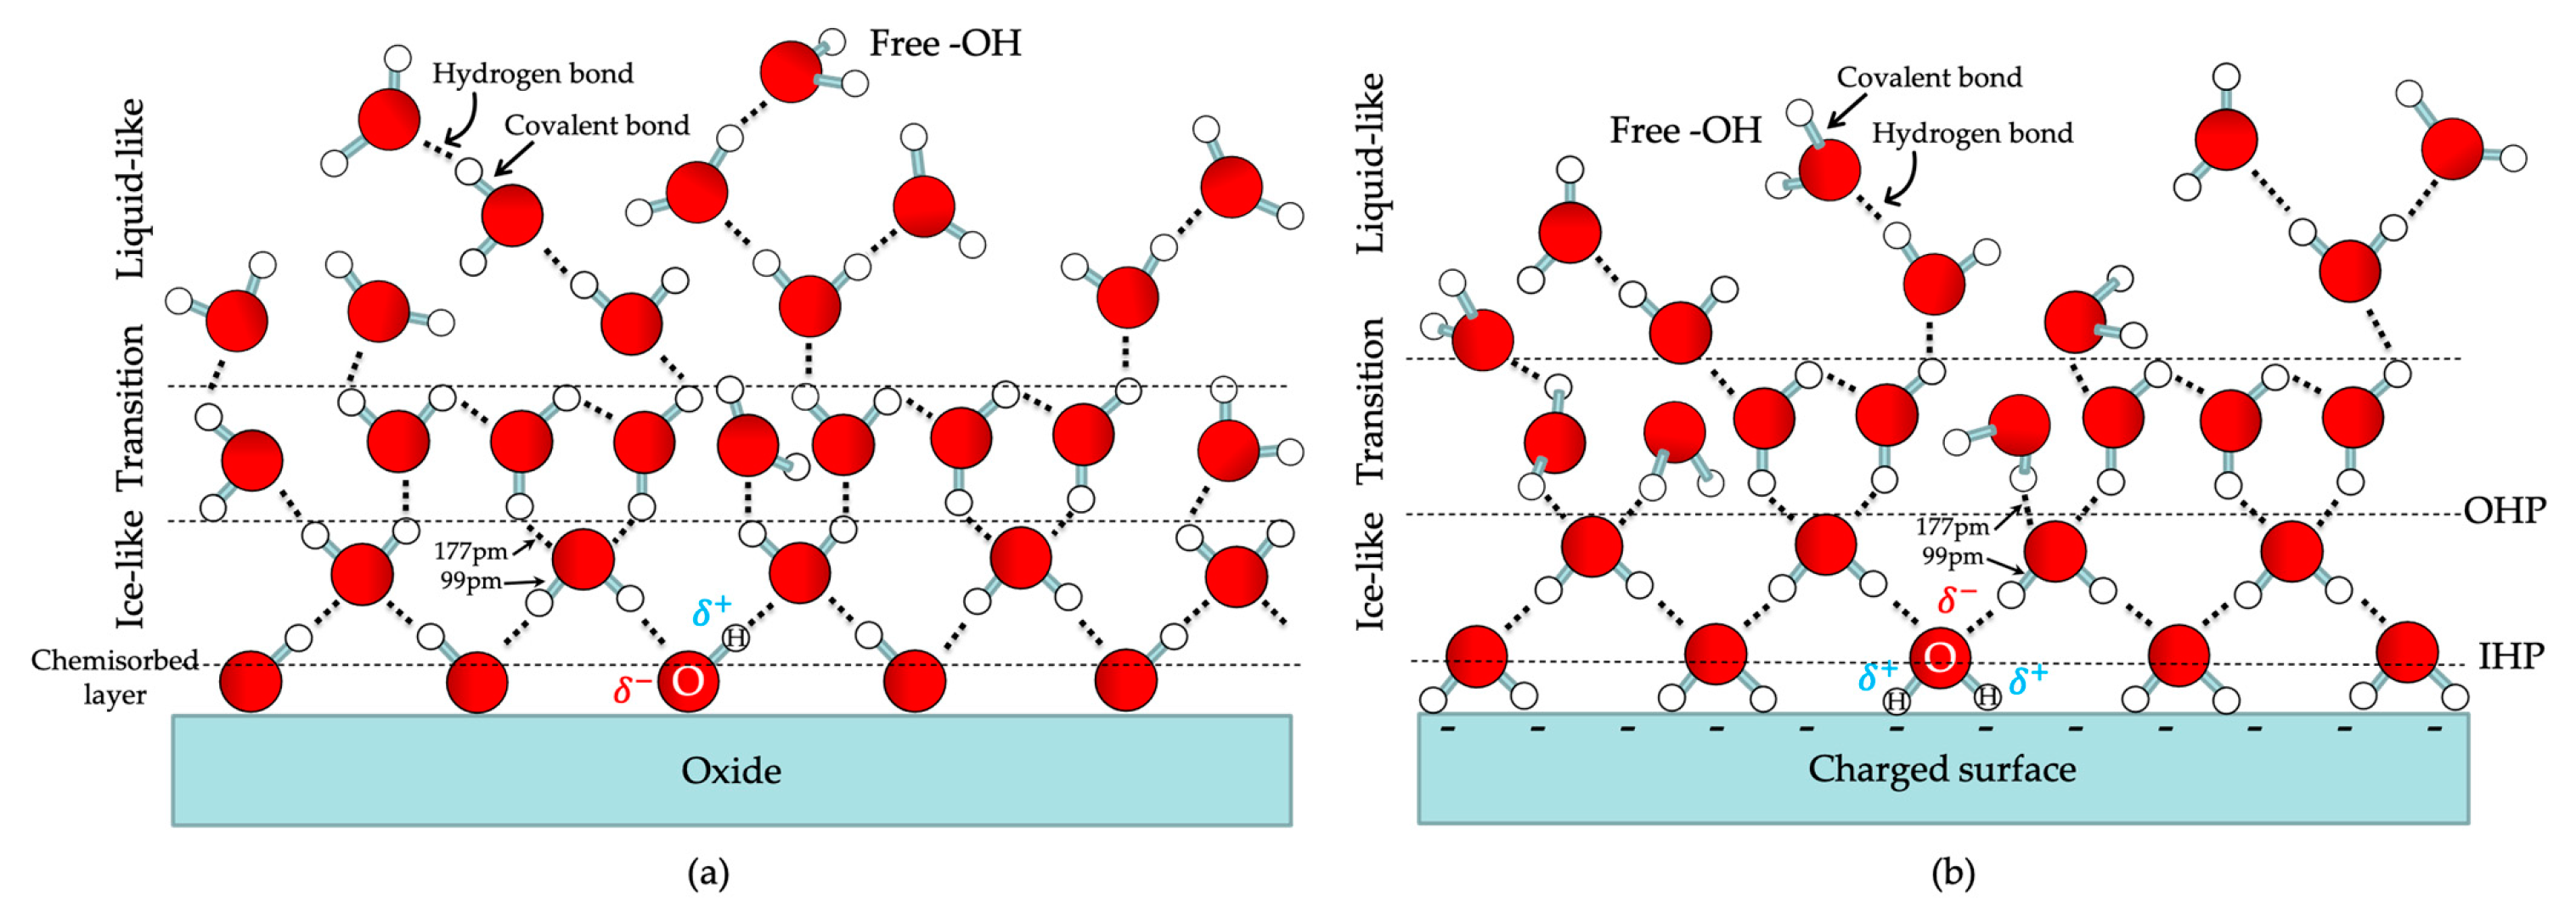
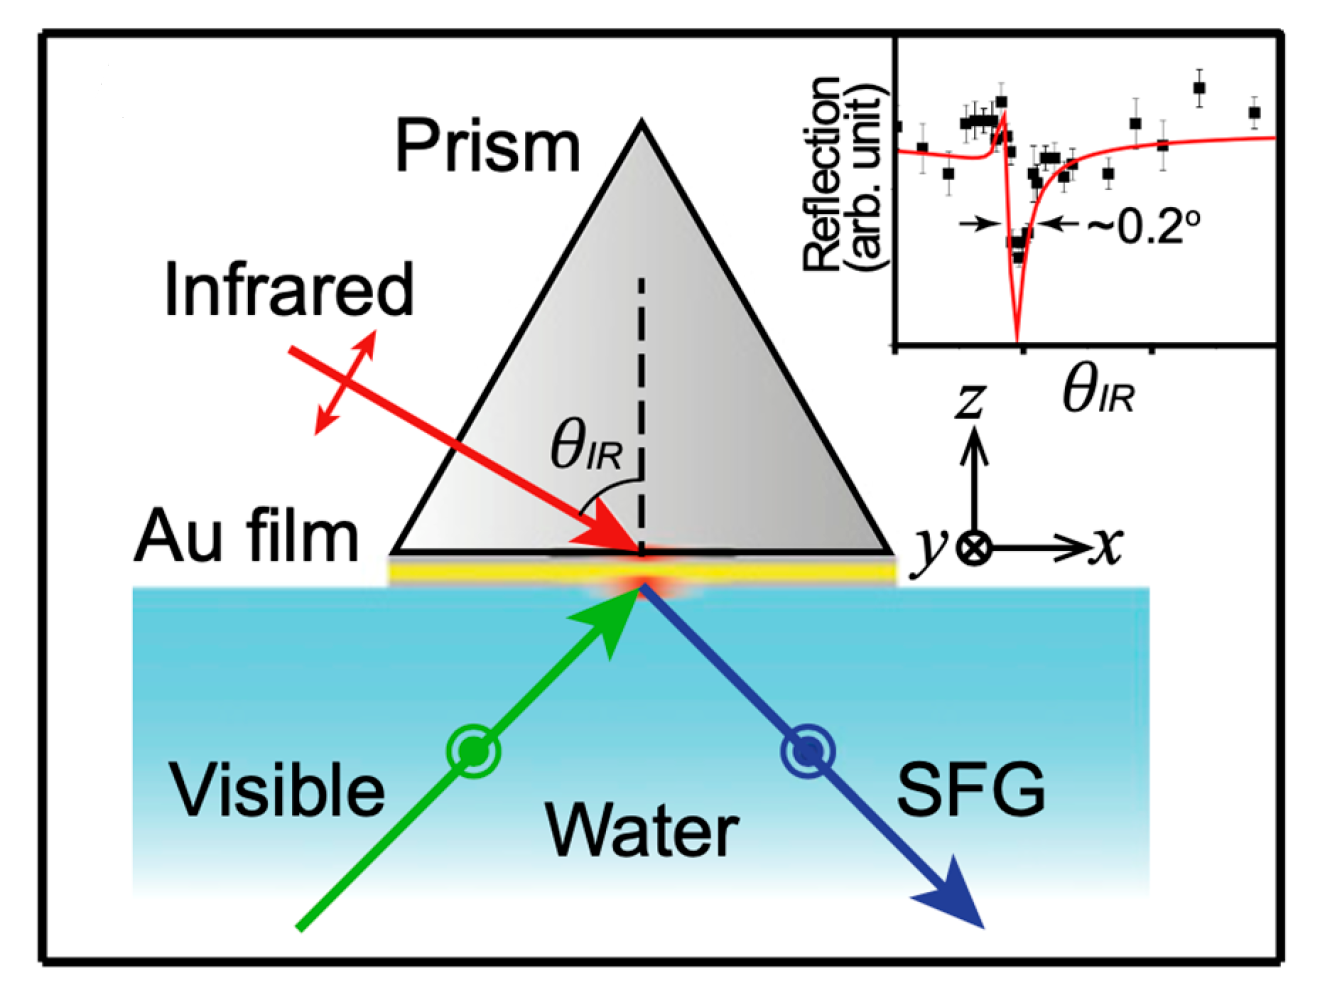
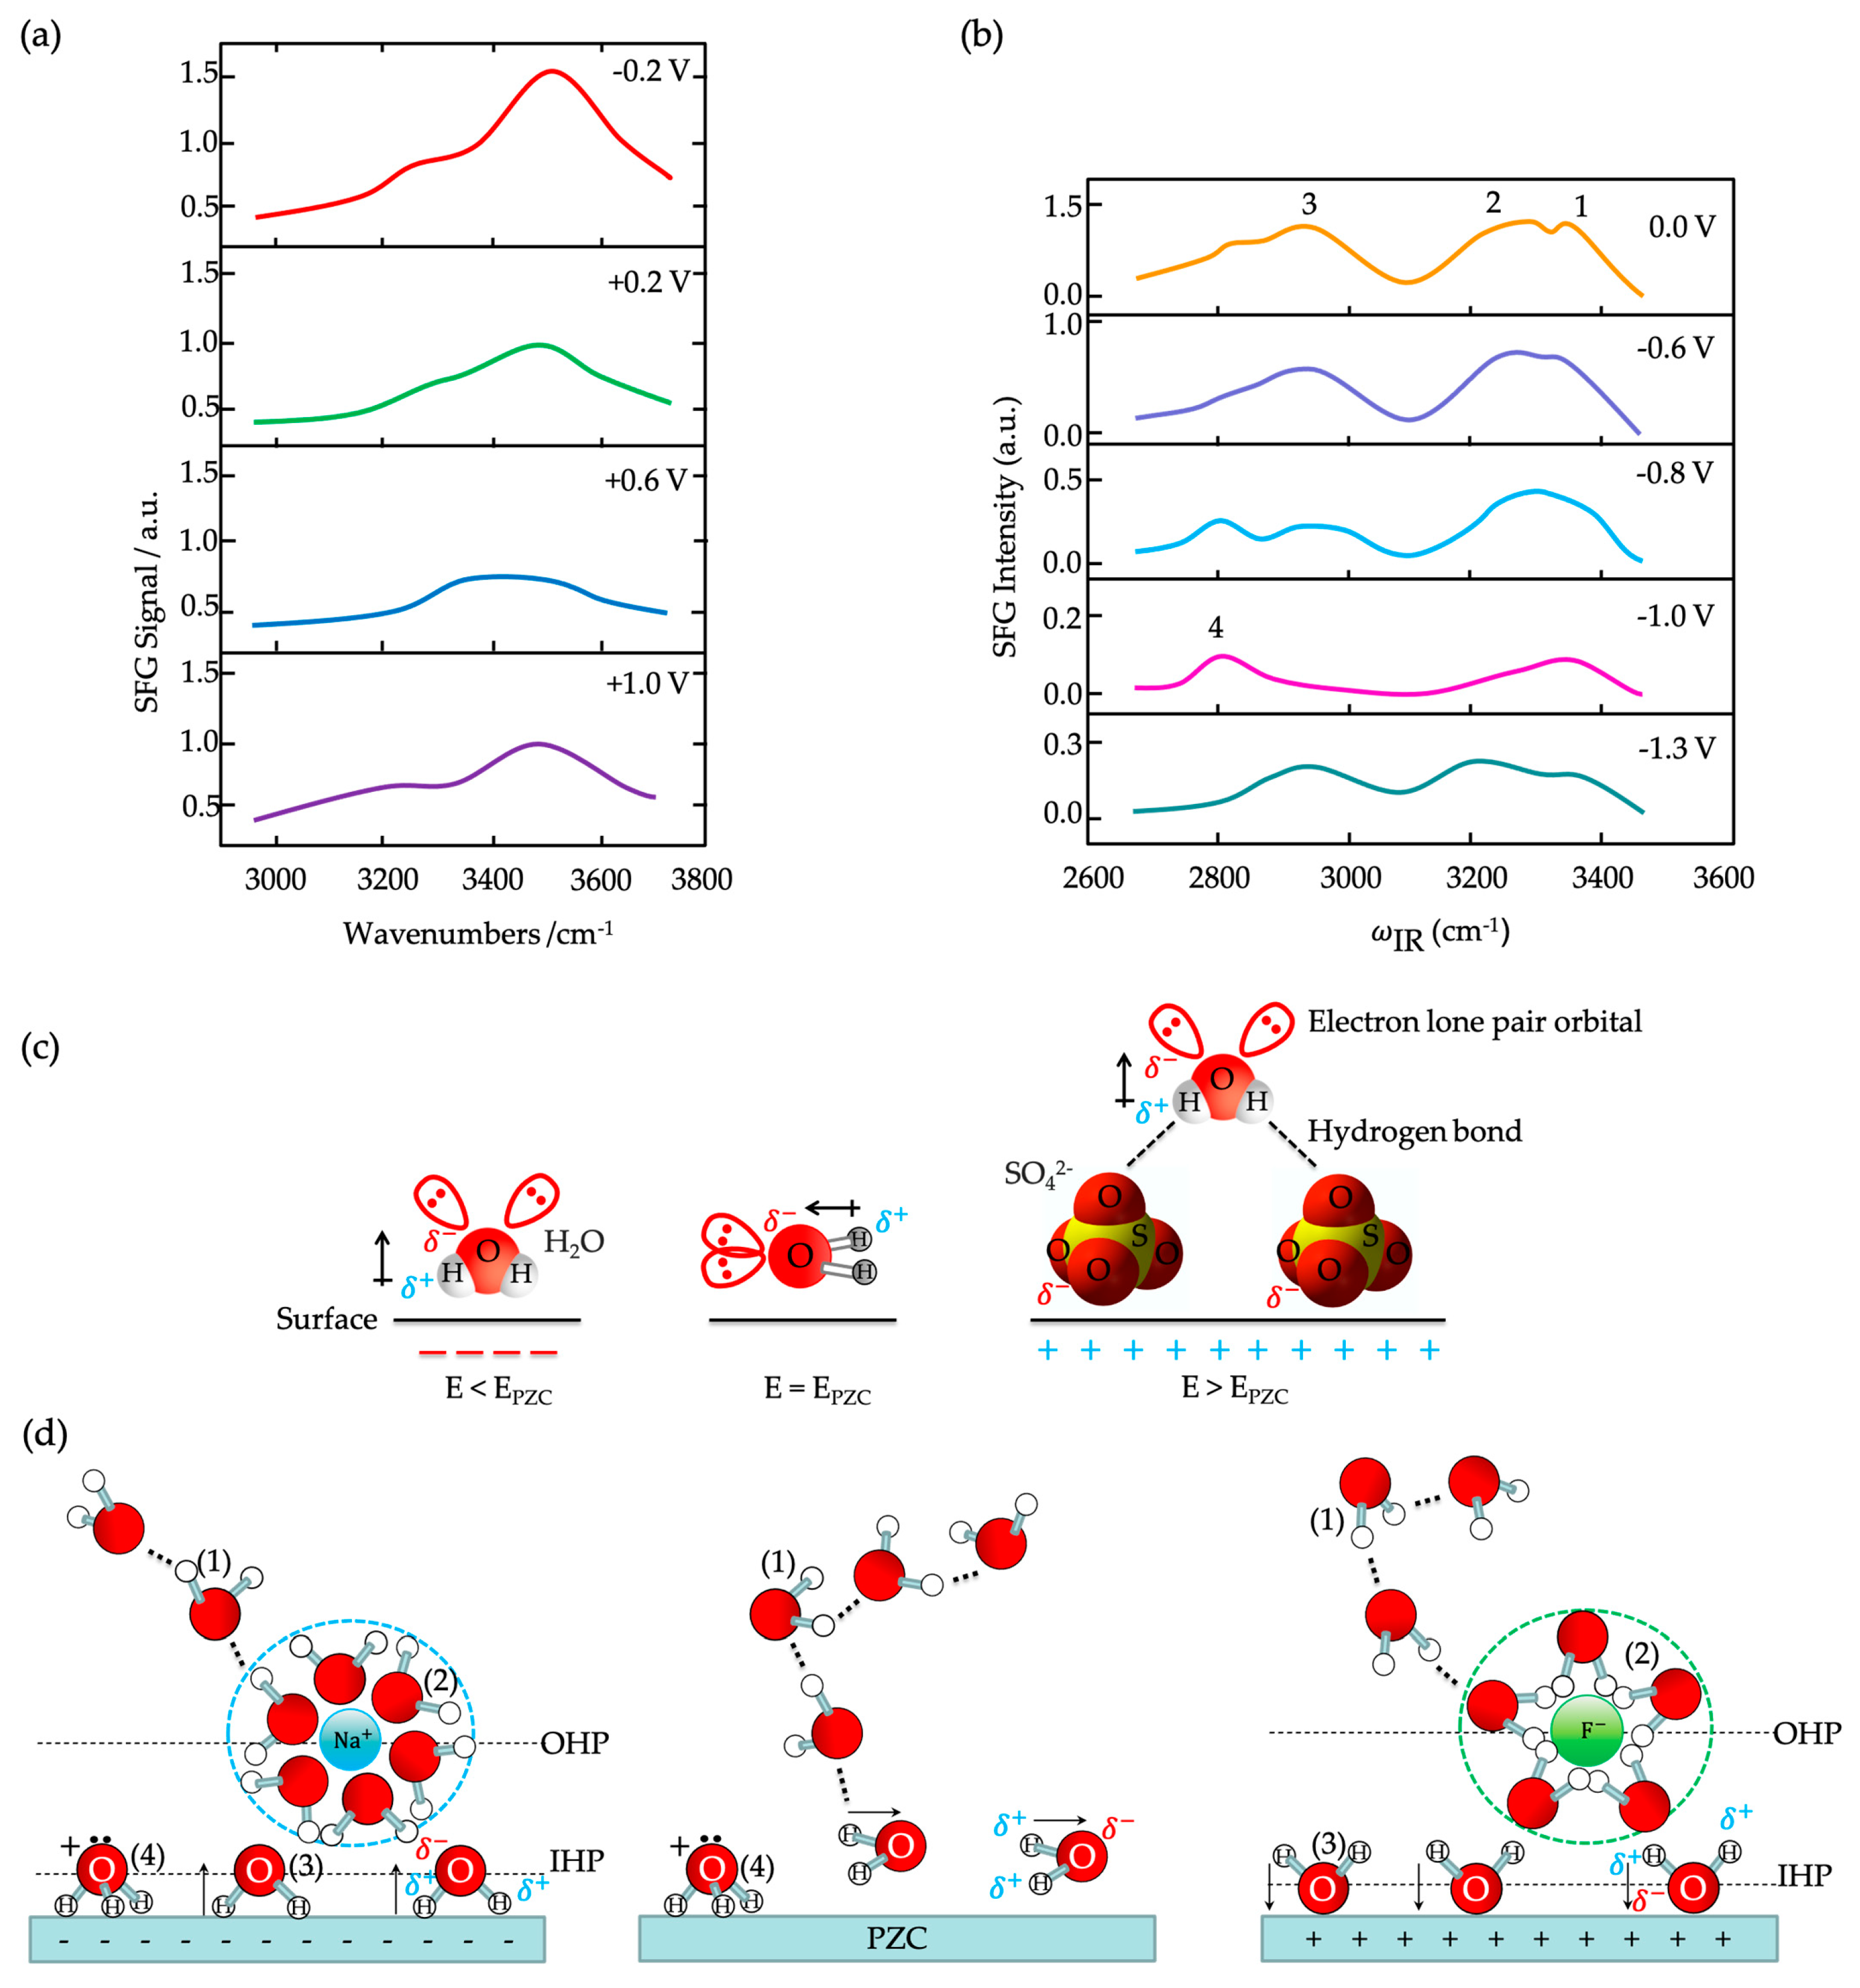
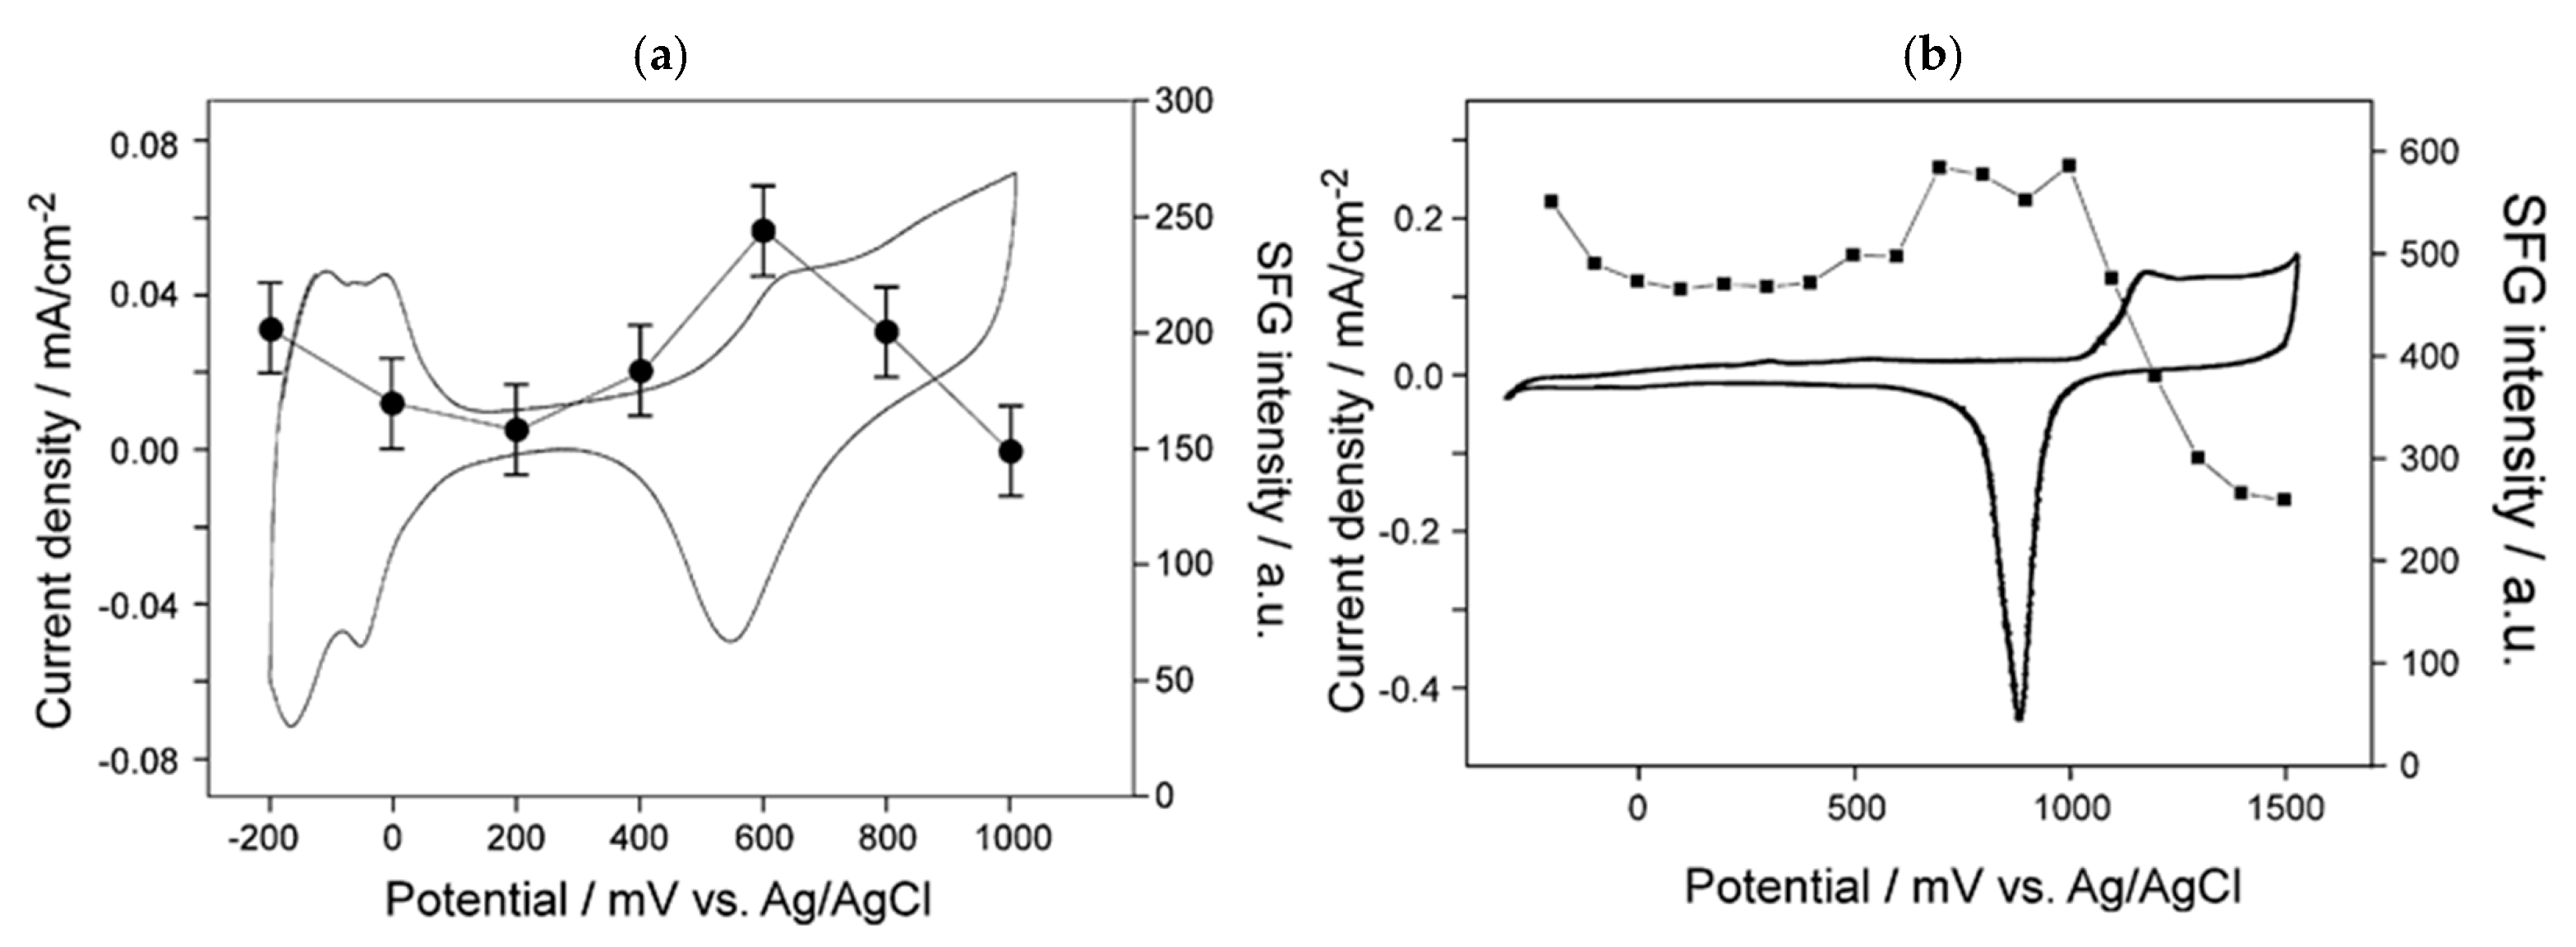
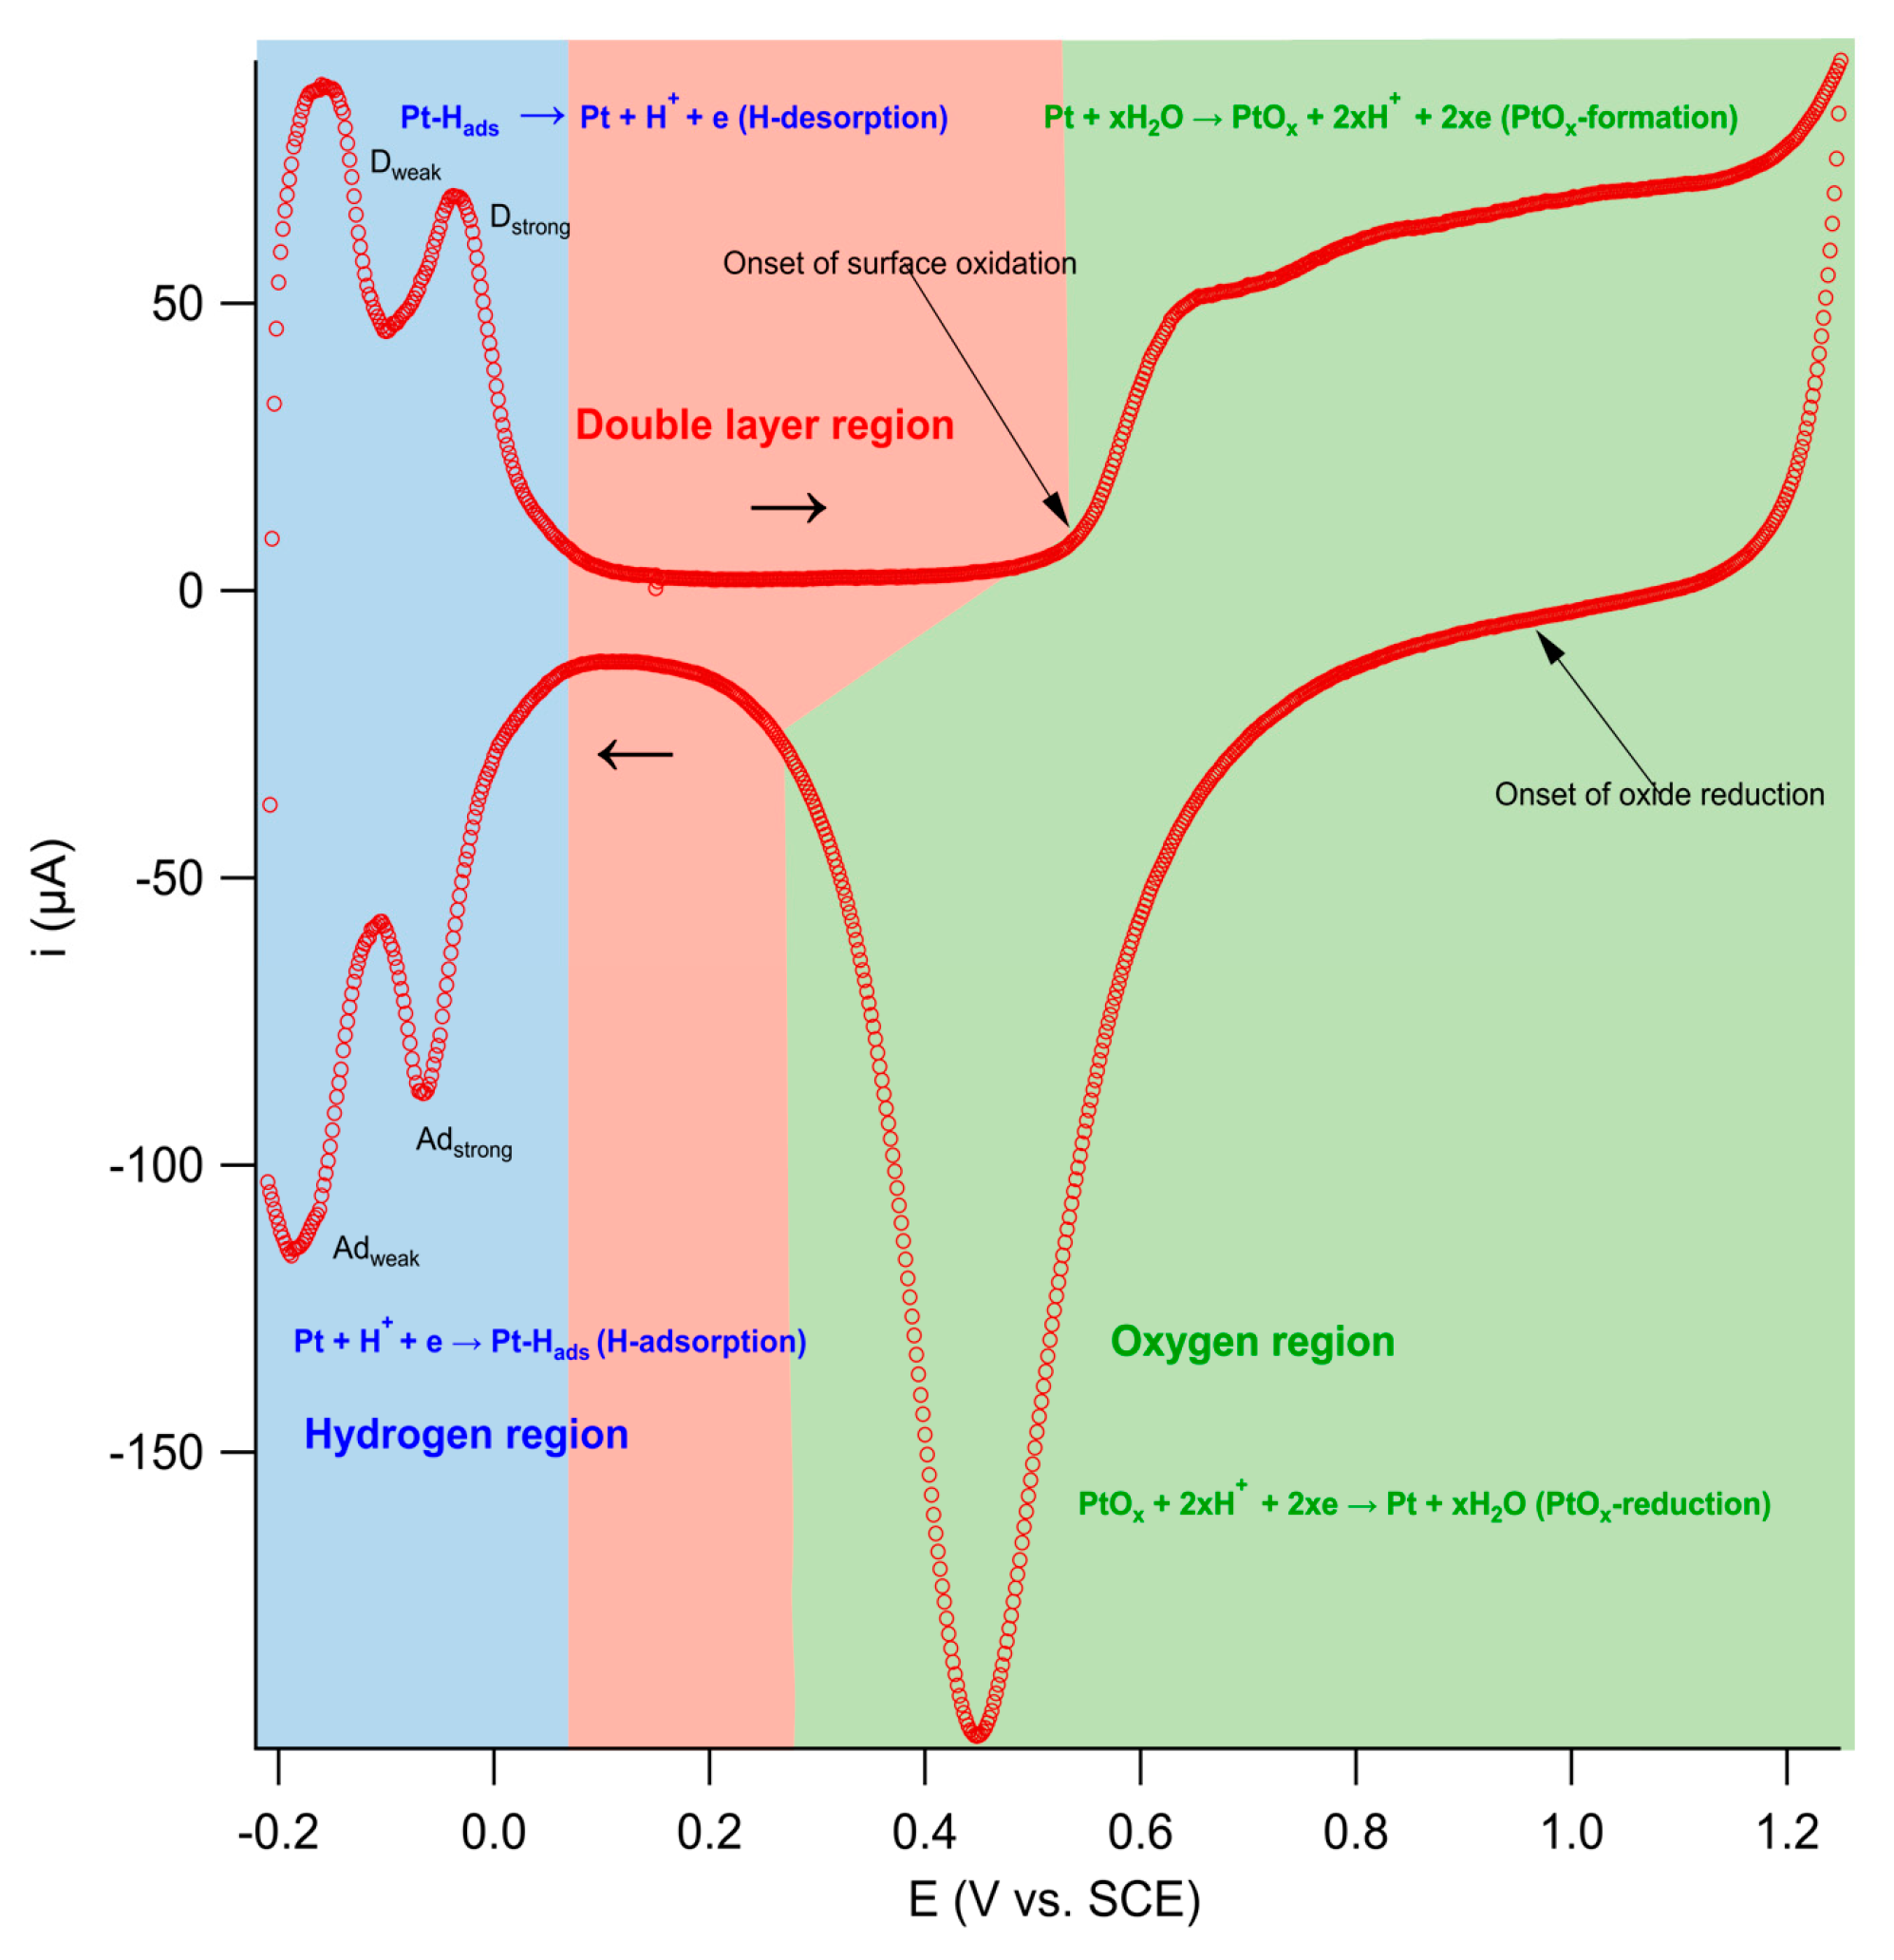
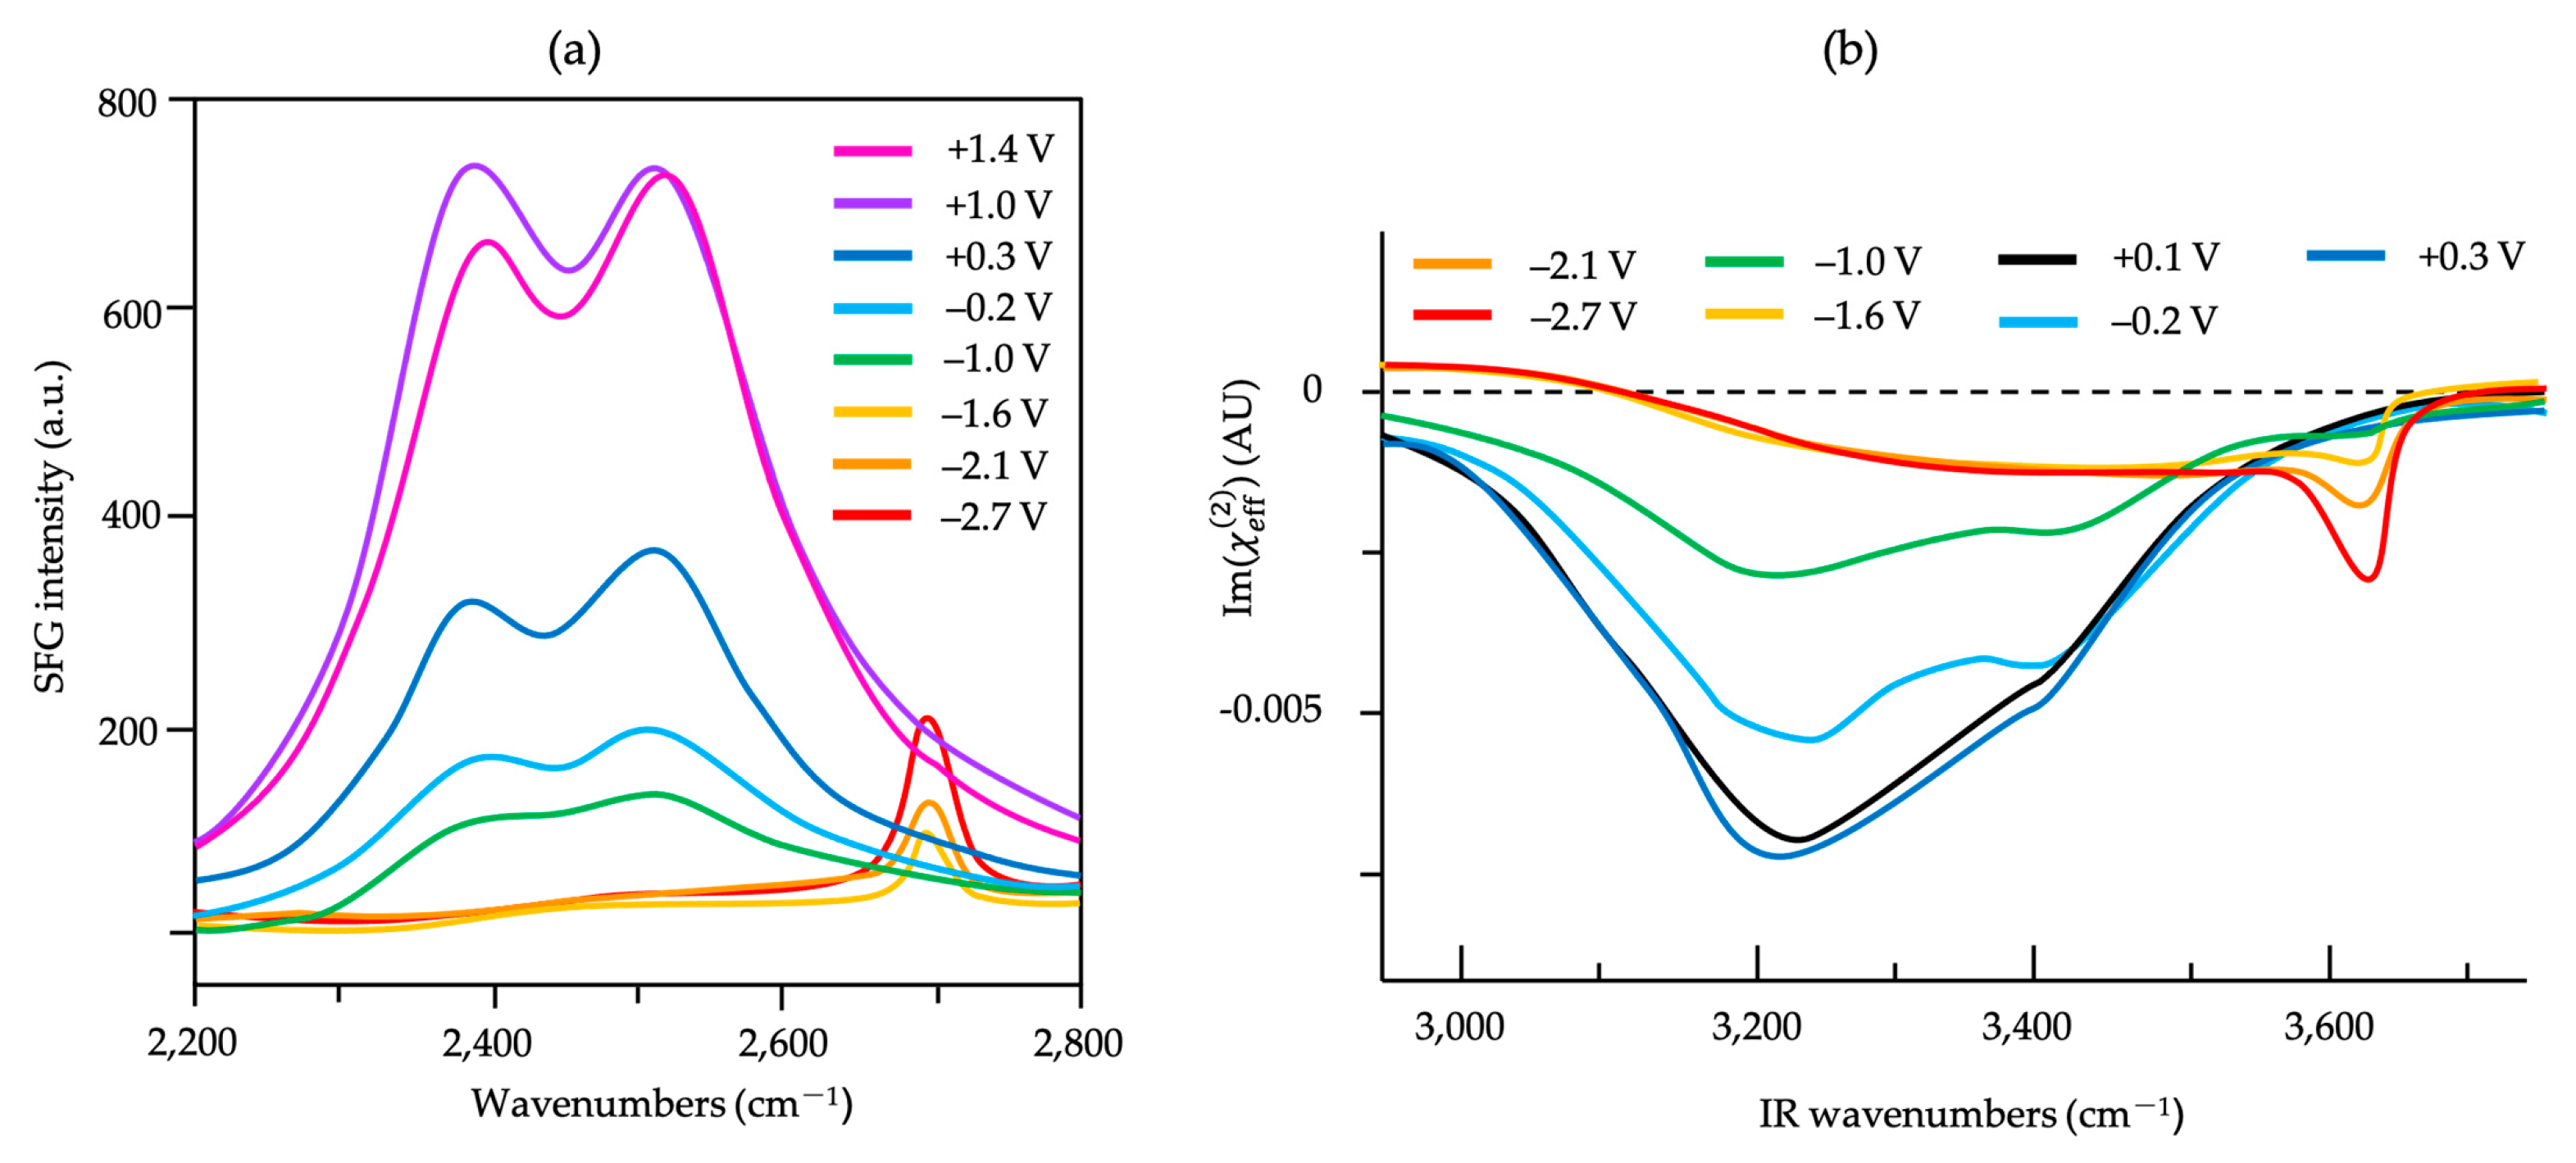
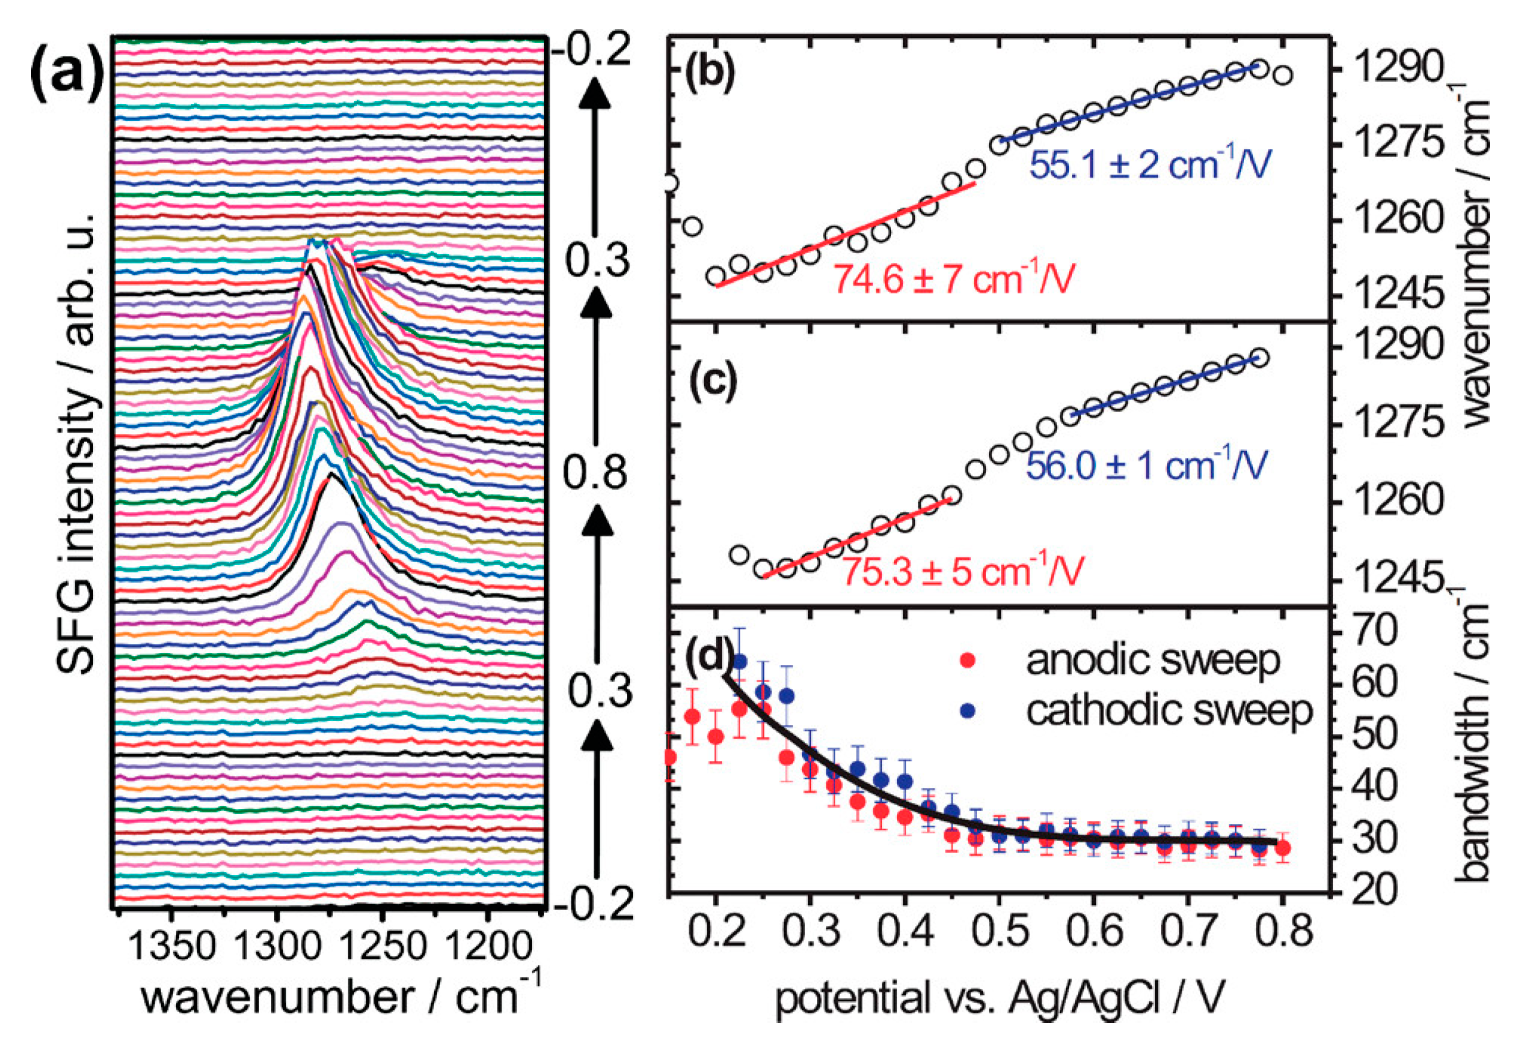
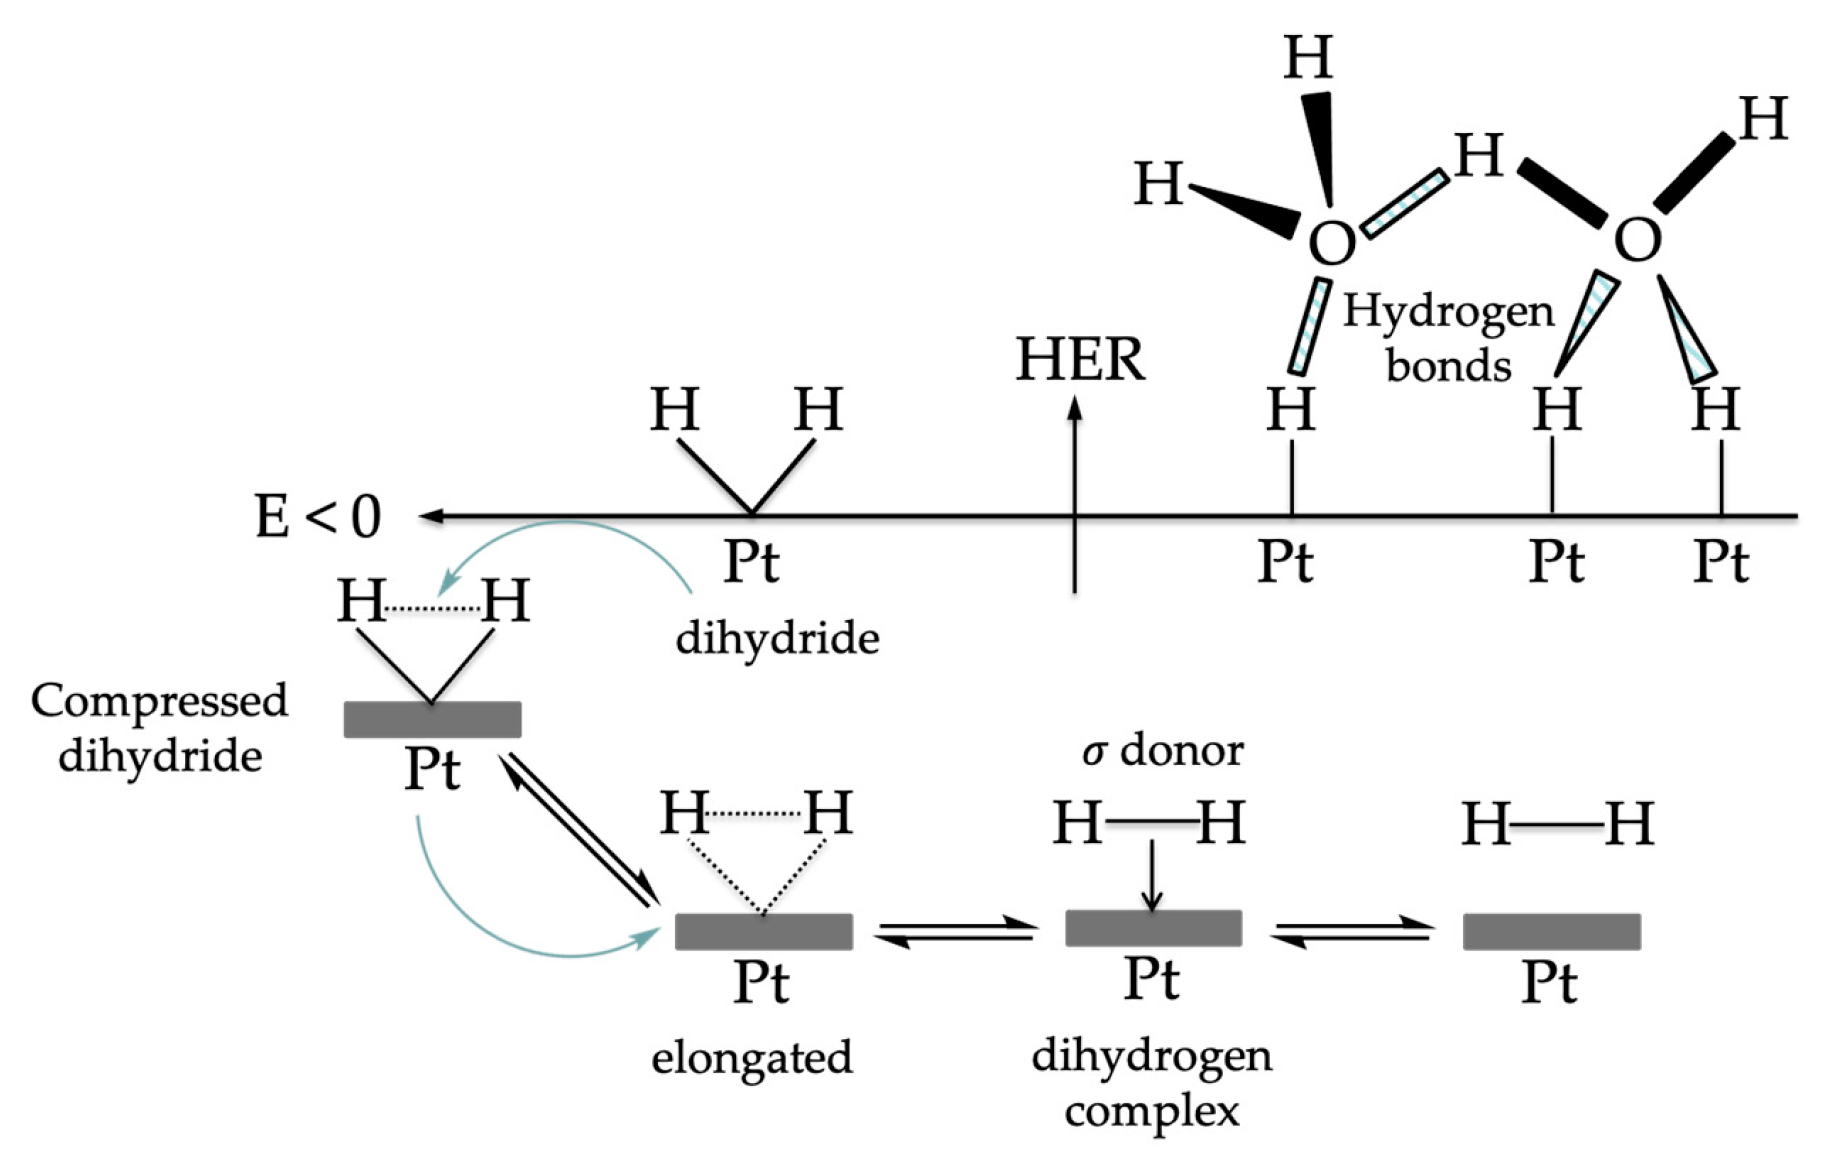
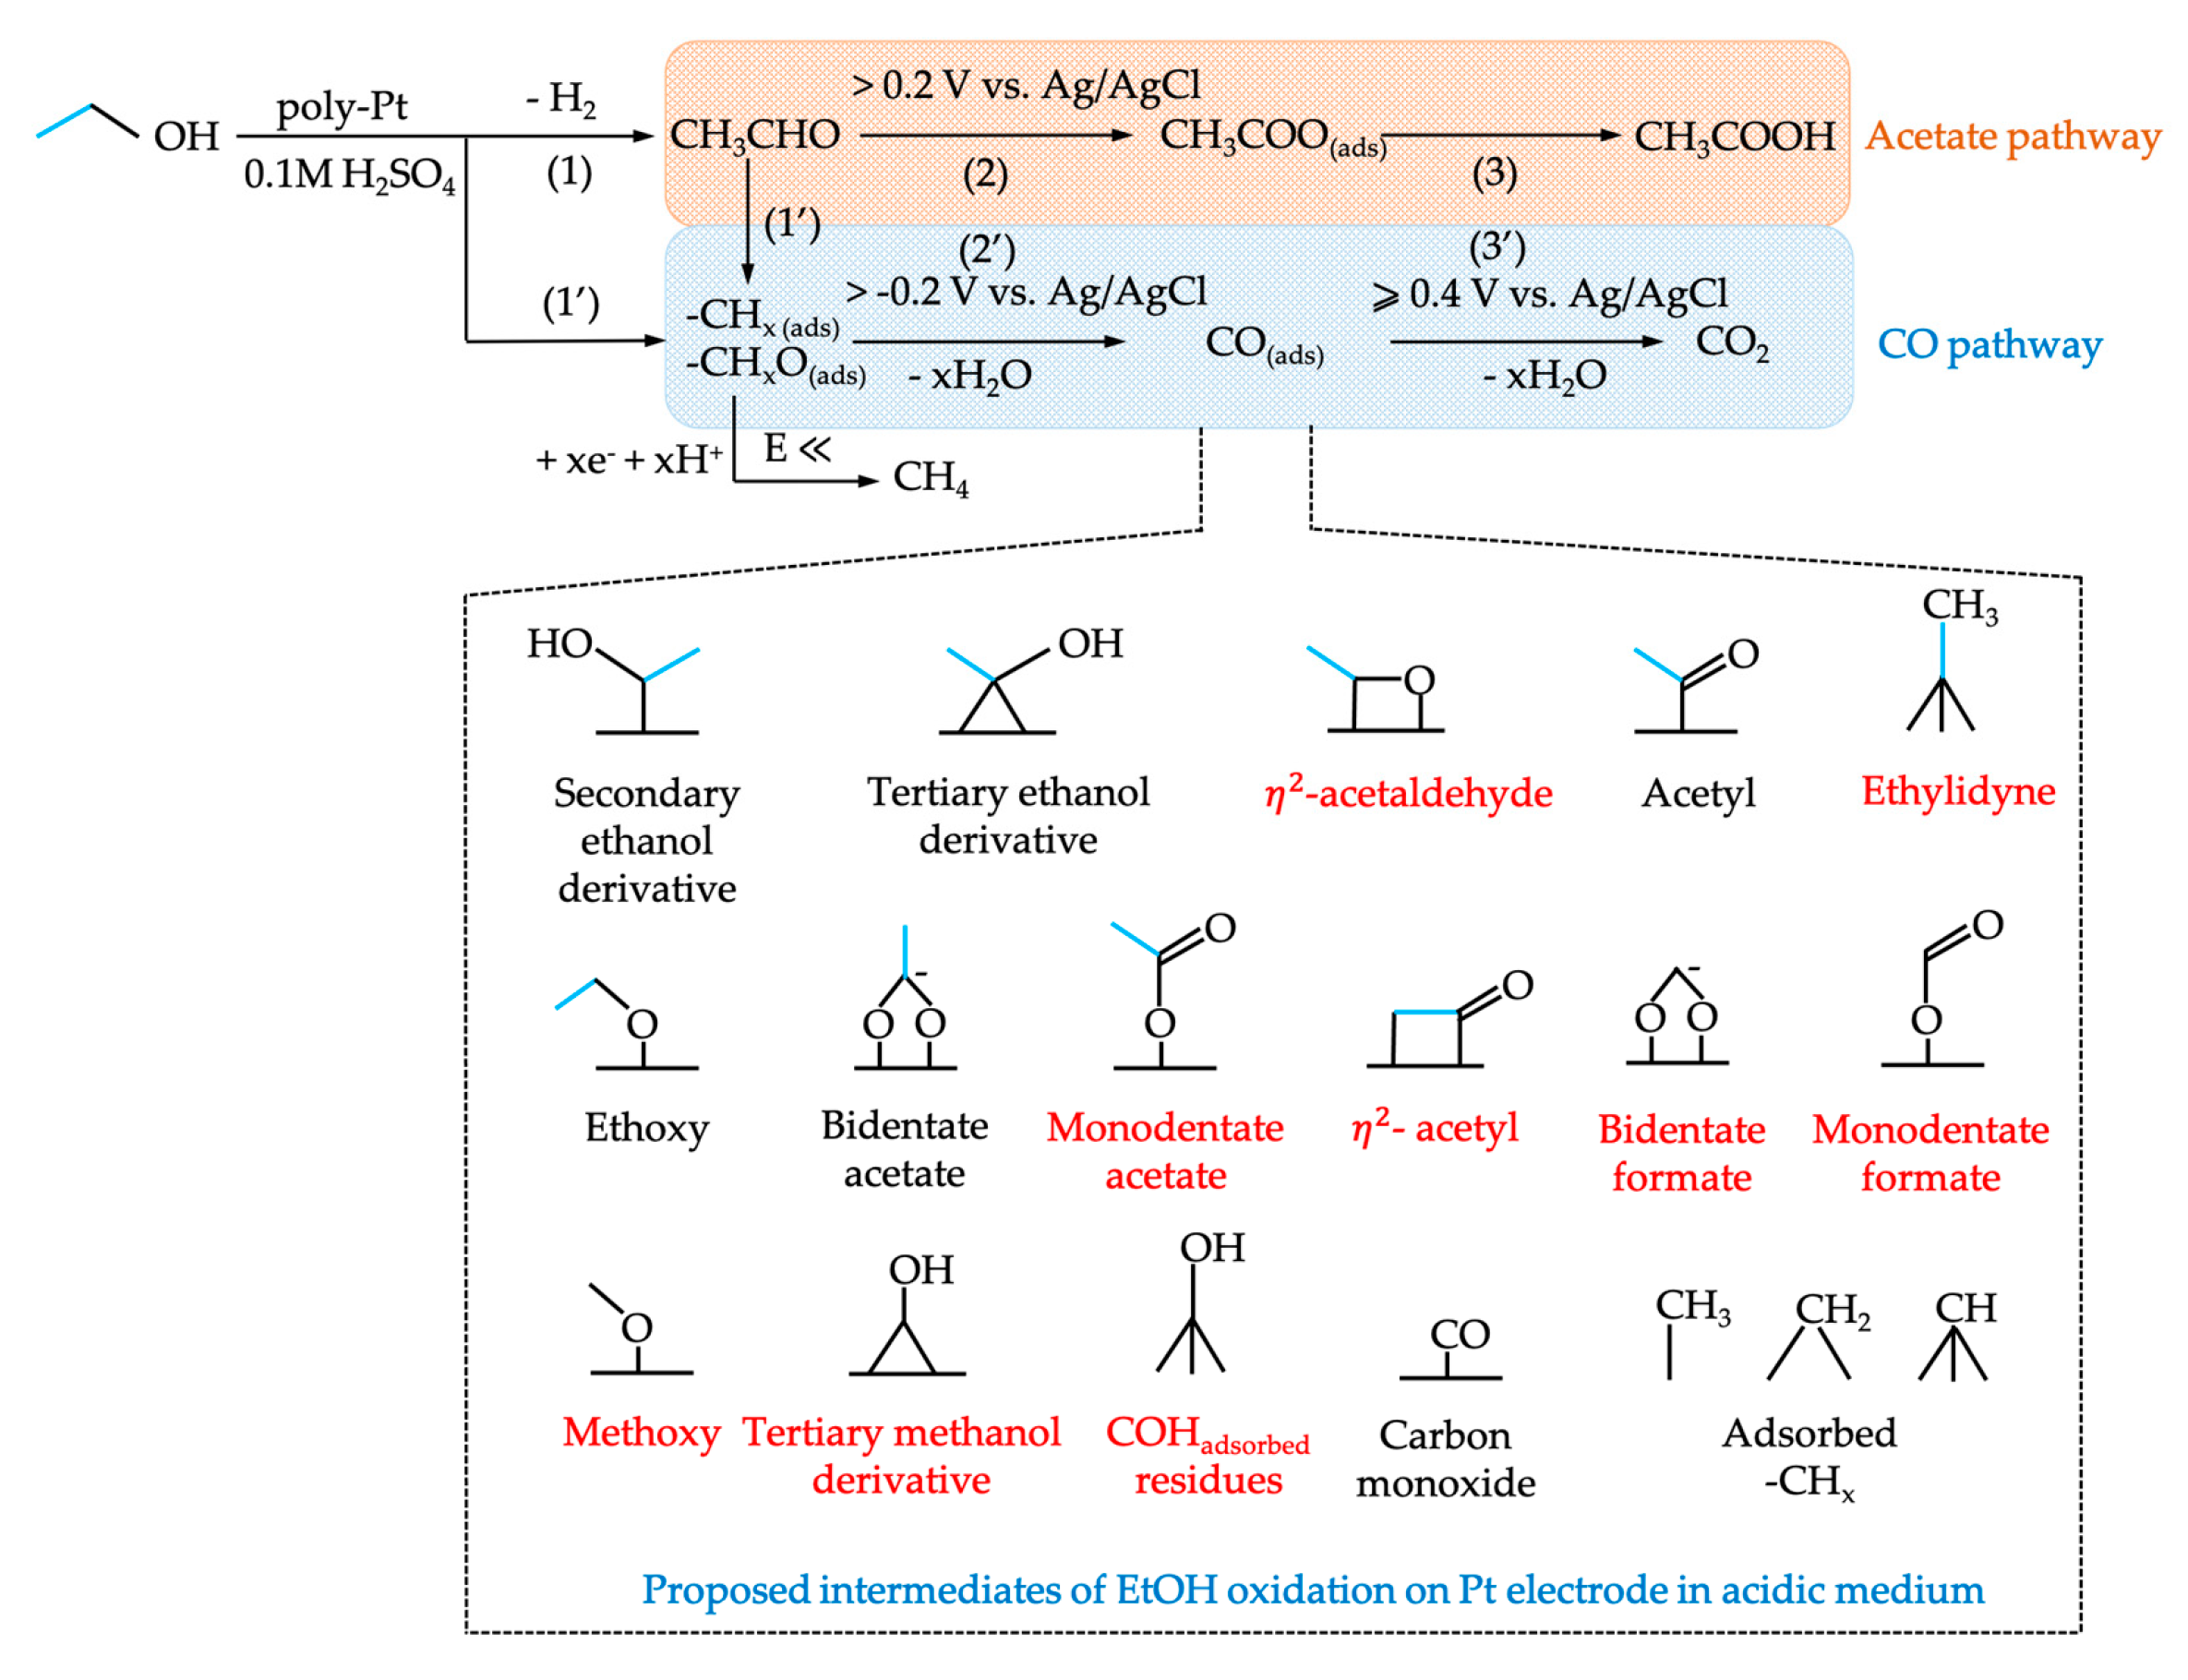
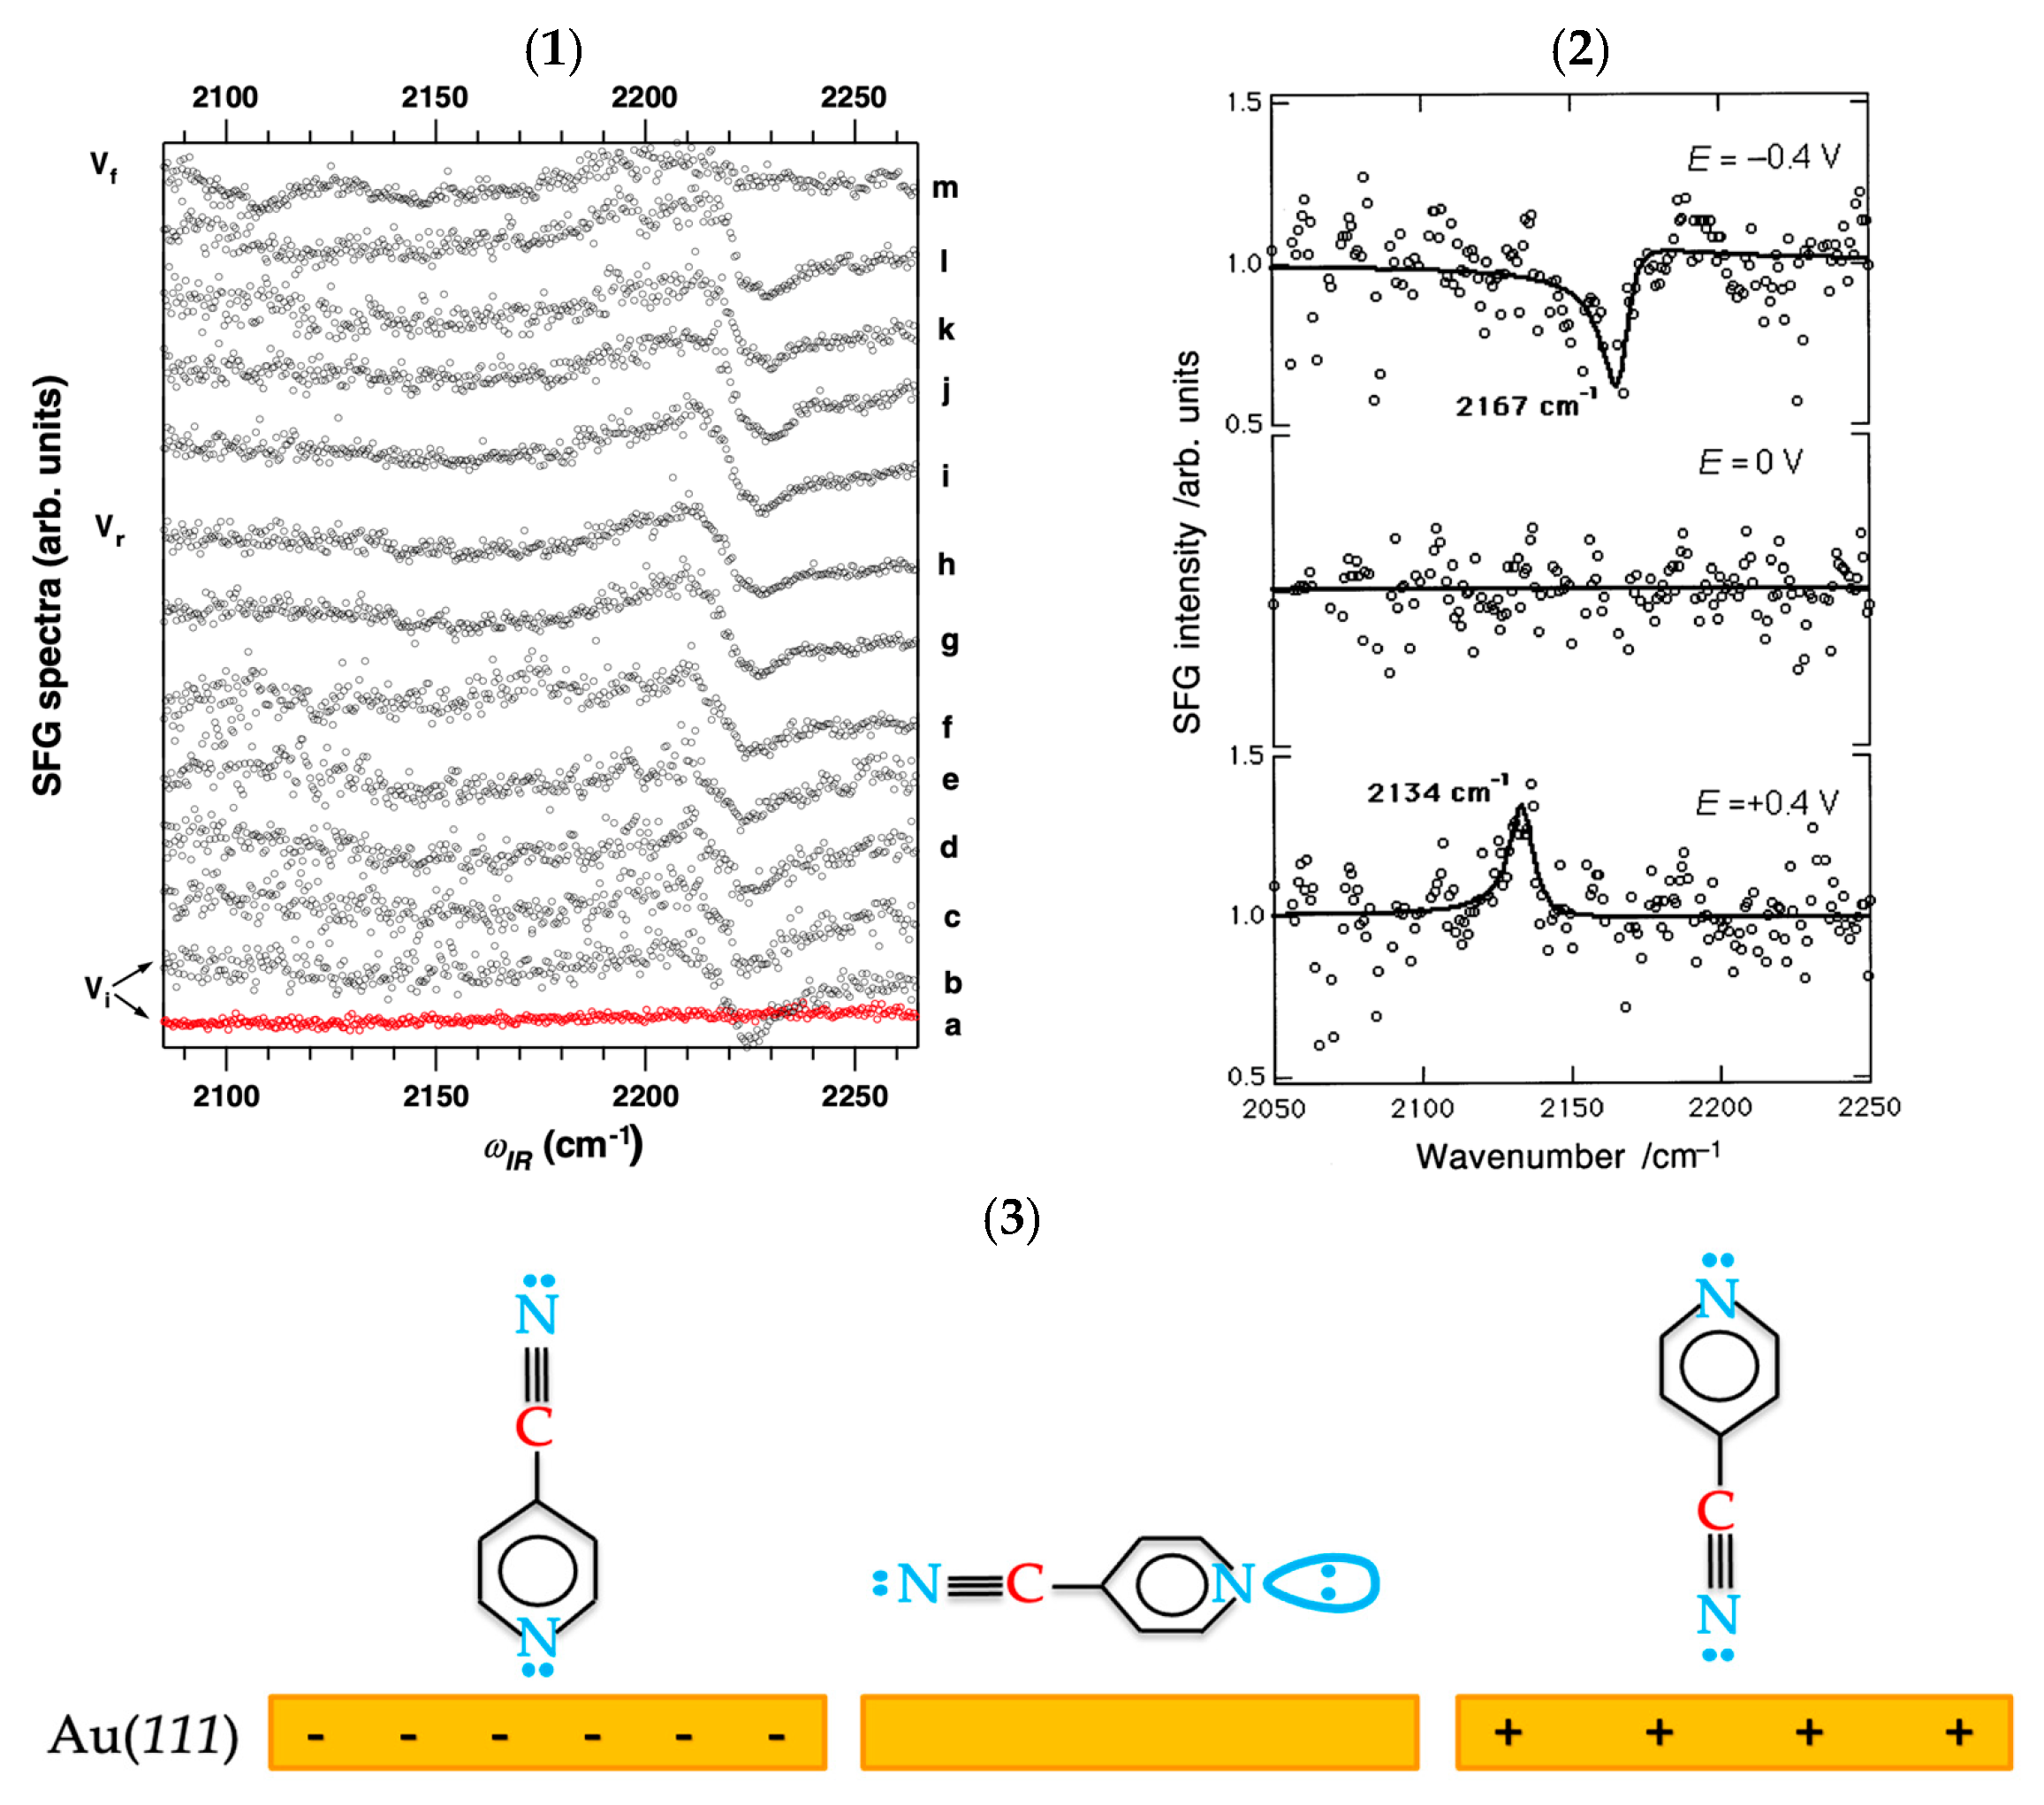
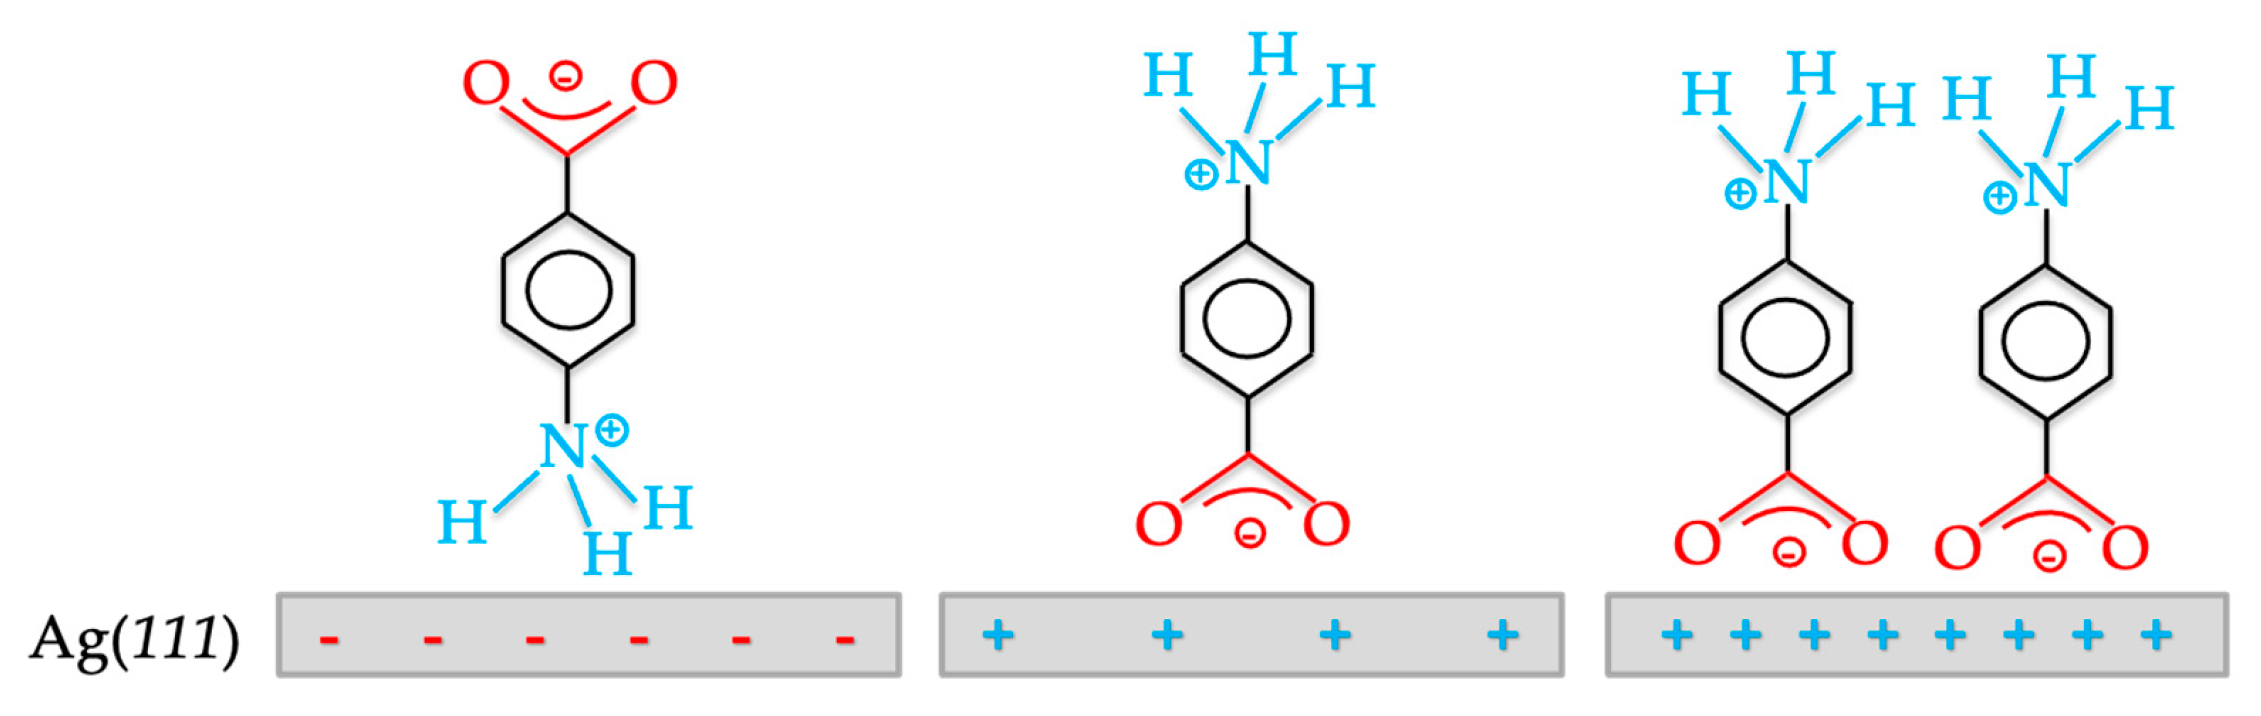
Symmetry 16 01699 g006
Figure 7. Depiction of the first-order (linear) and second-order (quadratic) electric field-induced Stark effect. This figure is adapted from reference [94], Copyright © 2024 Springer Nature.
Symmetry 16 01699 g007
Figure 8. Illustration of an SFG reflection experiment at the air/water interface. Arrows k V i s , k I R , and k S F G refer to the visible, IR, and SFG beams that can interact at various z-planes. θ V i s , θ I R , and θ S F G are the incoming angles of incidence for the visible and IR light, and the angle of reflection for the SFG signal, respectively. The dashed vertical arrows denote their projection along the z-axis, and the relevant phase difference. Dotted horizontal lines represent the probing depth with the Stern layer (red) and diffuse layer (black). The charged surface can be from a monolayer of charged molecules (surfactants or fatty acids). This figure is adapted with permission from reference [104], Copyright © 2016 American Chemical Society.
Symmetry 16 01699 g008
Figure 9. Schemes for sum-frequency generation spectroscopy: (a) ps narrowband SFG, (b) fs broadband SFG, and (c) PS- or HD-SFG. PMT and CCD stand for photomultiplier tube and charge-coupled device, respectively. This figure is adapted from reference [138], Copyright © 2007 Elsevier and [147], Copyright © 2022 World Scientific Publishing.
Symmetry 16 01699 g009
Figure 10. Schematic depictions of the (a) five different commonly used optical configurations for spectroelectrochemical cells: (1) normal transmission mode, (2) parallel transmission mode, (3) external reflectance mode, (4) internal reflectance mode, and (5) back scattered mode; (b) some other surface- and tip-enhanced spectroscopic modes (nanostructure-based mode, ATR-based mode, Tip-based mode, and fiber-based mode); and two typical spectroelectrochemical cells coupled with SFG: (c) internal reflection and (d) external thin layer reflection. Dashed lines indicate the electrode–electrolyte interface. In (a,b), blue and red arrows simply present incident and detected light, respectively. This figure is adapted with permission from reference [152], Copyright © 2018 Elsevier for Figure 10a, reference [153], Copyright © 2024 Royal Society of Chemistry for Figure 10b, and reference [154], Copyright © 2020 AIP Publishing for Figure 10c,d.
Symmetry 16 01699 g010
Figure 11. Schematic configuration of a femtosecond broadband sum-frequency generation spectroscopy (SFG) setup (IR: infrared, Vis: visible) coupled with an external thin-layer spectroelectrochemical cell. WE, RE, and CE represent working electrode, reference electrode, and counter electrode, respectively. CCD is charge-coupled device. This figure is adapted with permission from reference [69], Copyright © 2014 Elsevier.
Symmetry 16 01699 g011
Scheme 1. Mechanism of a charged CaF2 surface formation.
Symmetry 16 01699 sch001
Scheme 2. Mechanism of a charged SiO2 surface formation.
Symmetry 16 01699 sch002
Scheme 3. Mechanism of a charged TiO2 surface formation.
Symmetry 16 01699 sch003
Figure 12. Molecular model of the hydration interface at (a) a neutral oxide surface covered by a carpet of water’s OH groups and (b) an electrically or protonated/deprotonated charged surface. For simplicity of the model, the appearance of aqueous electrolytes is neglected to observe how ice-like water and liquid-like water (water-like) differ. The closest monolayer to the oxide/charged surface (IHP) is the chemisorbed layer of water OH bonds. A subsequent layer is a highly structured ice-like water adlayer possessing an intermingled ordered network with four hydrogen atoms surrounding each oxygen atom in tetrahedral geometry (two hydrogen bonds with 177 pm of bond length, two normal covalent bonds of ≈96–99 pm bond length). The specific trait of this physisorbed immobilized layer (OHP) is the strict restriction of water (low dielectric constant) and hydrated ions’ mobility toward the bulk solution. The farthest water layers (diffuse layer to the bulk) contain liquid-like water molecules with a disordered organization and high mobility of water/hydrated ions (higher dielectric constant). Thus, some bulk water molecules potentially exhibit dangle OH bonds. Between the ice-like and water-like layer, the so-called “coexistent layer” is a transitional monolayer characterized by a higher dipolar screening of water compared to the ice-like layer, but ions are non-specifically adsorbed and hydrated (low mobility). This figure is inspired by references [233,234].
Symmetry 16 01699 g012
Figure 13. Schematic representation of SFG-electrochemical cell arrangement for the study of the electrochemical interface. This figure is reprinted with permission from reference [158], Copyright © 2014 the Proceedings of the National Academy of Sciences (PNAS).
Symmetry 16 01699 g013
Figure 14. Potential dependent SFG spectra in the OH stretching region and their cartoon illustrations of the interfacial water structure on (a,c) Au thin film surface in 0.01M H2SO4 solution and (b,d) Ag(100) surface in 0.1 M NaF solution. Numbers denote associated peak labels. (a,b) are adapted from fitted curves of references [245], Copyright © 2004 Elsevier and [247], Copyright © 2005 American Chemical Society, respectively. (c) is adapted from the reference [245], with adjustments to the water’s dipole moment direction (arrow points from the hydrogen atoms (δ+) to the oxygen atom (δ)) and (d) is more detailed with layers of the EDL.
Symmetry 16 01699 g014
Figure 15. SFG signal of interfacial water molecules on (a) Pt electrode and (b) Au electrode in HClO4 solutions with their corresponding cyclic voltammogram acquired with a sweep rate of 50 mV∙s—1. This figure is reprinted with permission from references [249], Copyright © 2008 Elsevier for (a) and [159], Copyright © 2009 Royal Society of Chemistry for (b).
Symmetry 16 01699 g015
Figure 16. Cyclic voltammogram (CV) of a polycrystalline Pt(poly) electrode in 0.5 M H2SO4, scan rate: 50 mV∙s−1. While there are three distinctive regions in the Pt(poly) electrode, including the hydrogen region (Pt-H with a strong and a weak adsorption/desorption peak), oxygen region (Pt-OHad/des and Pt-Oad/des), and a sandwiched double layer region (ad and d/des are adsorption and desorption, respectively), it appears without hydrogen adsorption/desorption in the Au electrode (only double layer region and oxide region with the formation/reduction of Au oxide species). This figure is obtained from our own CV measurements.
Symmetry 16 01699 g016
Figure 17. (a) SFG spectrum of non-hydrogen bonded water and (b) its potential-dependent water structure representation. Dotted lines indicate hydrogen bonds. This figure is adapted from reference [254], Copyright © 2017 Wiley.
Symmetry 16 01699 g017
Figure 18. The bias-dependent SFG spectra of interfacial water species in the (a) OD stretch spectral region at the graphene/D2O interface and (b) OH stretch region at the graphene/H2O interface. This figure is adapted from fitted curves of reference [110], Copyright © 2021 Springer Nature for (a) and [257], Copyright © 2023 Springer Nature for (b).
Symmetry 16 01699 g018
Figure 19. (a) Consecutive series of broadband SFG spectra of (bi)sulfate adsorption on Pt(111) in 0.1 M H2SO4. Electrode potentials E (V) are indicated on the right-hand side. (b,c) Stark tuning for anodic and cathodic scans of the band in (a), respectively. (d) Bandwidth of the (bi)sulfate band in (a). SFG spectra were recorded with 5s acquisition time and during a scan rate of 5 mV∙s−1. This figure is reprinted with permission from reference [266], Copyright © 2010 American Chemical Society.
Symmetry 16 01699 g019
Figure 20. The Pt-H configuration at different electrodepositions (underpotential and overpotential of the HER). At the underpotential of the HER, the dimer of water from the EDL binds with three Pt-H bonds via hydrogen bonding while the dihydride Pt complex acting as a HER intermediate is present at the overpotential. This figure is adapted from reference [238,270], Copyright © 1995 AIP Publishing and [271,272], Copyright © 2011 Elsevier.
Symmetry 16 01699 g020
Figure 21. SFG spectra of the CO layer deposited from diluted CO solution in HClO4 on Pt(110) electrode for applied potential (vs. Ag/AgCl, 3M KCl) ranging from (a) −800 mV to −50 mV and (b) −50 mV to 1.0 V. Lines are fitting curves of the data. The same SFG intensity scale is for all spectra. This figure is reprinted with permission from reference [119], Copyright © 2016 American Chemical Society.
Symmetry 16 01699 g021
Figure 22. Proposed mechanism of EtOH oxidation and its intermediates on a Pt(poly) electrode in an acidic medium based on potential-dependent SFG analysis. The stereochemical configuration of adsorbed intermediates is not considered in this scheme. η k refers to hapticity, the coordinated number of a ligand to a metal center through “ k contiguous multiple” atoms in coordination complexes. Newly detected adsorbed intermediates are highlighted in red, and the original C-C bond in the EtOH molecule in C2 intermediates is marked in blue. The remaining are C1 intermediates. This figure is based on references [264,277].
Symmetry 16 01699 g022
Figure 23. (a) Potential-dependent SFG spectra of 0.05 M Na2SO4 solution purged with Ar, (b) potential-dependent SFG spectra of 0.05 M Na2SO4 solution purged with CO2(g), and (c) pH-dependent SFG spectra of 50 mM Na2CO3 solutions. All applied potentials are compared to Ag/AgCl reference electrode. This figure is reprinted with permission from reference [299], Copyright © 2023 Royal Society of Chemistry.
Symmetry 16 01699 g023
Figure 24. (1) SFG spectra of the HC≡C-CN/Au(111) interface at several applied electrode potentials vs. NHE: (a) Vi = +0.10 V, without HCCCN in the electrolyte, (b) Vi = +0.10 V, (c) + 0.16 V, (d) +0.22 V, (e) +0.30 V, (f) +0.38 V, (g) +0.46 V, (h) Vr = +0.50 V, (i) +0.10 V, (j) 0 V, (k) −0.20 V, (l) −0.50 V, (m) −1.0 V; (2) SFG spectra of the 4-cyanopyridine/Au(111) interface at three different potentials vs. Ag/AgCl. Continuous lines are the fitted curves; (3) sketch of molecular orientation of 4-cyanopyridine on Au(111) electrode at different potentials. Figure 24(1,2) are reproduced with permission from reference [300], Copyright © 2008 Elsevier for (1) and [302], Copyright © 2001 Elsevier for (2). Figure 24(3) is adapted from reference [138], Copyright © 2007 Elsevier.
Symmetry 16 01699 g024
Figure 25. Graphical representation of the potential-induced orientation of p-aminobenzoic acid on Ag(111) electrode in 0.1 M KF solution. This figure is adapted from reference [306], Copyright © 2005 American Chemical Society.
Symmetry 16 01699 g025
Table 1. Vibrational spectroscopies (IR absorption, Stokes Raman scattering, SFG) in comparison.
CriteriaIR AbsorptionRaman ScatteringSFG
Order of susceptibility χ ( 1 ) ω I R χ ( 3 ) ω V i s , ω V i s ,   ω χ ( 2 ) ω I R , ω V i s
Selection rule μ Q v 0 0 α Q v 0 0 μ Q v 0 α Q v 0 0
IR resonance ω I R -resonant non   ω I R -resonant ω I R -resonant
VIS resonance non   ω V i s -resonant ω V i s -resonant 1 ω V i s -resonant 2
Coherencecoherentincoherentcoherent
Optical configurationdirectionaldiffuseddirectional
Surface selectivitynon surface-specificnon surface-specificintrinsically high
Detection sensitivityHigh but not intrinsicLow 3High
Reference spectra substractionYesYesNo
1 when ω p u m p ω e l e c t r o n i c   e x c i t e d   s t a t e , 2 doubly resonant with respect to IR and Vis beams, 3 high for surface-enhanced Raman spectroscopy (SERS) or shell-isolated nanoparticle-enhanced Raman spectroscopy (SHINERS).
Table 2. The relevant standard (vs. RHE) and “effective” reduction potentials of CO2RR (vs. SHE) at pH 7.0, 25 °C [295,296,297]. RHE: reversible hydrogen electrode, SHE: standard hydrogen electrode.
No.Half-Electrochemical Thermodynamic ReactionsE° (V), pH = 0E°′ (V), pH = 7
(1)CO2(g) + e  CO2−1.500−1.900
(2)CO2(g) + 2H+(aq) + 2e  HCOOH(aq)−0.198−0.613
(3)CO2(g) + 2H+(aq) + 2e  CO(g) + H2O(l)−0.110−0.520
(4)CO2(g) + 4H+(aq) + 4e  HCHO(aq) + H2O(l)−0.070−0.485
(5)2H+(aq) + 2e  H2(g)0.000−0.414
(6)CO2(g) + 6H+(aq) + 6e  MeOH(aq) + H2O(l)0.030−0.384
(7)2CO2(g) + 12H+(aq) + 12e  H2C=CH2(g) + 4H2O(l)0.064−0.350
(8)2CO2(g) + 12H+(aq) + 12e  EtOH(aq) + 3H2O(l)0.084−0.330
Table 3. Two possible mechanisms of HER enhancement by CO2 purging.
(1) Interfacial pH buffering (water as the primary proton donor)
2H2O(l) + 2e  H2(g) + 2OH(aq) K = 10 2 E H 2 O / H 2 0 0.0592 = 10 2 E 2 H + / H 2 0 0.0592 K W 2 (39)
CO2(aq) + OH(aq) HCO3(aq) K b 2 1 = K a 1 K W 1 = 10 7.65 (40)
HCO3(aq) + OH(aq) H2O(l) + CO32−(aq) K b 1 1 = K a 2 K W 1 = 10 3.67 (41)
(2) Direct H2CO3/HCO3 reduction (H2CO3/HCO3 as the primary proton donor)
2CO2(aq) + 2H2O(l) + 2e  H2(g) + 2HCO3(aq) K = K K b 2 2 (42)
2HCO3(aq) + 2e  H2(g) + 2CO32−(aq) K = K K b 1 2 (43)
Disclaimer/Publisher’s Note: The statements, opinions and data contained in all publications are solely those of the individual author(s) and contributor(s) and not of MDPI and/or the editor(s). MDPI and/or the editor(s) disclaim responsibility for any injury to people or property resulting from any ideas, methods, instructions or products referred to in the content.

