1. Introduction
The organized, practical, and scientific preventive maintenance work of mechanical equipment can result in a lower failure rate. And according to a reasonable PM plan, spare part production and supply can also be arranged properly, which avoids the incidents that spare parts are often still in transit when machines break down. This prevents delays in replacing failed parts, potentially reducing the risk of prolonged machine downtime and significant cost losses. Therefore, to improve the efficiency and quality of safe operation and extend the service life, minimizing the influence on mechanical systems brought by failure and working out a preventive maintenance (PM) plan have become urgent problems to be solved.
After years of development and evolution of preventive maintenance models, there are many kinds of PM policies, including the age-dependent PM policy [
1,
2,
3,
4], the periodic PM policy [
5,
6,
7], the failure-limit PM policy [
8], the sequential PM policy [
9], the repair-limit PM policy for single-unit systems [
10], and the on-condition PM policy for single and multi-unit systems [
11,
12,
13,
14,
15], etc. Where the practical application in engineering is concerned, considering the difficulties in the implementation of preventive maintenance, the failure-limit PM policy and the repair-limit PM policy are not widely used alone. Comparatively speaking, the age-dependent PM policy, the periodic PM policy, and the sequential PM policy are simpler and easier to carry out, which reduces the complexity of the process of preventive maintenance work and the determination of time between PMs. The equal time between PMs in age-dependent PM policy and periodic PM policy leads to a decrease in reliability with increasing maintenance times. So, a more effective method named reliability-centered maintenance (RCM) [
16,
17,
18,
19] is offered to save maintenance resources and costs.
In the related research of RCM, the PM optimization model considering the failure rate is getting more and more attention. Stringer et al. [
20] point out that failure rate trends in maintenance planning decisions may reduce the risk of premature failure and prevent unnecessary costs associated with repairing or replacing equipment. The papers [
21,
22,
23] also point to the importance of considering time-varying failure rates in reliability-centered maintenance decisions. However, few RCM studies consider the variation in failure rates caused by both maintenance and precession work periods. In actual engineering, the uncertainty caused by the asymmetry of data on past maintenance and failures is also an important factor affecting the PM optimization results, and how to take it into account in the optimization model is a problem that needs to be solved.
Accordingly, focusing on single-component mechanical equipment, a reliability-centered PM optimization model is put forward in this paper. Failure rates over time due to both factors are considered simultaneously in this model, and the uncertainty in the failure data is measured using a Weibull distribution. The contributions of this paper include the following: (i) Theoretically, the proposed reliability-centered PM optimization model takes both the sudden change in reliability and the changes in the failure rate into account to describe the maintenance effect and considers the variation in failure rates to quantify the uncertainty of data on past maintenance and failures. (ii) Practically, the preliminary optimization of preventive maintenance for mechanical equipment has been achieved, and a more scientific and reasonable preventive maintenance plan has been formulated, providing support for the adjustment of preventive maintenance plans and a basis for future preventive maintenance work in mechanical equipment company. The structure of this paper is organized as follows:
Section 2 describes the preventive maintenance problem to be addressed. In
Section 3, a model of failure rate variation considering the effects of both maintenance and precession work periods is presented to provide a basis for reliability-centered maintenance optimization models.
Section 4 introduces two types of PM optimization models: minimizing costs or maximizing availability.
Section 5 illustrates the validity of the proposed model using a type of tire-building machine in MESNAC as a case study.
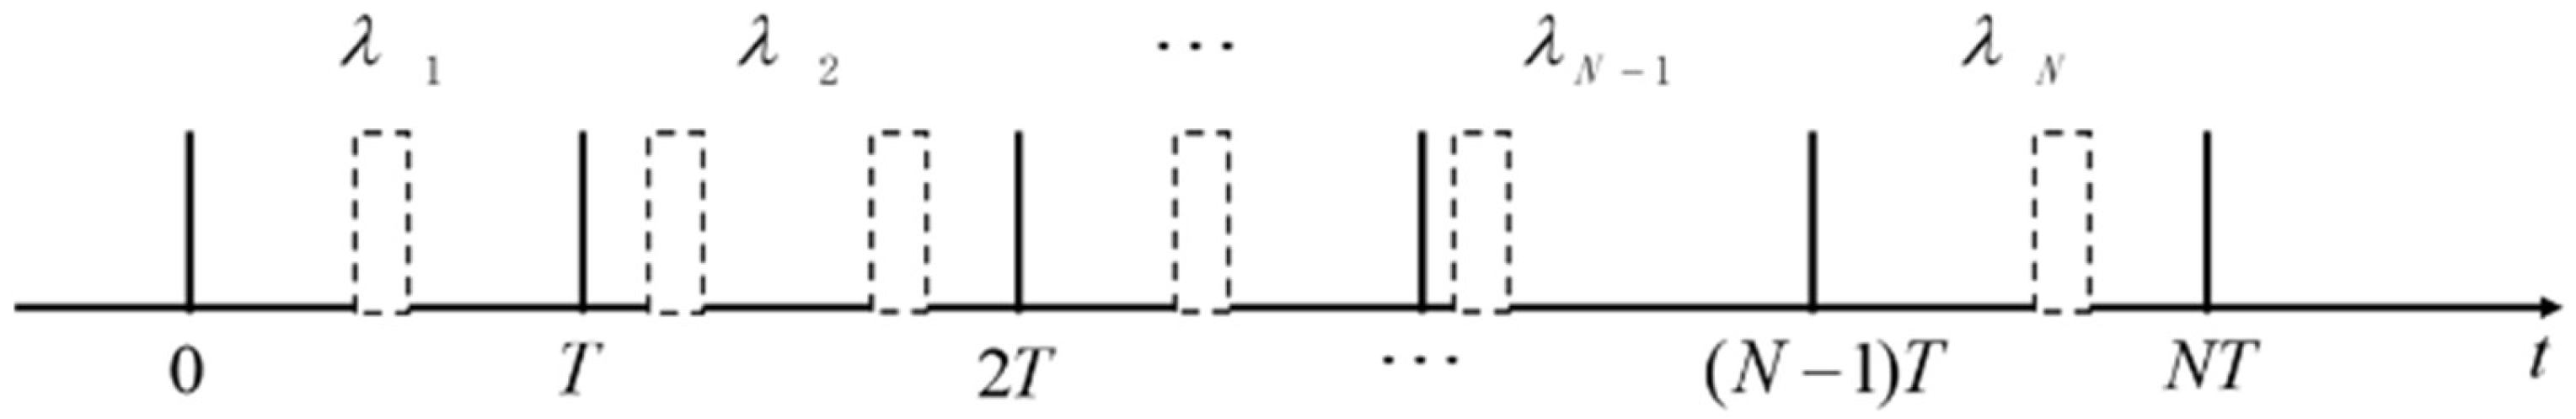
2. Problem Description for PM Optimization
Considering the operability of preventive maintenance, a combined PM policy is examined. Under this type of policy, as shown in
Figure 1, we suggest that at a fixed time
, preventive maintenance is taken. If failure happens in preventive maintenance, corrective maintenance is taken. A unit is replaced when the
nth preventive maintenance needs to be taken. At each preventive maintenance, the reliability of a working unit is no less than the minimum reliability of a working unit and assuming the following:
A unit is put into operation at a new state from the beginning;
The preventive maintenance is imperfect, which means a unit cannot be as good as its new condition after the preventive maintenance and will obey the combined model of age-declining model and failure-rate-increasing model;
The corrective maintenance is minimal, which means the failure rate remains the same before and after the corrective maintenance;
Replacement is perfect maintenance, which means a unit becomes as good as new after replacement.
These assumptions regarding our model are detailed and explained in the remainder of this section. The state of a unit is assumed to be new from the beginning of its operation. This is a commonly used assumption when developing maintenance plans. The development of maintenance plans often occurs before the equipment is put into operation. At this time, neglecting the defective equipment that may have not been detected, the equipment is generally in a new state. Moreover, there are three assumptions related to the effect of maintenance. It is somewhere between as good as new and as bad as old. There are many possible causes for imperfect maintenance, such as the repair of the wrong part, only partial repair of the faulty part, repair of the faulty part but damage of an adjacent part, or incorrect assessment of the inspected unit condition [
24]. Therefore, the preventive maintenance, the corrective maintenance, and the replacement are assumed to be imperfect, minimal, and perfect, respectively, which is more realistic. One or several of these assumptions are also made in the research mentioned earlier, for example, [
1,
2,
3,
4,
5,
6,
7].
Figure 1.
Preventive maintenance policy.
Figure 1.
Preventive maintenance policy.
3. Failure Rate Model for Reliability-Centered Maintenance Optimization Models
To establish the reliability model, the failure rate is used to describe the reliability of a unit before and after preventive maintenance through the life distribution function and the maintenance effect function. Therefore, a method is provided to determine the reliability index and solve the failure frequency in the PM optimization model.
In reliability, common procedures are usually based on the assumption that the data follow a Weibull distribution [
25]. For mechanical equipment, mainly the declining type of failure, considering the asymmetry of the failure data, the Weibull distribution is used to describe the failure rate in a typical way [
26]:
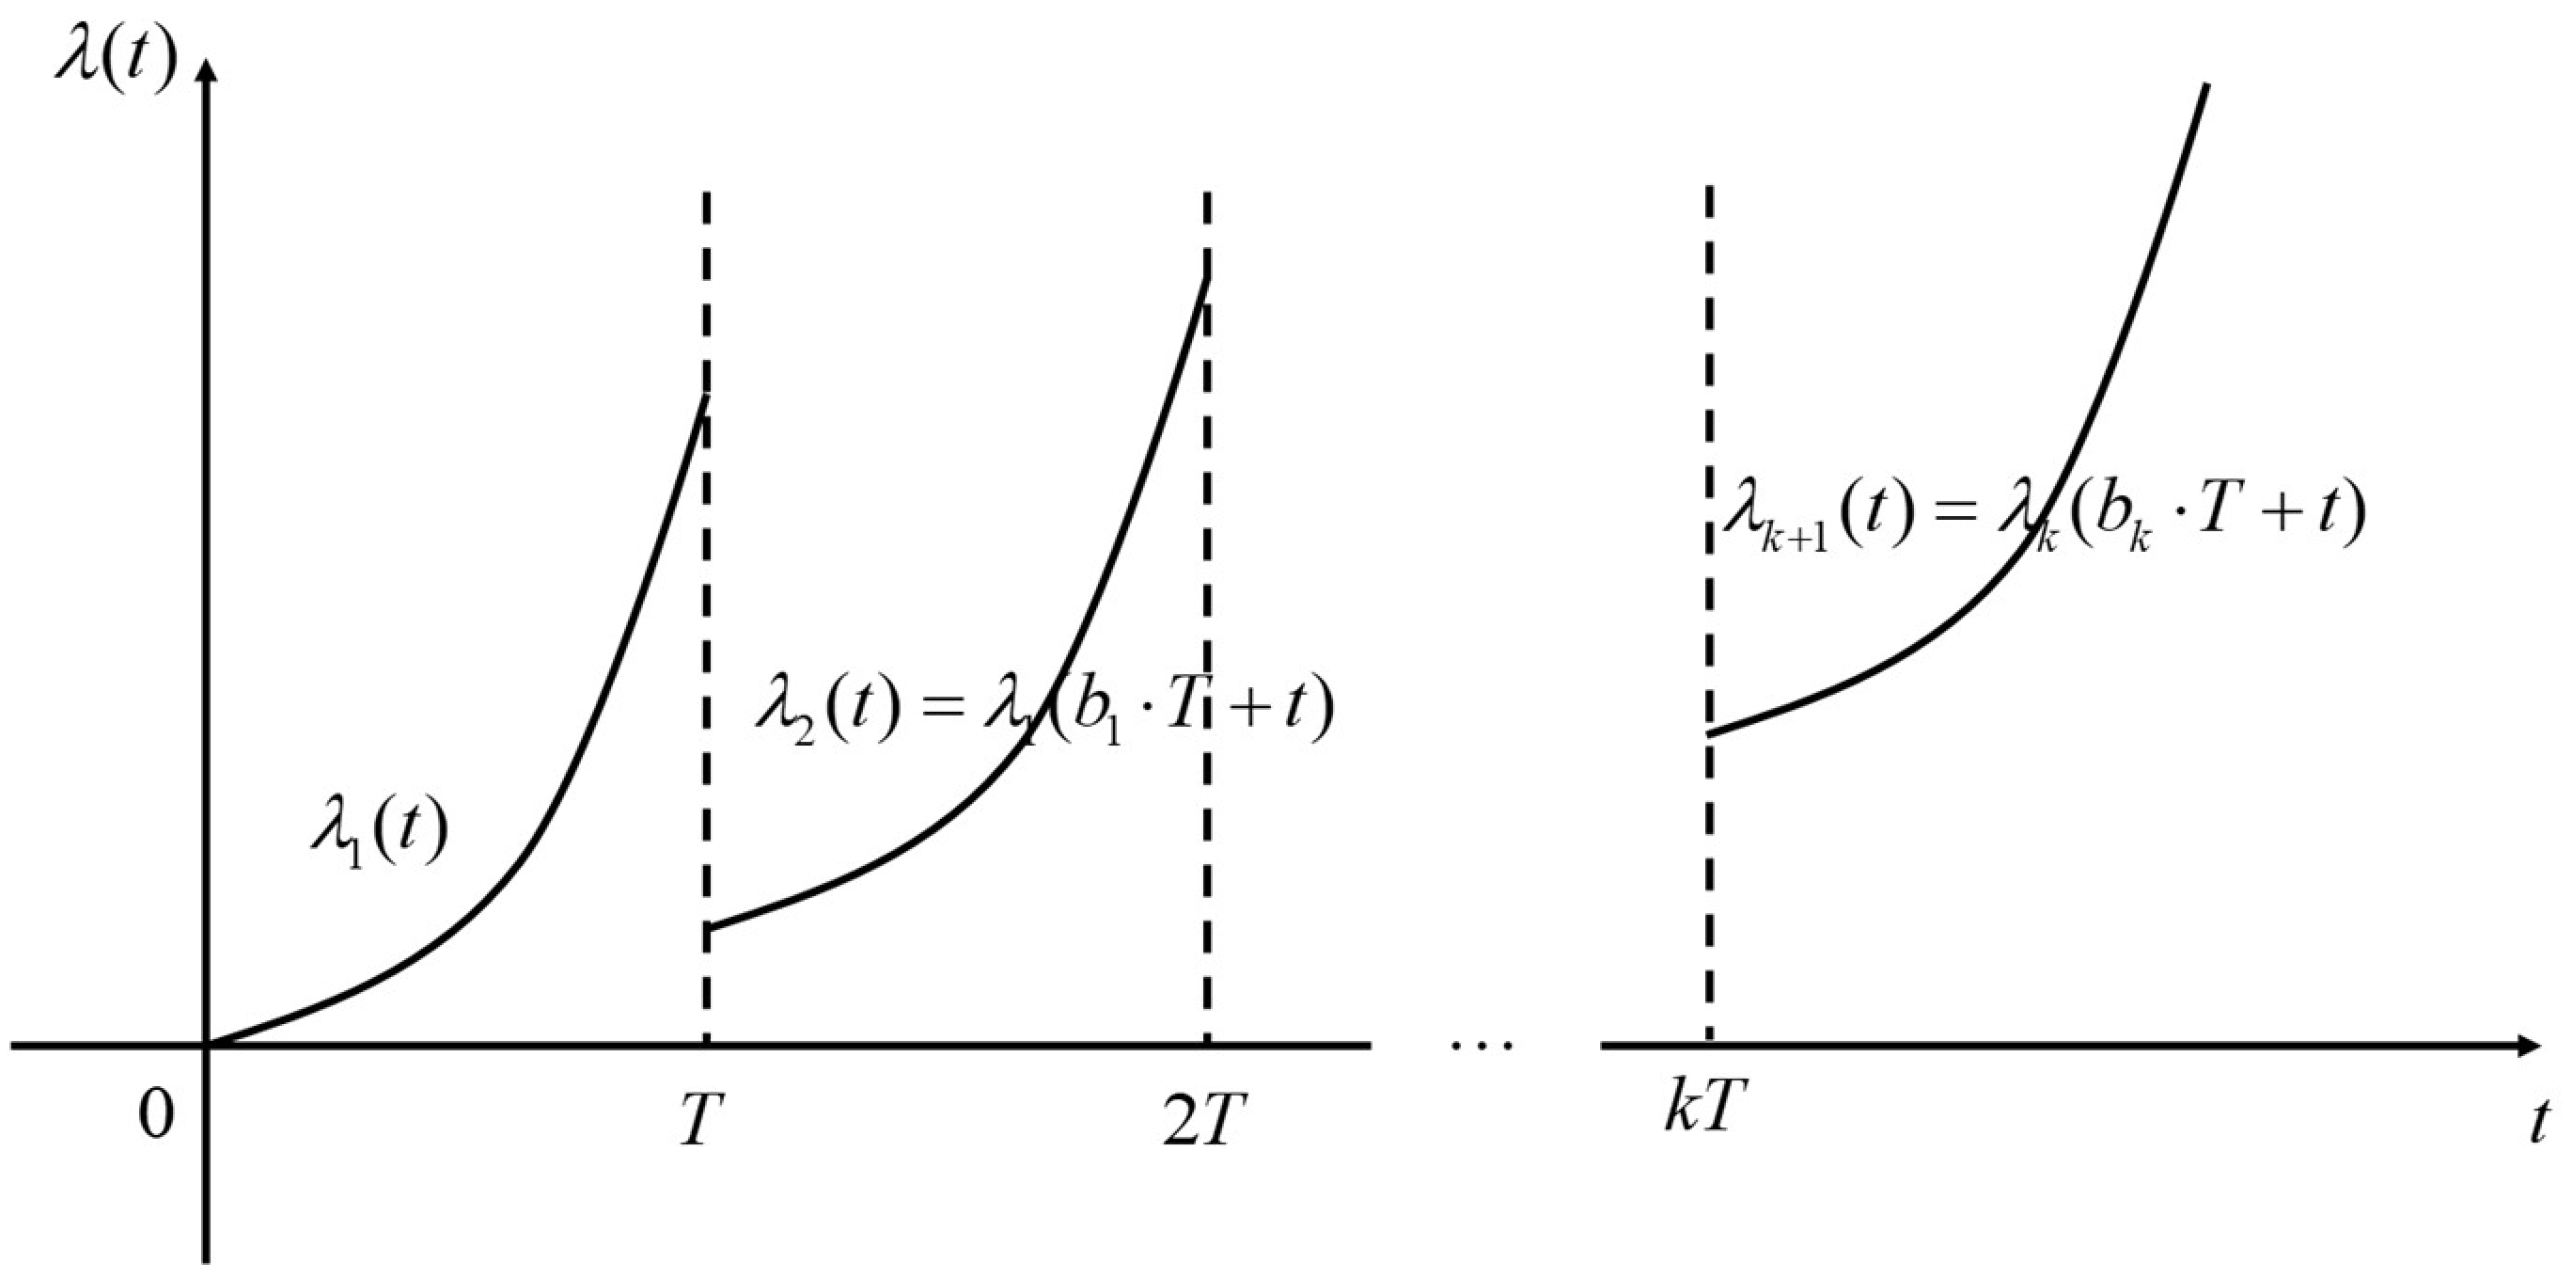
In practice, the reliability of a unit is not always the same, especially after preventive maintenance; the unit cannot be restored to its original. So, based on the life distribution function, we need to further describe the effect of restoration after preventive maintenance to show the reliability of a unit. The restoration degree of a unit’s reliability caused by maintenance can be understood as a maintenance effect and expressed as a function.
During the running of a unit, preventive maintenance is mostly imperfect. The condition of a unit can be improved after preventive maintenance but cannot totally recover back to its original condition. Therefore, the age-declining model [
27] is used to describe the reliability of the moment after maintenance.
In the age-declining model, an age-declining factor is introduced, and the changes in failure rate describe the maintenance effect, which is expressed as follows:
The age of a unit is declined to be
(
) times lower than before. At the same time, the initial failure rate after preventive maintenance is
instead of zero, as shown in
Figure 2.
However, after preventive maintenance, a unit’s change in condition is not only reflected in the moment but also in the whole process of work after maintenance. Therefore, the failure-rate-increasing model [
28] is used to describe the reliability during the subsequent working period after maintenance.
In the failure-rate-increasing model, a failure-rate-declining factor is introduced, and the changes in failure rate describe the maintenance effect as well, which is expressed as follows:
The initial failure rate after preventive maintenance is still zero, but the rate of change in the failure rate is increased to be
(
) times higher than before, as shown in
Figure 3.
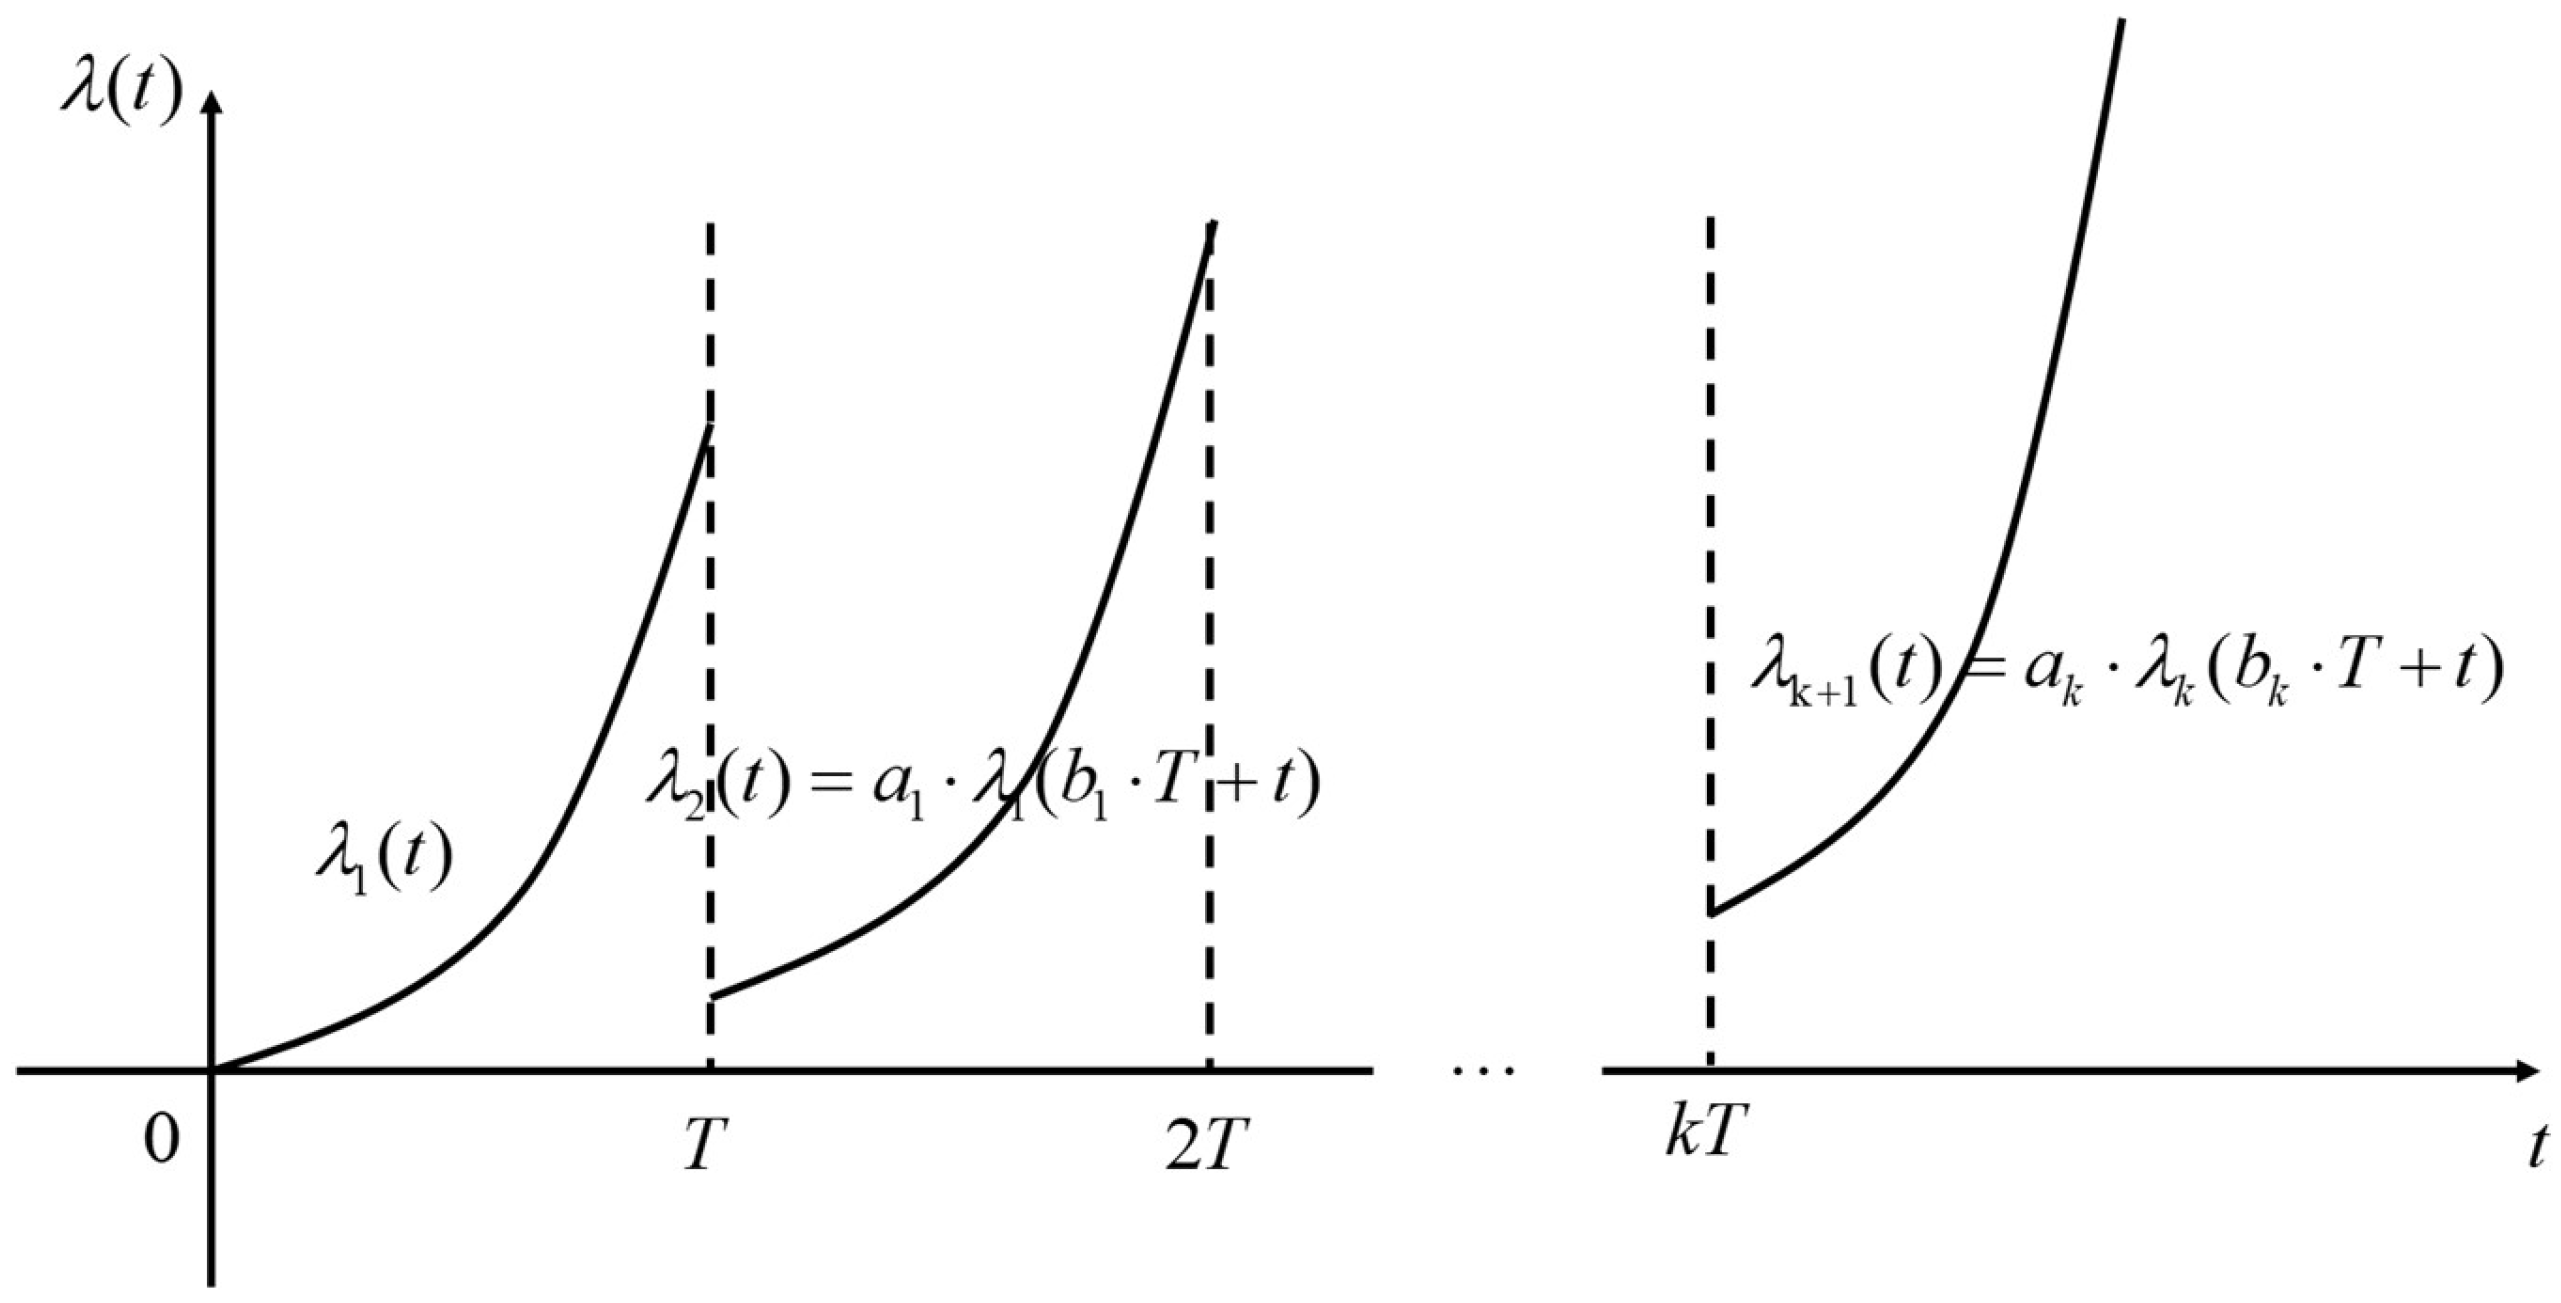
To be closer to the actual condition of a unit after the preventive maintenance, the two basic models mentioned above are combined. This approach takes into account both the sudden change in reliability immediately after maintenance and the overall change in reliability compared to the previous working period. The failure rate distribution function in each PM is further described.
In the combining model, the changes in failure rate describe the maintenance effect as well, which is expressed as follows:
The age of a unit declined, the initial failure rate after preventive maintenance was not zero anymore, and the speed of the failure rate increased, as shown in
Figure 4.
In general, the initial failure rate which expresses the unit without any preventive maintenance can be obtained by the life distribution function. Then, the relationship between the failure rate after repeated preventive maintenance and the initial failure rate can be derived from the combining model:
According to Equation (4),
And
; then,
So, the failure rate after the
kth preventive maintenance is
4. Reliability-Centered PM Optimization Models
Considering the maintenance cost, other maintenance-related indexes, and reliability-related indexes, an optimization model of preventive maintenance work is established to control maintenance costs and improve reliability and maintainability performance. This chapter will elaborate on the detailed contents of the model.
4.1. Indexes in PM Models
The total cost of the PM optimization model consists of the cost of CM, PM, and replacement, and they can be expressed as
The CM cost of one replacement:
which is the product of the cost of one corrective maintenance and the failure frequency (equal to the number of CM) calculated by the integral of the failure rate.
The PM cost of one replacement:
which is the product of the cost of one preventive maintenance and the number of PMs;
The cost of one replacement:
According to Equations (8)–(10), the total cost is expressed as follows:
- 2.
Total time:
The total time of the PM optimization model consists of the time of CM, PM, and replacement, and the working time can be expressed as
The CM time of one replacement:
which is the product of the time of one corrective maintenance plan and the failure frequency (equal to the number of CM) calculated by the integral of the failure rate.
The PM time of one replacement:
which is the product of the time of one preventive maintenance plan and the number of PMs;
The cost of one replacement:
The working time of one replacement:
According to Equations (12)–(15), the total time is expressed as
- 3.
The total cost of one replacement per unit of time:
From the cost perspective, when making a PM plan, a proper scheme needs to be arranged so that the total cost is minimized, so we have
express the total cost of one replacement per unit of time according to Equations (11) and (16) as follows:
- 4.
Availability:
From the performance perspective, when making a PM plan, a proper scheme needs to be arranged so that the percentage of working time is the highest in total time, we have
express the ratio of working time to total working time, and according to Equation (16),
is expressed as
- 5.
Reliability:
The aim of preventive maintenance is to reduce the failure frequency and reach a higher level of reliability. At each preventive maintenance, the reliability should not be lower than the minimum reliability of a working unit, so we have
4.2. Optimization Models
Considering the actual usage, the goals of preventive maintenance are different for the products with higher reliability requirements or those that have a greater impact on economic performance. Therefore, two PM optimization models are built to meet the maintenance policies under different goals.
To reduce the possibility of failure and avoid unnecessary loss, the total cost of one replacement per unit of time is chosen as the objective function. We proposed a cost-minimization model:
where
means other constraints in practical applications.
As for the failed product which may cause a long-time machine halt, resulting in a great loss in cost and even endanger the safety of life, to ensure the operation of the system, availability is chosen as the objective function. We proposed an availability maximization model:
where
means other constraints in practical applications.
5. Case Study
As the failure rate of a type of tire-building machine in MESNAC is at a high level, devising an effective preventive maintenance (PM) plan has become an urgent problem to be solved. The preventive maintenance work of this type of tire-building machine can cause a long-time machine halt and result in a huge loss of cost. Therefore, this paper focuses on the type of tire-building machine in MESNAC. An application of the PM optimization model is presented, and a process of working out the optimizing PM plan of a type of tire building machine and the preference for carrying out preventive maintenance is provided by our models.
Combined with the experience estimation of maintenance and the abstraction of actual data, the parameters of the Weibull distribution are given. Failure rate modeling-related parameters are given based on historical data as well as experience. Repair-related costs and durations are obtained from the repair records of the actual product. The parameters of the PM optimization model were determined, as shown in
Table 1.
Both component 001 and component 002 are optimized to maximize availability, and the rest are optimized to minimize cost. Therefore, they differ in model parameters and .
Because the maintenance effect of different maintenance personnel is similar, the failure-rate-increasing factor and the age-declining factor of each component are estimated by experience, which are
and
. So, according to Equation (7), the failure rate after the kth preventive maintenance is
Since the labor cost and service cost of preventive maintenance are nearly identical for all components, the parameters of the cost of one corrective maintenance and the cost of one preventive maintenance for each component are taken to be the same as , .
Combined with the requirements of the enterprise, the characteristics of the components themselves, the working environment, and the safety requirements, we decided to choose one of the models (Equations (20) and (21)) to calculate the time between two preventive maintenance and the number of preventive maintenance before replacement. The results of solving the optimization models, using the aforementioned parameters, are presented in
Table 2.
From
Table 2, it can be found that the availability optimization results of component 001 and component 002 are similar, both are higher than 0.992, and the preventive maintenance optimization of component 020 has the largest total cost of one replacement per unit time.
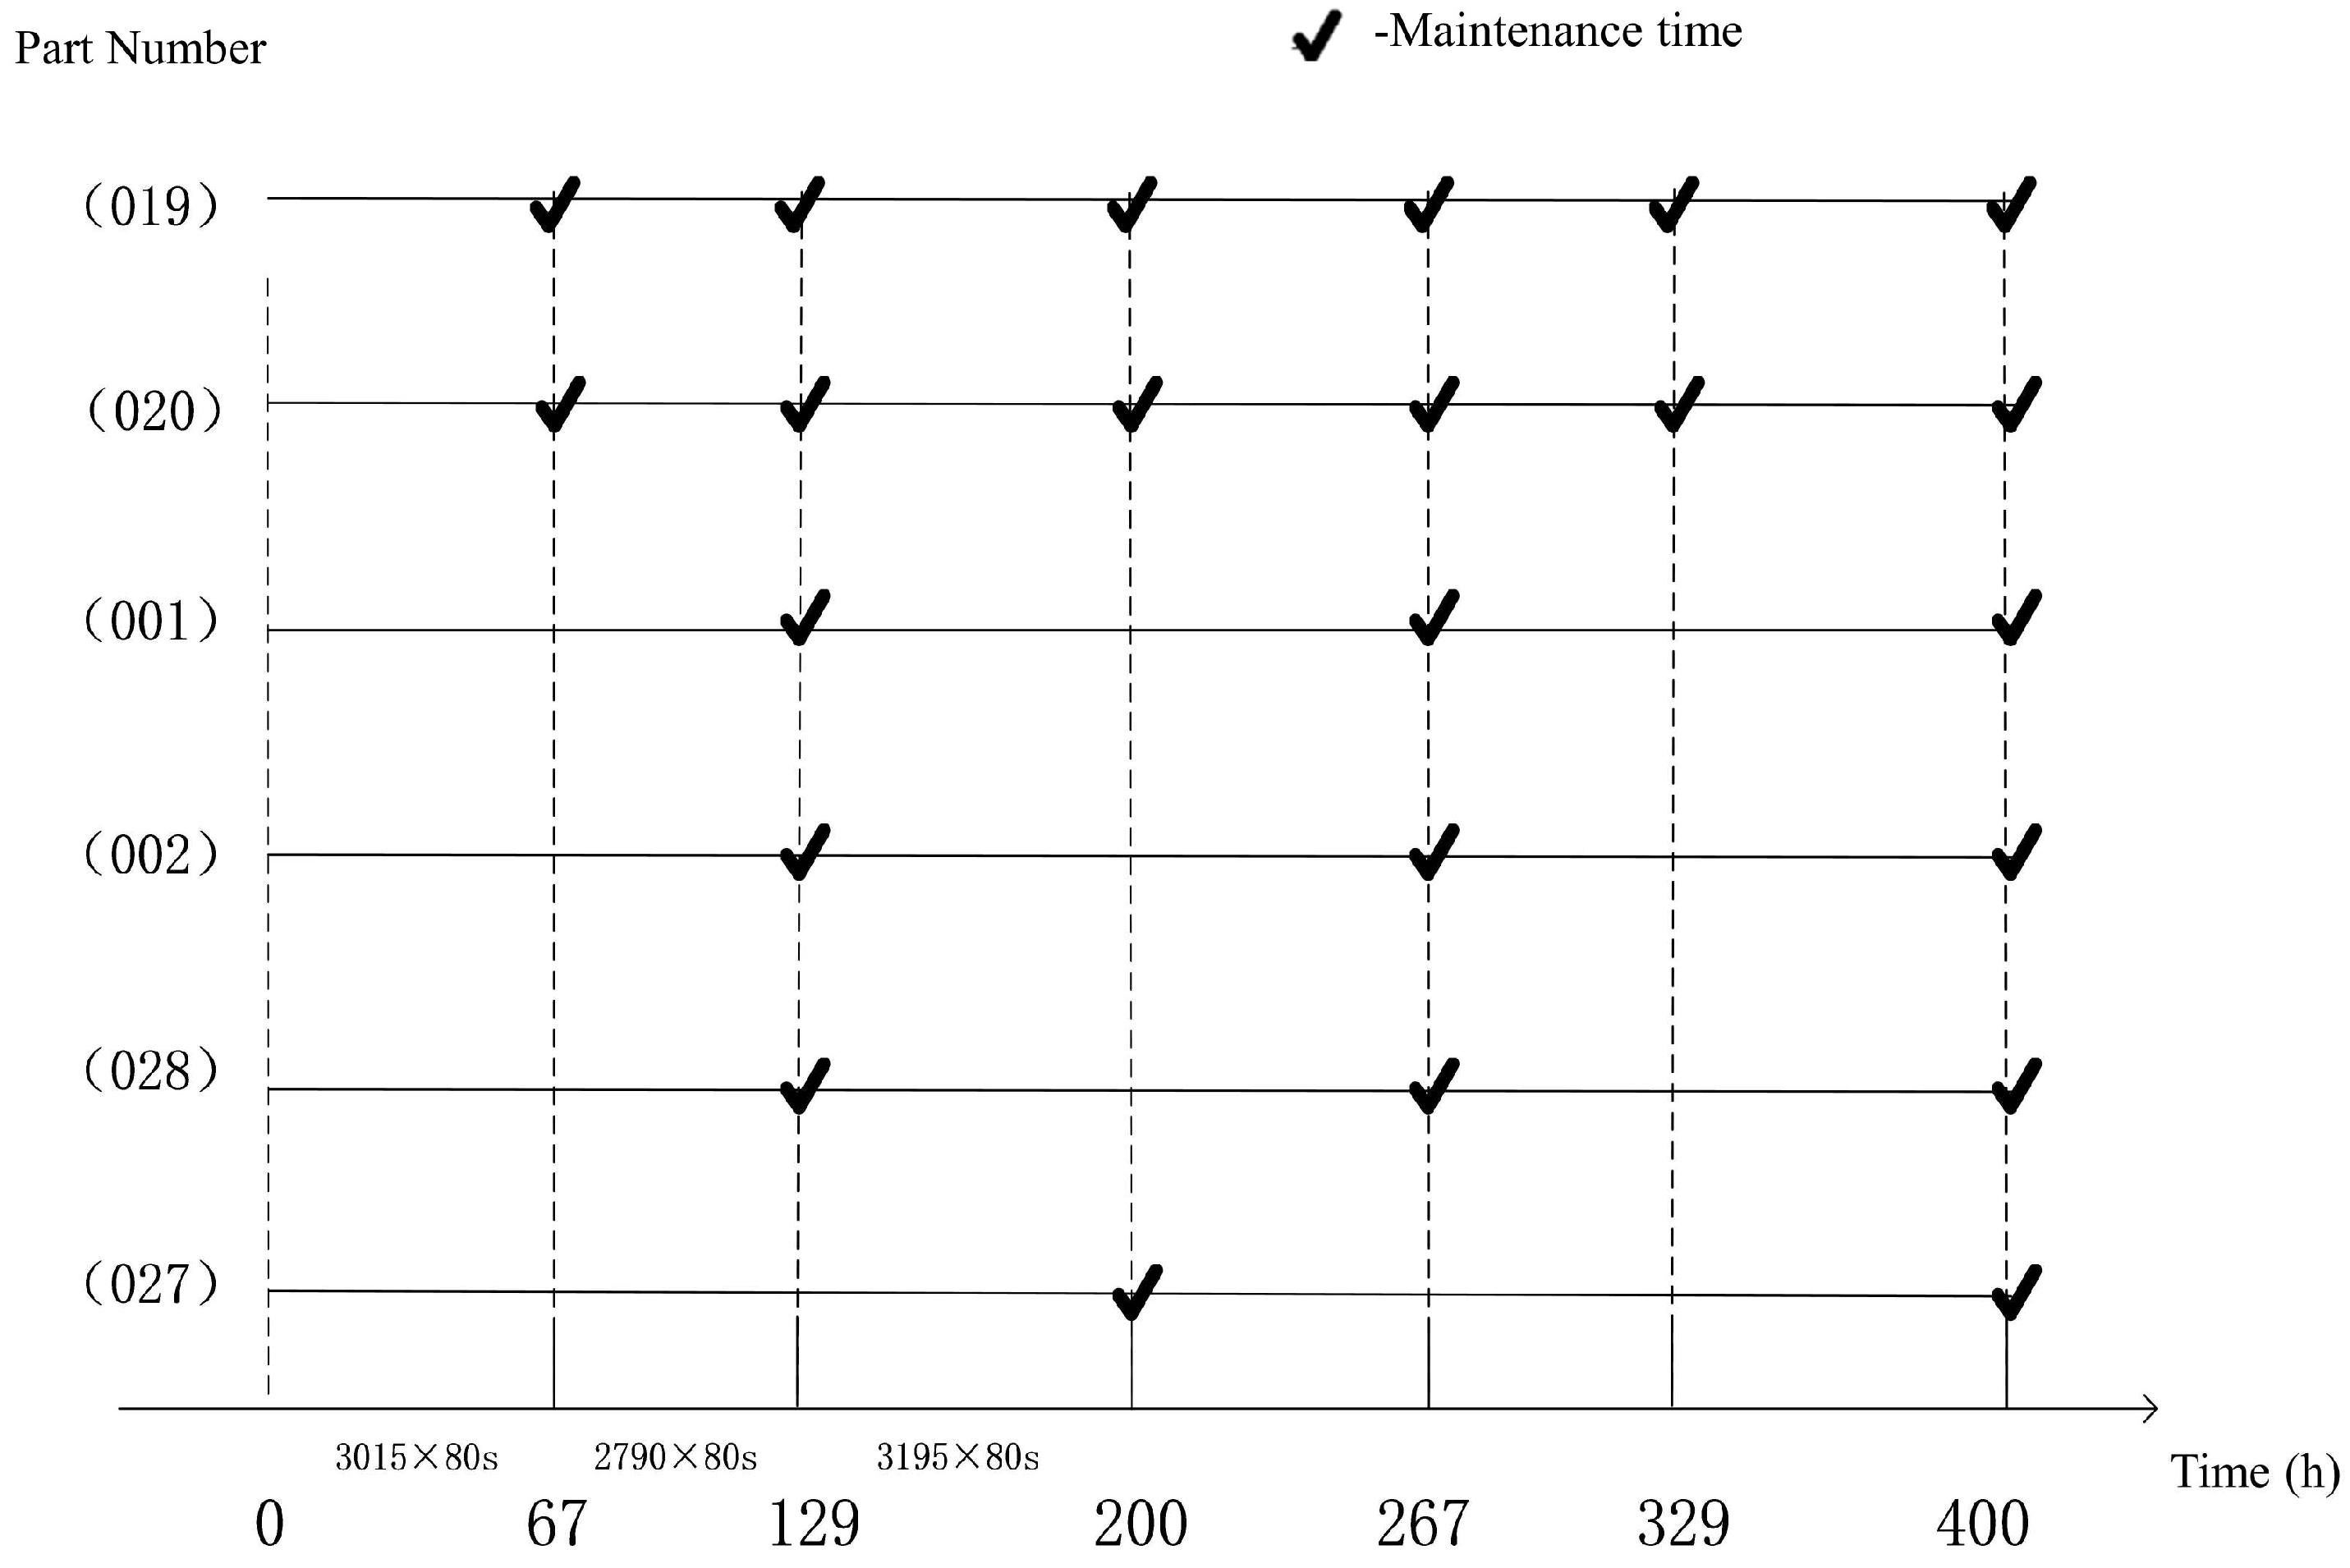
Concentrated on the parts with similar time between maintenance strategies, the first preventive maintenance of the parts with the longest time between maintenance strategies is taken as a cycle unit. The results of the preventive maintenance policy are expressed in
Table 3.
After adjustment, the preventive maintenance plan flow of a basic cycle unit (400 h) is expressed as a PM time axis in
Figure 5.
Figure 5 shows that the PM optimization model proposed in this paper is capable of solving the preventive maintenance decision-making problem for the tire-building machine. For minimizing the total cost of maintenance, component 019 and component 020 have more frequent preventive maintenance schedules, and component 027 has a longer preventive maintenance interval. The preventive maintenance optimization strategy is the same for component 001 and component 002 under the maximizing availability objective.
6. Discussion and Conclusions
Table 2 and
Table 3 and
Figure 5 show that after the optimization of the preventive maintenance decision, both component 019 and component 020 have short preventive maintenance intervals. Combined with
Table 1, it can be seen that the causes of the short preventive maintenance intervals for component 019 and component 020 are different. For component 019, it is due to its own fast-growing failure rate, so it is necessary to shorten the preventive maintenance intervals to ensure that the cost is minimized; for component 020, it is mainly due to its high replacement cost and low preventive maintenance cost, and shortening the preventive maintenance intervals can effectively reduce the total cost. Component 027 has a long preventive maintenance interval, mainly because of its slow-growing failure rate and low replacement cost, so a long preventive maintenance interval can effectively reduce the maintenance cost. In contrast to component 027, component 028 has a longer downtime for replacement and, therefore, should not have an excessively long preventive maintenance time. From
Table 2, component 001 and component 002 have similar optimal availability results and similar preventive maintenance intervals during the optimization process. The main reason is that they have similar cost constraints as well as reliability constraints. These optimization results are in line with the qualitative results, which, side by side, confirm the validity of the proposed models in
Section 4.
In summary, this paper studies the optimization of reliability-centered preventive maintenance for single-unit mechanical equipment. By analyzing the preventive maintenance policy applicable to single-unit mechanical equipment, the life distribution function and maintenance effect function are obtained. On this basis, two optimization models of preventive maintenance are established, which are the cost minimization model and the availability maximization model. These models contribute to the development of a more rational preventive maintenance plan through comprehensive analysis.
However, the optimization of preventive maintenance for mechanical equipment in this paper is still at the basic stage, and there are still many problems to be further studied. This also inspires us to carry out targeted and planned management in maintenance work. Preventive maintenance based on experience and subjective decision making is not reasonable enough, and the determination of preventive maintenance intervals also needs to be scientifically and systematically analyzed in conjunction with the use, operation, and maintenance of equipment. In addition, more research is needed to balance higher costs, and higher availability, while considering the actual difficulty of implementing maintenance plans at the same time. Therefore, in future work, we aim to incorporate more complex and accurate reliability models to bridge the gap between the optimization model for preventive maintenance and real-world scenarios. We also plan to consider the impact of epistemic uncertainty on maintenance decisions and extend the optimization models to multi-unit mechanical systems.


