Article

Symmetry of Structures under Two-Dimensional Instability in a Finite-Height Horizontal Layer of Boiling Liquid

by
Vladimir I. Zhukov
1,2 and
Aleksandr N. Pavlenko
1,*
1
Kutateladze Institute of Thermophysics SB RAS, 630090 Novosibirsk, Russia
2
Department of Chemistry and Chemical Technology, Faculty of Mechanical Engineering and Technologies, Novosibirsk State Technical University, 630073 Novosibirsk, Russia
*
Author to whom correspondence should be addressed.
Symmetry 2023, 15(9), 1792; https://doi.org/10.3390/sym15091792
Submission received: 27 July 2023 / Revised: 8 September 2023 / Accepted: 14 September 2023 / Published: 20 September 2023

Abstract

:
The two-dimensional instability of a horizontal layer of boiling liquid with a finite height was experimentally studied. In this layer, “vapor columns” rose at the corners of a square rectangular grid, and the symmetry of “vapor column” location on the heating surface was considered. The model adopts an approach to the boiling crisis from the side of both developed nucleate boiling and transitional boiling (the Zuber problem). When dealing with developed nucleate boiling, the layer of boiling liquid is considered in calculations as an isotropic homogeneous system (foam). It is shown how the conditions on the heating surface (capillary-porous coating) affect the external hydrodynamics of the liquid layer and, ultimately, the value of the critical heat flux. The calculation ratio obtained by approaching the boiling crisis from the side of developed nucleate boiling takes into account the dependence of the critical heat flux on the void fraction of the boiling liquid layer. A new solution to the boiling crisis problem is proposed when approaching the crisis from the side of transitional boiling (the Zuber problem). This new solution eliminates some shortcomings of the classical problem (in particular, the void fraction of the layer corresponds to the experiments).

1. Introduction

In 1950, S.S. Kutateladze was the first to substantiate in detail the hydrodynamic (hydromechanical) theory of boiling crisis. In [1], he wrote: “Let us make the following four assumptions.
  • Changes in the boiling regime occur due to a change in the hydrodynamic regime of the two-phase boundary layer that exists during vaporization on the heating surface, and they are characterized by the certain critical values of the vaporization rate.
  • The boundary two-phase layer is so turbulent due to the vaporization process that molecular friction can be neglected both in the vapor and in the liquid flow components.
  • The velocity of a liquid component near the heating surface, due to deceleration created by the latter, is significantly less than the average vapor velocity.
  • The dimensions of the heating surface are so much larger than the bubbles and films freely formed in its immediate vicinity that the occurrence of a crisis in the vaporization regime is equally probable at all points of this surface.”
In [2], he adds the sentence: “The ideal model, which fully satisfies the last condition, is a very large horizontal plate with the heating surface facing upwards.”
As a result, using the method of dimensional analysis, Kutateladze obtained the relation needed to calculate the critical heat flux (CHF) in the process of pool boiling:
q c r = k h L G ρ v σ g ( ρ l ρ v ) ρ v 2 1 / 4 ,
where the value of constant k (usually called the Kutateladze constant) varies between 0.13 and 0.19—in [1,2], it is recommended to use its average value equal to 0.16; h L G is the latent heat of vaporization; g is the acceleration of gravity; σ is the surface tension coefficient; and ρ l , ρ v are the densities of liquid and vapor, respectively.
In [3,4], Zuber obtained a formula similar to (1) based on a physical model using the results of an analysis of Taylor and Helmholtz instabilities. 
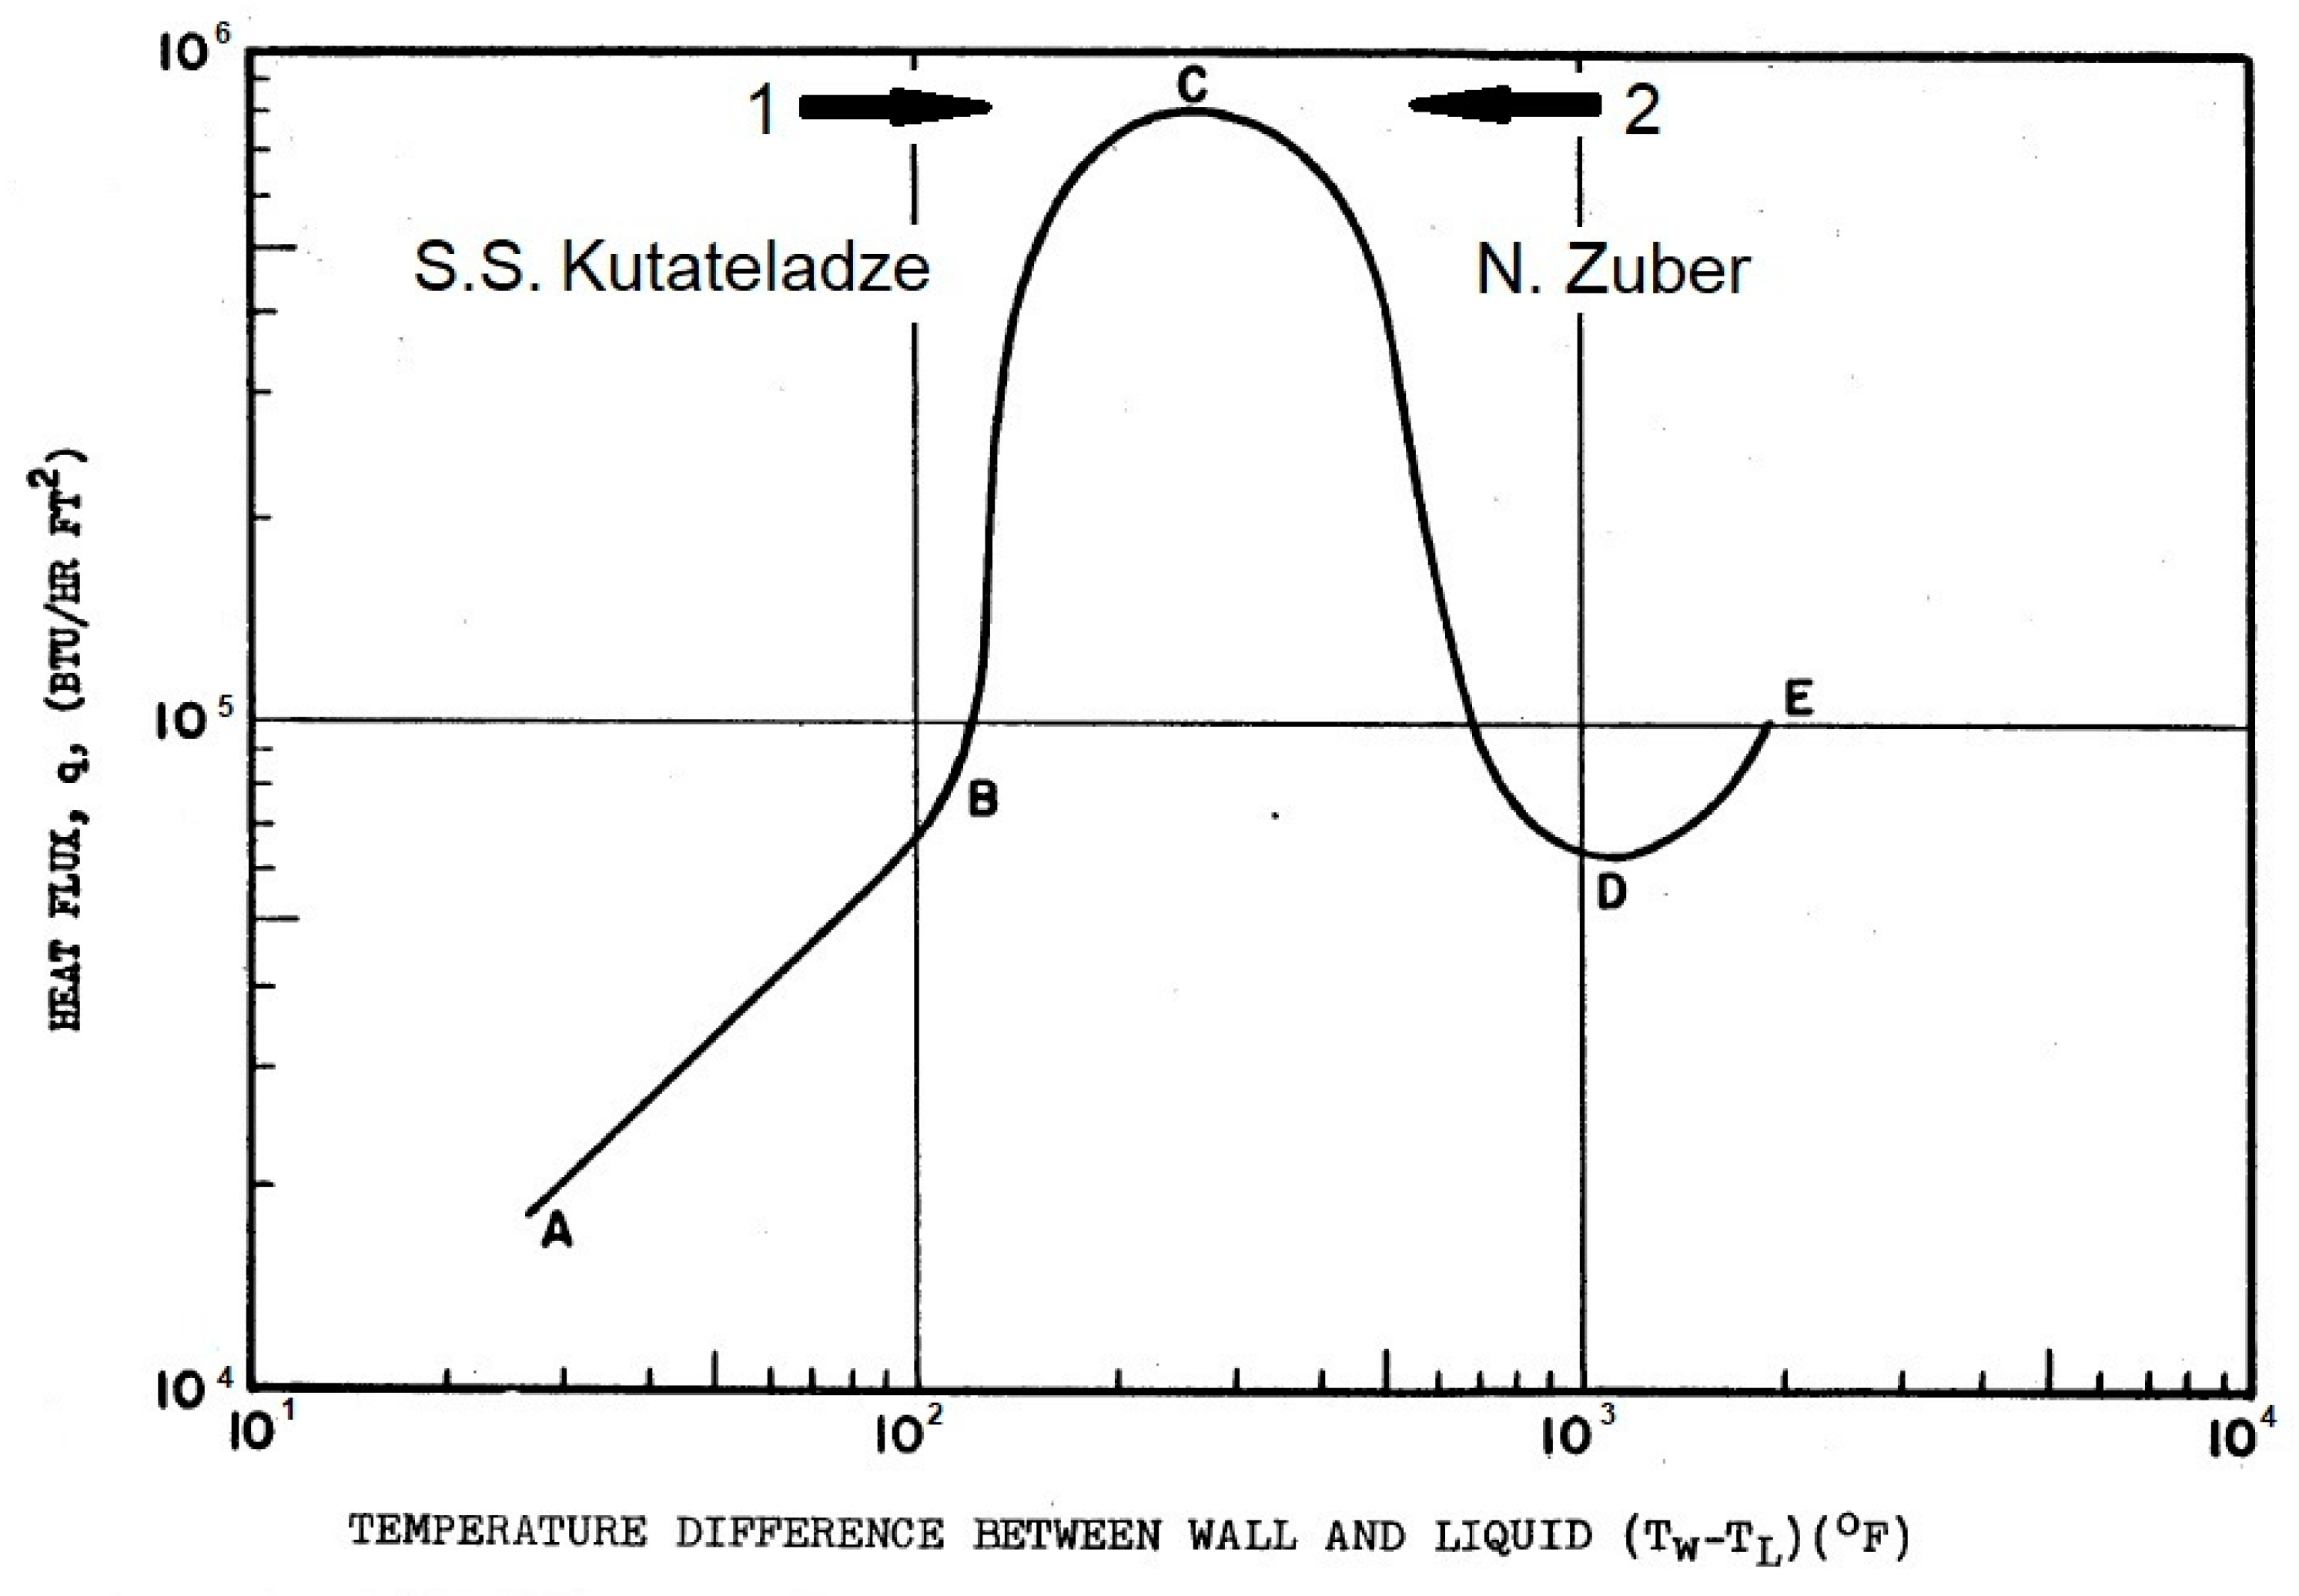
Figure 1 shows the boiling curve from [3], where AB is the convective heat transfer regime (the no-boiling region); BC is the regime of nucleate boiling; CD is the regime of transitional boiling; DE is the film boiling regime; and, at point C, the boiling crisis begins. In this diagram, the branches BC and CD of the boiling curve in logarithmic coordinates are almost symmetrical relative to the vertical axis drawn through point C.
The literature review of [3] reveals that Zuber was well acquainted with the works of Kutateladze [1,2]. In [3], he writes: “Because the flow configuration in nucleate boiling is not well defined, an analysis of the critical heat flux performed by considering nucleate boiling is reduced to dimensional analysis.” In his works [1,2], Kutateladze performed a dimensional analysis and considered the transition to CHF in terms of nucleate boiling (shown by arrow 1 in Figure 1).
In his model [3,4], Zuber considered the transition to CHF from the side of transitional boiling (shown by arrow 2 in Figure 1). The only quantitative experimental study of transitional boiling in the literature at the time of model development was [5], in which the process of methanol boiling on a horizontal copper tube with an outer diameter of 3/8 inch (~9.5 mm) and a working length of about 6 inches (~152 mm) was studied. The tube was heated with steam. Zuber studied the photographs and description of transitional boiling on the horizontal tube, presented in [5]. Furthermore, in [3], he wrote: “… because of Taylor instability, a definite geometrical configuration can be expected in transitional boiling. We shall make use of this defined geometry and analyze, therefore, the critical heat flux by considering transitional boiling” and “Thus, in the region of the critical heat flux a small increase of the heat flux density results in a large increase of the surface temperature. Consequently, in the q = Δ T plane there exists a plateau across which boiling changes from the nucleate to the transitional boiling regime”. Based on the analysis of observations on a tube, he formulated the main theoretical provisions for calculating the boiling crisis on an infinite horizontal surface. The Zuber model considers an already formed vapor film on a plane under a liquid layer. In [6], Taylor showed that the interface separating two liquids of different densities is unstable if the acceleration is directed from a heavier medium to a lighter one. Bellman and Pennington [7] showed that interface perturbations can be stable or unstable depending on whether the critical wavelength is shorter or longer, as given by the equation λ c r = 2 π l σ , where l σ = ( σ / g ( ρ l ρ v ) ) 1 / 2 is the capillary constant. They also showed that the “most dangerous” instability wavelength, i.e., the wavelength at which the perturbation amplitude grows most rapidly, is determined by the expression λ d = 2 π 3 l σ 
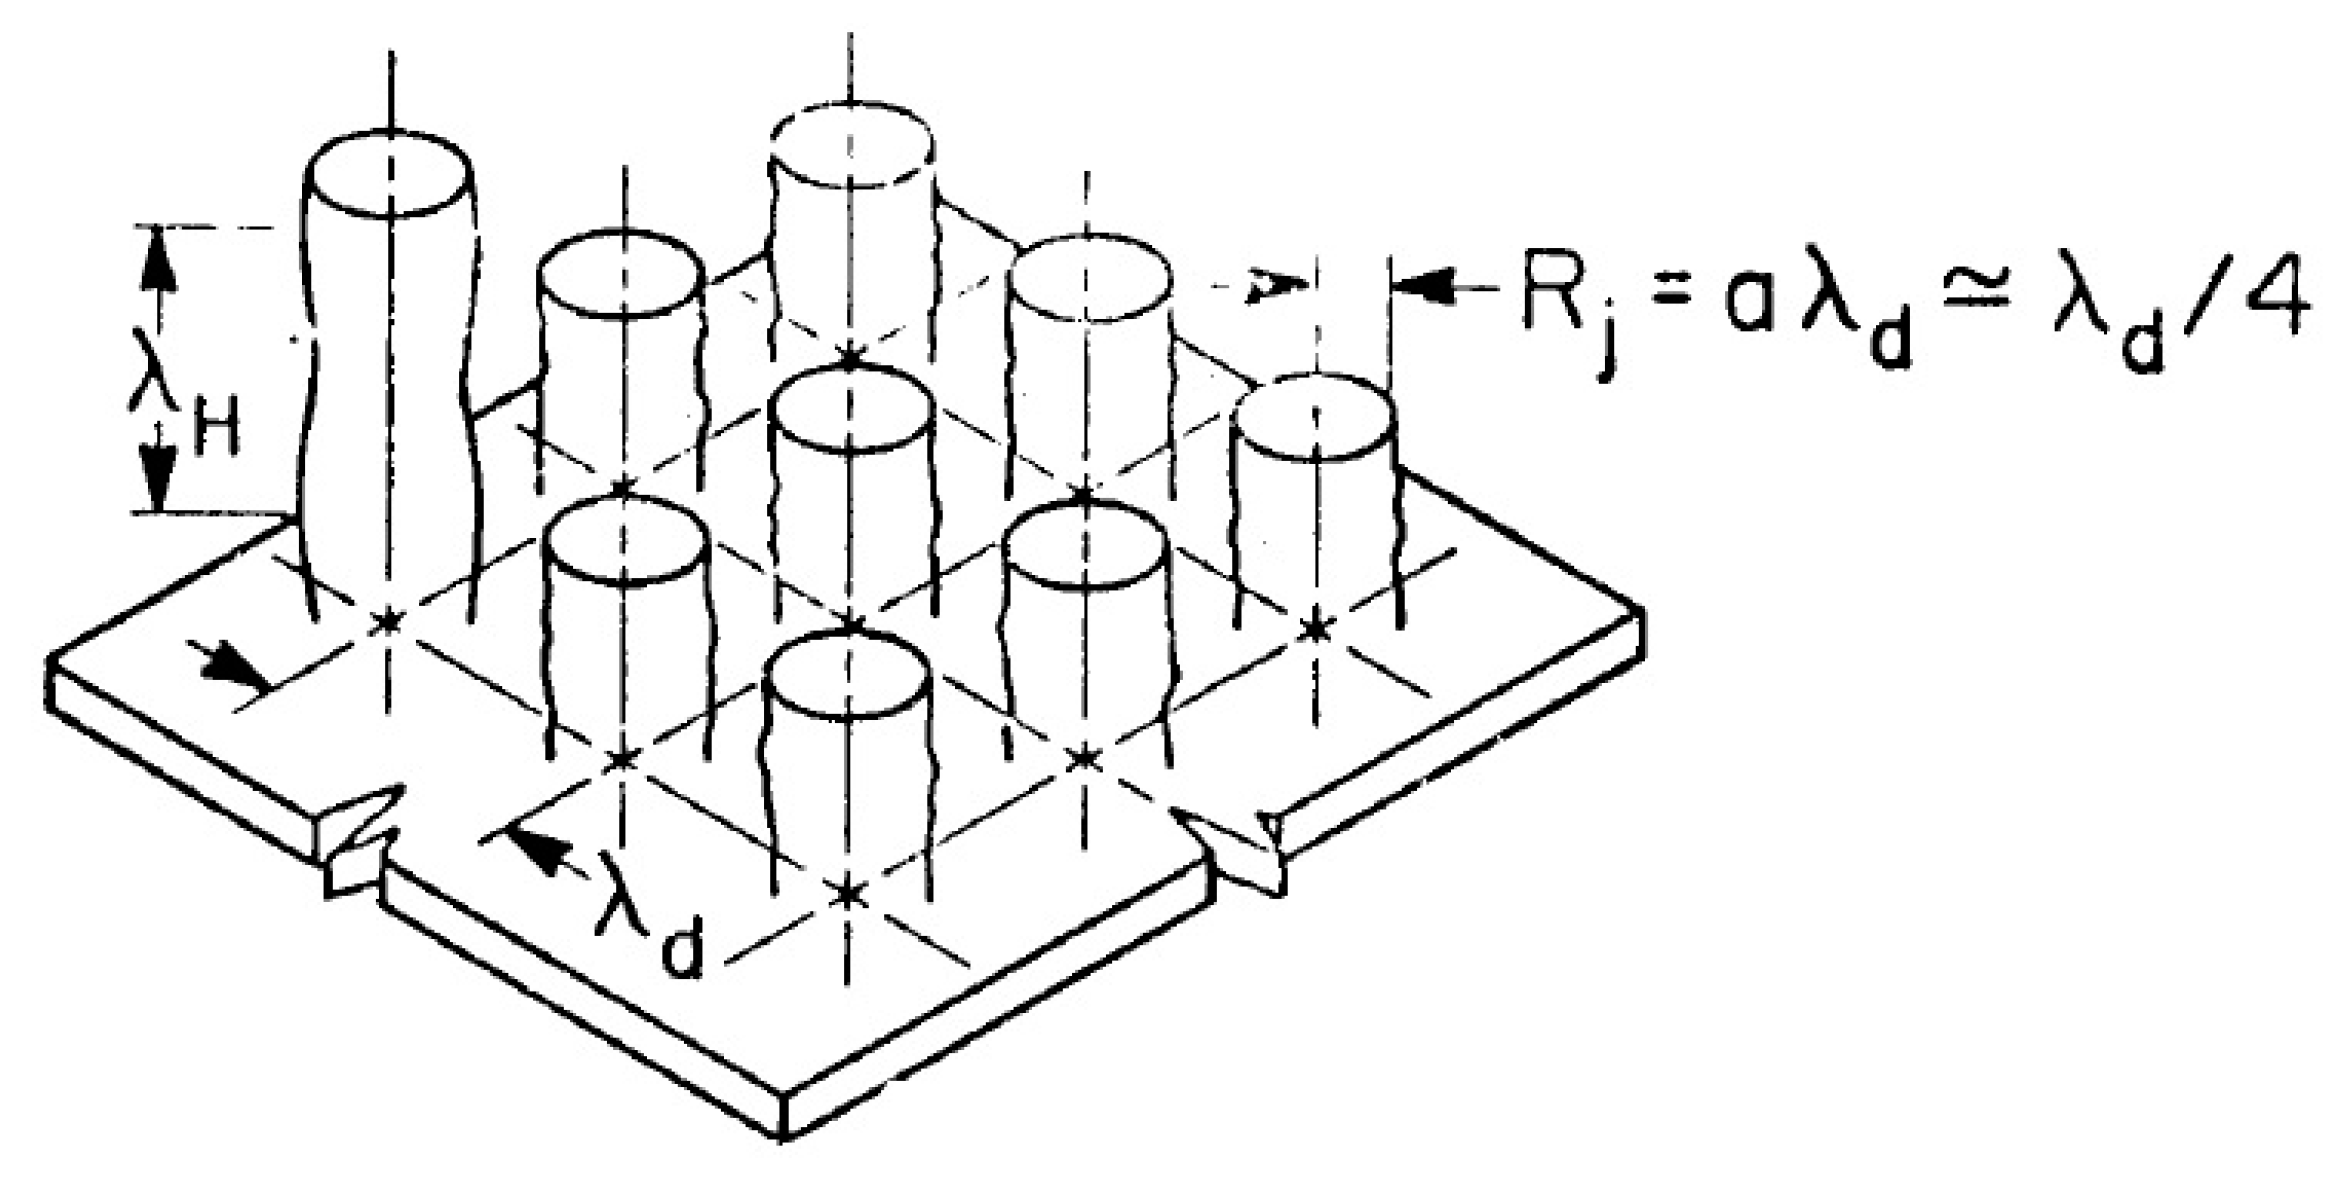
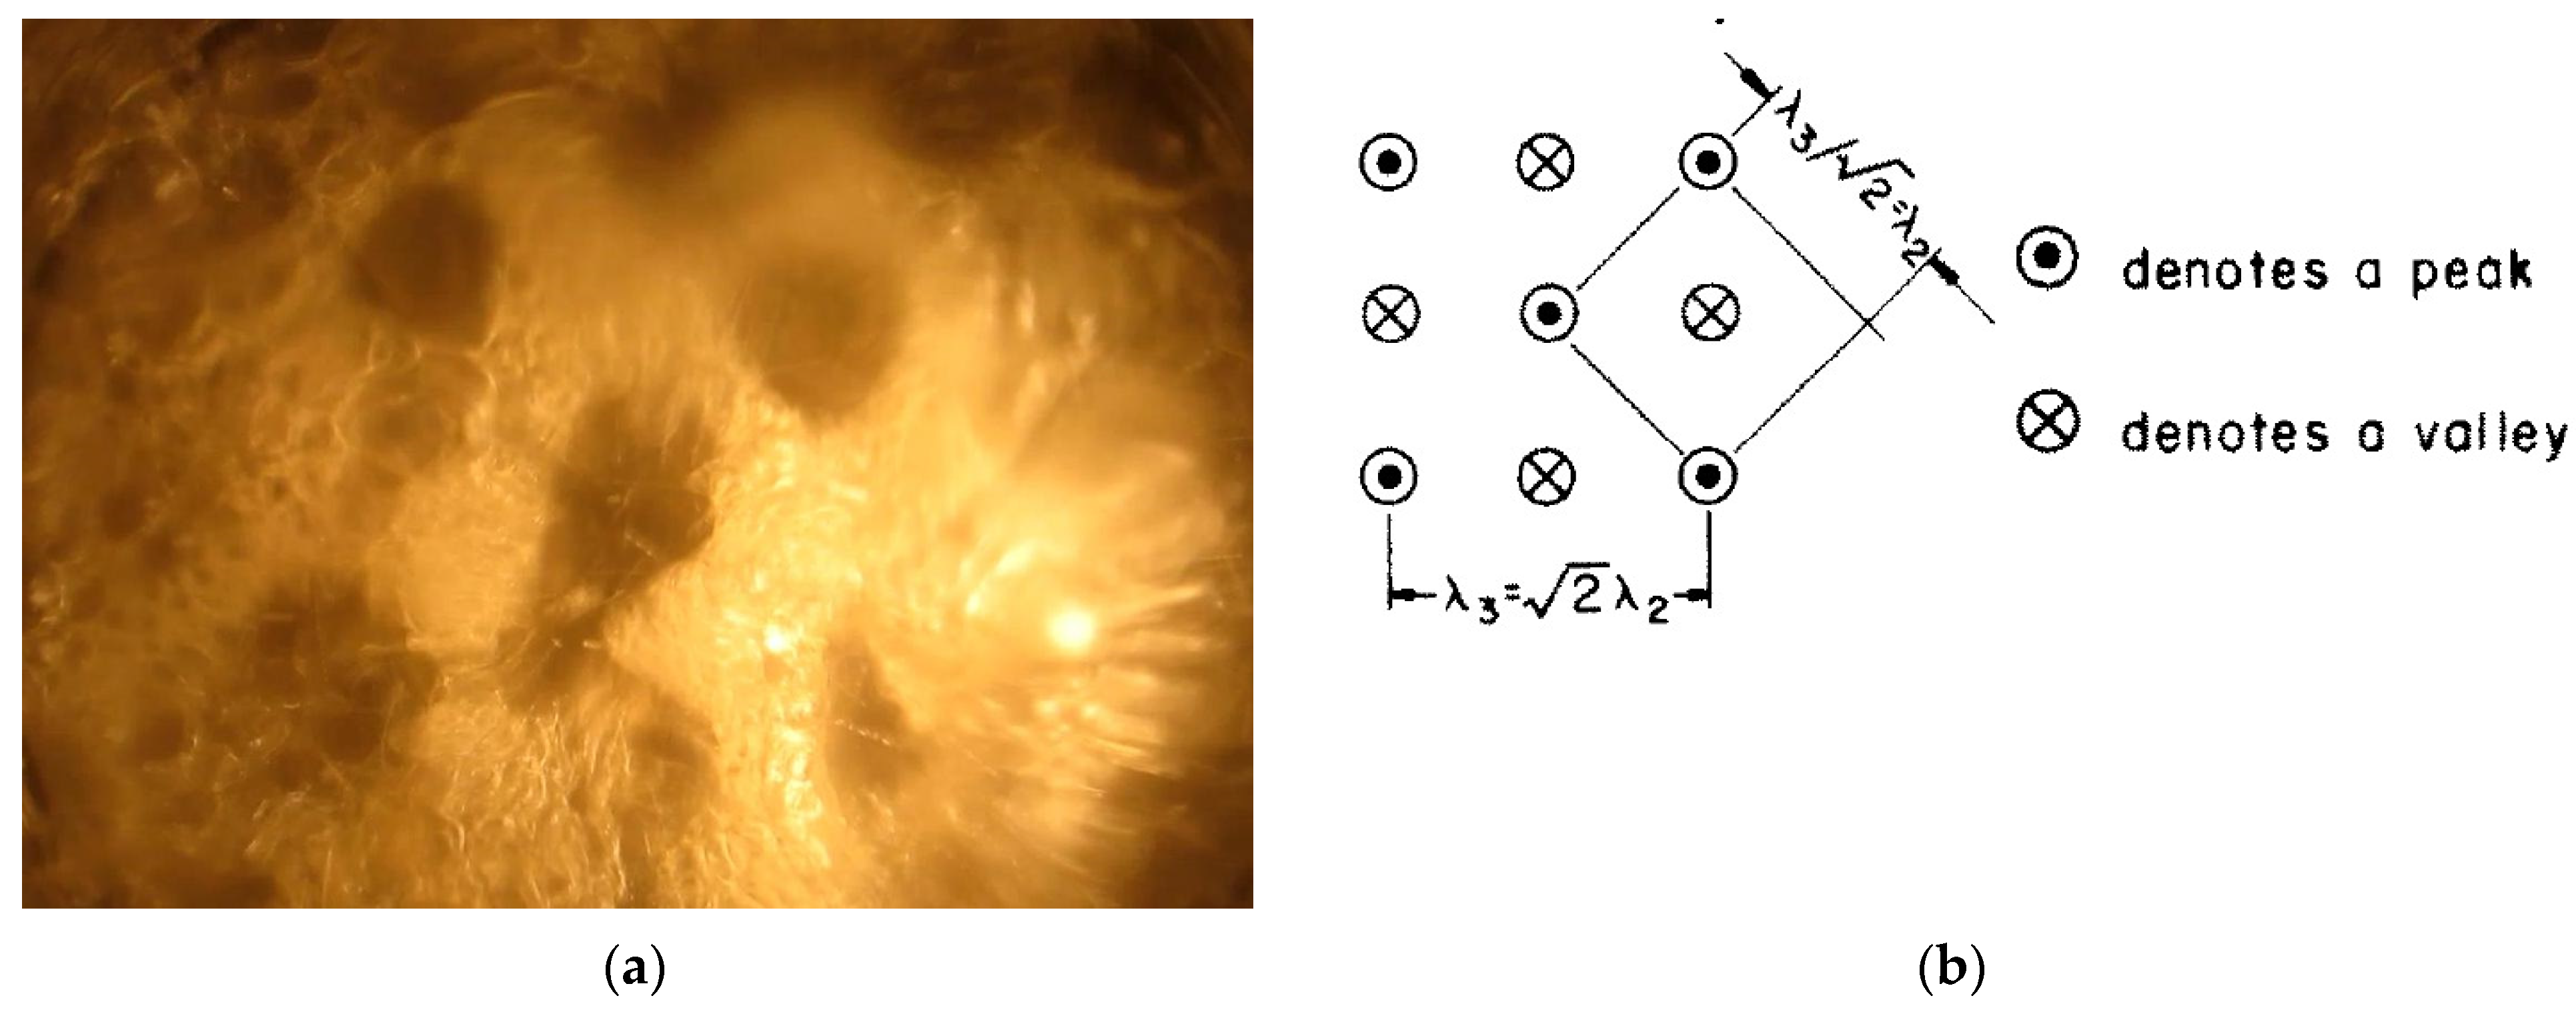
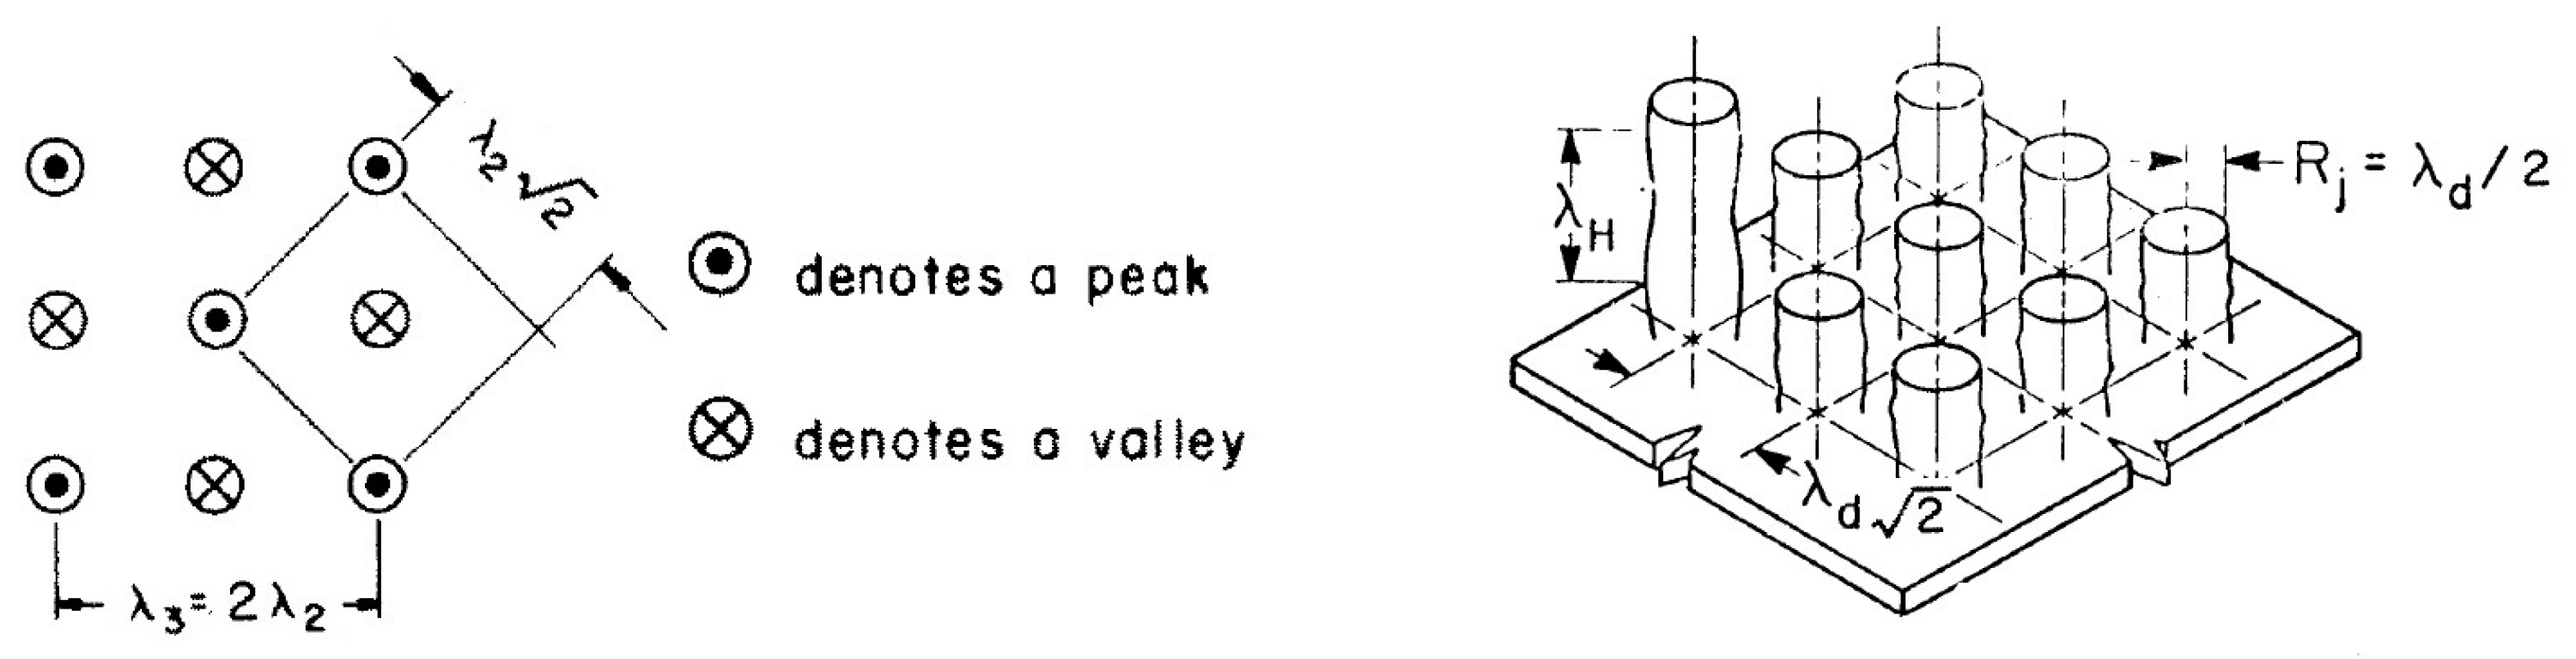
. In the Zuber model (Figure 2), vapor jets rise up at the vertices of a square grid with a side corresponding to the characteristic Taylor instability wavelengths. The critical vapor velocity in jets is determined by the Helmholtz instability. The wavelength of the Helmholtz instability was taken as equal to λ H = 2 π R j , where R j = λ c r / 4 or R j = λ d / 4 , in which R j is a vapor jet radius. For the CHF, Zuber obtained the following expression:
q c r Z = k h L G ρ v σ g ( ρ l ρ v ) ρ v 2 1 / 4 ρ l ρ l + ρ v 1 / 2 ,
where k 1 = π 24 3 2 π = 0.157 , if R j = λ c r / 4 and k 2 = π 24 3 2 π 1 3 1 / 4 = 0.12 , if R j = λ d / 4 . Zuber recommends taking k = π / 24 = 0.131 as the most appropriate value.
The authors of [8] proposed to improve the Zuber equation for CHF by assuming λ H = λ d , and they obtained k = 0.149 . In [9], k = 0.151 was obtained by considering the interfacial lift-off mechanism.
Due to the fact that Equations (1) and (2) almost coincide (the expression under the root on the right in Formula (2) noticeably differs by 1 only at near-critical pressures), in some publications one can come across the terms “Kutateladze–Zuber theory” or “Kutateladze–Zuber equation”. There is a note on the difference in approach to the boiling crisis in Theofanous et al. [10,11]: “The commonality of the Kutateladze and Zuber ideas, expressing the external hydrodynamics control, boils down to scaling a critical vapor velocity in terms of the relevant fluid properties–densities and surface tension–and the body force field. There is no external length scale, and this implies a limitation to horizontal infinite flat plates. For both there is an ‘‘internal’’ length scale, the capillary length, and this provides an approximate measure of the dimensions above which the plate can be considered infinite… But there are also some basic differences in the two ways of thinking that have to be kept in mind in addressing issues of geometry, satisfying respectively self-similarity.
Zuber’s postulated Rayleigh–Taylor controlled counter-current flow is macroscopic, and it is easy to see that self-similarity for it requires strict absence of external length scales able to introduce departures from (on the average) one-dimensional (1D) behavior [4]. In turn, this requires that the liquid pool contains no bypass regions (its cross-section is fully coincident with the heater’s cross-section), and that it is of small aspect ratio (height divided by the smallest lateral dimension)”.
Theofanous et al. [11] further explains that the Gaertner experiment [12], which includes a disk 5 cm in diameter placed at the bottom of a deep (20 cm) and wide (14 cm) reservoir with liquid, does not satisfy these requirements.
In [11], Theofanous et al. state the following: “Kutateladze’s idea of ‘‘repulsion’’ is more vaguely stated, and thus it allows a somewhat greater flexibility in satisfying self-similarity. It appears that he is focused in a boundary layer, right next to the heater surface, and he thinks of a hydrodynamic transition occurring within this layer. Following his experiments with Gogonin [13], they assert that a width of even 2 capillary lengths (~2 mm in their ethanol experiments) is sufficient to eliminate the effect of an external length scale. Their water pool was deep (~15 cm) and much wider than their heater (10 cm). These experiments yielded the K u = 0.145 result (as in Equation (1)). Excellent agreement with Equation (1) was also reported by Kutateladze and Malenkov in later water boiling experiments [14]. Unfortunately, no mention of the flow regimes observed was made in these papers, but Kutateladze had no doubt that the two-phase flow above the heater was dispersed and highly chaotic (i.e., he disagreed with Zuber’s picture of a relatively regular array of vapor jets). What remains unclear is the extent of interplay between the external hydrodynamics and the transition within the boundary layer that was the focus of Kutateladze’s interest. In this interpretation both Gaertner’s and Kutateladze’s own experiments are open to question of such ‘‘external” influences. Remarkably, all other previous experiments are even further removed from these self-similarity requirements.”
Theofanous et al. [11] propose the introduction of scale separation. They suppose that: “Based on infrared thermometry, and aided by X-ray radiography data on void fraction, the case for a scale separation phenomenon in high heat flux pool boiling is argued. This indicates that boiling crisis is controlled by the microhydrodynamics and rupture of an extended liquid microlayer, sitting and vaporizing autonomously on the heater surface”. They conclude: “Thus we can conclude that boiling heat transfer is independent of the complex two-phase flow hydrodynamics above the heater, and in particular that the previous hydrodynamic theory of boiling crisis is not appropriate”. In the study by Yagov [15], a new model of liquid boiling crisis was developed based on physical estimates of the process of evaporation of the thin liquid film, menisci, adjacent to “dry spots” on the heating surface. The beginning of the crisis is associated with a violation of the balance of liquid supplied to the “dry spot” boundary and evaporated liquid. The boiling crisis is explained as a result of coalescence and growth of the “dry spots” area on the heated surface. Calculation relations are obtained for the CHF during pool boiling in the region of low reduced pressures— P s / P c r < 0.001 ( P s and P c r are the saturation pressure and the critical pressure, respectively) and for the region of high reduced pressures, P s / P c r > 0.03 . The interpolation formula for CHF calculation at arbitrary pressure is derived. The calculated dependences are in good agreement with the experimental data. In most current experimental studies on heat transfer during boiling, the near-wall region and the formation and growth of dry spots are investigated [10,11,16,17,18].
In [8], the authors specified the requirements for a setup to test the Zuber theory with a heater in the form of an infinite flat plate. In this test, to get rid of the horizontal inflow of liquid, which has a noticeable effect on CHF, it is necessary for the experimental conditions to be as close as possible to the theoretical model of the process on an infinite plate, i.e., the experimental heater should be a very clean plate with dimensions much larger than λ d and limited by vertical lateral walls. It is shown in [19,20] that, with the ratio of horizontal dimensions for a square plate L / λ d > 3 , where L is the side of a square plate, the surface can be considered an infinite plane.
In [21], Lienhard pointed out a number of erroneous assumptions, including the arbitrariness of some of relationships used in the Zuber model [3,4]. In [21], a number of unresolved issues in the hydrodynamic theory of boiling crises are presented. One of the questions mainly concerns the properties of the heating surface that are not taken into account by the Zuber theory. The second unresolved issue, considered in [21], is the question of where the Helmholtz instability actually occurs in terms of scales from the heating surface. The problem with the Zuber crisis model is that, in many cases, it is difficult to identify the vapor jet behavior. As Lienhard writes in [21], Haramura and Katto [22] suggest that the Helmholtz process does not develop in the obvious vapor jets and columns at all, but rather in a small structure of mini-jets near the surface that feed the visible jets from below. At its core, the theory of Haramura and Katto is also a substantiation of the hydrodynamic theory. However, in this theory, in contrast to the Zuber theory, a liquid film under a mushroom-shaped bubble directly adjacent to the heating surface, is considered.
The works of Theofanous et al. [10,11] deny the influence of external (macro) hydrodynamics on the boiling crisis. They also question the influence of external hydrodynamics on the boiling crisis in the experiments of Gaertner [12] and Kutateladze [13,14]. At the same time, Theofanous remarks that, unfortunately, the observed flow regimes were not mentioned in the works of Kutateladze. In Gaertner experiments, large mushroom-shaped bubbles were observed in pre-crisis boiling regimes. The theory of Haramura and Katto was constructed on the basis of these observations [22]. It is believed that mushroom-shaped bubbles are formed by merging several bubbles in a region of vapor (light phase) accumulation near the wall. The microhydrodynamics of the near-wall region affect the external (macro) hydrodynamics. To determine this influence, it is necessary to study the spatial distribution of such bubbles over the heating surface under the conditions of the infinite plane geometry proposed in [8], when the horizontal inflow of liquid is excluded.
As noted by Theofanous et al. [11], in the Zuber theory, the ratio of the liquid layer height to the smallest transverse dimension must be small. The liquid layer must be of a finite height. Theofanous et al. [11] present experimental data on the crisis of water boiling at atmospheric pressure in a parallelepiped volume with height H = 70 mm and the smallest linear horizontal dimension l = 35 mm, i.e., H / l = 2 , while the average void fraction ε = 40 % where ε is the ratio of the vapor volume to the entire volume of the system. Hence, the height of the initial liquid layer at a temperature of 100 °C is 42 mm. The wavelength of the Helmholtz instability plotted from the most dangerous wavelength of the Taylor instability is λ H d = 2 π ( λ d / 4 ) = 42.8 mm. Perhaps, by pure chance, a layer of water with a height almost equal to the wavelength of the Helmholtz instability in the Zuber theory was used in the experiments of [11]. It is difficult to establish the upper limit of the layer height when a hydrodynamic boiling crisis is observed (the liquid is “pushed” from the heating surface by a vapor film). At the same time, there are thinner liquid films, when the boiling liquid film breaks down and the surface drying crisis is observed. In the geometry of an infinite plane [8], it is possible to establish the minimum height of the liquid layer, above which the usual hydrodynamic boiling crisis is observed, and in the thinner layers, the surface drying crisis is observed.
In the geometry of an infinite plane [8], when the heating surface is limited by vertical walls, the height of the two-phase layer of boiling liquid increases with an increase in its vapor content. One of the shortcomings of the Zuber theory is that, according to the theory, the void fraction of a liquid layer is π / 16 , while in experiments, it is much higher. In the study by Kutateladze and Malenkov [14] on establishing the analogy between the process of nucleate boiling and bubbling, the influence of this parameter is also directly indicated.
Thus, from the review of literary sources, the shortcomings of the classical theory of Zuber [3,4], listed in [21], have not been eliminated. The question of where the Helmholtz instability actually occurs, and on what scales from the heating surface, has not been resolved. There is no visual confirmation of the existence of vapor columns on an infinite flat plate. The issue of the influence of the properties of the heater surface has not been resolved within the framework of the CHF hydrodynamic theory. In the classical theory of Zuber [3,4], the void fraction of the liquid layer is π / 16 , which does not correspond to experiments. Not a single calculated dependence for CHF explicitly includes such an important parameter as the void fraction ε .
In this literature review, the requirements for the heating surface on which experiments must be carried out to test Zuber’s theory are described. Experiments should be carried out on a heating surface limited by vertical walls with horizontal dimensions several times larger than the most dangerous wavelength of Taylor instability λ d [8,19,20]. The ratio of the height of the liquid layer to the smallest transverse dimension of the heater should be small [11]. The height of the liquid layer is not indicated anywhere, so it must be determined experimentally. The liquid layer must be a finite height.
In their previous study [23], the spatial distribution of mushroom-shaped bubbles over the heating surface was studied under the conditions of the geometry of an infinite flat plate on a smooth heating surface. The effect of liquid layer height (n-dodecane) and void fraction on CHF and its mechanism is studied. Using the mathematical apparatus of the Zuber theory, the authors of this paper proposed a hydromechanical model of the nucleate boiling crisis, which takes into account the effect of void fraction on CHF. The theory of CHF is considered from the side of developed nucleate boiling using the mathematical apparatus of the Zuber theory.
The purpose of this work is to verify the conclusions of the hydrodynamic theory of CHF, obtained with a symmetric approach to the boiling crisis both from the side of developed nucleate boiling [23] and from the side of transitional boiling (classical Zuber problem).
To achieve this goal, amendments were made to the classical Zuber problem in this study in accordance with visual observations [24] the liquid layer at the moment of crisis. New data on CHF and visual observations of the process during the boiling of Novec-7100 dielectric liquid on a smooth surface were obtained. New experimental data on CHF during n-dodecane boiling on the surface of two 2D modulated capillary-porous coatings of the same morphology and geometry, but made of different materials, were used. The experiments were compared with theoretical calculations. The numerical values of obtained solutions for one problem were compared, but with a symmetric approach (from the side of developed nucleate boiling and from the side of transitional boiling). Attention is paid to the analysis of the arrangement symmetry of the observed structures and the results of solving the problems.

2. Materials and Methods

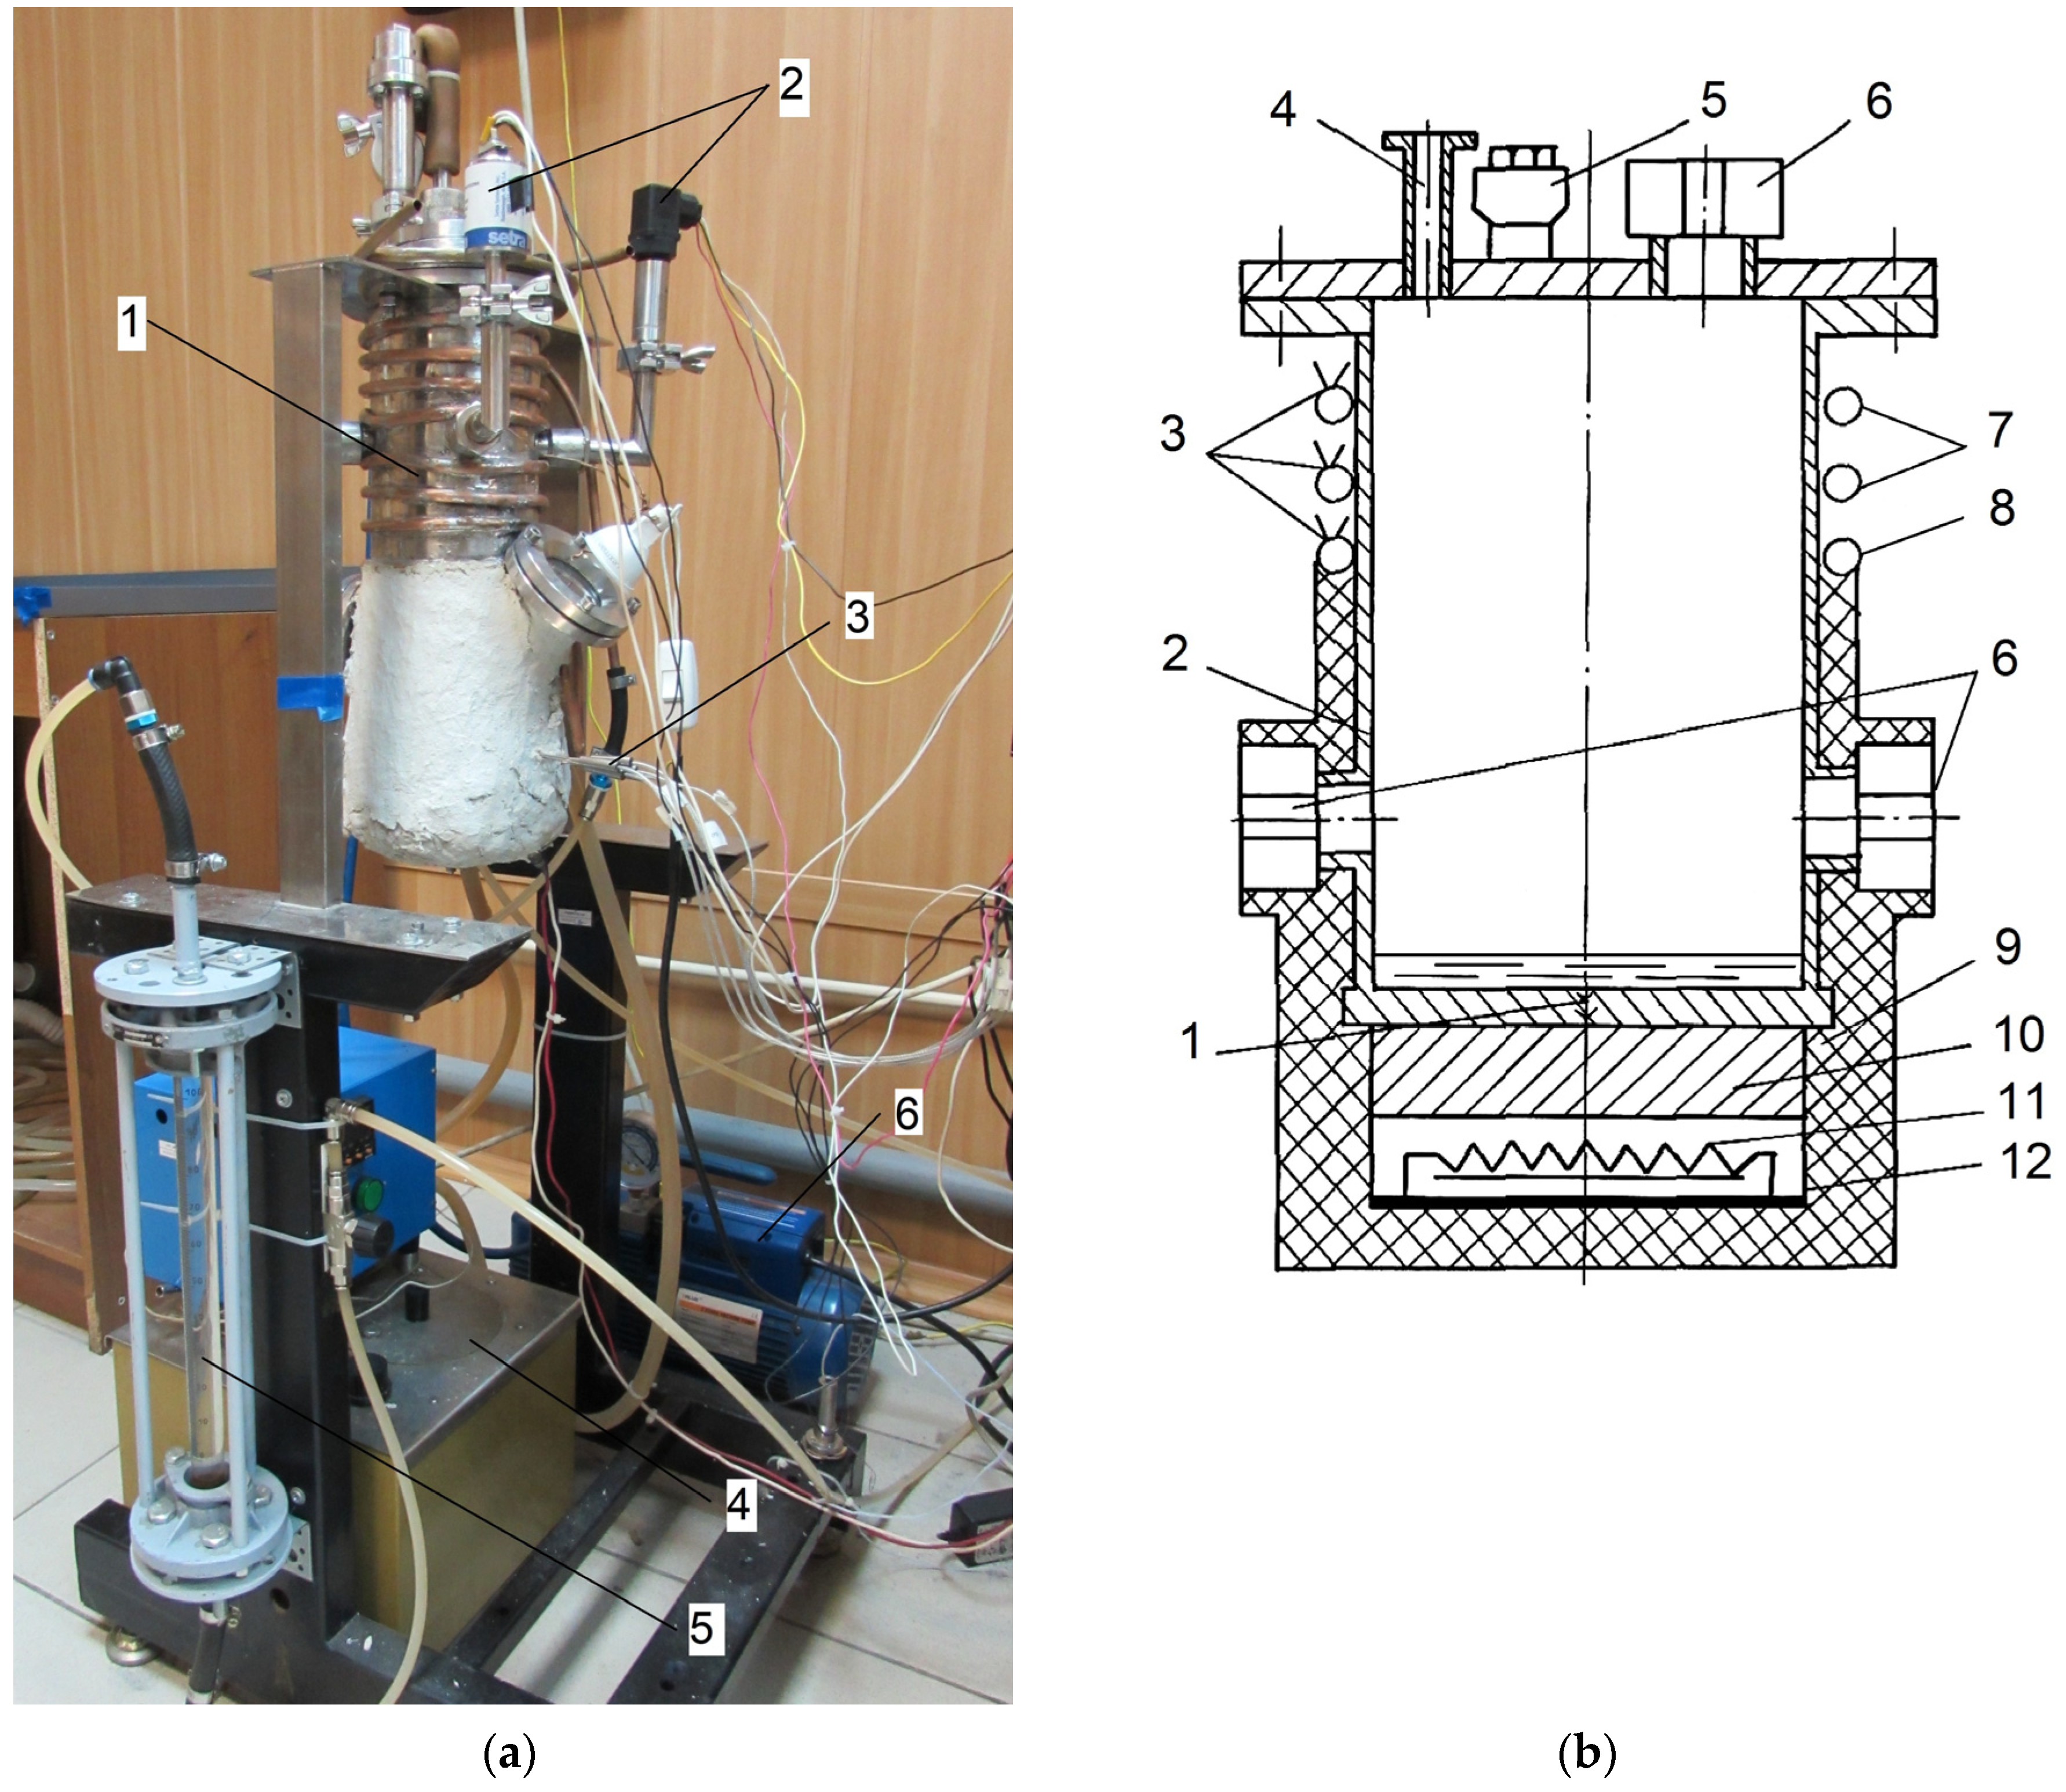
The studies were carried out using an experimental setup consisting of a working chamber, cooling system, pressure and temperature measurement system, system for collecting and processing test data, and system for controlling the heater’s power and supply. In Figure 3a, the working chamber was mounted on a frame; the pressure in the working chamber was measured using two pressure sensors. The temperature was measured with thermocouples, and the reduced pressure was created by a vacuum pump. The water flow in the cooling system of the working chamber was regulated by a rotameter; the temperature in the coil for heating the working chamber was kept constant by means of a thermostat while pumping the liquid. The ionization–deformation pressure sensor Setra-730 was used in the pressure range from 33 to 1333 Pa. The measurement error of this sensor is ± 0.5 % of the current reading. The measurement range of the deformation membrane pressure sensor, ASG Edwards, was from 133 to 2×10⁵ Pa. The measurement error is ± 0.2 % of the total scale. This sensor was used to measure pressures above 1000 Pa. Before each series of measurements, the sensor was calibrated based on the readings of a more accurate sensor (Setra-730) at low pressure, and then appropriate corrections were added to the measured data. The signals of pressure and temperature sensors were recorded using the National Instruments equipment and processed in the LabVIEW application environment. A detailed description of the setup is given in [24].
The working chamber was made in the form of a thermosyphon (Figure 3b). It is a cylindrical vessel made of steel 12Kh18N10T with an inner diameter of 120 mm, a height of 300 mm, and a wall thickness of 1 mm. To achieve a uniform distribution of the heat flux over the heated surface, a highly thermally conductive 30 mm thick brass plate was placed between the chamber bottom and a heater with a power of 2 kW. To reduce the contact thermal resistance, the gap between the chamber bottom and the plate was filled with a special highly thermally conductive paste. There is a cooling coil on the outer surface of the upper part of the chamber. The chamber was cooled by water flowing through a coil. To reduce heat loss due to leakage along the chamber walls from the bottom to the cooling coil and to ensure uniform temperature distribution at the chamber bottom, an additional coil for heating the chamber walls was mounted below the cooling coil. To perform visual observations, there were three inspection windows on the working chamber top and its wall. Two windows were used for observation and one window was used for illumination. The results of visual observations were recorded by a video camera with a shooting frequency of 24 fps and 240 fps. To measure the heating surface temperature, the copper–constantan thermocouples in stainless capillaries were inserted into five holes of 1.5 mm diameter in the bottom at different heights. The heat flux was determined from the temperature gradient measured along the bottom centerline using a linear Fourier approximation of the output signal of five thermocouples. The calculated error in determining the heat flux was about ± 16 % for a heat flux q = 10 3 W/m2, about ± 10 % for a heat flux q = 10 4 W/m2, and ± 4 % for a heat flux q = 10 5 W/m2. The surface temperature was determined using a linear extrapolation of the measured temperature profile to the surface. The total error in measuring the surface temperature was no more than ± 0.4 °C at 200°C. The pressure in the working chamber was kept constant. The lower horizontal surface (bottom) of the 12 mm thick working chamber—a horizontal smooth surface 120 mm in diameter with roughness R z = 3.2 μm, bounded by the vertical walls of the chamber—was used as the heating surface. Two surfaces with capillary-porous coatings were also used. Coatings were applied to the working chamber bottom using SLM/SLS (selective laser melting/selective laser sintering) 3D laser printing technology.
N-dodecane was used as the working fluid. The physical properties of n-dodecane were calculated according to [25]. The experiments were carried out at the following pressures P s   ( P s / P c r ) : 5 kPa (2.8 × 10⁻³), 10 kPa (5.5 × 10⁻³), and 20 kPa (1.1 × 10⁻²). When the pressure changed from 10 kPa to 20 kPa, the saturation temperature changed from 138.4 °C to 158.3 °C. The value of the capillary constant for n-dodecane varied from 1.53 mm to 1.46 mm; accordingly, the most dangerous length of the Taylor instability λ d 
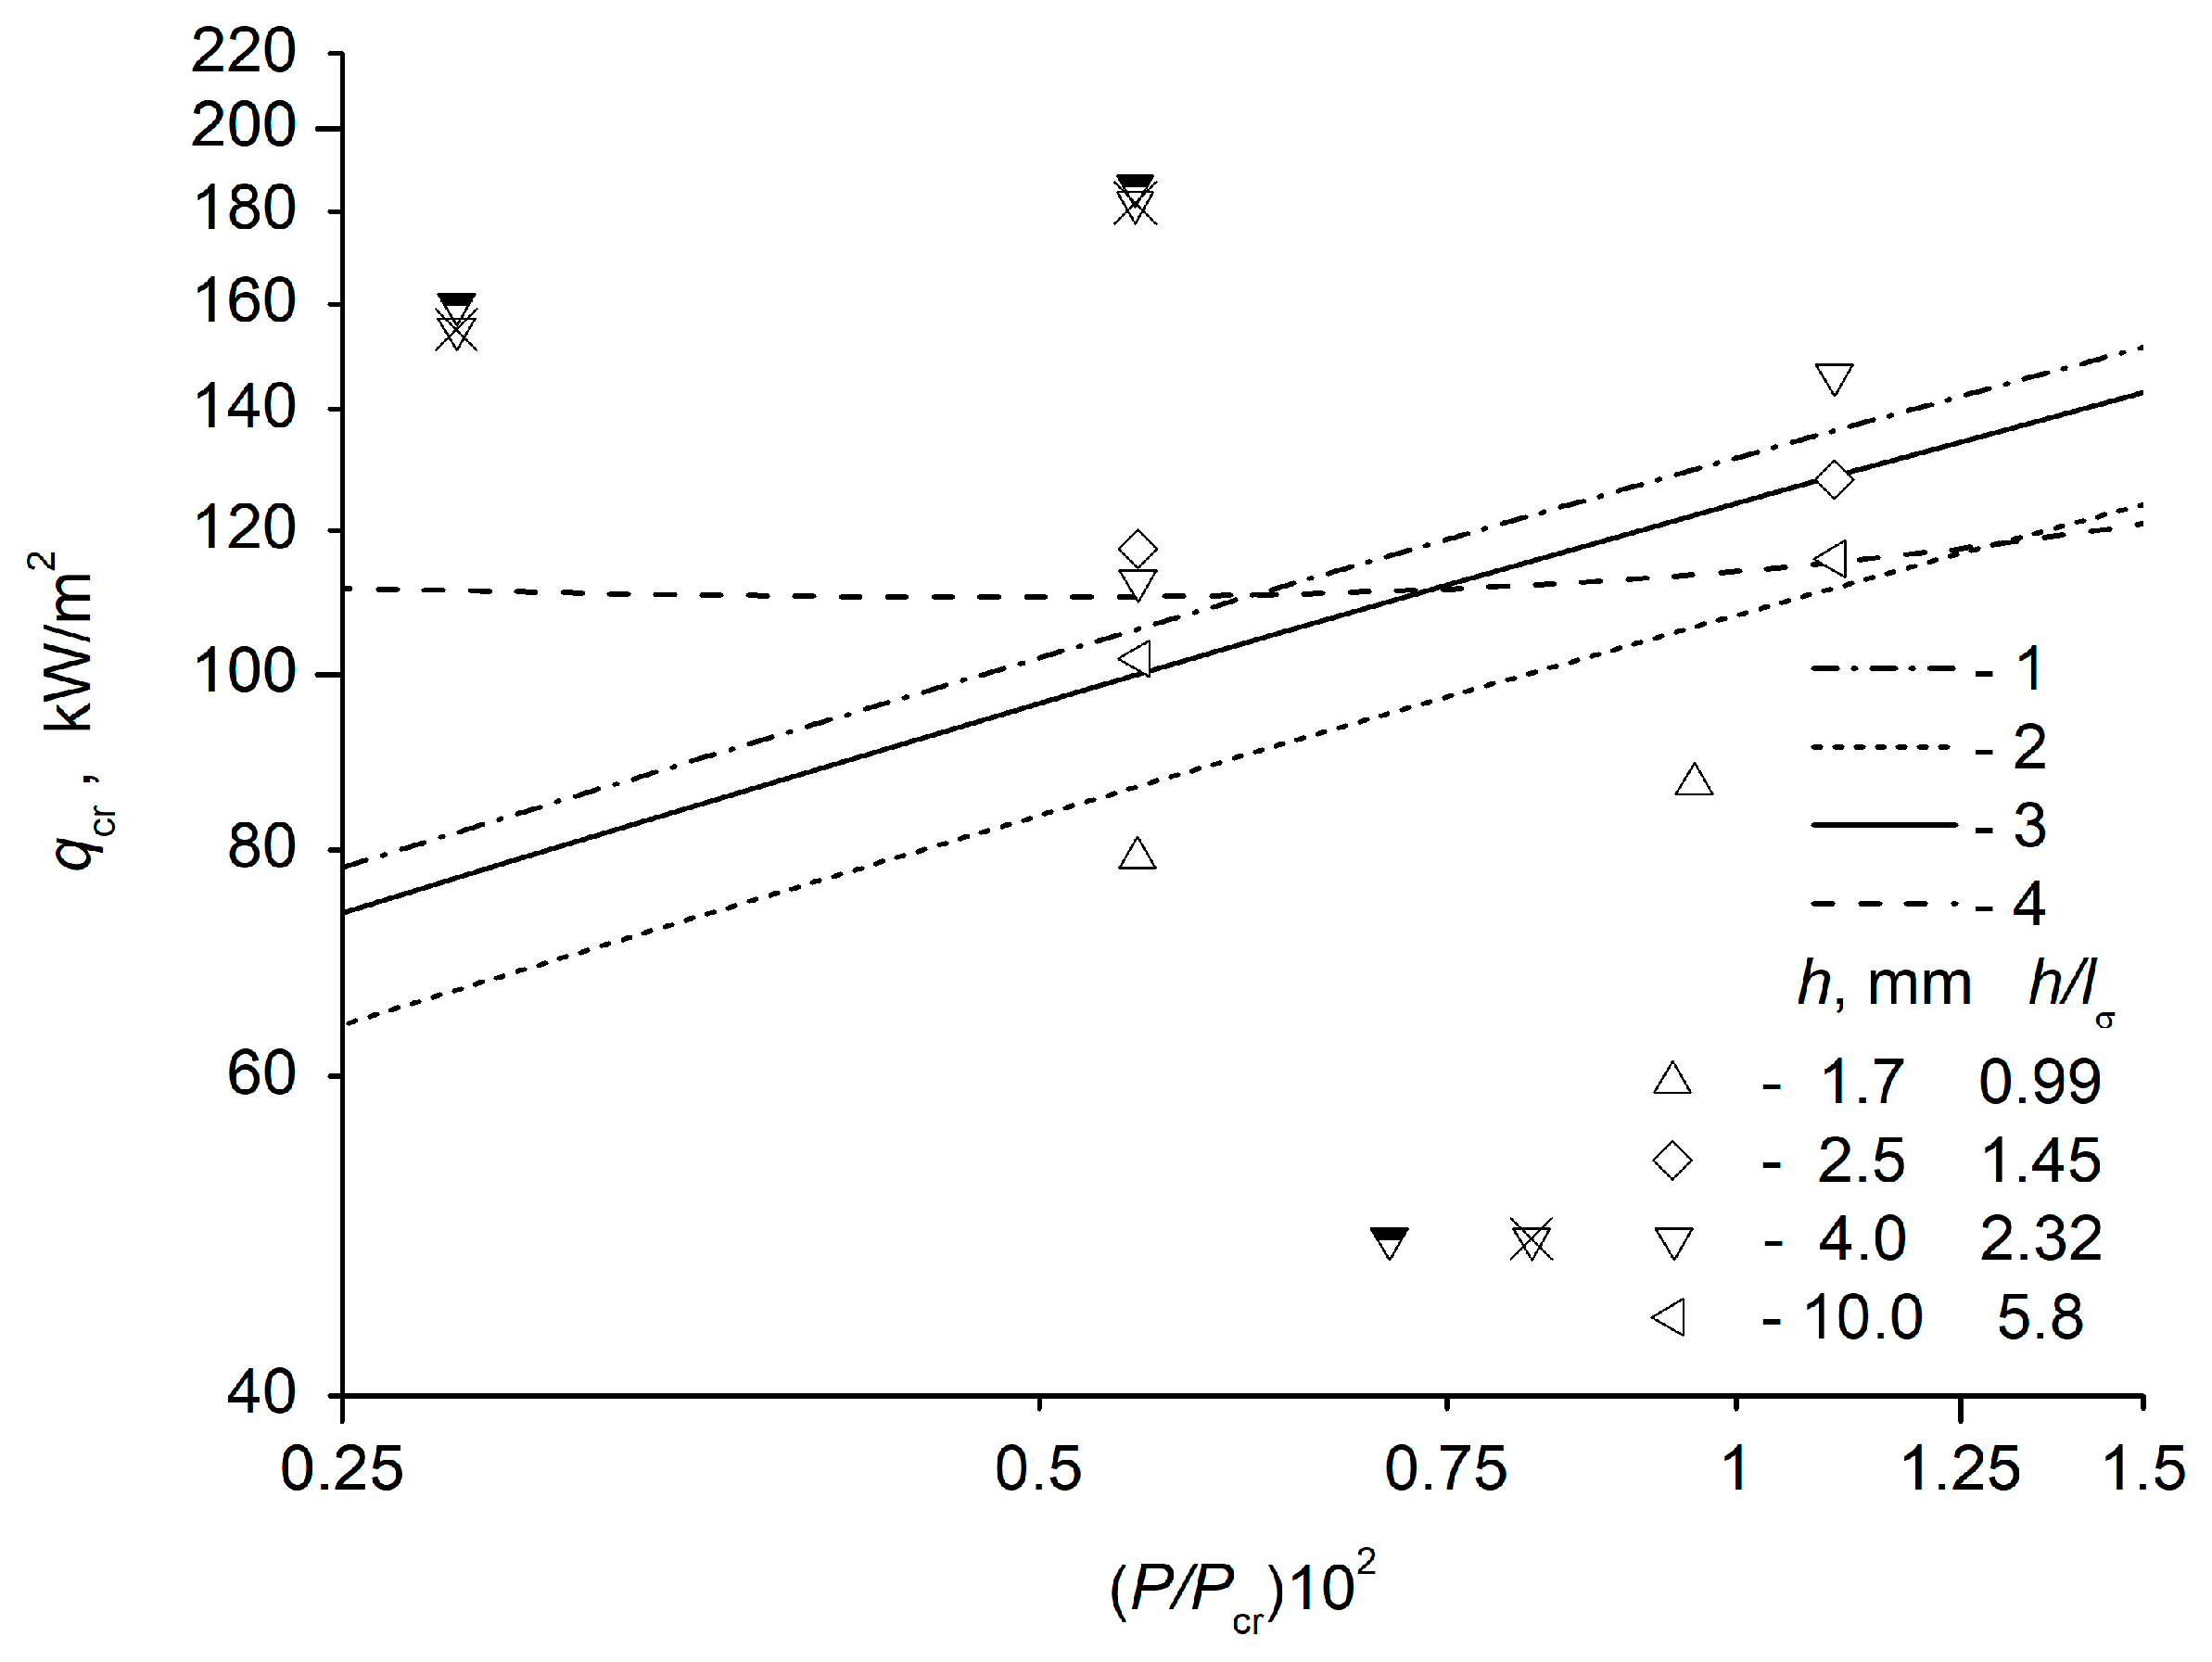
varied from 16.6 to 15.9 mm. The ratio L / λ d ~ 7.2 shows that, in terms of configuration and size, the heating surface is an infinite flat plate in the conditions of [8]. In that study, layers of n-dodecane with heights of h = 1.7 mm, 2.5 mm, 4 mm, and 10 mm were used. Some experiments on a smooth surface were carried out using a layer of Novec-7100 dielectric liquid (h = 10 mm) at a pressure of 100 kPa. The physical properties of Novec-7100 were calculated according to [26,27]. The capillary constant of Novec-7100 dielectric liquid at these pressures varies from 0.9 mm to 0.85 mm; therefore, the conditions of infinite flat plate geometry [8] also be satisfied for this liquid.

Capillary-Porous Coatings

Capillary-porous coatings of stainless steel LPW 155 (15-5PH) and bronze powder AISI C836000 were applied to the lower base (bottom) of geometrically similar chambers, specially made for each coating using laser 3D printing technology via the SLM/SLS method (selective laser melting/selective laser sintering). When applying coatings, special attention was paid to creating coatings of the same profile, with the same porosity and particle size, which remain in the porous structure. This coating technology is described in detail in [28,29].
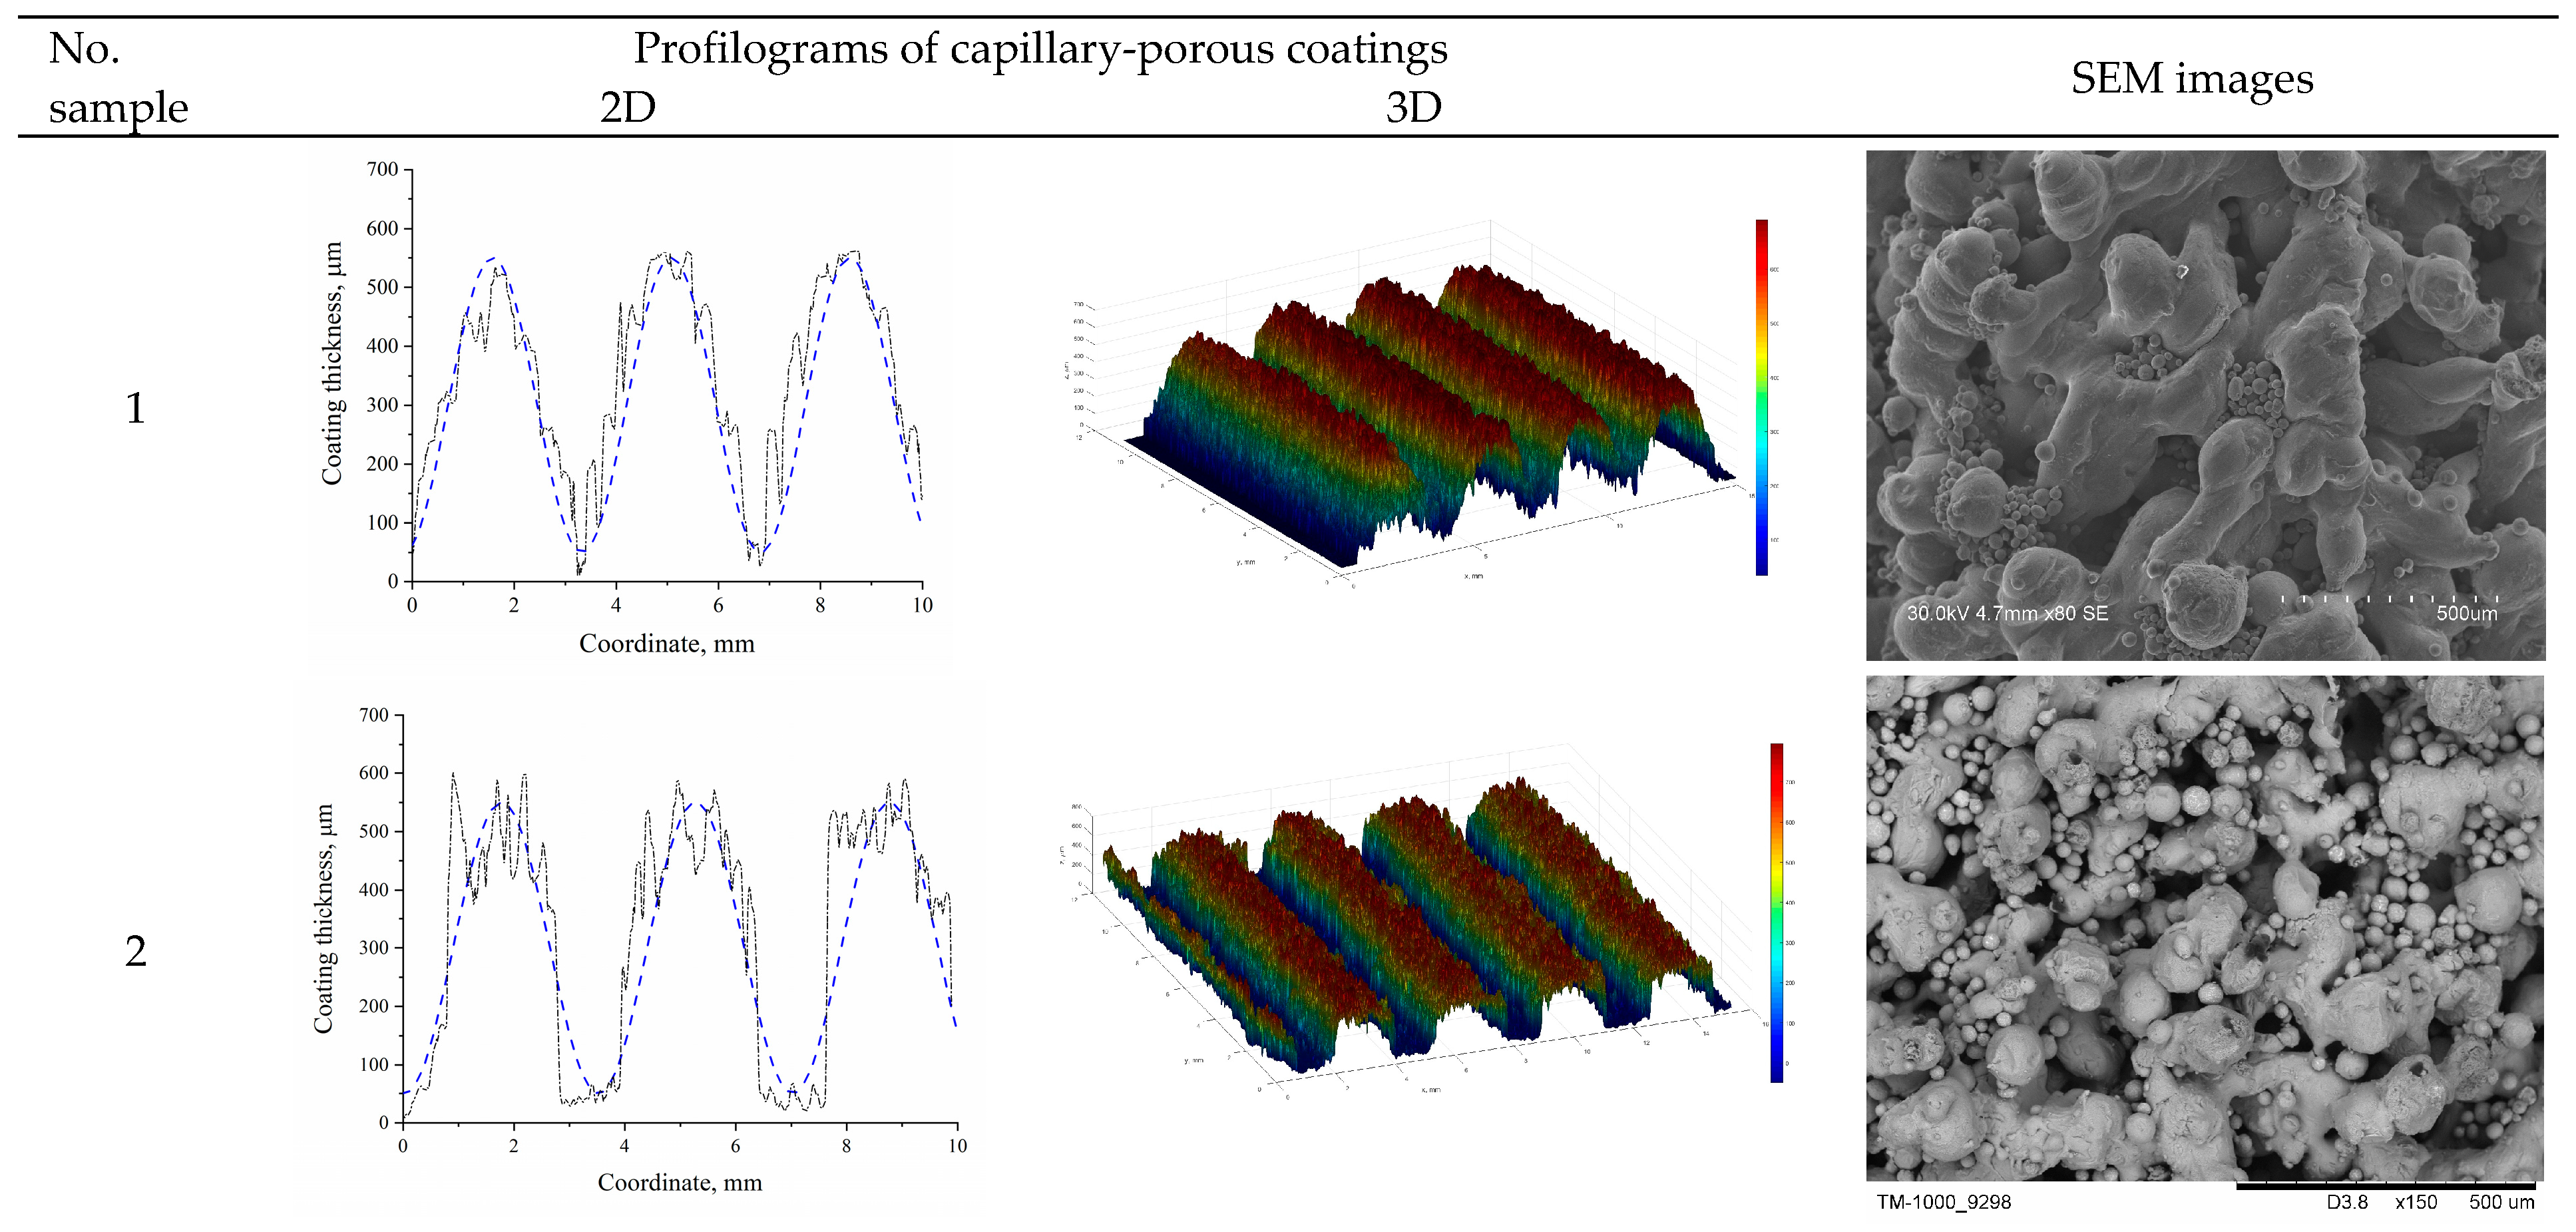
The morphology of the stainless steel sample was analyzed using a Hitachi S-3400N scanning electron microscope, and the morphology of the bronze samples was analyzed using a Hitachi TM1000 microscope. A BRUKER Contour GT-K1 optical microscope profilometer was used to plot coating profilograms. Topographic maps with thickness distribution and SEM images of the developed capillary-porous coatings No. 1 and 2 are presented in Figure 4. According to the data obtained with the help of an optical microscope profilometer, the following characteristics of the coatings were determined: the height of ridges, the thickness of the residual layer between the ridges, and modulation wavelength λm. Porosity measurements were carried out by measuring the density of samples of 10 × 10 × 5 mm and comparing the results with the density of the coating material.
The parameters of capillary-porous coatings are presented in Table 1. The effective thermal conductivity of the coating was calculated using the formula:
keff = (2 − 3 ϕ) λ/2,
where ϕ is the coating porosity; λ is the thermal conductivity of the coating material. In [30], Formula (3) was derived for the cases where the thermal conductivity was much smaller than the thermal conductivity of the coating material.

3. Results

3.1. Results of Visual Observations and CHF Measurements

In the regimes of developed nucleate boiling, the two-phase layer was represented by foam with “vapor columns” at the corners of a square array; one vapor column rose in the center (Figure 5a). The vapor columns are symmetrical with respect to the square array center when rotating by an angle multiple of π / 2 , with respect to both the axes passing through the square array diagonals and those passing through the center parallel to the sides of the square array. “Vapor columns” form when large mushroom-shaped bubbles burst. Theoretical models of instability [6,7,31] consider the instability at the gas–liquid interface. Both gases and liquids are considered continuous media. In this case, it was found that the arrangement of large mushroom-shaped bubbles, formed as a result of merging several small bubbles, obeys a certain pattern in a boiling liquid layer on the heating surface. The authors of this work were the first to record a two-dimensional instability of a boiling liquid layer via direct visual observations.
The Taylor instability [6] was analyzed for two liquids when the density of one liquid was greater than the density of the other, and the gravity vector is directed towards the liquid with a lower density. In pre-crisis regimes and at the moment of crisis, the layer of boiling liquid has a foam structure. The density of foam is greater than the density of a vapor phase. In this case, the main characteristic of the foam is a void fraction ε ε. Near the heating surface, at distances of 0.3–0.5 mm from the wall, the void fraction is ε = 0.85 0.92 and decreases with height (see, for example, [11,32]). In [11,32], water was used as a working fluid. In [11], the study was carried out in a vessel with side walls, where the influence of a horizontal liquid inflow was excluded, but the dimensions of the heating surface were much smaller than those required (according to [19,20]) to consider the heating surface as an infinite plane. In [32], the heating surface was 29 mm in diameter, and a horizontal inflow of liquid was not ruled out. In both studies (as well as in many others), it is convincingly shown that the void fraction in the near-wall layer is much higher; therefore, the density of the two-phase system (foam) in this area is lower, and thus the conditions for the Taylor instability are created.
The Taylor instability at the liquid–vapor interface for the two-dimensional case was analyzed by Sernas et al. [31]. In 1969, the authors of [31] showed that the two-dimensional wavelength of instability λ3 is larger than the one-dimensional wavelength λ2 by a factor of 2 (see Figure 5b). In addition, according to the analysis [31], in the two-dimensional case of Taylor instability, there should be one more peak at the center of the array. The peaks in Figure 5b correspond to “vapor columns”. In his analysis, Zuber used the length of the critical instability wave λ c r and the length of the most dangerous wave λ d , obtained in [7] for the one-dimensional case of Taylor instability. The proposed Zuber geometry takes the form of a square area with side λ2, as shown in Figure 5b. As shown by the comparison of the photograph and scheme shown in Figure 5, in this case, it was possible to fix an image of the two-dimensional instability of the boiling liquid layer on a horizontal surface.
To obtain the quantitative characteristics of the observed phenomenon, the diameter of vapor columns d v and the distance between their centers l v were measured from video frames. Table 2 shows the experimental results for the layers of n-dodecane on a smooth surface and on capillary-porous coatings, as well as for a layer of Novec-7100 liquid, boiling on a smooth surface.
The values of capillary constant, the critical and the most dangerous wavelengths of Taylor instability are also presented in Table 2. The error in measuring the diameter of vapor columns d v and the distance between their centers l v during boiling on a smooth surface is estimated as ±12%. The errors in measuring the diameters of vapor columns and the distances between them on the surface with a capillary-porous coating are given in Table 2. It can be seen from Table 2 that, during boiling, the distance between the centers of vapor columns on a smooth surface is slightly less than the doubled length of the most dangerous Taylor instability wave. The ratio of vapor column diameters to the distance between their centers during boiling on a smooth surface is somewhat less than 0.5, while in the Zuber theory [3,4] this ratio is taken as equal to 0.5. In the Novec-7100 dielectric liquid layer, the vapor column diameter could not be measured. The distance between large bubbles, formed at the site of vapor column destruction under the liquid layer was measured at the upper boundary of the liquid layer. The distance between the centers of vapor columns on surfaces with capillary-porous coatings was less than that on a smooth surface, while the diameters of vapor columns were approximately the same in both cases.
The results of the CHF measurement are shown in Figure 6. Unfilled symbols indicate data obtained on a smooth surface. For a layer with an initial height of 4 mm, experimental data for CHF on surfaces with a capillary-porous coating are also presented. Half-filled symbols indicate experimental data obtained for a capillary-porous stainless steel coating (sample 1). Crossed symbols denote experimental data obtained for a bronze capillary-porous coating (sample 2). For liquid layers with a height of 1.7 mm, in a n-dodecane layer on a smooth surface, a crisis of surface drying was observed. When the CHF was achieved in the middle of the heating surface, the liquid layer height decreased and a stable dry spot was formed. In the pre-crisis regime and during the crisis, a mass ejection of drops and bubbles from the liquid layer was observed. In layers of a greater height, both on smooth surfaces and surfaces with a capillary-porous coating, a hydrodynamic crisis of nucleate boiling was observed. The liquid layer was pushed aside on the heating surface, there was a vapor film under this layer, and the surface temperature increased rapidly. It can be seen from Figure 6 that the CHF on a smooth surface in a 1.7 mm layer, corresponding to the crisis of surface drying is less than the CHF in layers of a larger height, where the hydromechanical crisis of nucleate boiling occurs. Experimental data scattering exceeds the errors of experimental measurements of the heat flux densities. It can be observed that, in the layer with an initial height of 10 mm, the CHF is also less than in the layers of a smaller height. The liquid layer has a certain height, corresponding to the maximum CHF. The generalizing diagram of the effect of liquid layer height on CHF is shown in [24]. The lines corresponding to the known dependences [1,2,3,4,9,15] for calculating the CHF during pool boiling on smooth surfaces are presented in Figure 6. Experimental data significantly deviate from calculation dependences. According to Figure 6, the CHF on the surface with a capillary-porous coating exceeds the maximum CHF on a smooth heating surface by more than 1.5 times.

3.2. Hydrodynamic Model of CHF-Developed Nucleate Boiling Approach

In the calculations, foam above the near-wall region around the vapor columns was considered as an isotropic homogeneous system with a void fraction ε , and an average temperature T f , pressure P f , and density ρ f . This is a common approach to solving such problems [33]. A detailed description of the equations is given in [23]. For the most dangerous wavelength of the considered instability in the foam layer, in [23], we obtained the following:
λ f d = 2 π ( 3 σ / g ( ρ f ρ v ) ) 1 / 2
The density of foam is expressed in terms of a void fraction as follows:
ρ f = ε ρ v + ( 1 ε ) ρ l .
Let us express the density difference in the denominator of (4) in terms of void fraction and liquid density:
ρ f ρ v = ( 1 ε ) ( ρ l ρ v ) .
By substituting the Equation (5) into (4), we determine that the length of the most dangerous Taylor instability wave at the vapor–foam interface is expressed in terms of the instability wavelength at the liquid–vapor interface:
λ f d = ( 1 ε ) 1 / 2 λ d .
The void fraction was determined from the distance between vapor column centers measured in experiments. The values l v = λ f d were equated and an expression for void fraction calculation was obtained from Equation (6):
ε = 1 2 π l σ 3 l v 2 .
The calculated values of void fraction are given in Table 3. The calculated CHF values q c r t are compared with the experimental CHF values q c r , also shown in Table 3.
To calculate CHF, we used the formal mathematical apparatus developed by Zuber [3,4]. Formulas for calculating CHF were derived in [23]. Here, only the main relations are presented, with some explanations that are not reflected in [23]. To calculated CHF values, the following expression was obtained in [23]:
q c r t = h L G ρ v A v A σ m ρ v 1 / 2 1 + ρ v ρ f 1 / 2 ,
where ( A v / A ) is the ratio of the area of the vapor column cross-section A v to the area of the surface from which it rises, A , m = 2 π / λ H f is the critical Helmholtz wave number, and λ H f is the critical wavelength for developing the Helmholtz instability of the vapor–foam interface of vapor columns rising from the heating surface.
In [34], the critical heat fluxes and separation diameters of bubbles were studied at heat fluxes close to and equal to CHF on a flat heating surface in a pressure range from 0.1 to 7 MPa. The study shows that the maximum diameter of coalesced bubbles is close to the Taylor instability wavelength in the studied pressure range. In [23], it is considered that vapor columns are formed as a result of the transformation of these large hemispherical coalesced bubbles, whose diameter at the moment that the transformation begins is equal to the length of the most dangerous Taylor instability wave, derived from the liquid density. This means that the dimensions of vapor columns do not depend on the void fraction of the liquid layer, while the distance between the centers of bubbles depends on ε; therefore, depending on the void fraction, the area ratio ( A v / A ) will change. Further, this bubble transforms into a vapor column in the form of a cylinder with the same volume as the bubble and a height equal to the bubble height ( 0.5 λ d )
By equating the wavelength of the Helmholtz instability to the vapor column radius, we obtain:
λ H f = ( 1 / 6 ) 1 / 2 λ d
The CHF, after substituting all values into (7), is equal to:
q c r t = π 6 ( 1 ε ) 2 1 / 4 h L G ρ v σ g ( ρ l ρ v ) ρ v 2 1 / 4 1 + ρ v ρ f 1 / 2 ,
where
k = π 6 ( 1 ε ) 2 1 / 4 = 0.623 ( 1 ε )
is usually called the Kutateladze constant.
As shown in Table 3, the maximum deviation of calculated CHF values from those obtained in the experiments is 4.7%. Table 3 shows that the void fraction in the layer on capillary-porous surfaces is less than that on a smooth surface, and the CHF value is greater. A decrease in the void fraction in the layer on capillary-porous surfaces may relate to a decrease in the separation diameters of bubbles on these surfaces as compared to the smooth ones. A decrease in the separation diameters of bubbles during liquid boiling on porous surfaces relative to the data obtained on smooth samples is noted in many papers, for example [35,36,37,38]. According to the data from [39], bubbles rise according to the Stokes law when the rate of bubble rise increases with increasing bubble diameter d b ; this is observed up to Reynolds numbers of Re = 450 . For n-dodecane, under experimental conditions, these bubble sizes are d b 0.19 mm. The rise rate of bubbles with a larger diameter is described by the following dependence:
u b = 2.14 σ ρ l d b + 0.505 g d b
Since the vapor density is much lower than the density of liquid, it can be neglected, and this expression can be written in the following form:
u b = 2.14 l σ 2 d b + 0.505 d b 1 / 2 g
The function defined by Formula (10) has a minimum at d b 2.06 l σ ; for n-dodecane, it is approximately 3.25 mm. Therefore, in the range of separation diameters of n-dodecane bubbles from 0.19 mm to 3.25 mm, the rate of bubble rise increases with a decrease in their separation diameters. Bubble diameters in the foam layer, measured from the photograph (see Figure 5a) are approximately 2–3 mm. On a capillary-porous surface, the separation diameters of bubbles are smaller, their rise rate is higher, the vapor phase is carried away faster, and the void fraction is less than that on a smooth surface.
A two-phase system is called foam if the void fraction of this system is ε 0.5 . In this case, the process on surfaces with coatings occurs in a foam layer with a limiting value of void fraction. Perhaps this is some limiting case that can be described using this model. The boiling process on capillary-porous coatings is much more complicated, and the influence of not all parameters can be taken into account in this model. The given example shows that the processes in the near-wall region (microhydrodynamics) affect the external hydrodynamics.
An idea about the development of the physics of crisis phenomena is expressed in [18]. Within the framework of the model [18], it is assumed that the crisis occurs due to the development of the Landau instability on the free surface of liquid films in the macrolayer under large vapor conglomerates. Therefore, the CHF value is proportional to the area of the wetted surface Swet in the pre-crisis regime. In this case, k~(1 − ε)~Swet, since the area of the wetted surface usually decreases with increasing vapor content. This result does not contradict modern ideas about the physics of the development of crisis phenomena.
For values of constant k varying between 0.13 and 0.19, as recommended by Kutateladze in [1,2], the corresponding calculated void fraction ε varies between 0.791 and 0.694. The values of the void fraction actually coincide with the range of its change obtained in the study by Kutateladze and Malenkov [40]. In bubbling processes, the void fraction is proportional to the reduced gas velocity ε u g , where u g is the reduced gas velocity. The criterion for the hydrodynamic stability of a two-phase layer during bubbling is expressed by the following formula:
k = u g c r ρ g 2 g σ ( ρ l ρ g ) 1 / 4 ,
where u g c r is the critical reduced gas velocity at which the near-wall liquid layer is rearranged during bubbling, and ρ g is gas density. Thus, if we consider the bubbling process at a constant pressure, we obtain k~ε. Therefore, with small changes in critical velocity u g c r , the k criterion will increase with the increasing void fraction, while at CHF, according Equation (9) of this study, the Kutateladze constant will decrease.
The resulting expression (8) describes CHF through the parameters of external hydrodynamics. Until the very moment of the crisis, the liquid layer is in contact with the heating surface. Therefore, any processes caused by the six different CHF mechanisms, which are prevalent in the literature, can trigger the boiling crisis: bubble interference [41], hydrodynamic instability [3,4], macrolayer dryout [22], hot/dry spot [11,15], interfacial lift-off [9,42], and the model of multilayer liquid film adsorption under a vapor mass [43]. In this model, these mechanisms are not considered in detail. Processes directly on the heating surface change the structure of the near-wall layer with an increase in heat flux, affecting external hydrodynamics through vapor content, separation sizes of the bubbles, and changes in the instability wavelength. Ultimately, the affects the CHF value.

3.3. Symmetrical Problem—Transitional Boiling Approach (Zuber Problem)

In the Zuber theory of boiling crisis [3,4], a vapor film that is already formed on the heating surface is considered; the approach to the boiling crisis is considered from the side of the transitional boiling regime. It does not take into account the conditions on the heating surface, and there is a problem with the identification of “vapor columns”.
As noted by Theofanous et al. [11], in the Zuber theory, the ratio of height to the smallest transverse dimension must be small. If we consider the boiling crisis model in the infinite plane approximation [8], the liquid layer must also be a finite height. In most experiments, the heater dimensions are usually identified, but the height of the liquid layer is not reported.
In [24], the authors present a photograph of the liquid layer (n-dodecane) obtained 5 s after the crisis (see Figure 7).
The liquid layer structure changes dramatically after the crisis. The layer of foam with vapor columns in the pre-crisis regimes (Figure 5a) passes into the layer of vapor columns with rising, densely packed bubbles of almost the same size (Figure 7). The sizes of large bubbles are almost equal to the length of the most dangerous wave of the Taylor instability λ d . Under conditions of a pool boiling crisis in the infinite plane approximation, when the layer is high, these vapor columns cannot be observed, apparently due to hydrodynamic instability, as should be the case. In [24], during the study of boiling crises in n-dodecane layers on a smooth surface, such a pattern was observed only in 4 mm high layers. Below each bubble in the photograph, there is another column of bubbles that replaces the top bubble when it collapses. Vapor rises up along the vapor columns and liquid moves down along the menisci at the bubble boundary. By taking a bubble collapse pattern in which, at one moment, bubbles burst simultaneously at the sites (corresponding to the peaks in Figure 5b), and at the next moment, bubbles burst simultaneously at the sites of trough locations, we obtain the process flow diagram shown in Figure 8a. As shown in Figure 7, if the bubble diameters are equal to λ d , the wavelength for a two-dimensional instability will be equal to λ 3 = 2 λ 2 = 2 λ d , where λ 2 = λ d is the most dangerous wavelength of the Taylor instability, obtained for the one-dimensional case in [7], as shown in Figure 8a. The side of the square grid corresponding to Zuber geometry will be equal to 2 λ 2 = 2 λ d , as it is shown in Figure 8a. The proposed Zuber scheme for the arrangement of vapor columns (Figure 8), depicted in a figure from [20], takes the form corresponding to experimental observations (Figure 8b).
In the diagram (Figure 8a) λ 2 = λ d ; the side of the square grid is λ d 2 ; the length of the most dangerous Taylor instability wave is λ d = 2 π l σ 3 ; the vapor column radius is R j = λ d / 2 ; the Helmholtz instability wavelength is λ H = 2 π R j = π λ d ; the velocity at which the vapor jets become unstable, according to Helmholtz, is U H = ( σ m / ρ v ) 1 / 2 ; and the wave vector is m = 2 π / λ H . By substituting these values into the general expression for the critical heat flux [20]:
q c r = h L G ρ v A v A U H ,
we obtain the following:
q c r = 0.168 h L G ρ v σ g ( ρ l ρ v ) ρ v 2 1 / 4 .
For the considered regime of n-dodecane boiling on a smooth surface at a pressure of 20 kPa in a layer 4 mm high (see Table 3), the experimentally determined value of the critical heat flux is 146 kW/m2. When using Formula (11) for calculations, the heat flux is 143 kW/m2 and the difference is 2%.
If the vapor columns are located, as shown in Figure 8a, the columns corresponding to the peaks work first, and then the columns corresponding to the troughs work; then, in each cycle of “work”, ( A v / A ) = π / 8 . Figure 8b shows only the “working” columns. Due to the symmetry of arrangement of columns corresponding to peaks and troughs (see Figure 8a), this scheme of the process does not change over time, regardless of the working column (corresponding to peaks or troughs). However, columns that do not “work” at a certain point in time are also filled with vapor, so the ratio for the entire liquid layer is twice as large. Therefore, the void fraction of the layer in this model is equal to ε = π / 4 , which is in good agreement with the experimental data.
If the CHF is calculated using the first part of the model (Formula (8)), the value of the Kutateladze constant for the regime of n-dodecane boiling on a smooth surface at pressure of 20 kPa in a layer with an initial height of 4 mm (see Table 3) and with void fraction ε = 0.737 is k = 0.623 ( 1 ε ) = 0.623 ( 1 0.737 ) = 0.164 . A comparison with Formula (11) shows that the difference is ≈ 2.4%. At a pressure of 10 kPa (see Table 3) in a layer with an initial height of 4 mm, the void fraction is ε = 0.731 and k = 0.168, which coincides with the calculation made using Formula (11). Thus, for a smooth surface, numerical calculations show that the results for the solution with different approaches are equivalent.

4. Discussion

A significant number of studies focus on the very topical issues of calculating and researching CHF. Most of this research was carried out on the topic of pool boiling when the height of the liquid layer is not specified. There is a relatively small number of studies performed under reduced pressure conditions, when the influence of the height of the liquid layer is taken into account and the height of the liquid layer is indicated. A review of these studies is given in [44]. Experimental data on CHF for horizontal liquid layers are very limited. In our study [24], it was found that CHF depends on the height of the liquid layer during nucleate boiling. Similar results were obtained earlier in [45,46], and in a later study [47]. In [45,46,47], heating surfaces of much smaller sizes were used, which do not satisfy the conditions of the model under consideration. In these studies, there are no data on the wavelengths of the instabilities. Therefore, at this stage, unfortunately, we can only compare calculations with our experimental data. In our experiments, a large number of measurements of the distances between the centers of vapor columns and diameters of vapor columns were carried out, necessary for their statistical processing. These results were obtained only in limited series of experiments. It was shown that the distance between mushroom-shaped bubbles depends on the void fraction of the liquid layer between them.
The importance of taking into account the influence of the void fraction ε on CHF was shown in experiments [14] within the framework of the analogy between the processes of boiling and bubbling. It follows from these experiments that k~ε; therefore, CHF in solutions with surfactant additives should increase, but this is usually not observed in experiments. In this study, it was found that k~(1 − ε), which explains the decrease in CHF in solutions with the addition of surfactants.
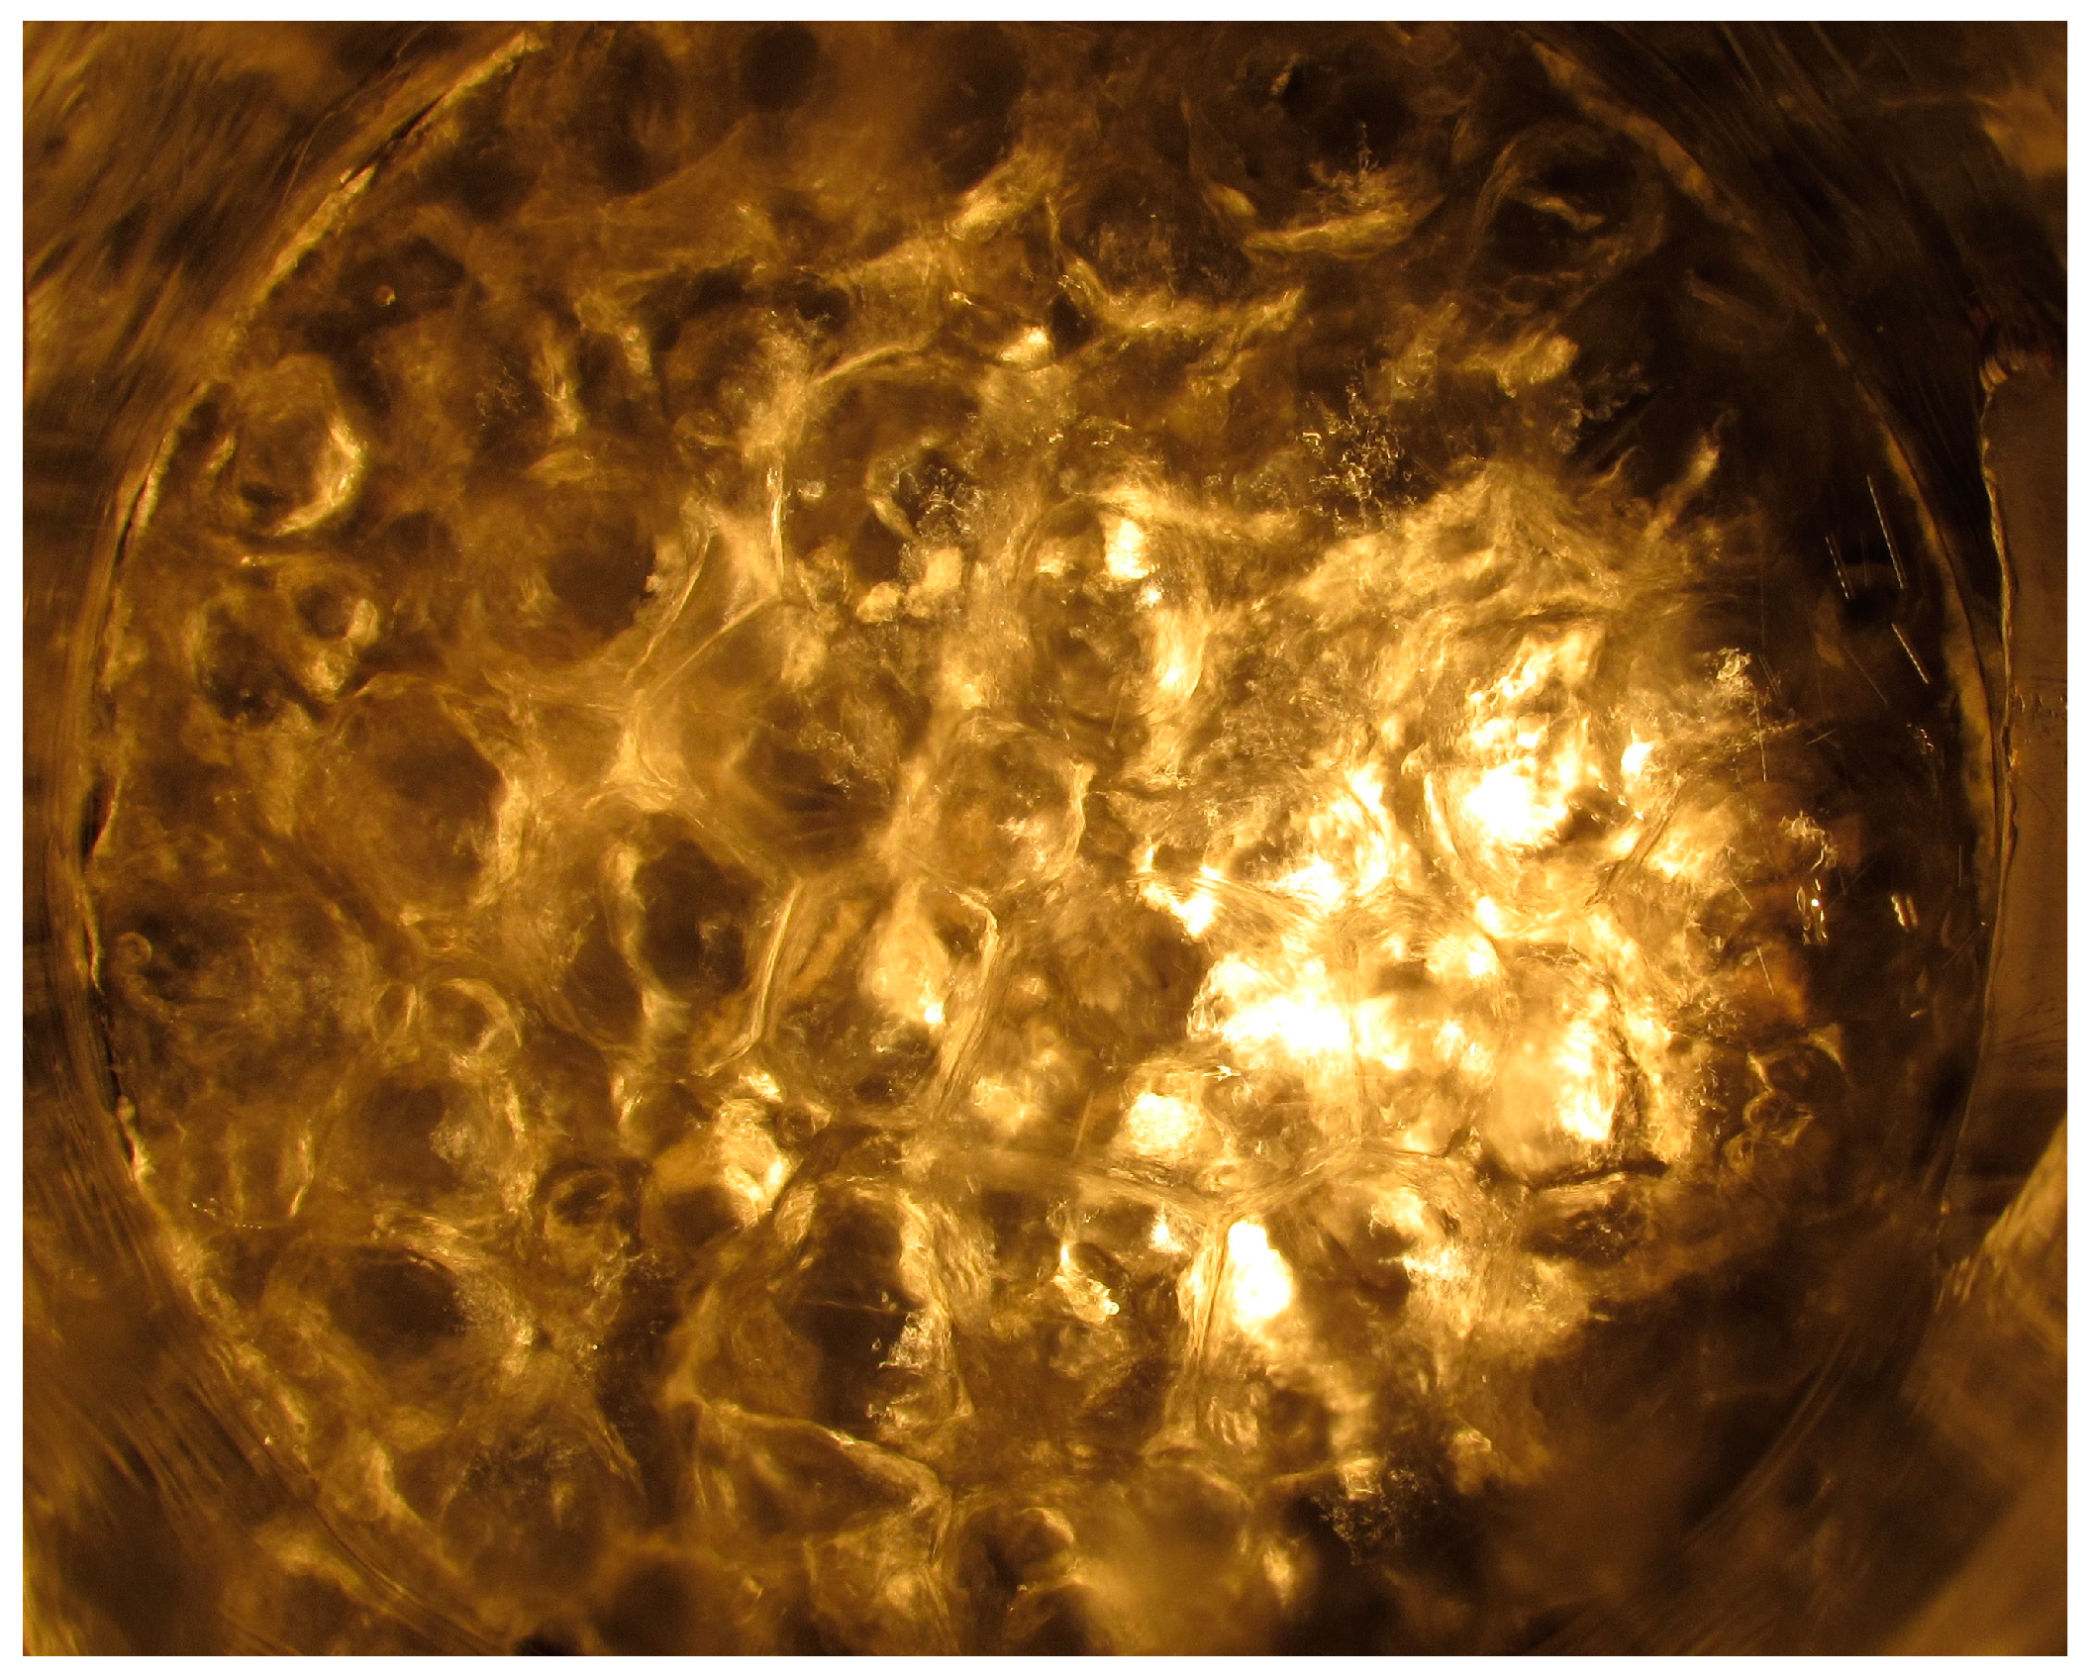
Only in one experiment of our study on a smooth surface were the vapor columns visualized in the transition boiling region in a layer with an initial height of 4 mm (Figure 7). The liquid layer with an initial height of 2.5 mm in the expanded state, taking into account the vapor content, has a height of approximately 10 mm, which is not sufficient for the formation of vapor columns. The liquid layer with an initial height of 4 mm in the expanded state, taking into account the vapor content, has a height of approximately 16 mm, which is sufficient for the formation of vapor columns (Figure 7), but less than the wavelength of the Helmholtz instability, which for n-dodecane, is approximately equal to λ H = π λ d 50 mm. The liquid layer with an initial height of 10 mm in the expanded state, taking into account both the void fraction ε = π / 4 , and expansion with increasing temperature at a pressure of 20 kPa, has a height of approximately 54 mm. The height of this layer is greater than the wavelength of the Helmholtz instability, so the formation of vapor columns does not occur.
For a layer with an initial height of 4 mm, the numerical values of k in the expressions obtained for CHF, both when approaching the crisis from the side of developed nucleate boiling (8) and in the expression (11) for the symmetric problem (the Zuber problem), were solved for a given particular case. However, this does not suggest that it is necessary to take k = 0.168 for all other cases. In our experiments, for a thinner layer with an initial height of 2.5 mm and for a thicker layer with an initial height of 10 mm, the constant k , when approaching the crisis from the side of developed nucleate boiling, has different values.
This paper does not consider any mechanism triggering the boiling crisis. Regardless of the specific mechanism that determines the critical heat flux value during boiling, the development of the crisis is ultimately caused by the process of a sharp increase in the relative share of the area occupied by dry spots formed in a macrolayer near the heat-releasing surface. In the calculated dependence obtained using the mathematical apparatus proposed by Zuber, when the crisis is considered in terms of developed nucleate boiling, one more important parameter is introduced: the void fraction of the boiling liquid layer under the conditions of infinite plane geometry. The relative share of the area occupied by dry spots formed in a macrolayer near the heat-releasing surface depends on the void fraction of the liquid layer. The void fraction content cannot take into account the effect of all parameters; however, it can be measured in several independent ways, which allows the effect of this parameter to be identified, especially when used in boiling on coatings. New experiments are required to measure the layer void fraction, for example, using X-rays, capacitive methods, and adapted optical methods.
It is necessary to study the structure of a two-phase layer, the dependence of the wetted surface share, the void fraction, and the size of bubbles in the foam layer on the heat flux at various reduced pressures and with different wetting properties regarding the heat-releasing surface, thermal diffusivity, and heater wall thickness.
Most of the results of research on the process of liquid boiling were obtained in experiments where water was used as a working fluid. For water boiling at atmospheric pressure, the length of the most dangerous Taylor instability wave is λ d = 27.2 mm; then, to confidently observe the two-dimensional instability of the boiling water layer, as in this study, the characteristic diameter of the heating surface should be approximately equal to 7 λ d 190 mm. Considering that the CHF for boiling water is much higher than that for n-dodecane, the creation of heating surfaces at this diameter presents great technical difficulties and has not been implemented in any known scientific experiments on water boiling.
It is advisable to carry out subsequent comprehensive studies on measuring both the CHF value and visualization of the boiling process in liquid layers of finite height in order to expand the comparative base using the conclusions of our model. Research should be carried out using various liquids, including dielectric liquids, on heaters of various sizes. The variation in heater dimensions is necessary to take into account as a scale factor, which is very important for the use of design ratios in engineering practice. Boiling in thin horizontal liquid layers is used in thermosyphons, as well as for a number of immersion cooling tasks, when the height of the layer can be small due to the compactness of the equipment elements. In this case, it is important to know the minimum height of liquid layers that can be used in designs to eliminate the risk of CHF at low heat fluxes. Thermosyphons and immersion cooling systems are now used in microelectronics and for cooling power electronics.
To study the effects of conditions on the heating surface on CHF, which are not taken into account by the classical theory of boiling crises, but can be taken into account when approaching CHF from the side of developed nucleate boiling, studies using modified heat-releasing surfaces (capillary-porous, mesh coatings, etc.) are required.

5. Conclusions

This model considers CHF in a horizontal liquid layer of a finite height, based on the visual observation of “vapor columns”, both from the side of developed nucleate boiling and transitional boiling (a symmetrical problem).
In both cases, the solution of the problem is expressed through the same parameters of external hydrodynamics; the difference lies in the form of writing the Kutateladze constant. In the approach from the side of developed nucleate boiling, the Kutateladze constant depends on the void fraction. Despite the difference in writing the Kutateladze constant, numerical calculations show the similar equivalence of the descriptions of experimental results.
In the first part of the solution (the developed nucleate boiling approach), the contact of liquid with the heating surface is taken into account; therefore, any of the currently known mechanisms can be the mechanism for the boiling crisis beginning.
The new solution of the classical Zuber problem for a CHF in a liquid layer of finite height eliminates the shortcomings of the previous solution, such as the difficulty of identifying “vapor columns” on an infinite flat surface and the discrepancy between the void fractions obtained as a result of theoretical solutions and measurements in experiments. In the experimental solution, the identification of “vapor columns” in the liquid layer was performed as a result of a direct visual observation with a video recording of the process in the transition boiling region. In the new theoretical solution, built taking into account visual observations, the void fraction of the layer is close to that observed in experiments.
As a result of processing experimental data for liquid layers, it was shown that the conditions on the heating surface (the presence of capillary-porous coatings) affect the void fraction of the layer, and thus their effect on CHF is taken into account.

Author Contributions

Conceptualization, A.N.P.; validation, V.I.Z.; formal analysis, A.N.P. and V.I.Z.; investigation, V.I.Z.; resources, A.N.P.; writing—original draft preparation, V.I.Z.; writing—review and editing, A.N.P.; visualization, V.I.Z.; project administration, A.N.P.; funding acquisition, A.N.P. All authors have read and agreed to the published version of the manuscript.

Funding

This research was funded by the Russian Science Foundation, grant No. 23-19-00245.

Data Availability Statement

Data are contained within the article.

Acknowledgments

The authors are grateful to V. P. Bessmeltsev for contributing to the creation of the capillary-porous coating used in this study.

Conflicts of Interest

The authors declare no conflict of interest.

References

  1. Kutateladze, S.S. Hydromechanical model of heat transfer crisis in free-convection boiling. J. Tech. Phys. 1950, 20, 1389–1392. [Google Scholar]
  2. Kutateladze, S.S. Hydrodynamic theory of boiling regime transition in free convection. Izv. Akad. Nauk SSSR Otd. Tekh. Nauk. 1951, 4, 529–536. [Google Scholar]
  3. Zuber, N. Hydrodynamic Aspects of Boiling Heat Transfer. Ph.D. Thesis, University of California, Los Angeles, CA, USA, Ramo-Wooldridge Corp., Los Angeles, CA, USA, 1959. [Google Scholar]
  4. Zuber, N. On the stability of boiling heat transfer. Trans. ASME 1958, 80, 711–720. [Google Scholar] [CrossRef]
  5. Westwater, J.W.; Santangelo, J.G. Photographic Study of Boiling. Ind. Eng. Chem. 1955, 47, 1605–1610. [Google Scholar] [CrossRef]
  6. Taylor, G.I. The Instability of Liquid Surfaces When Accelerated in a Direction Perpendicular to Their Plane. Proc. R. Soc. Lond. Ser. A 1950, 201, 192–196. [Google Scholar]
  7. Bellman, R.; Pennington, R.H. Effects of surface tension and viscosity on Taylor instability. Q. Appl. Math. 1954, 12, 151–162. [Google Scholar] [CrossRef]
  8. Lienhard, J.H.; Dhir, V.K. Hydrodynamic prediction of peak pool-boiling heat fluxes from finite bodies. Trans. ASME J. Heat Transf. 1973, 95, 152–158. [Google Scholar] [CrossRef]
  9. Mudawar, I.; Howard, A.H.; Gersey, C.O. An analytical model for near-saturated pool boiling critical heat flux on vertical surfaces. Int. J. Heat Mass Transf. 1997, 40, 2327–2339. [Google Scholar] [CrossRef]
  10. Theofanous, T.G.; Tu, J.P.; Dinh, A.T.; Dinh, T.N. The boiling crisis phenomenon: Part I: Nucleation and nucleate boiling heat transfer. Exp. Therm. Fluid Sci. 2002, 26, 775–792. [Google Scholar] [CrossRef]
  11. Theofanous, T.G.; Tu, J.P.; Dinh, A.T.; Dinh, T.N. The boiling crisis phenomenon: Part II: Dryout dynamics and burnout. Exp. Therm. Fluid Sci. 2002, 26, 793–810. [Google Scholar] [CrossRef]
  12. Gaertner, R.F. Photographic Study of Nucleate Pool Boiling on a Horizontal Surface. Trans. ASME Ser. C J. Heat Transf. 1965, 87, 17–29. [Google Scholar] [CrossRef]
  13. Gogonin, I.I.; Kutateladze, S.S. Critical heat flux as a function of heater size for a liquid boiling in a large enclosure. J. Eng. Phys. 1977, 33, 1286–1289. [Google Scholar] [CrossRef]
  14. Kutateladze, S.S.; Malenkov, I.G. Hydrodynamic analogy between heat transfer and nucleate boiling crisis in boiling and bubbling. Experimental data. Heat Transf. Sov. Res. 1984, 16, 1–46. [Google Scholar]
  15. Yagov, V.V. Is a crisis in pool boiling actually a hydrodynamic phenomenon? Int. J. Heat Mass Transf. 2014, 73, 265–273. [Google Scholar] [CrossRef]
  16. Surtaev, A.S.; Serdyukov, V.S.; Zhou, J.; Pavlenko, A.N.; Tumanov, V. An experimental study of vapor bubbles dynamics at water and ethanol pool boiling at low and high heat fluxes. Int. J. Heat Mass Transf. 2018, 126, 297–311. [Google Scholar] [CrossRef]
  17. Kim, H.; Kim, D.E. Effects of surface wettability on pool boiling process: Dynamic and thermal behaviors of dry spots and relevant critical heat flux triggering mechanism. Int. J. Heat Mass Transf. 2021, 180, 121762. [Google Scholar] [CrossRef]
  18. Pavlenko, A.N. On the physics of the development of boiling crisis phenomena (comments on the article of E. D. Fedorovich “On the expediency of developing a two-stage model of boiling crisis of a liquid wetting a heating surface”). Therm. Eng. 2020, 67, 853–859. [Google Scholar] [CrossRef]
  19. Lienhard, J.H.; Dhir, V.K.; Riherd, D.M. Peak Pool Boiling Heat-Flux Measurements on Finite Horizontal Flat Plates. Trans. ASME J. Heat Transf. 1973, 95, 477–482. [Google Scholar] [CrossRef]
  20. Lienhard, J.H.; Dhir, V.K. Extended Hydrodynamic Theory of the Peak and Minimum Pool Boiling Heat Fluxes; NASA Report No. CR-2270; University of Kentucky: Lexington, KY, USA, 1973. [Google Scholar]
  21. Lienhard, J.H. Snares of pool boiling research: Putting our history to use. In Proceedings of the 10th International Heat Transfer Conference, Brighton, UK, 14–18 August 1994; Volume 1, pp. 333–348. [Google Scholar]
  22. Haramura, Y.; Katto, Y. A new hydrodynamic model of critical heat flux, applicable widely to both pool and forced convection boiling on submerged bodies in saturated liquids. Int. J. Heat Mass Transf. 1983, 26, 389–399. [Google Scholar] [CrossRef]
  23. Zhukov, V.I.; Pavlenko, A.N. Crisis of nucleate boiling in a finite-height horizontal layer of liquid. J. Eng. Thermophys. 2020, 29, 1–13. [Google Scholar] [CrossRef]
  24. Zhukov, V.I.; Pavlenko, A.N. Heat transfer and critical phenomena during evaporation and boiling in a thin horizontal liquid layer at low pressures. Int. J. Heat Mass Transf. 2018, 117, 978–990. [Google Scholar] [CrossRef]
  25. Yaws, C.L. Handbook of Thermodynamic and Physical Properties of Chemical Compounds; Knovel: Norwich, NY, USA, 2003; p. 597. [Google Scholar]
  26. 3M Novec Engineered Fluid HFE-7100 Datasheet. Available online: https://www.silmid.com/getattachment/706d712f-db18-4563-bcd6-ab78cba39349/3M-Novec-HFE-7100-TDS.aspx (accessed on 13 August 2018).
  27. Rausch, M.H.; Kretschmer, L.; Will, S.; Leipertz, A.; Fröba, A.P. Density, Surface Tension, and Kinematic Viscosity of Hydrofluoroethers HFE-7000, HFE-7100, HFE-7200, HFE-7300, and HFE-7500. J. Chem. Eng. Data 2015, 60, 3759–3765. [Google Scholar] [CrossRef]
  28. Bessmeltsev, V.P.; Pavlenko, A.N.; Zhukov, V.I. Development of a technology for creating structured capillary-porous coatings by means of 3D printing for intensification of heat transfer during boiling. Optoelectron. Instrum. Data Process. 2019, 55, 554–563. [Google Scholar] [CrossRef]
  29. Zhukov, V.I.; Pavlenko, A.N.; Shvetsov, D.A. The effect of pressure on heat transfer at evaporation/boiling in horizontal liquid layers of various heights on a microstructured surface produced by 3D laser printing. Int. J. Heat Mass Transf. 2020, 163, 120488. [Google Scholar] [CrossRef]
  30. Bodla, K.K.; Murthy, J.Y.; Garimella, S.V. Direct simulation of thermal transport through sintered wick microstructures. J. Heat Transf. 2012, 134, 012602. [Google Scholar] [CrossRef]
  31. Sernas, V.; Lienhard, J.H.; Dhir, V.K. The Taylor wave configuration during boiling from a flat plate. Int. J. Heat Mass Transf. 1973, 16, 1820–1821. [Google Scholar] [CrossRef]
  32. Iida, Y.; Kobayasi, K. Distributions of Void Fraction above a Horizontal Heating Surface in Pool Boiling. Bull. JSME 1969, 12, 283–290. [Google Scholar] [CrossRef]
  33. Nakoryakov, V.E.; Pokusaev, B.G.; Shreiber, I.R. Wave Propagation in Gas-Liquid Media; CRC Press: Boca Raton, FL, USA, 1993; 222p. [Google Scholar]
  34. Sakashita, H.; Ono, A. Boiling behaviors and critical heat flux on a horizontal plate in saturated pool boiling of water at high pressures. Int. J. Heat Mass Transf. 2009, 52, 744–750. [Google Scholar] [CrossRef]
  35. Cao, Z.; Wu, Z.; Sunden, B. Heat Transfer Prediction and Critical Heat Flux Mechanism for Pool Boiling of NOVEC-649 on Microporous Copper Surfaces. Int. J. Heat Mass Transf. 2019, 141, 818–834. [Google Scholar] [CrossRef]
  36. Tang, K.; Bai, J.; Chen, S.; Zhang, S.; Li, J.; Sun, Y.; Chen, G. Pool Boiling Performance of Multilayer Micromeshes for Commercial High-Power Cooling. Micromachines 2021, 12, 980. [Google Scholar] [CrossRef]
  37. Pavlenko, A.N.; Kuznetsov, D.V.; Bessmeltsev, V.P. Heat Transfer Enhancement during Pool Boiling of Nitrogen on Porous Coatings Produced by Selective Laser Melting/Sintering (SLM/SLS). J. Eng. Thermophys. 2022, 31, 1–10. [Google Scholar] [CrossRef]
  38. Kuznetsov, D.V.; Pavlenko, A.N. Heat Transfer during Nitrogen Boiling on Surfaces Modified by Microarc Oxidation. Energies 2022, 15, 5792. [Google Scholar] [CrossRef]
  39. Clift, R.; Grace, J.R.; Weber, M.E. Bubbles, Drops, and Particles; Academic Press: New York, NY, USA; San Francisco, CA, USA; London, UK, 1978. [Google Scholar]
  40. Kutateladze, S.S.; Malenkov, I.G. Experimental investigation of the analogy between the process of boiling and bubbling. J. Appl. Mech. Tech. Phys. 1966, 7, 97–99. [Google Scholar] [CrossRef]
  41. Rohsenow, W.M.; Griffith, P. Correlation of maximum heat transfer data for boiling of saturated liquids. Chem. Eng. Prog. Symp. Ser. 1955, 52, 47–49. [Google Scholar]
  42. Guan, C.-K.; Klausner, J.F.; Mei, R. A new mechanistic model for pool boiling CHF on horizontal surfaces. Int. J. Heat Mass Transf. 2011, 54, 3960–3969. [Google Scholar] [CrossRef]
  43. Reyes, R.; Wayner, J.P.C. An adsorption model for the superheat at the critical heat flux. J. Heat Transf. 1995, 117, 779–782. [Google Scholar] [CrossRef]
  44. Michaie, S.; Rullière, R.; Bonjour, J. Towards a more generalized understanding of pool boiling at low pressure: Bubble dynamics for two fluids in states of thermodynamic similarity. Exp. Therm. Fluid Sci. 2019, 101, 217–230. [Google Scholar] [CrossRef]
  45. Patten, T.D.; Tumean, W.A. Some characteristics of nucleate boiling in thin liquid layers. In Proceedings of the 4th International Heat Transfer Conference, Paris, France, 31 August–5 September 1970; VDI: Dusseldorf, Germany, 1970; Volume 5, Paper B, pp. 2–10. [Google Scholar]
  46. Tolubinskiy, V.I.; Antonenko, V.A.; Ivanenko, G.V. Effect of liquid layer thickness on critical thermal loads at boiling. Prom. Tepl. 1988, 10, 3–6. (In Russian) [Google Scholar]
  47. Shukla, M.Y.; Kandlikar, S.G. Influence of liquid height on bubble coalescence, vapor venting, liquid return, and heat transfer in pool boiling. Int. J. Heat Mass Transf. 2021, 173, 121261. [Google Scholar] [CrossRef]
Figure 1. A typical curve of heat flux density versus surface temperature in boiling [3].
Symmetry 15 01792 g001
Figure 2. Schematic diagram of vapor jet location on an infinite horizontal surface according to the Zuber hydrodynamic instability model. The figure is taken from [8].
Symmetry 15 01792 g002
Figure 3. Experimental facilities: (a)—photograph of experimental setup: 1—process chamber of experimental setup, 2—pressure sensors, 3—thermocouples for measuring the temperature of the heated surface, 4—thermostat, 5—rotameter, 6—vacuum pump; (b)—process chamber of experimental setup: 1—bottom (smooth or with capillary-porous coating), 2—case, 3—thermocouples, 4—branch pipe for fixing the pumping system, 5—vacuum inlet, 6—inspection windows, 7—cooling coil, 8—heating coil, 9—thermal insulation layer, 10—brass plate, 11—electric heater, 12—electric heater cover.
Symmetry 15 01792 g003
Figure 4. Profilograms and SEM images of capillary-porous coatings.
Symmetry 15 01792 g004
Figure 5. Two-dimensional instability of a boiling liquid layer: (a)—photograph of “vapor columns” in a thin n-dodecane layer at nucleate boiling: layer height h = 2.5 mm, volume pressure Ps = 20 kPa, q = 108 kW/m2, temperature difference (TwTs) = 42.1 K; (b)—top view of the liquid–vapor interface with two-dimensional Taylor instability [31].
Symmetry 15 01792 g005
Figure 6. Dependence of CHF on reduced pressure in liquid layers of a finite height. Calculated dependences: 1—calculation via Kutateladze formula (1); 2—calculation via Zuber Equation (2); 3—calculation via dependence [9]; 4—calculation via Yagov equation [15].
Symmetry 15 01792 g006
Figure 7. The layer of boiling liquid above the vapor film at the moment of crisis. Layer height h = 4 mm at the moment of crisis, pressure Ps = 20 kPa (Ps/Pcr = 0.011), q = 146 kW/m2, and TwTs = 34.3 K. Figure is taken from [24].
Symmetry 15 01792 g007
Figure 8. Calculation diagrams for CHF in terms of transition boiling approach. (a) Top view of the liquid–vapor interface with a two-dimensional Taylor instability [32]; (b) layout of vapor columns on an infinite horizontal surface based on visual observations.
Symmetry 15 01792 g008
Table 1. Parameters of capillary-porous coatings.
ParameterSample 1Sample 2
Coating powder materialStainless steel LPW 155 (15-5PH)Bronze AISI C836000
Thermal conductivity of coating materialλ ≈ 20 W/(m·K)λ ≈ 89 W/(m·K)
Porosityϕ = 44%ϕ = 44%
Maximum heightδ = 550 μmδ = 550 μm
Minimum height (residual layer)δ0 = 50 μmδ0 = 50 μm
Profile equationz = (A/2)·sin(2πx/λm) + A/2 + δ0
AmplitudeA = δ − δ0 = 500 μmA = δ − δ0 = 500 μm
Modulation wavelengthλm1 = 3500 μmλm2 = 3500 μm
Effective thermal conductivity of the coating keffkSt = 6.8 W/(m·K)kBr = 30.6 W/(m·K)
Thermal resistance at maximum coating height (ridge)δ/kSt = 8.09 × 10⁻⁵ (m2·K)/Wδ/kBr = 1.8 × 10⁻⁵ (m2·K)/W
Table 2. Linear dimensions.
Regimelσ, mmλcr, mmλd, mmh, mmdv, mmlv, mm(dv/lv)
P, kPaTS, °C
N-dodecane, smooth surface
10138.41.539.5916.62.513.4310.43
4.014.7320.46
20158.31.469.1815.92.512.5320.39
4.011.7310.38
N-dodecane, 2D modulated stainless steel capillary-porous coating
5120.71.589.9317.24.012.9 ± 0.124.2 ± 0.20.53
10138.41.539.5916.64.014.6 ± 0.224.3 ± 0.20.6
N-dodecane, 2D modulated bronze capillary-porous coating
5120.71.589.9317.24.012.6 ± 0.124.1 ± 0.10.52
10138.41.539.5916.64.012.4 ± 0.225.6 ± 0.10.48
Dielectric liquid Novec-7100, smooth surface
100610.855.339.2310.020.3
Table 3. Comparison of CHF calculation with experiments.
Regimeh, mmεqcr, kW/m2
Experiment
qcrt, kW/m2
Calculation
q c r q c r t × 100 % q c r
P, kPaTS, °C
N-dodecane, smooth surface
10138.42.50.713117.3118.51
4.00.731112.6111.21.2
10.00.751021031
20158.32.50.7451281312.3
4.00.7371461404.1
10.00.78115.81171
N-dodecane, 2D modulated stainless steel capillary-porous coating
5120.74.00.4941651604.2
10138.44.00.5331861933.5
N-dodecane, 2D modulated bronze capillary-porous coating
5120.74.00.491551614.0
10138.44.00.5791821744.7
Dielectric liquid Novec-7100, smooth surface
10061100.793151.61482.5
Disclaimer/Publisher’s Note: The statements, opinions and data contained in all publications are solely those of the individual author(s) and contributor(s) and not of MDPI and/or the editor(s). MDPI and/or the editor(s) disclaim responsibility for any injury to people or property resulting from any ideas, methods, instructions or products referred to in the content.

