

Optimal Location and Sizing of Photovoltaic-Based Distributed Generations to Improve the Efficiency and Symmetry of a Distribution Network by Handling Random Constraints of Particle Swarm Optimization Algorithm


 , , and
Abstract
:1. Introduction
- i.
- Photovoltaic PV distributed generation, as well as constant load, is all factored into the RDG sizing and allocation problem.
- ii.
- The stochastic characteristics are achieved by using appropriate probability density functions (PDFs).
- iii.
- The Particle Swarm optimization algorithm (PSO), a metaheuristic algorithm, is used to determine the optimal solution with high exploitation potential and exploration aptitude.
- iv.
- The FBSM load flow approach is used to calculate the number of power losses and voltage profiles or symmetry/asymmetry in the voltages.
- v.
- PVDG is injected into the RDS at its optimal location and sizing to minimize the active power loss, reactive power loss, cost savings, and improve the voltage profile.
- vi.
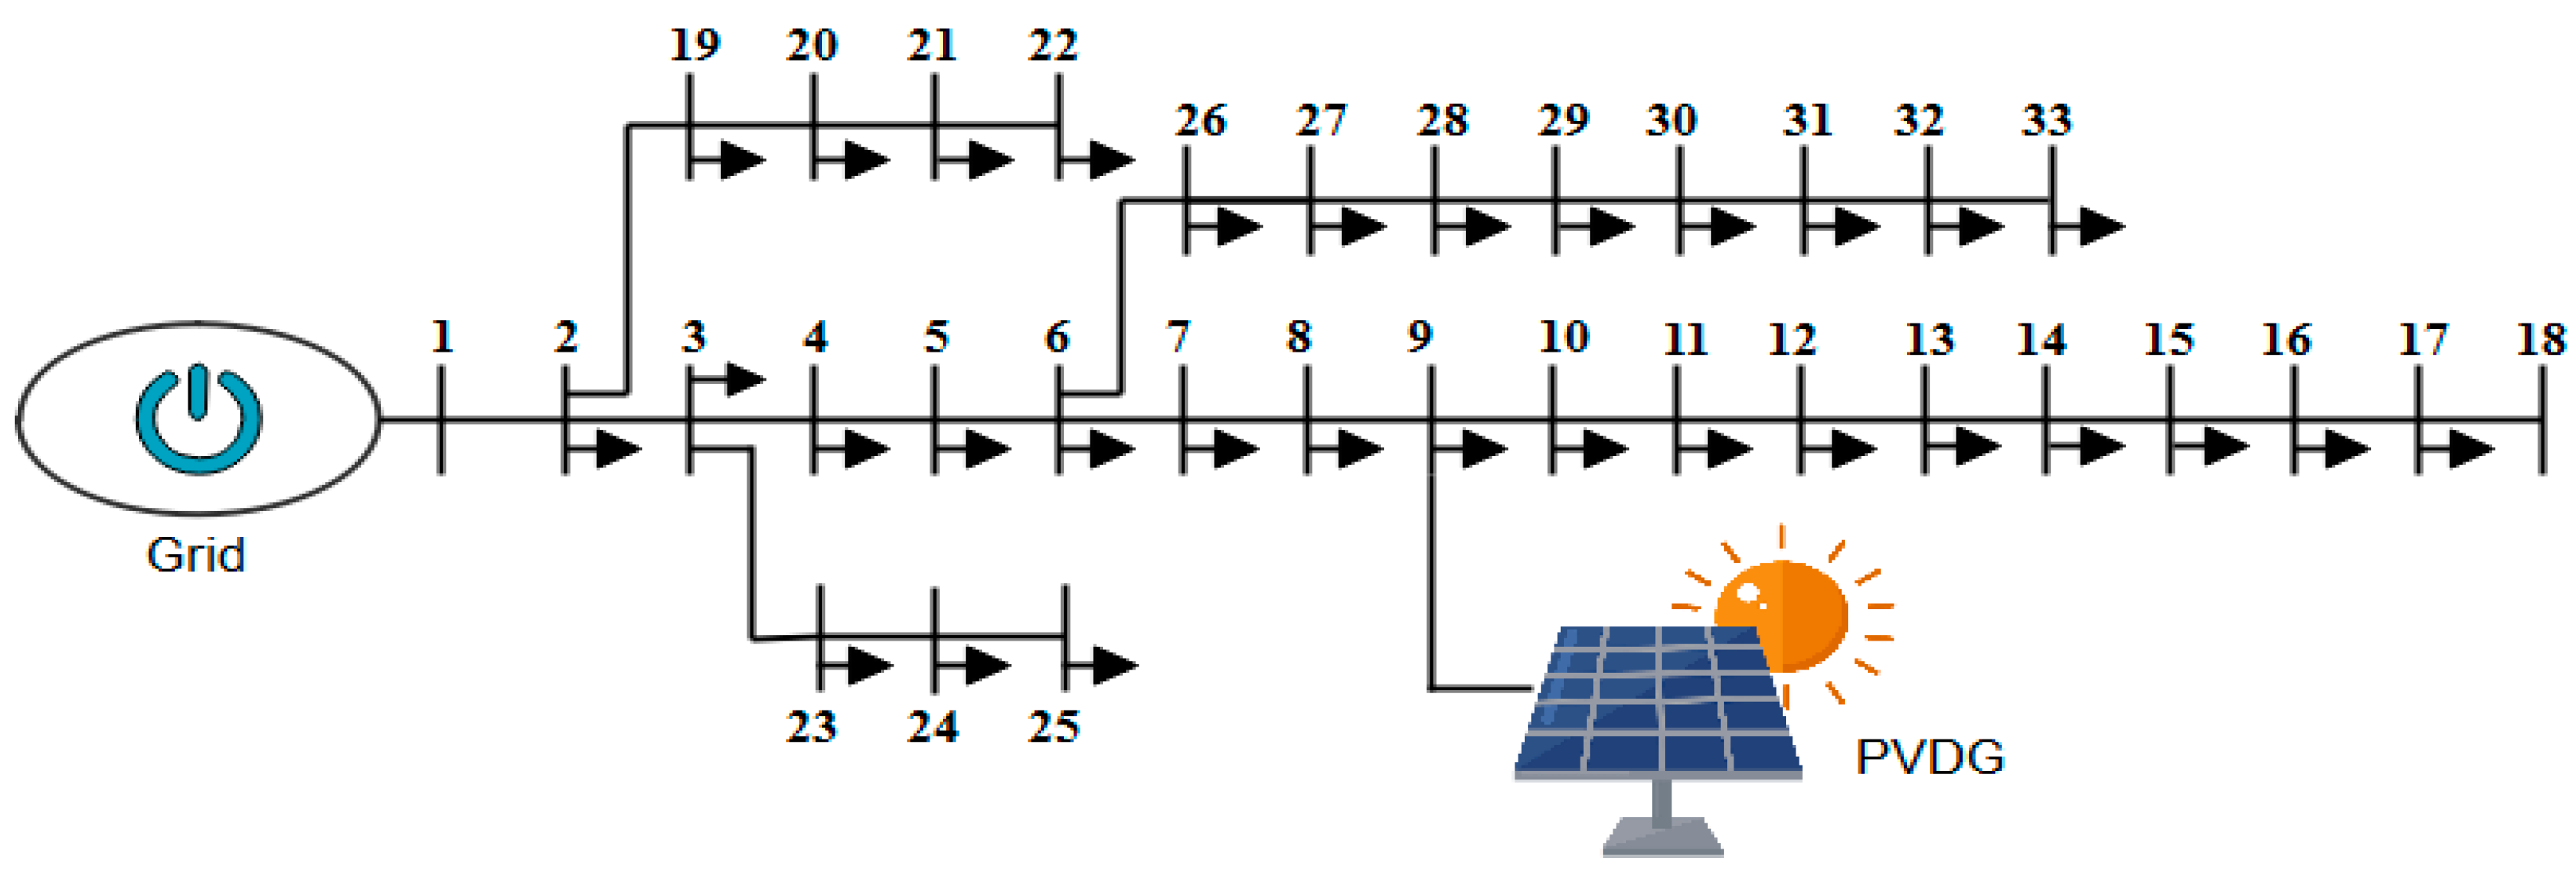
- To show the effectiveness and performance of the proposed model, an IEEE 33 RDS is considered.
- vii.
- The simulation results of the proposed technique are compared with those of recently available algorithms in the literature.
2. Methodology
3. Problem Formulation
3.1. Objective Function
3.2. Constraints
3.2.1. Equality Constraints
3.2.2. Inequality Constraints
- Voltage Limitation.
- For keeping a proper stable voltage magnitude or voltage symmetry of the whole IEEE 33-bus network, the absolute voltage value at all nodes of the distribution system should meet the defined constraints.
- Current Limitation.
- For keeping a proper current flow in all branches, it should not exceed the rated limit. The absolute value of the current at all nodes of the RDS should meet the defined constraints.
- Thermal line restriction:
- The thermal line restriction condition is mentioned in Equation (9).
3.3. Photovoltaic (PV)-Based DG Model
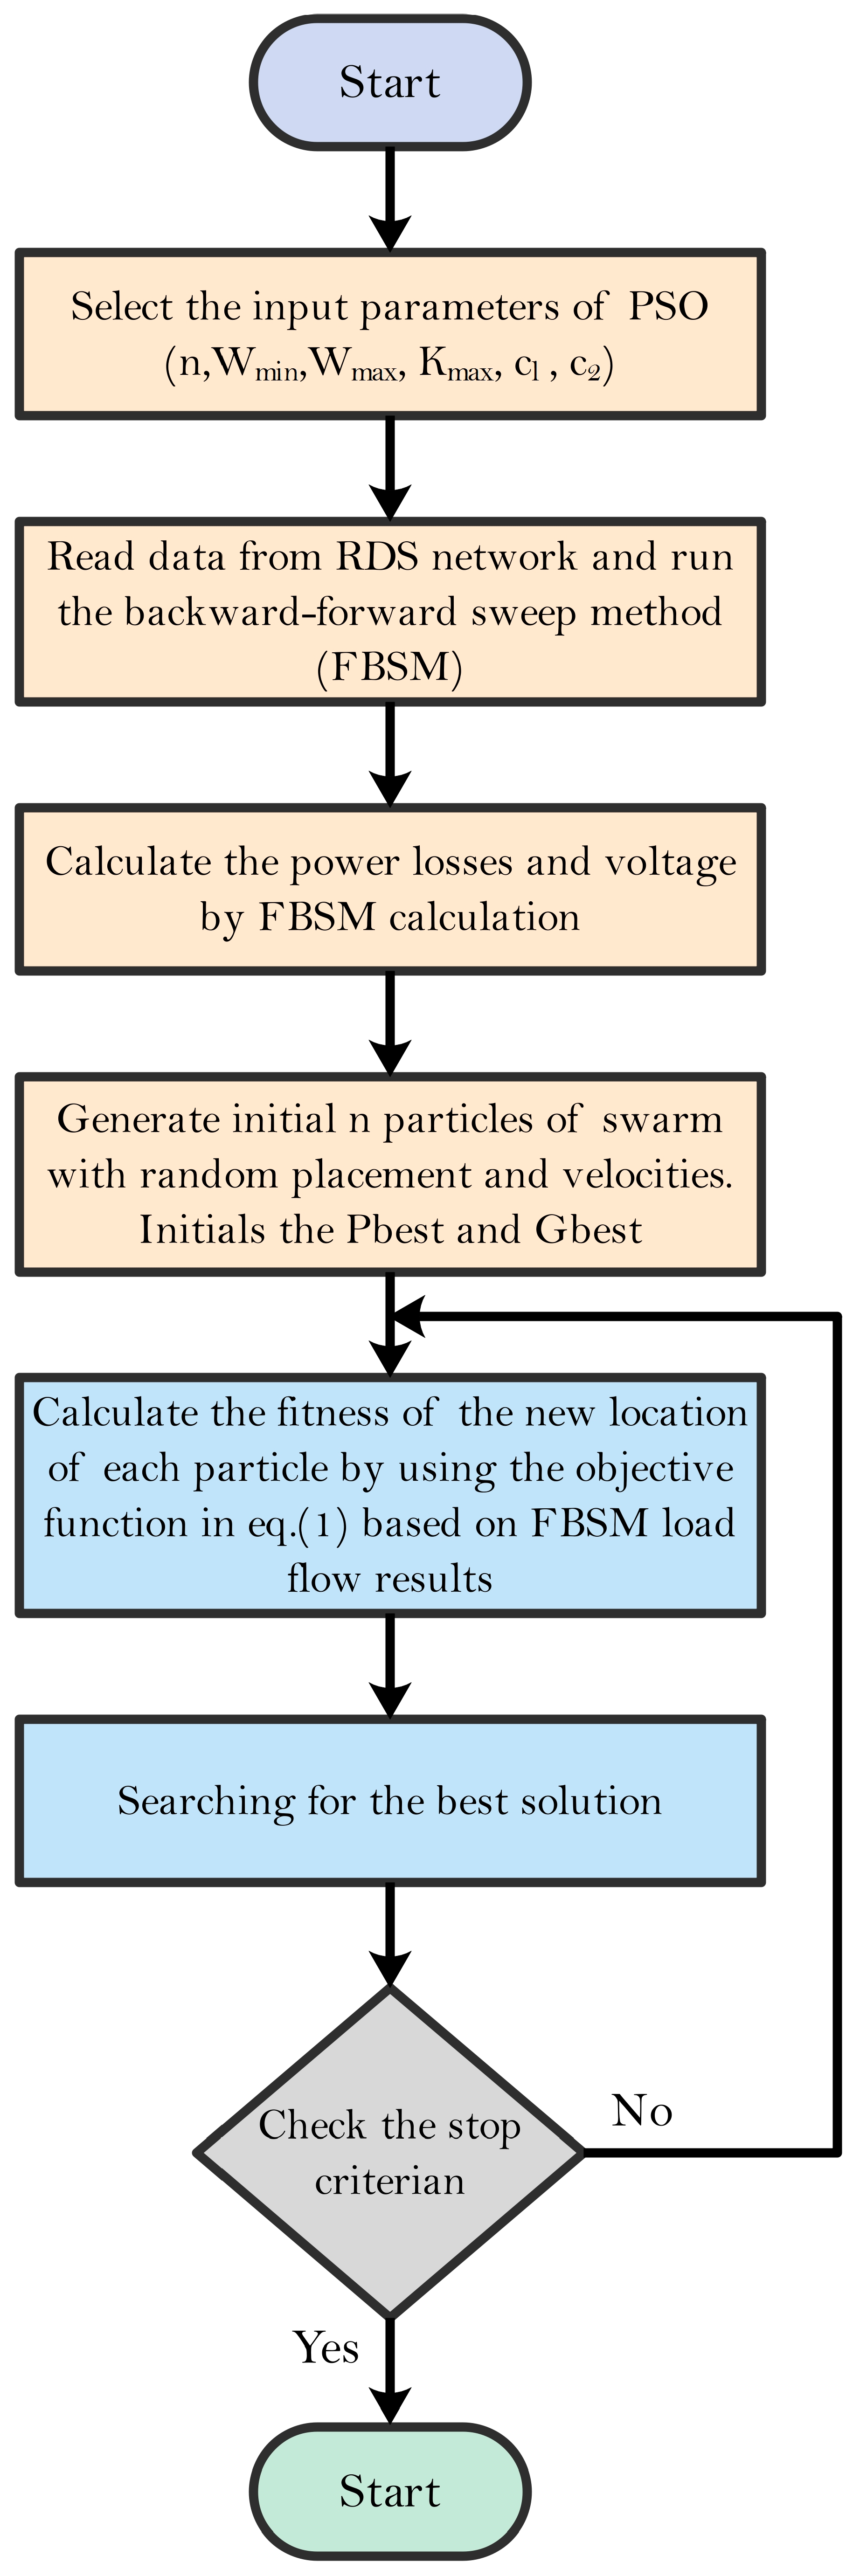
4. Particle Swarm Optimization (PSO) Algorithm
- is the present search point and Tk+1 is the changed search point.
- is the present velocity and Vk+1 is the changed velocity.
- are weighing coefficients.
- are random numbers [0, 1]; ; inertia weight is and [37]. K and are present and the maximum iteration number, respectively.
5. Results and Discussion
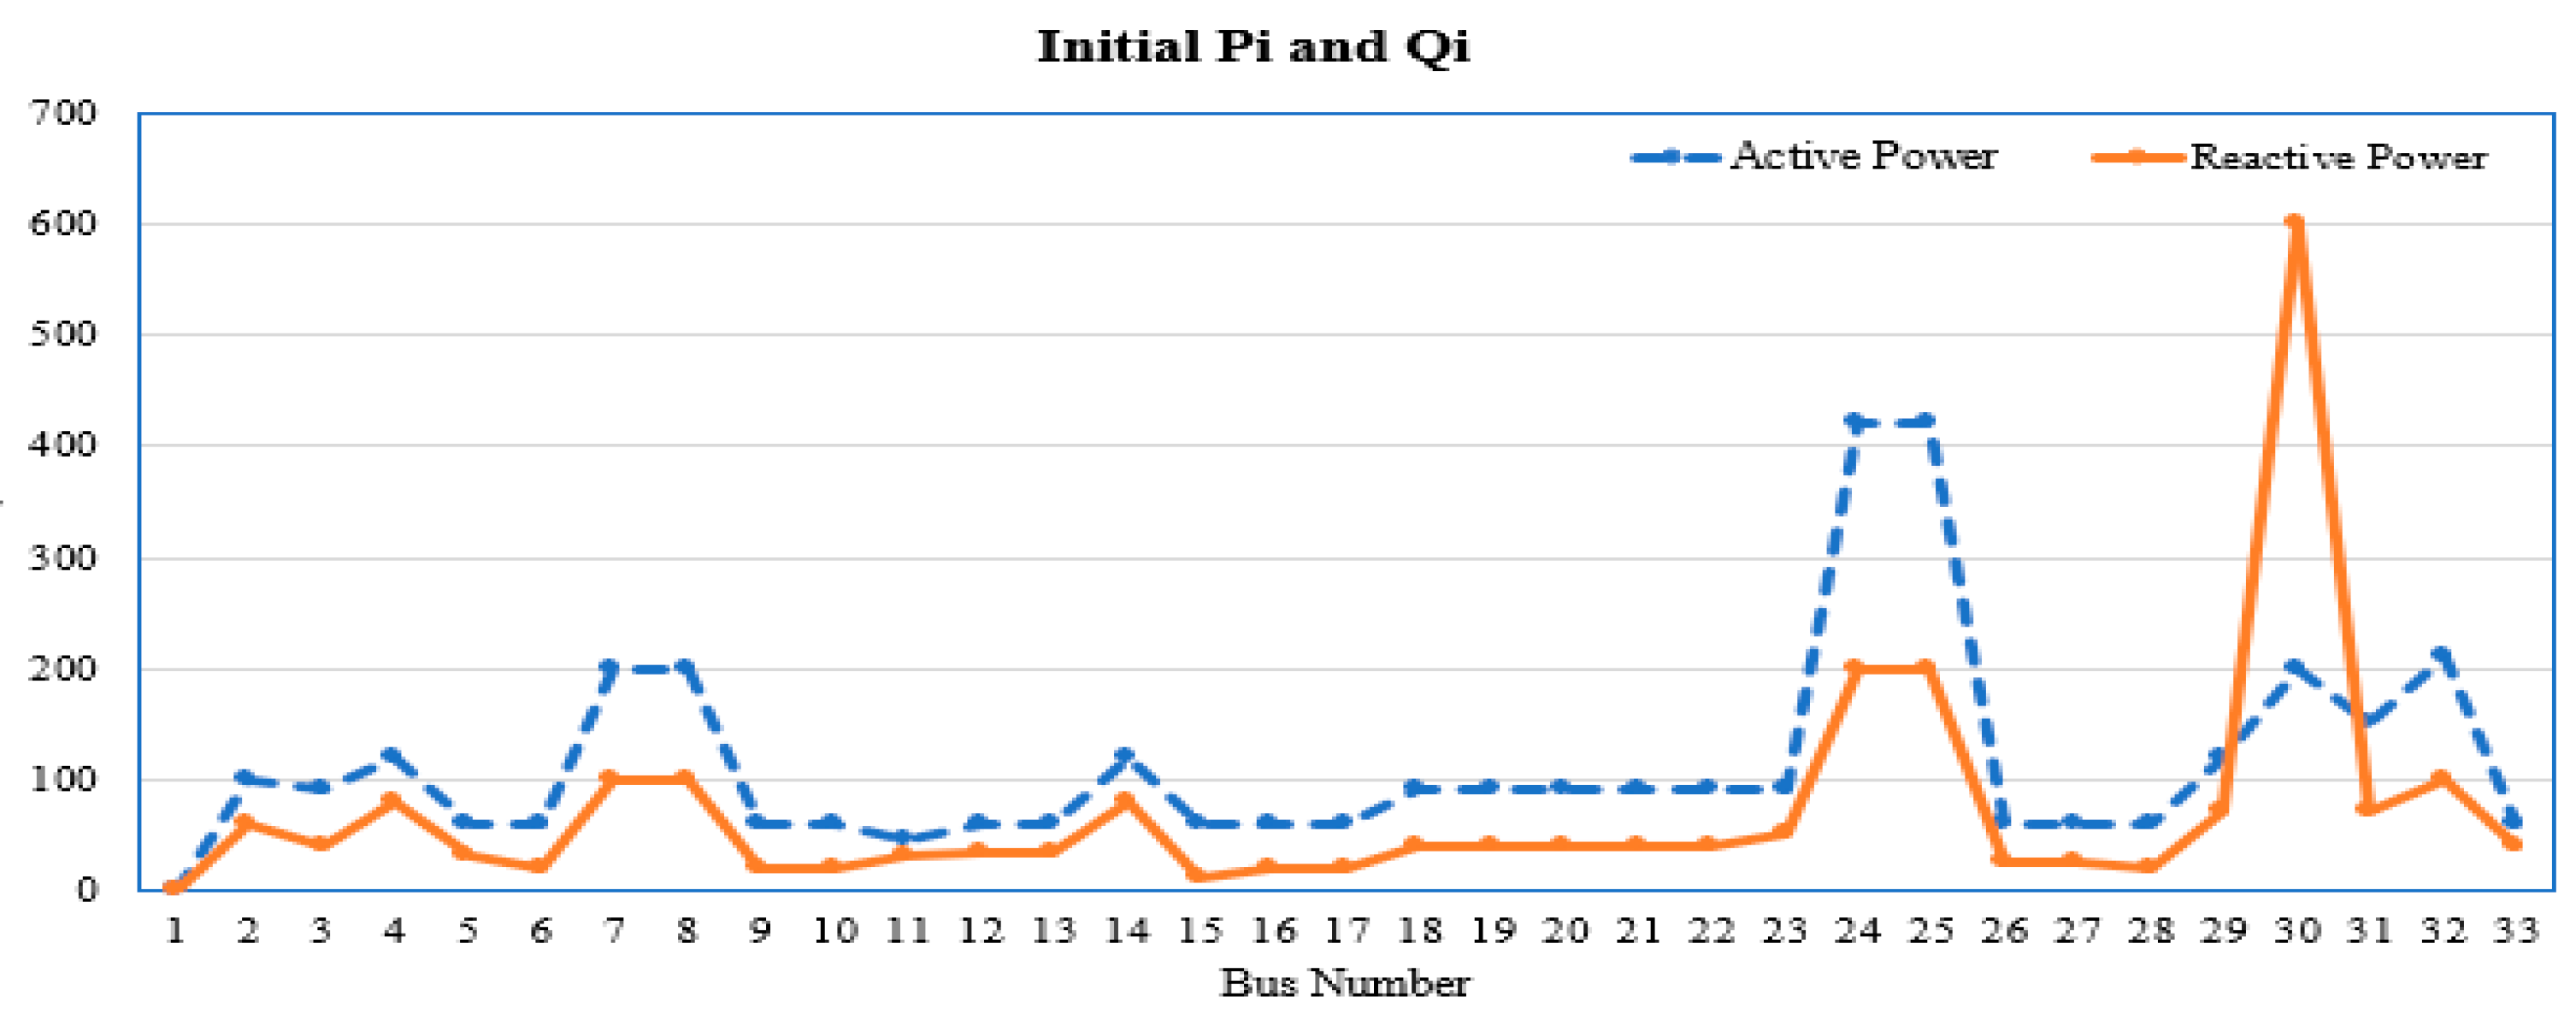
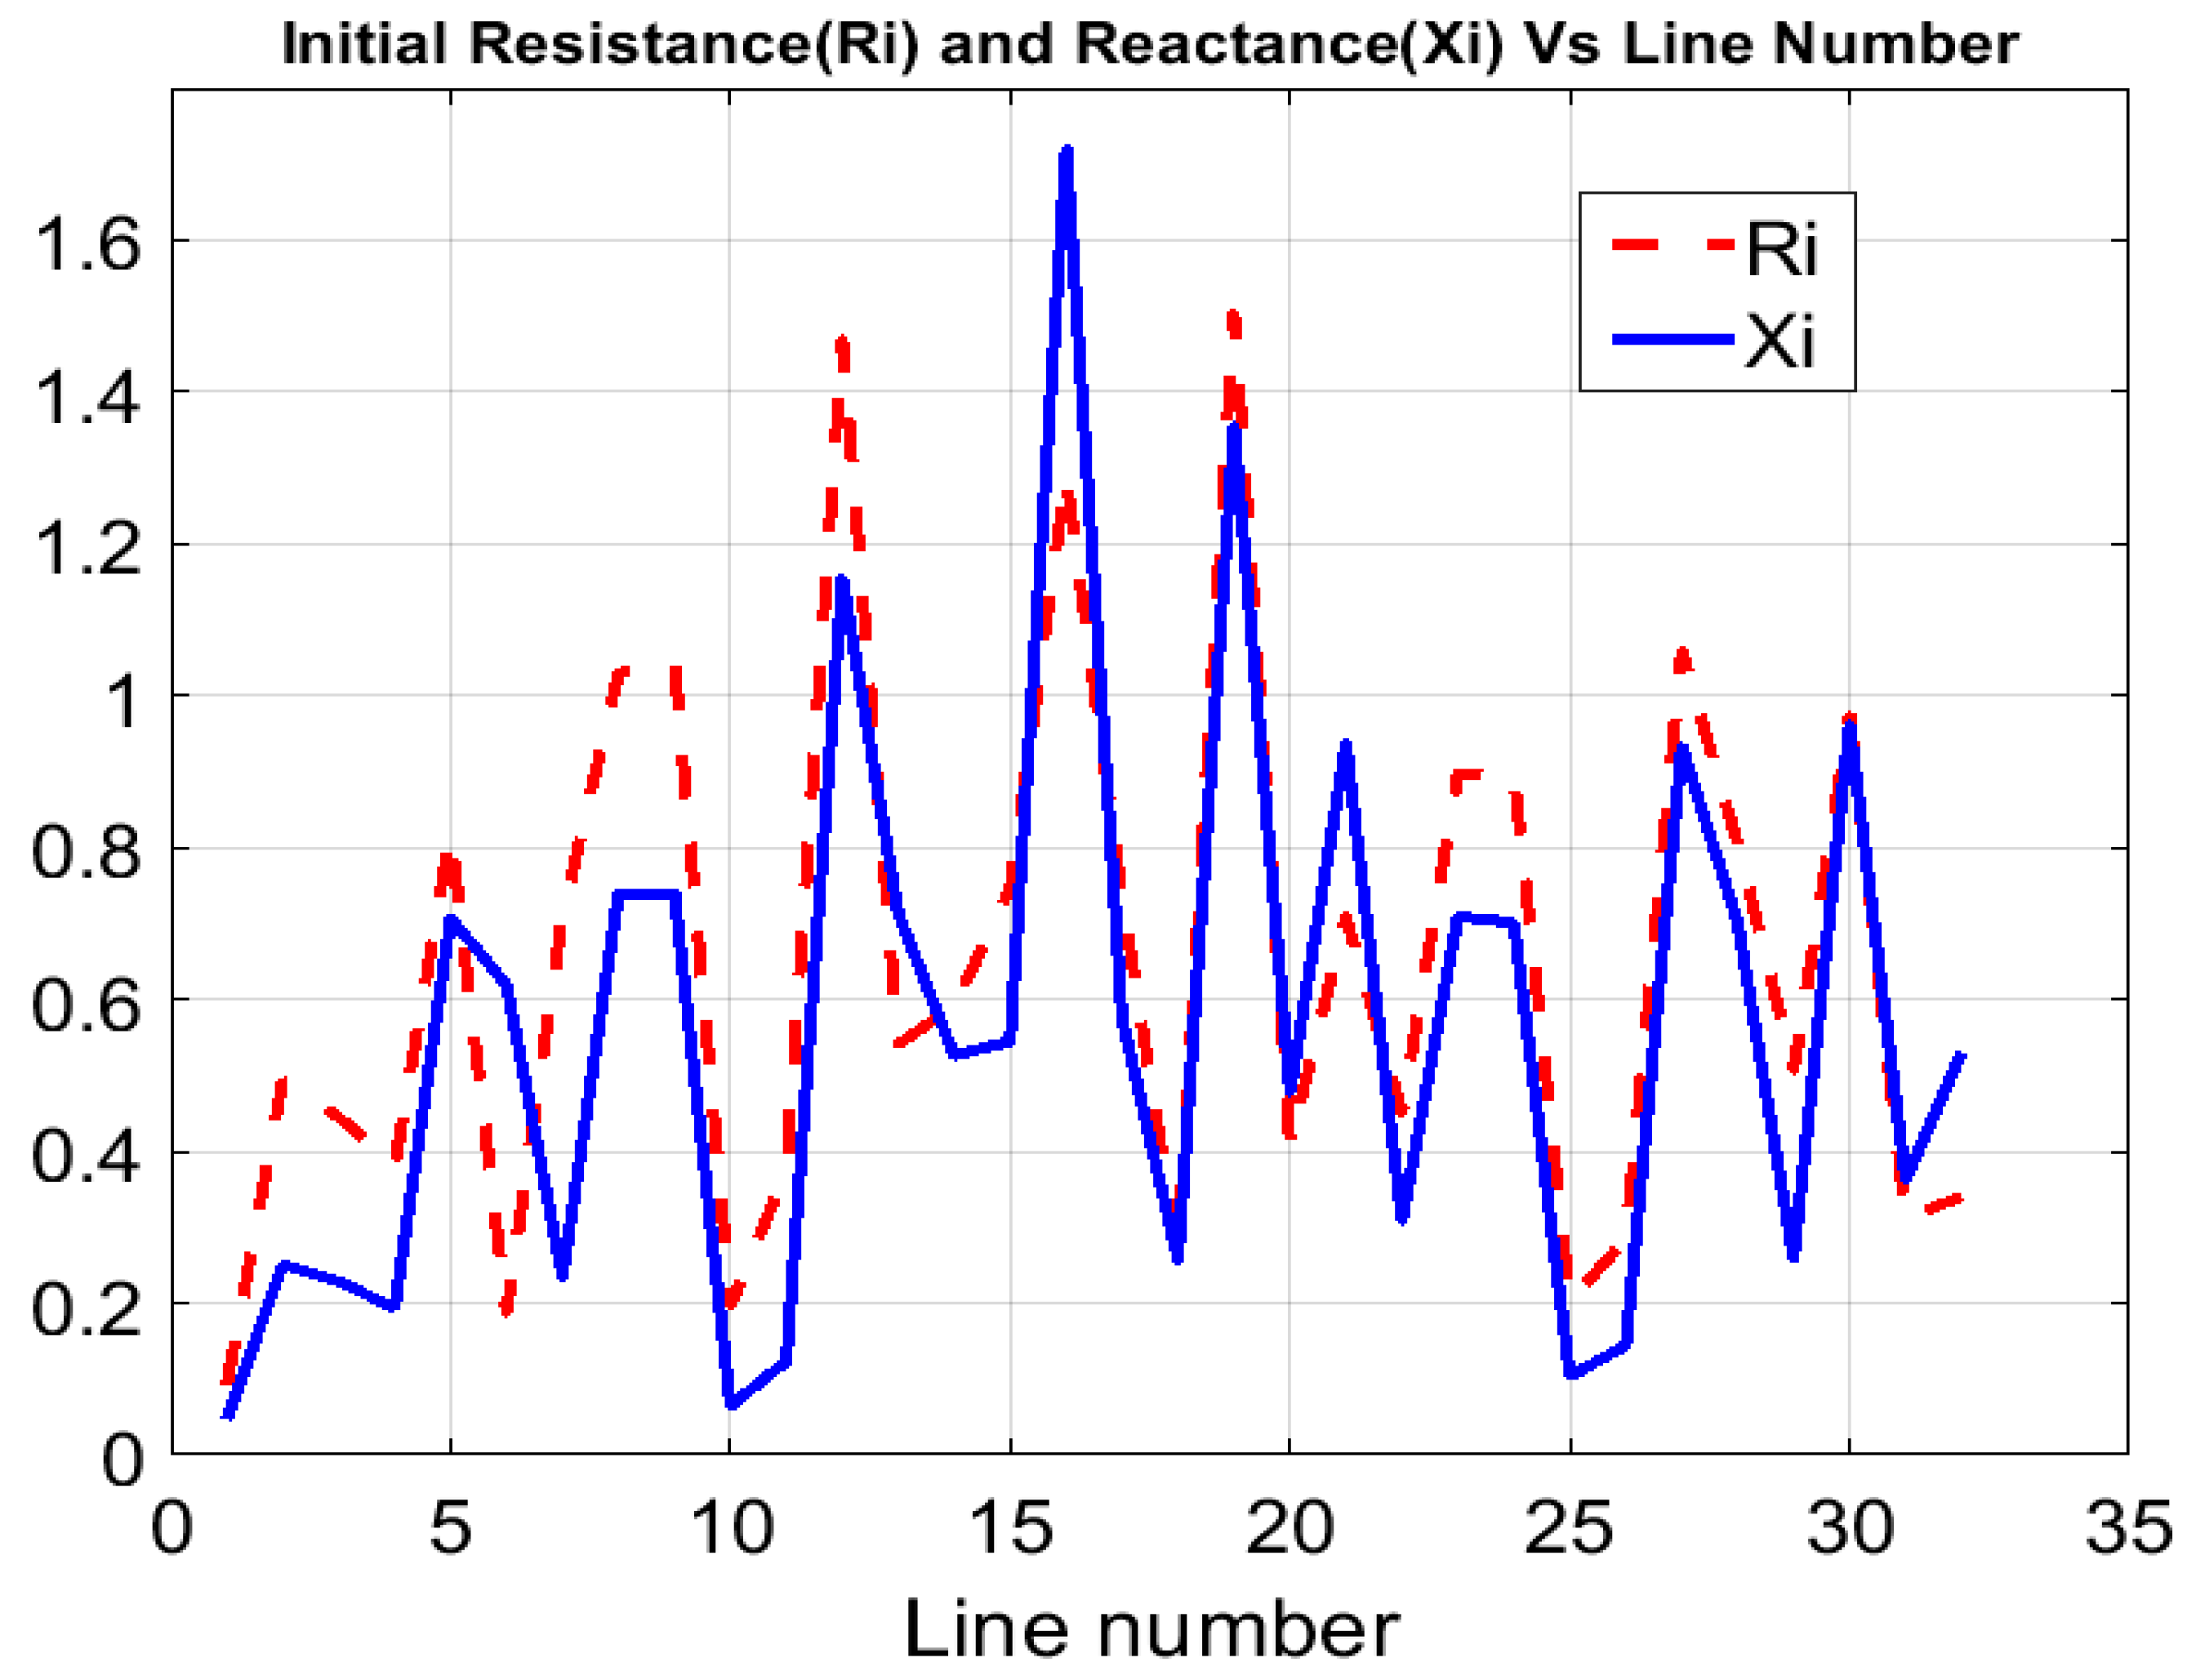
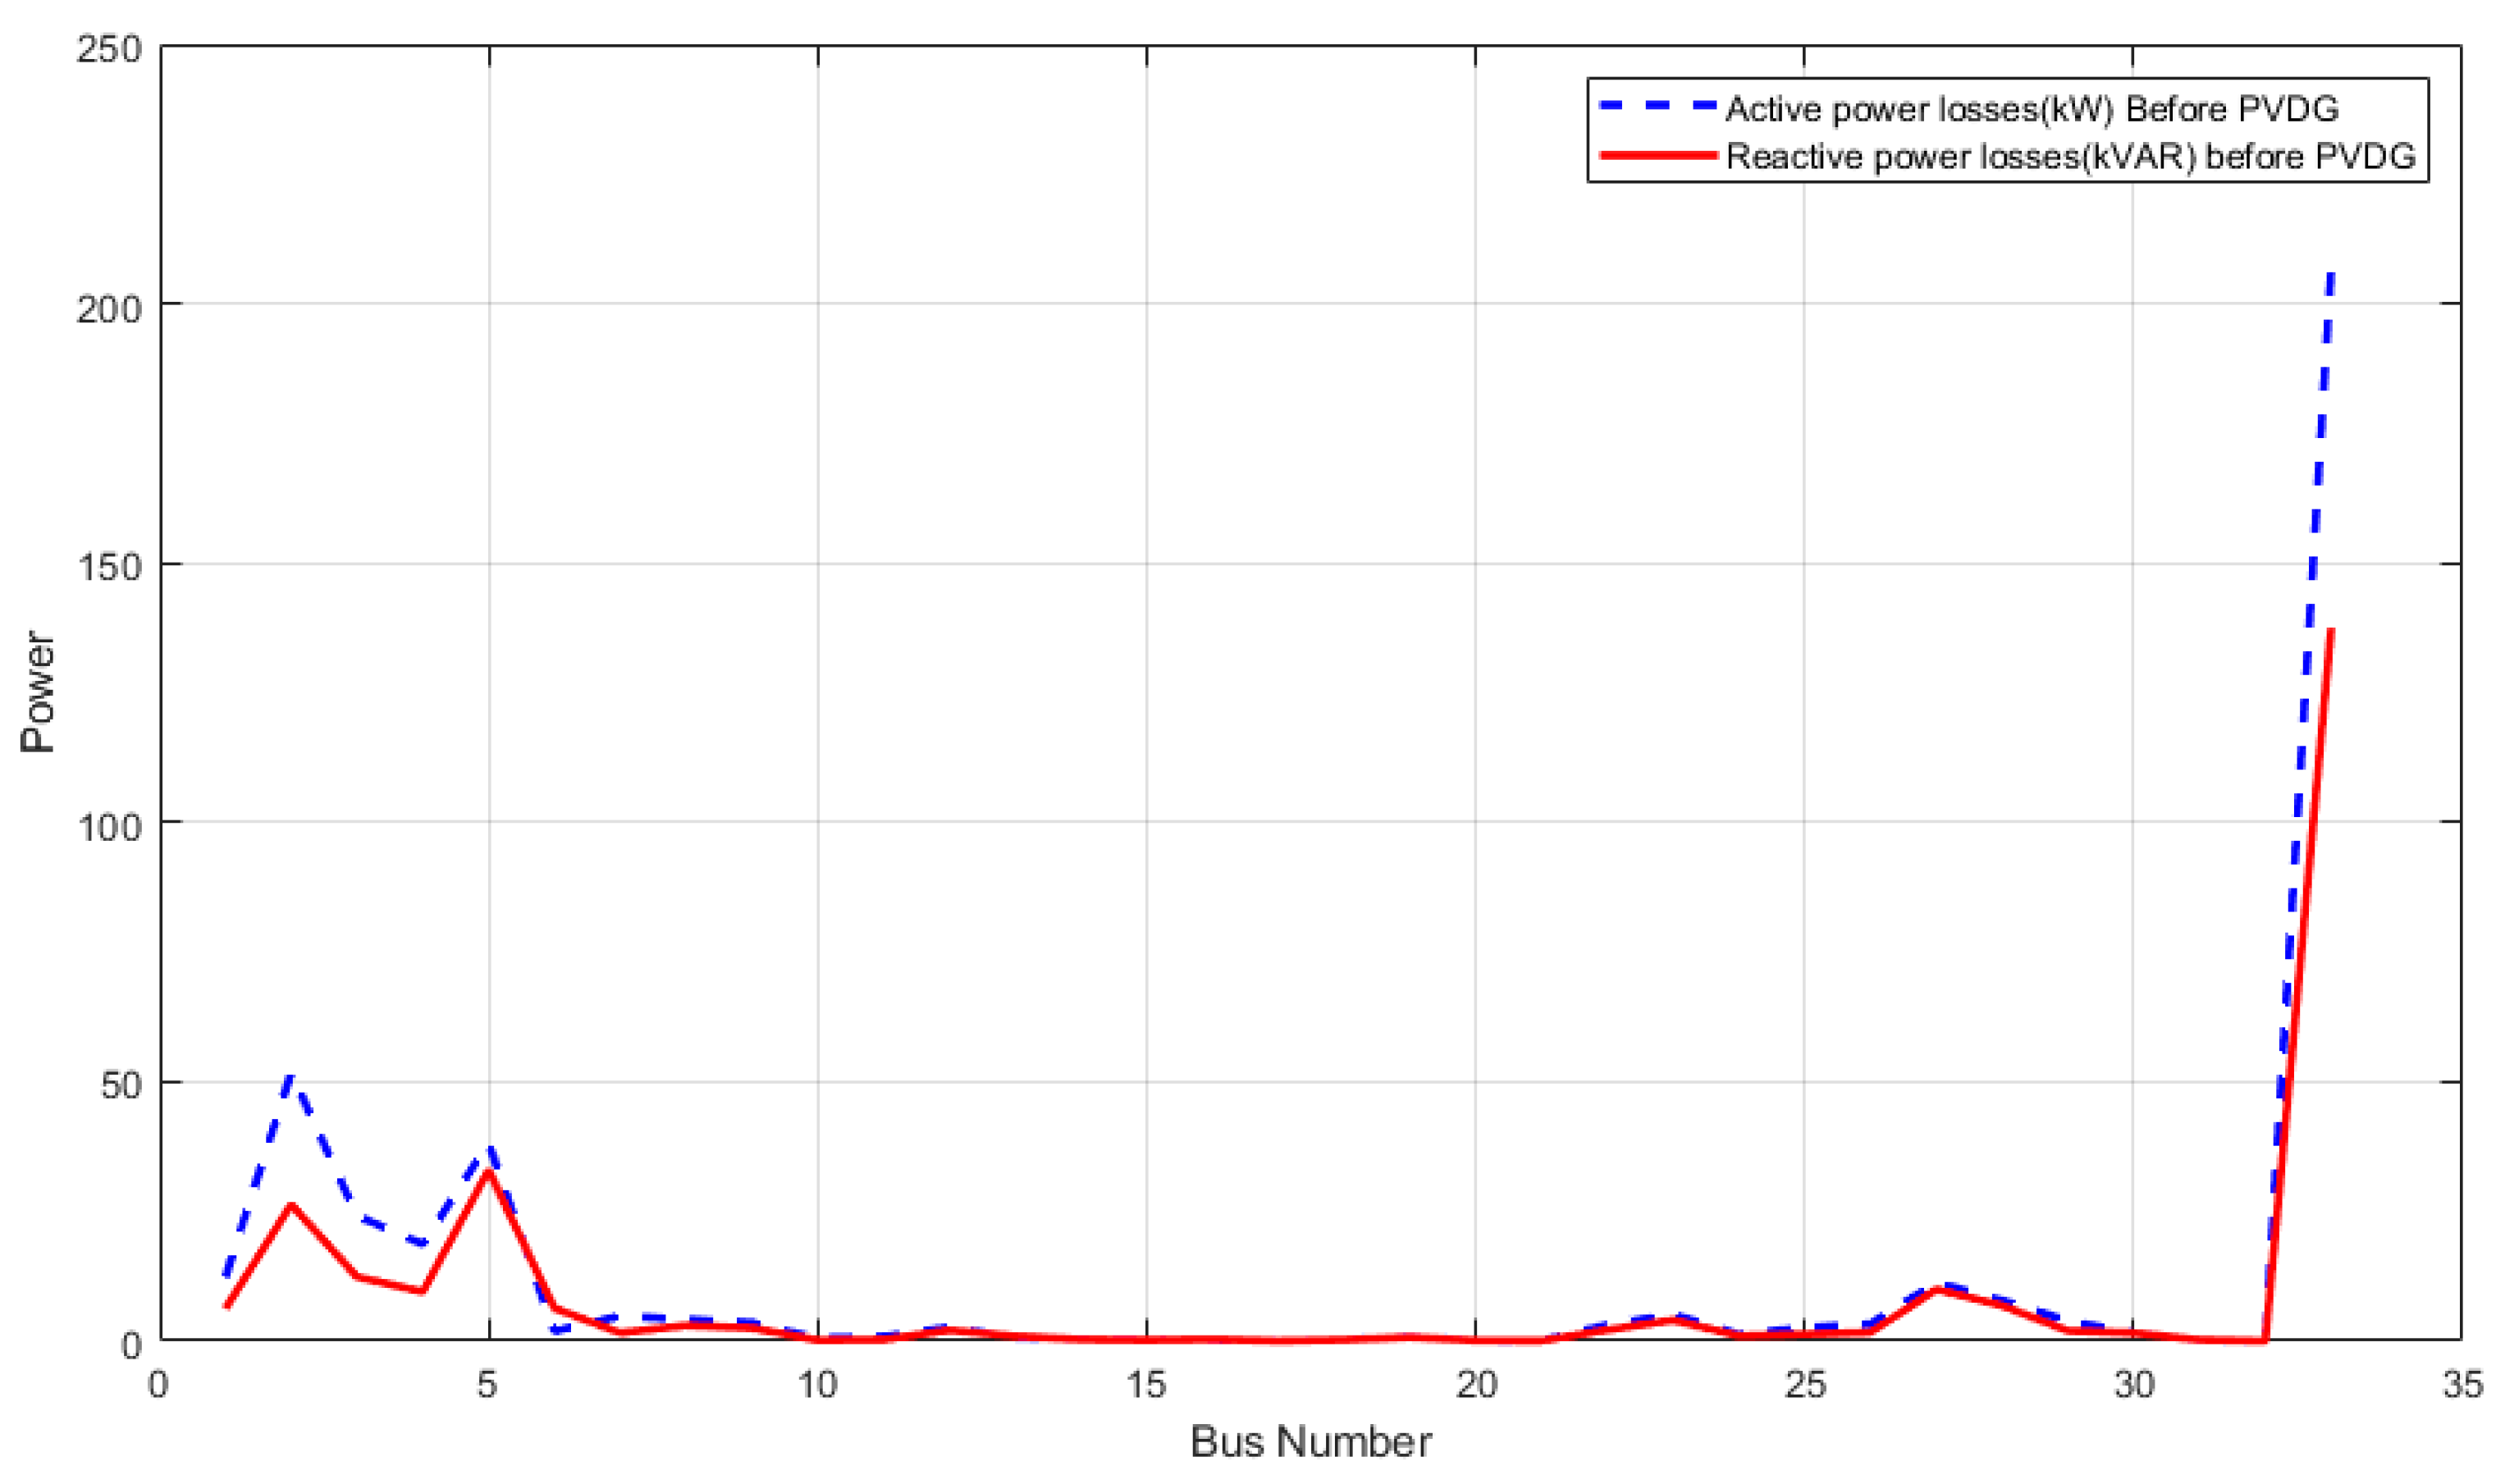
5.1. Performance Analysis of IEEE 33-Bus Power System without PVDG
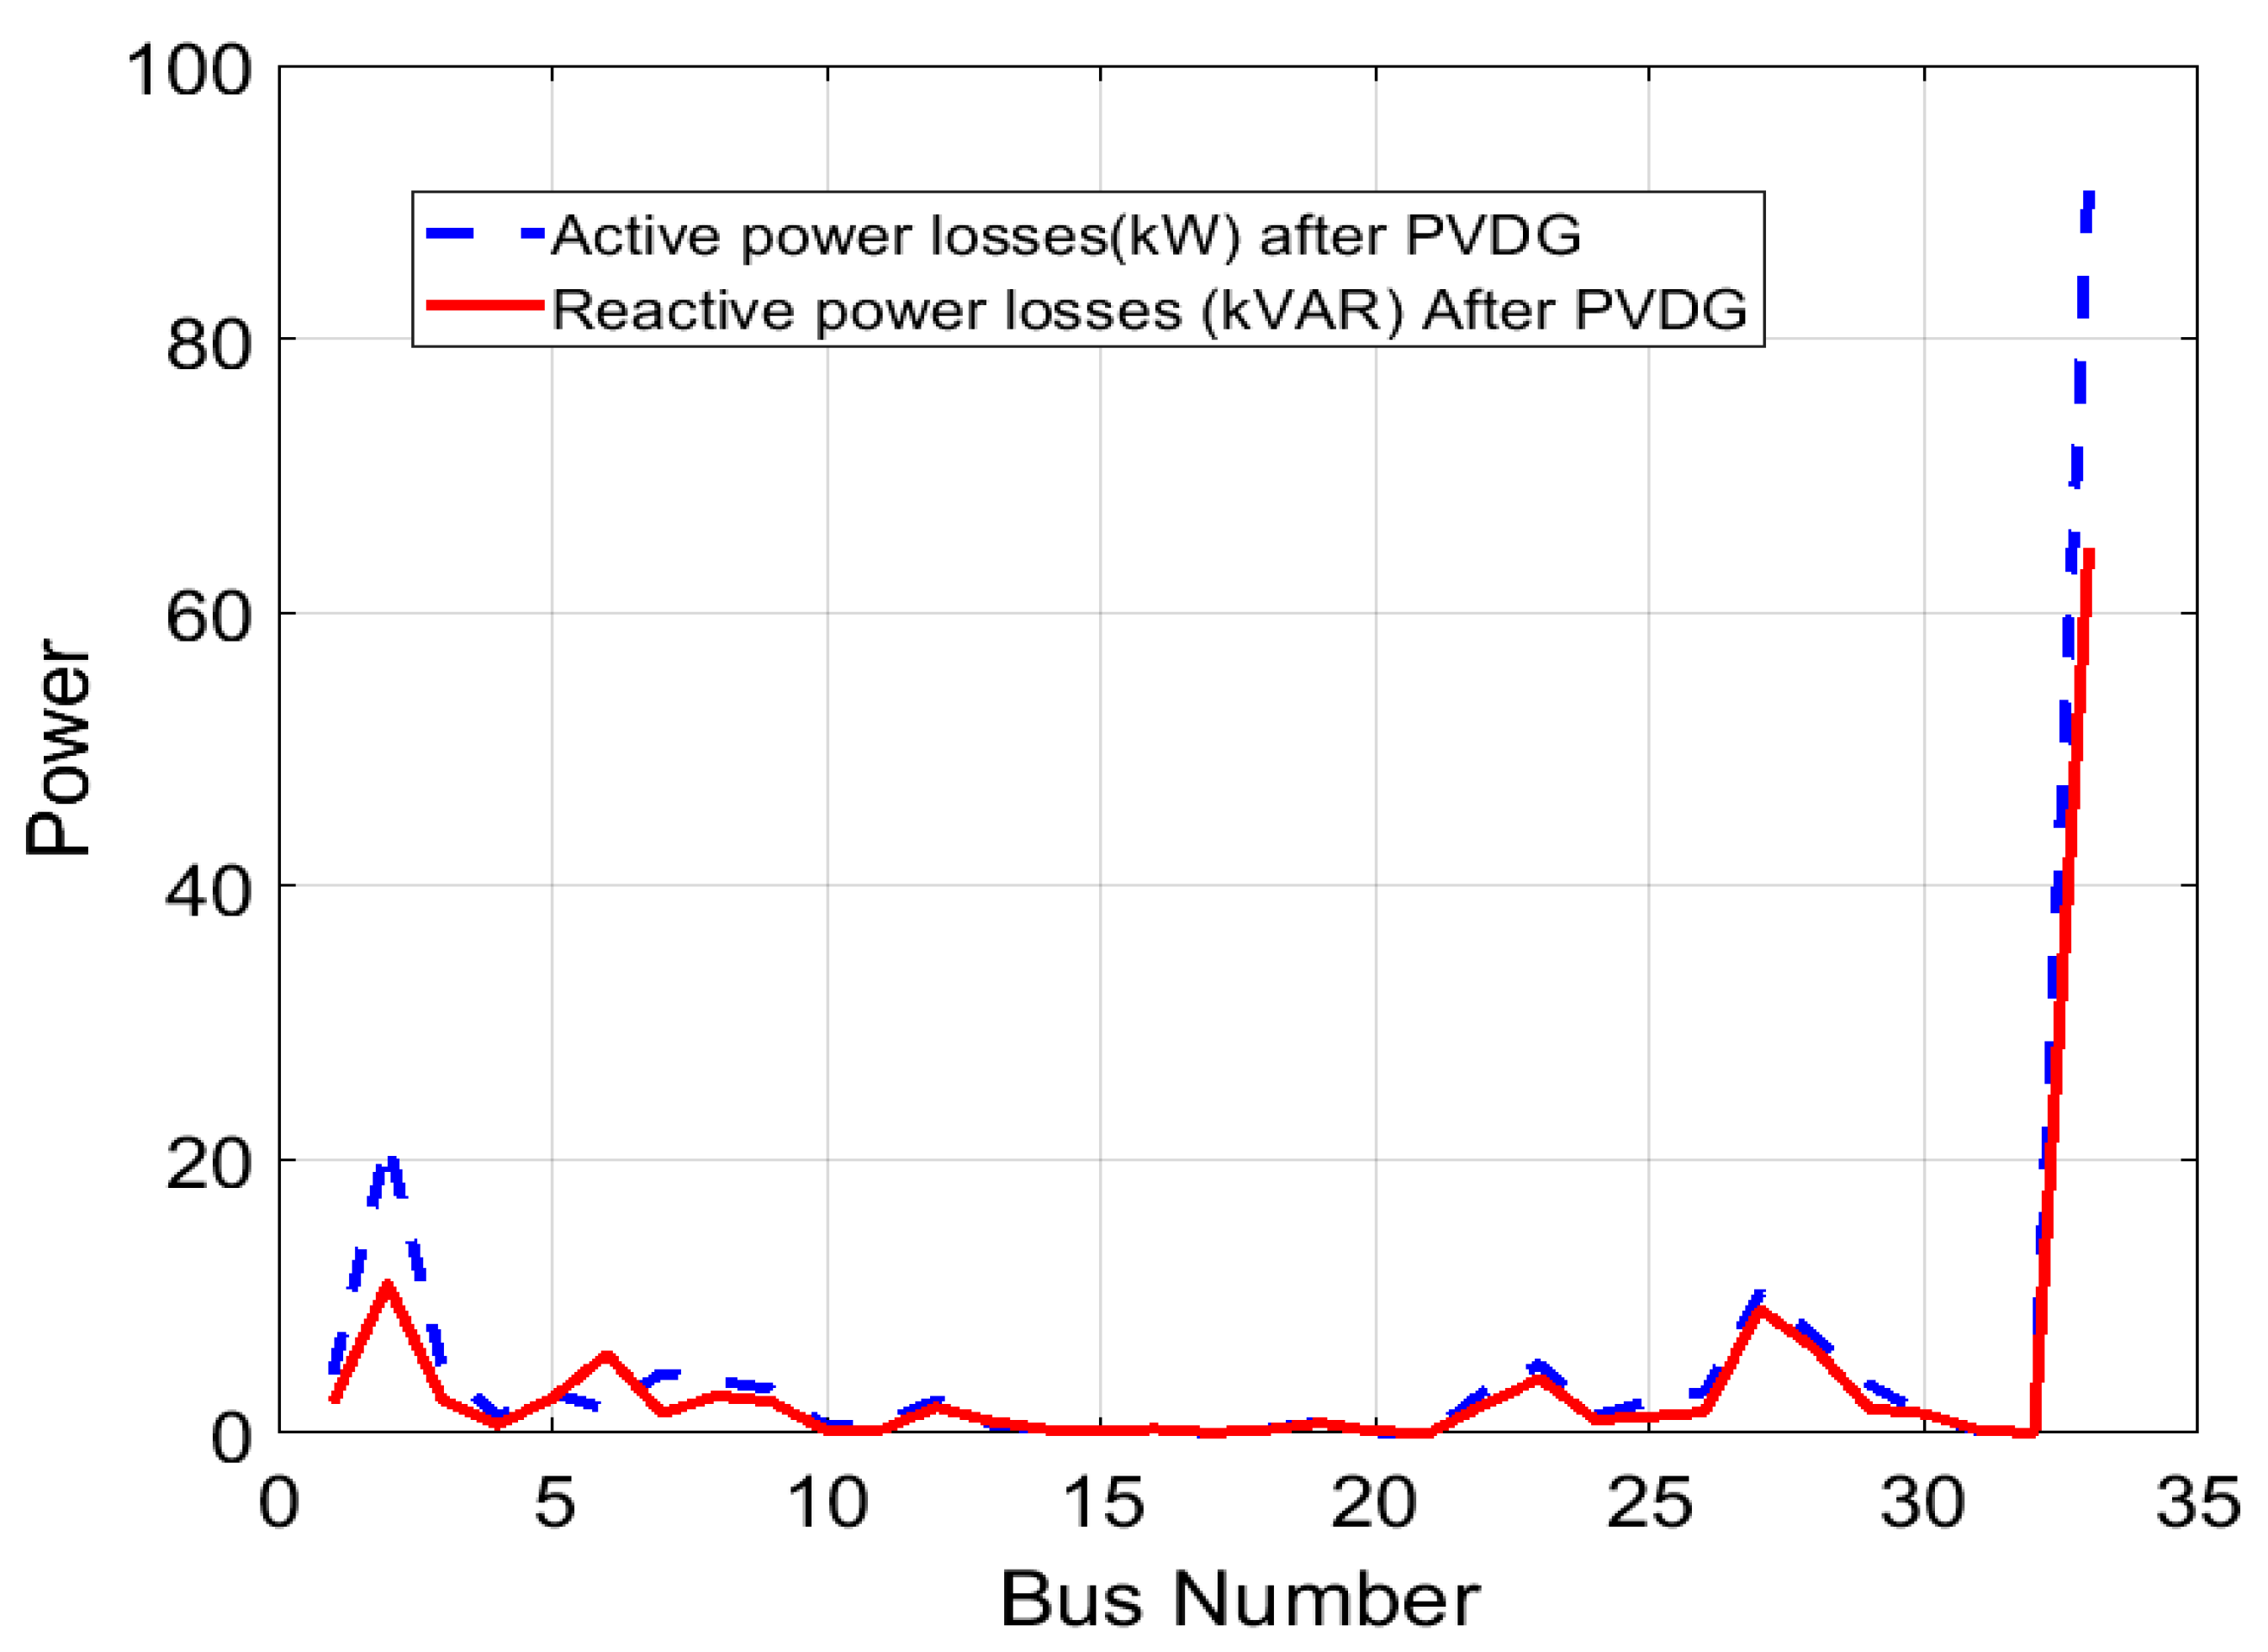
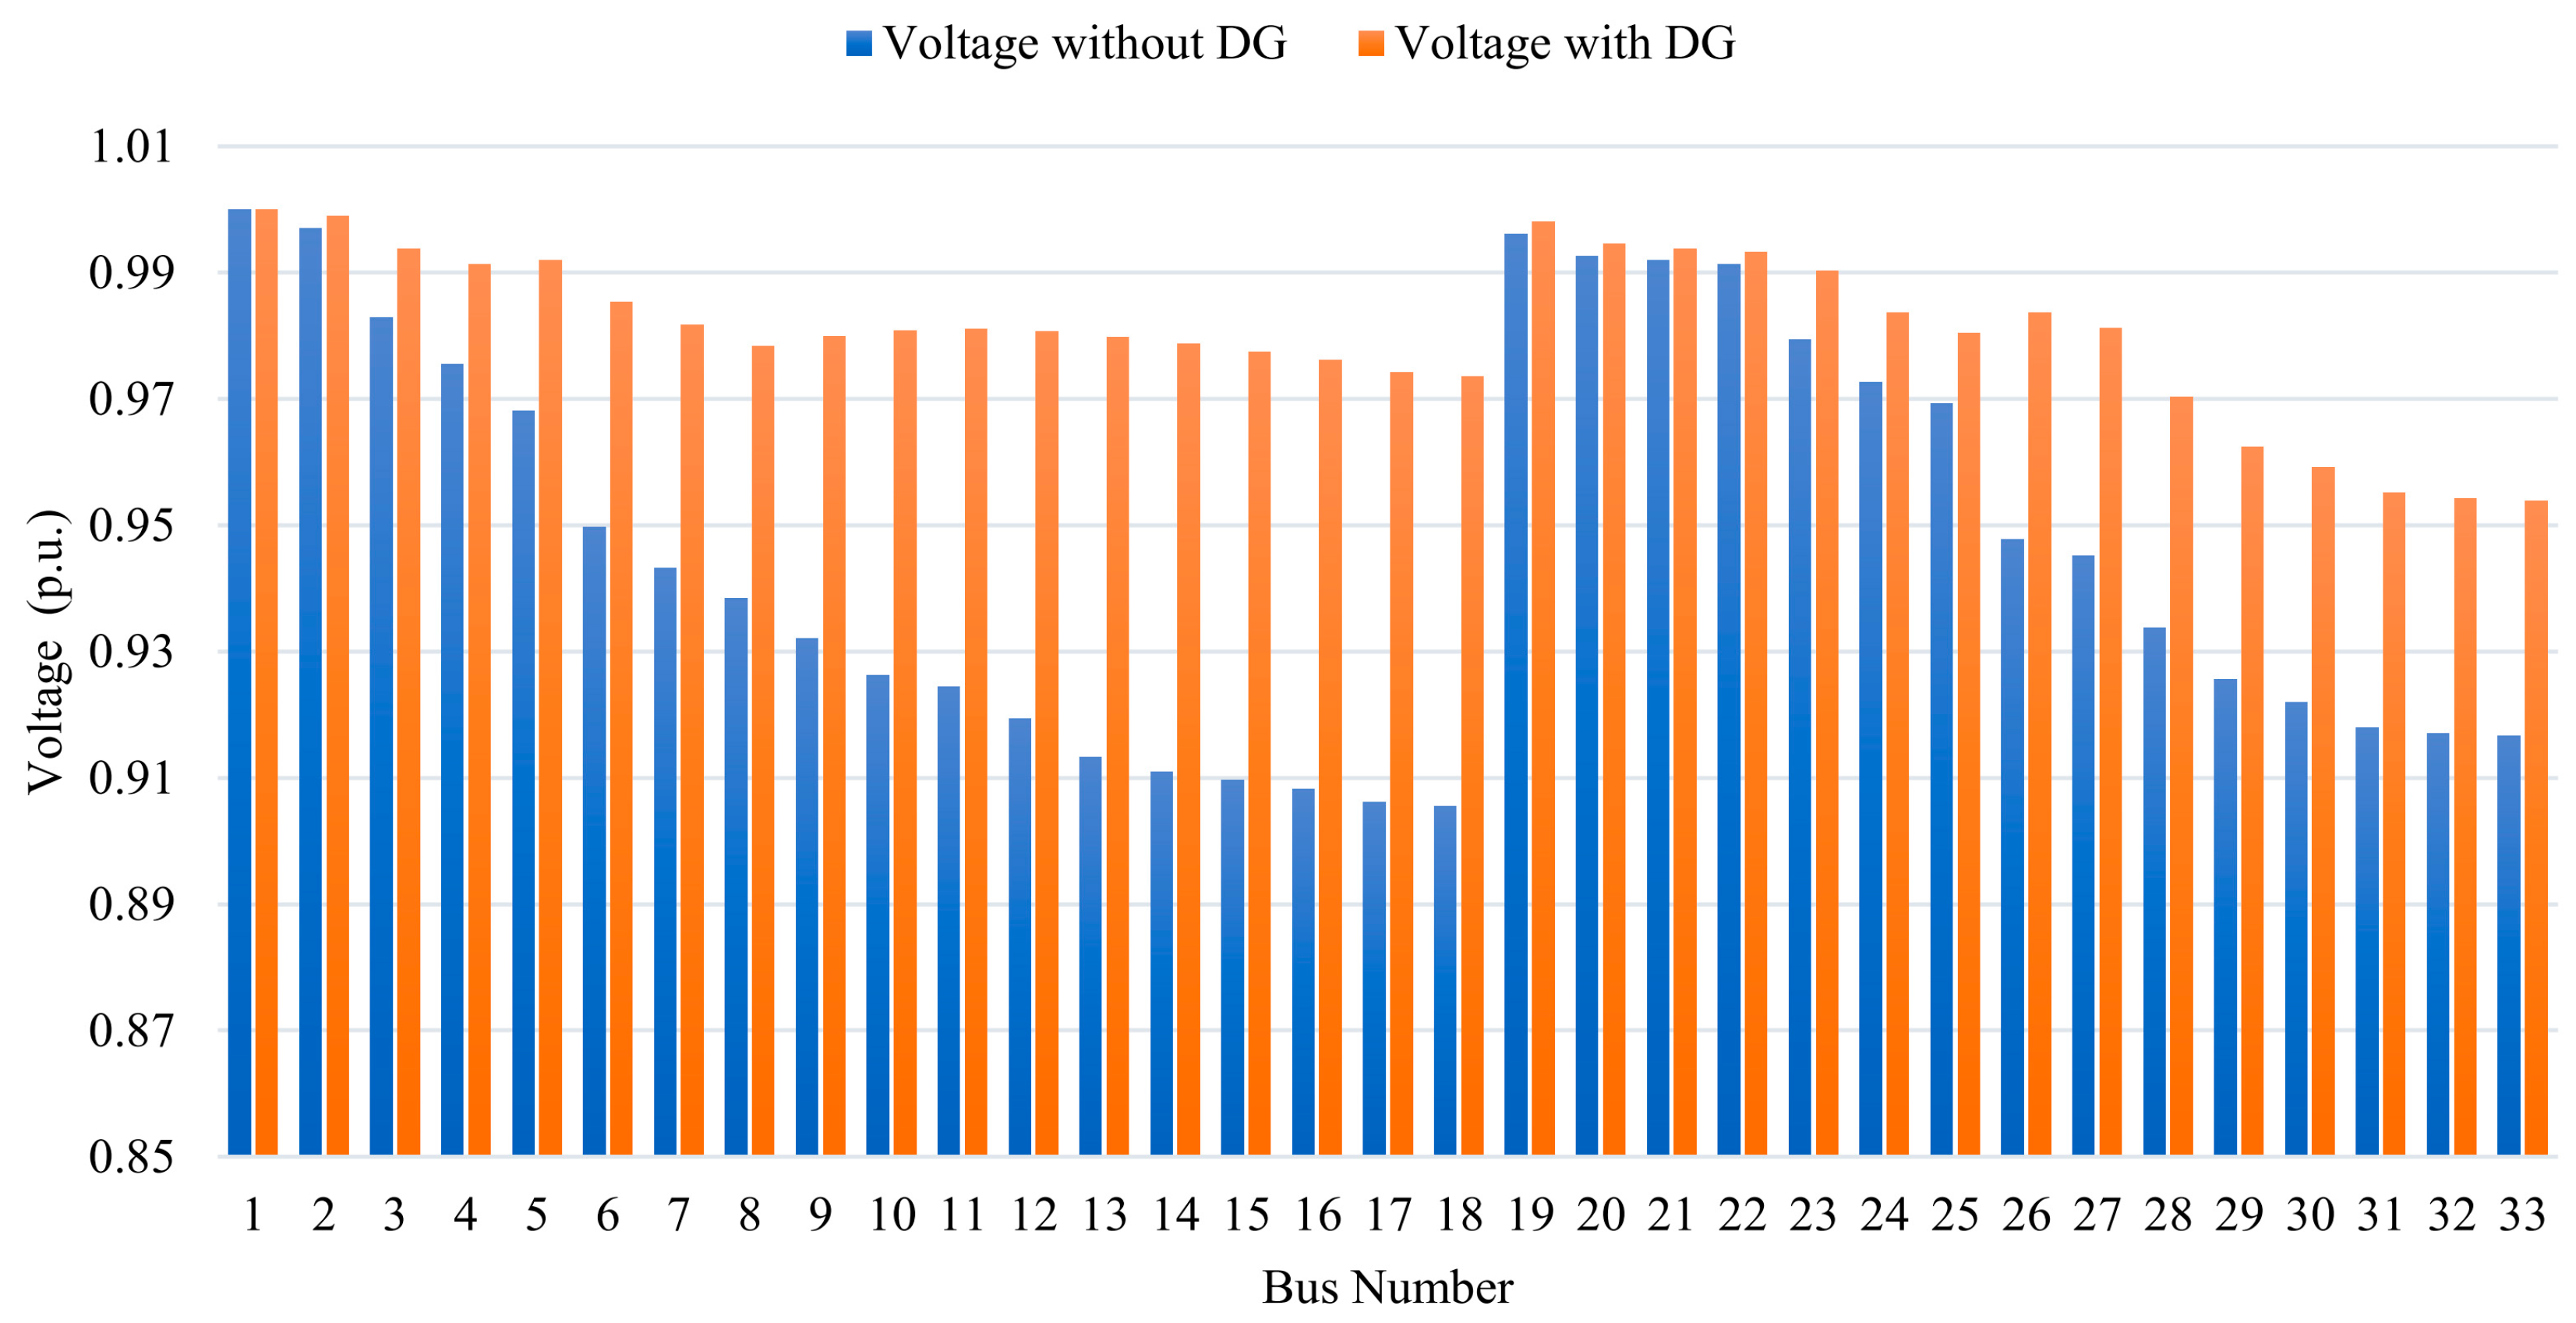
5.2. Performance Analysis of IEEE 33-Bus Power System with PVDG
6. Conclusions
Author Contributions
Funding
Data Availability Statement
Acknowledgments
Conflicts of Interest
References
- Chiradeja, P.; Ramakumar, R. An approach to quantify the technical benefits of distribution system. IEEE Trans. Energy Convers. 2004, 19, 764–773. [Google Scholar]
- Pepermans, G.; Driesen, J.; Haeseldonckx, D.; D’haeseleer, W.; Belmans, R. Distribution generation: Definition, benefits and issues. Energy Policy 2005, 33, 787–798. [Google Scholar]
- Mohammedi, R.D.; Hellal, A.; Arif, S.; Mosbah, M. Optimal DG Placement and Sizing in Radial Distribution Systems Using NSGA-II for Power Loss Minimization and Voltage Stability Enhancement. Int. Rev. Electr. Eng. 2013, 8, 6. [Google Scholar]
- Sun, K.; Yao, W.; Fang, J.; Ai, X.; Wen, J.; Cheng, S. Impedance modeling and stability analysis of grid-connected DFIG-based wind farm with a VSC-HVDC. IEEE J. Emerg. Sel. Top. Power Electron. 2019, 8, 1375–1390. [Google Scholar]
- Layadi, T.M.; Champenois, G.; Mostefai, M. Economic and ecological optimization of multi-source systems under the variability in the cost of fuel. Energy Convers. Manag. 2018, 177, 161–175. [Google Scholar]
- Zhang, X.; Tan, T.; Zhou, B.; Yu, T.; Yang, B.; Huang, X. Adaptive distributed auction-based algorithm for optimal mileage based AGC dispatch with high participation of renewable energy. Int. J. Electr. Power Energy Syst. 2020, 124, 106371. [Google Scholar]
- Wang, Q.; Yao, W.; Fang, J.; Ai, X.; Wen, J.; Yang, X.; Xie, H.; Huang, X. Dynamic modeling and small signal stability analysis of distributed photovoltaic grid-connected system with large scale of panel level DC optimizers. Appl. Energy 2019, 259, 114132. [Google Scholar]
- Barik, S.; Das, D. A novel Q-PQV bus pair method of biomass DGs placement in distribution networks to maintain the voltage of remotely located buses. Energy 2020, 194, 116880. [Google Scholar]
- Zhang, X.S.; Yang, B.; Yu, T.; Jiang, L. Dynamic Surrogate Model Based Optimization for MPPT of Centralized Thermoelectric Generation Systems Under Heterogeneous Temperature Difference. IEEE Trans. Energy Convers. 2020, 35, 966–976. [Google Scholar]
- Duong, M.Q.; Pham, T.D.; Nguyen, T.T.; Doan, A.T.; Van Tran, H. Determination of Optimal Location and Sizing of Solar Photovoltaic Distribution Generation Units in Radial Distribution Systems. Energies 2019, 12, 174. [Google Scholar] [CrossRef]
- Remha, S.; Chettih, S.; Arif, S. Optimal DG location and sizing for minimum active power loss in radial distribution system using firefly algorithm. Int. J. Energetica 2017, 4, 6–10. [Google Scholar]
- Matlokotsi, T.; Chowdhury, S. Optimal Placement and Sizing of Renewable Distributed Generation in Electricity Networks Considering Different Load Models. IEEE Conf. 2017, 1, 1–6. [Google Scholar] [CrossRef]
- Rekha, C.M.; Shankaralingappa, C.B. Optimal placement of PSO based Photovotaic (PV) distributed generator (DG) in a distribution system. J. Tianjin Univ. Sci. Technol. 2022, 55, 493–2137. [Google Scholar]
- Prakash, D.; Lakshminarayana, C. Multiple DG placements in radial distribution system for multi objectives using Whale Optimization Algorithm. Alex. Eng. J. 2018, 57, 2797–2806. [Google Scholar] [CrossRef]
- Kumar, M.; Nallagownden, P.; Elamvazuthi, I. Optimal Placement and Sizing of Renewable Distributed Generations and Capacitor Banks into Radial Distribution Systems. Energies 2017, 10, 811. [Google Scholar] [CrossRef]
- Khasanov, M.; Kamel, S.; Xie, K.; Zhou, P.; Li, B. Allocation of Distributed Generation in Radial Distribution Networks Using an Efficient Hybrid Optimization Algorithm. In Proceedings of the 2019 IEEE Innovative Smart Grid Technologies-Asia (ISGT Asia), Chengdu, China, 21–24 May 2019; pp. 1300–1305. [Google Scholar]
- Sarhan, S.; Shaheen, A.; El-Sehiemy, R.; Gafar, M. An Augmented Social Network Search Algorithm for Optimal Reactive Power Dispatch Problem. Mathematics 2023, 11, 1236. [Google Scholar]
- Shaheen, A.M.; Elsayed, A.M.; Ginidi, A.R.; El-Sehiemy, R.A.; Elattar, E. A heap-based algorithm with deeper exploitative feature for optimal allocations of distributed generations with feeder reconfiguration in power distribution networks. Knowl. -Based Syst. 2022, 241, 108269. [Google Scholar]
- Mahfoud, R.J.; Alkayem, N.F.; Sun, Y.; Haes Alhelou, H.; Siano, P.; Parente, M. Improved Hybridization of Evolutionary Algorithms with a Sensitivity-Based Decision-Making Technique for the Optimal Planning of Shunt Capacitors in Radial Distribution Systems. Appl. Sci. 2020, 10, 1384. [Google Scholar]
- Jamil Mahfoud, R.; Sun, Y.; Faisal Alkayem, N.; Haes Alhelou, H.; Siano, P.; Shafie-Khah, M. A Novel Combined Evolutionary Algorithm for Optimal Planning of Distributed Generators in Radial Distribution Systems section. Appl. Sci. 2019, 9, 3394. [Google Scholar]
- Cui, Z.; Wu, J.; Ding, Z.; Duan, Q.; Lian, W.; Yang, Y.; Cao, T. A hybrid rolling grey framework for short time series modelling. Neural Comput. Appl. 2021, 33, 11339–11353. [Google Scholar]
- Zhao, S.; Wu, Y.; Tan, S.; Wu, J.; Cui, Z.; Wang, Y.G. QQLMPA: A quasi-opposition learning, and Q-learning based marine predators’ algorithm. Expert Syst. Appl. 2023, 213, 119246. [Google Scholar]
- Tan, S.; Zhao, S.; Wu, J. QL-ADIFA: Hybrid optimization using Q-learning and an adaptive logarithmic spiral-levy firefly algorithm. Math. Biosci. Eng. 2023, 20, 13542–13561. [Google Scholar]
- Tamoor, M.; Bhatti, A.R.; Farhan, M.; Zaka, M.A.; ZakaUllah, P. Solar Energy Capacity Assessment and Performance Evaluation of Designed Grid-Connected Photovoltaic Systems. Appl. Sci. 2023, 37, 39. [Google Scholar] [CrossRef]
- Khasanov, M.; Kamel, S.; Tostado-Véliz, M.; Jurado, F. Allocation of Photovoltaic and Wind Turbine Based DG Units Using Artificial Ecosystem-based Optimization. In Proceedings of the 2020 IEEE International Conference on Environment and Electrical Engineering and 2020 IEEE Industrial and Commercial Power Systems Europe, Madrid, Spain, 9–12 June 2020; pp. 1–5. [Google Scholar]
- Urinboy, J.; Hasanov, M. Improvement Performance of Radial Distribution System by Optimal Placement of Photovoltaic Array. Int. J. Eng. Inf. Syst. 2021, 5, 157–159. [Google Scholar]
- Janamala, V. A new meta-heuristic pathfinder algorithm for solving optimal allocation of solar photovoltaic system in multi-lateral distribution system for improving resilience. SN Appl. Sci. 2021, 3, 118. [Google Scholar]
- El-Fergany, A. Optimal allocation of multi-type distributed generators using backtracking search optimization algorithm. Int. J. Electr. Power Energy Syst. 2015, 64, 1197–1205. [Google Scholar]
- Ali, E.S.; Abd Elazim, S.M.; Abdelaziz, A.Y. Ant Lion optimization algorithm for optimal location and sizing of renewable distrib-uted generations. Renew Energy 2017, 101, 1311–1324. [Google Scholar]
- Atwa, Y.M.; El-Saadany, E.F.; Salama, M.M.A.; Seethapathy, R. Optimal Renewable Resources Mix for Distribution System Energy Loss Minimization. IEEE Trans. Power Syst. 2009, 25, 360–370. [Google Scholar]
- Kennedy, J.; Eberhart, R. Particle Swarm Optimization. In Proceedings of the ICNN’95—International Conference on Neural Networks, Perth, Australia, 27 November–1 December 1995; Volume 4, pp. 1942–1948. [Google Scholar] [CrossRef]
- Eberhart, R.; Kennedy, J. A new optimizer using particle swarm theory. In Proceedings of the Sixth International Symposium on Micro Machine and Human Science, Nagoya, Japan, 4–6 October 1995; pp. 39–43. [Google Scholar] [CrossRef]
- Bohre, A.K.; Agnihotri, G.; Dubey, M. Hybrid butterfly-based particle swarm optimization for optimization problems. In Proceedings of the First International Conference on Networks and Soft Computing (ICNSC), Guntur, India, 19–20 August 2014; pp. 172–177. [Google Scholar] [CrossRef]
- Zeinalzadeh, A.; Mohammadi, Y.; Moradi, M.H. Optimal multi objective placement and sizing of multiple DGs and shunt capacitor banks simultaneously considering load uncertainty via MOPSO approach. Int. J. Electr. Power Energy Syst. 2015, 67, 336–349. [Google Scholar]
- Haque, M. Efficient load flow method for distribution systems with radial or mesh configuration. IEE Proc. Gener. Transm. Distrib. 1996, 143, 33–38. [Google Scholar]
- Salkuti, S.R.; Battu, N.R. An effective network reconfiguration approach of radial distribution system for loss minimization and voltage profile improvement. Bull. Electr. Eng. Informatics 2021, 10, 1819–1827. [Google Scholar] [CrossRef]
- Eberhart, R.C.; Shi, Y. Comparing inertial weights and constriction factor in particle swarm optimization. In Proceedings of the International Congress on Evaluating Computation, La Jolla, CA, USA, 16–19 July 2000; pp. 84–89. [Google Scholar]
- Vita, V. Development of a Decision-Making Algorithm for the Optimum Size and Placement of Distributed Generation Units in Distribution Networks. Energies 2017, 10, 1433. [Google Scholar] [CrossRef]


| Subject | without PVDG | with PVDG |
|---|---|---|
| Total Active Power loss (kW) | 206.95 | 91.75 |
| Total Reactive Power loss (kVAR) | 137.46 | 64.79 |
| Loss decrement in Pi | - | 55.66% |
| Loss decrement in Qi | - | 52.85% |
| Minimum Voltage V (p.u.) | 0.9116@bus 18 | 0.9575@bus 18 |
| Maximum Voltage V (p.u.) | 0.9970@bus 2 | 0.9985@bus 2 |
| Cost of losses ($) | 108,772.92 | 48,223.4 |
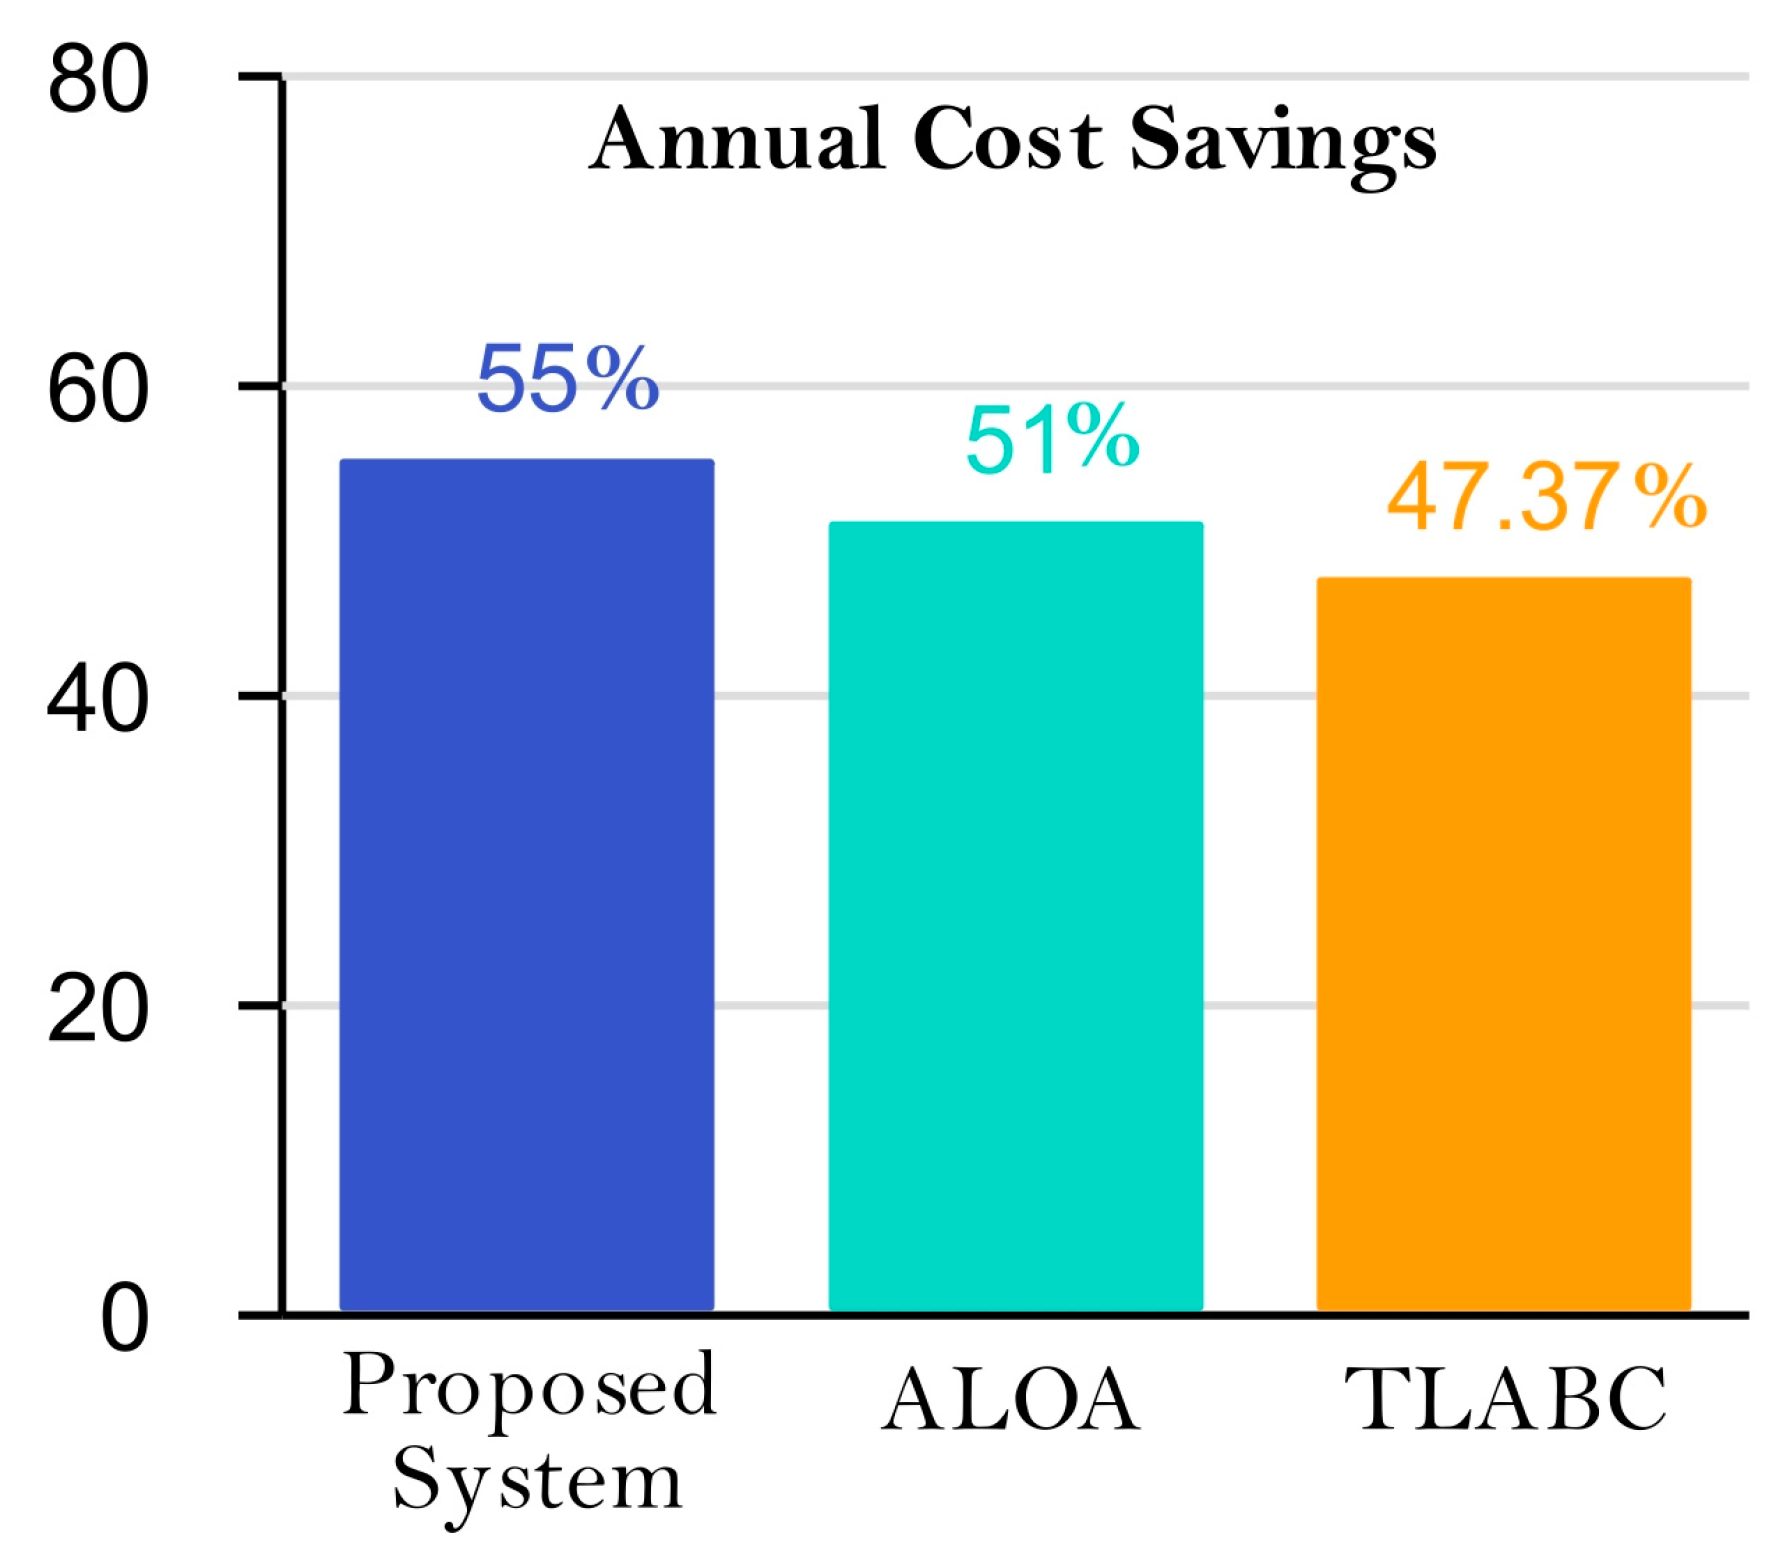
| Saving ($/year) | - | 60,549.12 |
| Total DG (Size@Location) | - | 2440 kW@bus 9 |
| Execution time (s) | - | 3.254238 |
| Author | Year | Control Algorithm | Min. Voltage Improved@Bus | Reduction in Active Power Loss (%) | Reduction in Reactive Power Loss (%) | Execution Time (s) | Maximum Cost Savings (USD) |
|---|---|---|---|---|---|---|---|
| Remha et al. [11] | 2017 | FFA | 0.9412@18 | 47.39% | - | - | - |
| T. Matlokosti [12] | 2017 | GA | 0.9175@18 | 46.65% | - | - | - |
| E.S. Ali [38] | 2017 | ALOA | 0.9503@18 | 51.15% | 42.88% | - | $56,726.5 |
| M. Khasanov [16] | 2019 | TLABC | 0.94237@18 | 47.37% | 42.891% | - | $52,536.3 |
| M. Khasanov [25] | 2020 | AEO | 0.94237@18 | 47.37% | - | - | - |
| V Janamala [27] | 2020 | PFA | 0.9424@18 | 47.38% | 42.89% | 25.342 | - |
| J. Urinby [26] | 2021 | DE | 0.95836@18 | 47.38% | - | - | - |
| Rekha C. M. [13] | 2022 | PSO | 0.9180@17 | 49.28% | 32.38% | - | - |
| Proposed System | 2023 | PSO | 0.9575@18 | 55.66% | 52.78% | 3.254238 | $60,527.12 |
Disclaimer/Publisher’s Note: The statements, opinions and data contained in all publications are solely those of the individual author(s) and contributor(s) and not of MDPI and/or the editor(s). MDPI and/or the editor(s) disclaim responsibility for any injury to people or property resulting from any ideas, methods, instructions or products referred to in the content. |
© 2023 by the authors. Licensee MDPI, Basel, Switzerland. This article is an open access article distributed under the terms and conditions of the Creative Commons Attribution (CC BY) license (https://creativecommons.org/licenses/by/4.0/).
Share and Cite
Ali, M.A.; Bhatti, A.R.; Rasool, A.; Farhan, M.; Esenogho, E. Optimal Location and Sizing of Photovoltaic-Based Distributed Generations to Improve the Efficiency and Symmetry of a Distribution Network by Handling Random Constraints of Particle Swarm Optimization Algorithm. Symmetry 2023, 15, 1752. https://doi.org/10.3390/sym15091752
Ali MA, Bhatti AR, Rasool A, Farhan M, Esenogho E. Optimal Location and Sizing of Photovoltaic-Based Distributed Generations to Improve the Efficiency and Symmetry of a Distribution Network by Handling Random Constraints of Particle Swarm Optimization Algorithm. Symmetry. 2023; 15(9):1752. https://doi.org/10.3390/sym15091752
Chicago/Turabian StyleAli, Muhammad Abid, Abdul Rauf Bhatti, Akhtar Rasool, Muhammad Farhan, and Ebenezer Esenogho. 2023. "Optimal Location and Sizing of Photovoltaic-Based Distributed Generations to Improve the Efficiency and Symmetry of a Distribution Network by Handling Random Constraints of Particle Swarm Optimization Algorithm" Symmetry 15, no. 9: 1752. https://doi.org/10.3390/sym15091752
APA StyleAli, M. A., Bhatti, A. R., Rasool, A., Farhan, M., & Esenogho, E. (2023). Optimal Location and Sizing of Photovoltaic-Based Distributed Generations to Improve the Efficiency and Symmetry of a Distribution Network by Handling Random Constraints of Particle Swarm Optimization Algorithm. Symmetry, 15(9), 1752. https://doi.org/10.3390/sym15091752