
The Methods of Determining Temporal Direction Based on Asymmetric Information of the Optic Disc for Optimal Fovea Detection


Abstract
:1. Introduction
- Introducing a feature extraction technique that relies on asymmetries associated with the OD and its surrounding area;
- Presenting a method for determining the temporal direction, which proves highly beneficial for foveal ROI detection;
- Enhancing the effectiveness of fovea detection through the utilization of the temporal direction for foveal ROI determination.
2. Materials and Methods
2.1. Materials
2.1.1. Dataset
2.1.2. Environment
2.2. Methods
2.2.1. Pre-Processing
- Resizing: The retinal images in different datasets vary in size and proportions, depending on the conditions during image capture. In this study, we aim to establish consistency by resizing the images. To maintain the original shape of objects within each retinal image, we preserved the proportions of the image during resizing. The initial result was achieved by setting the height of each image to 564 pixels, while adjusting the width according to the original aspect ratio. The resized image is denoted as Ir in our study;
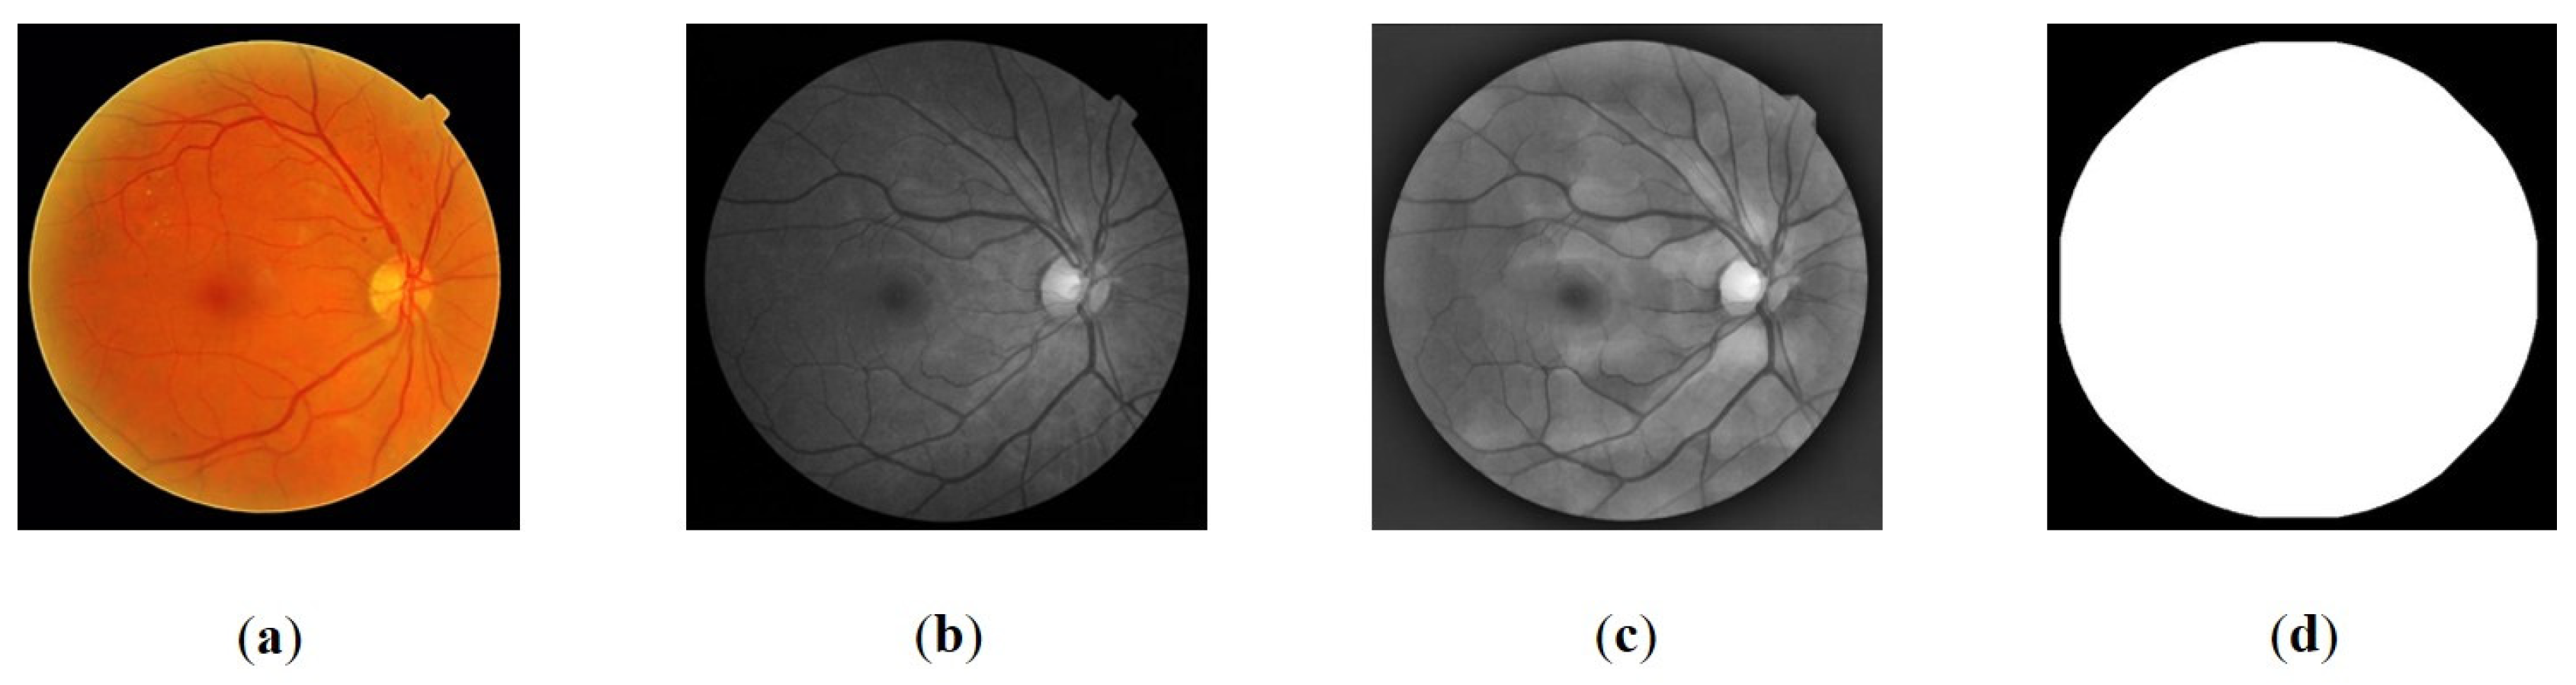
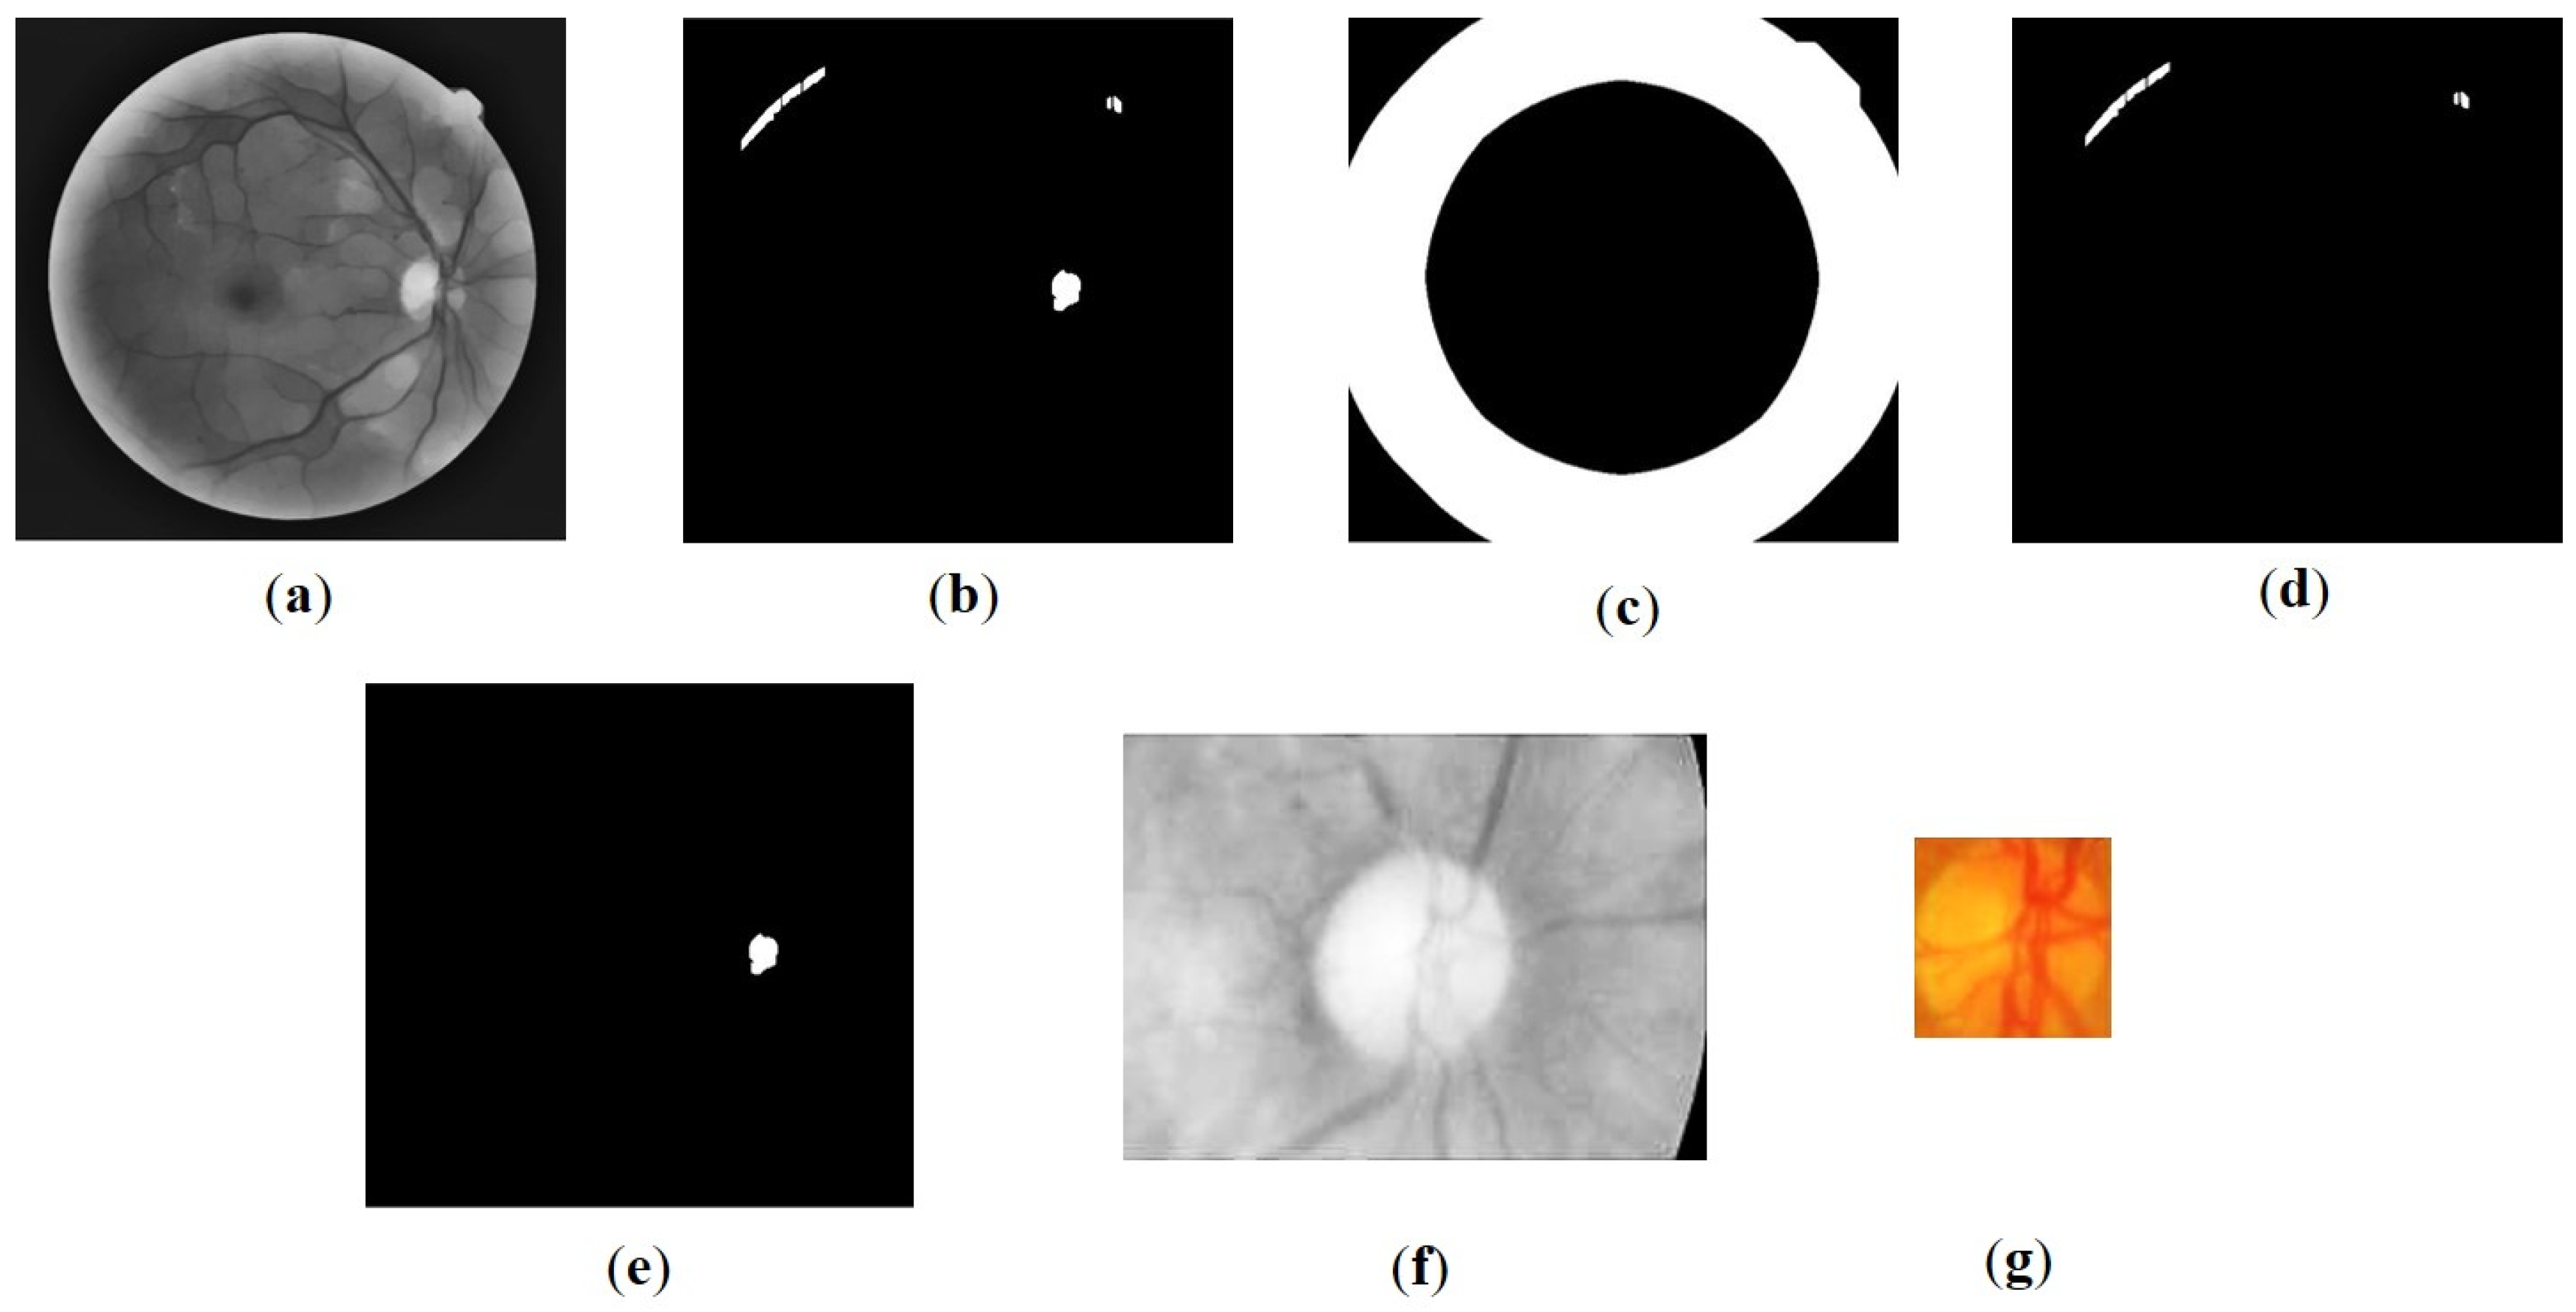
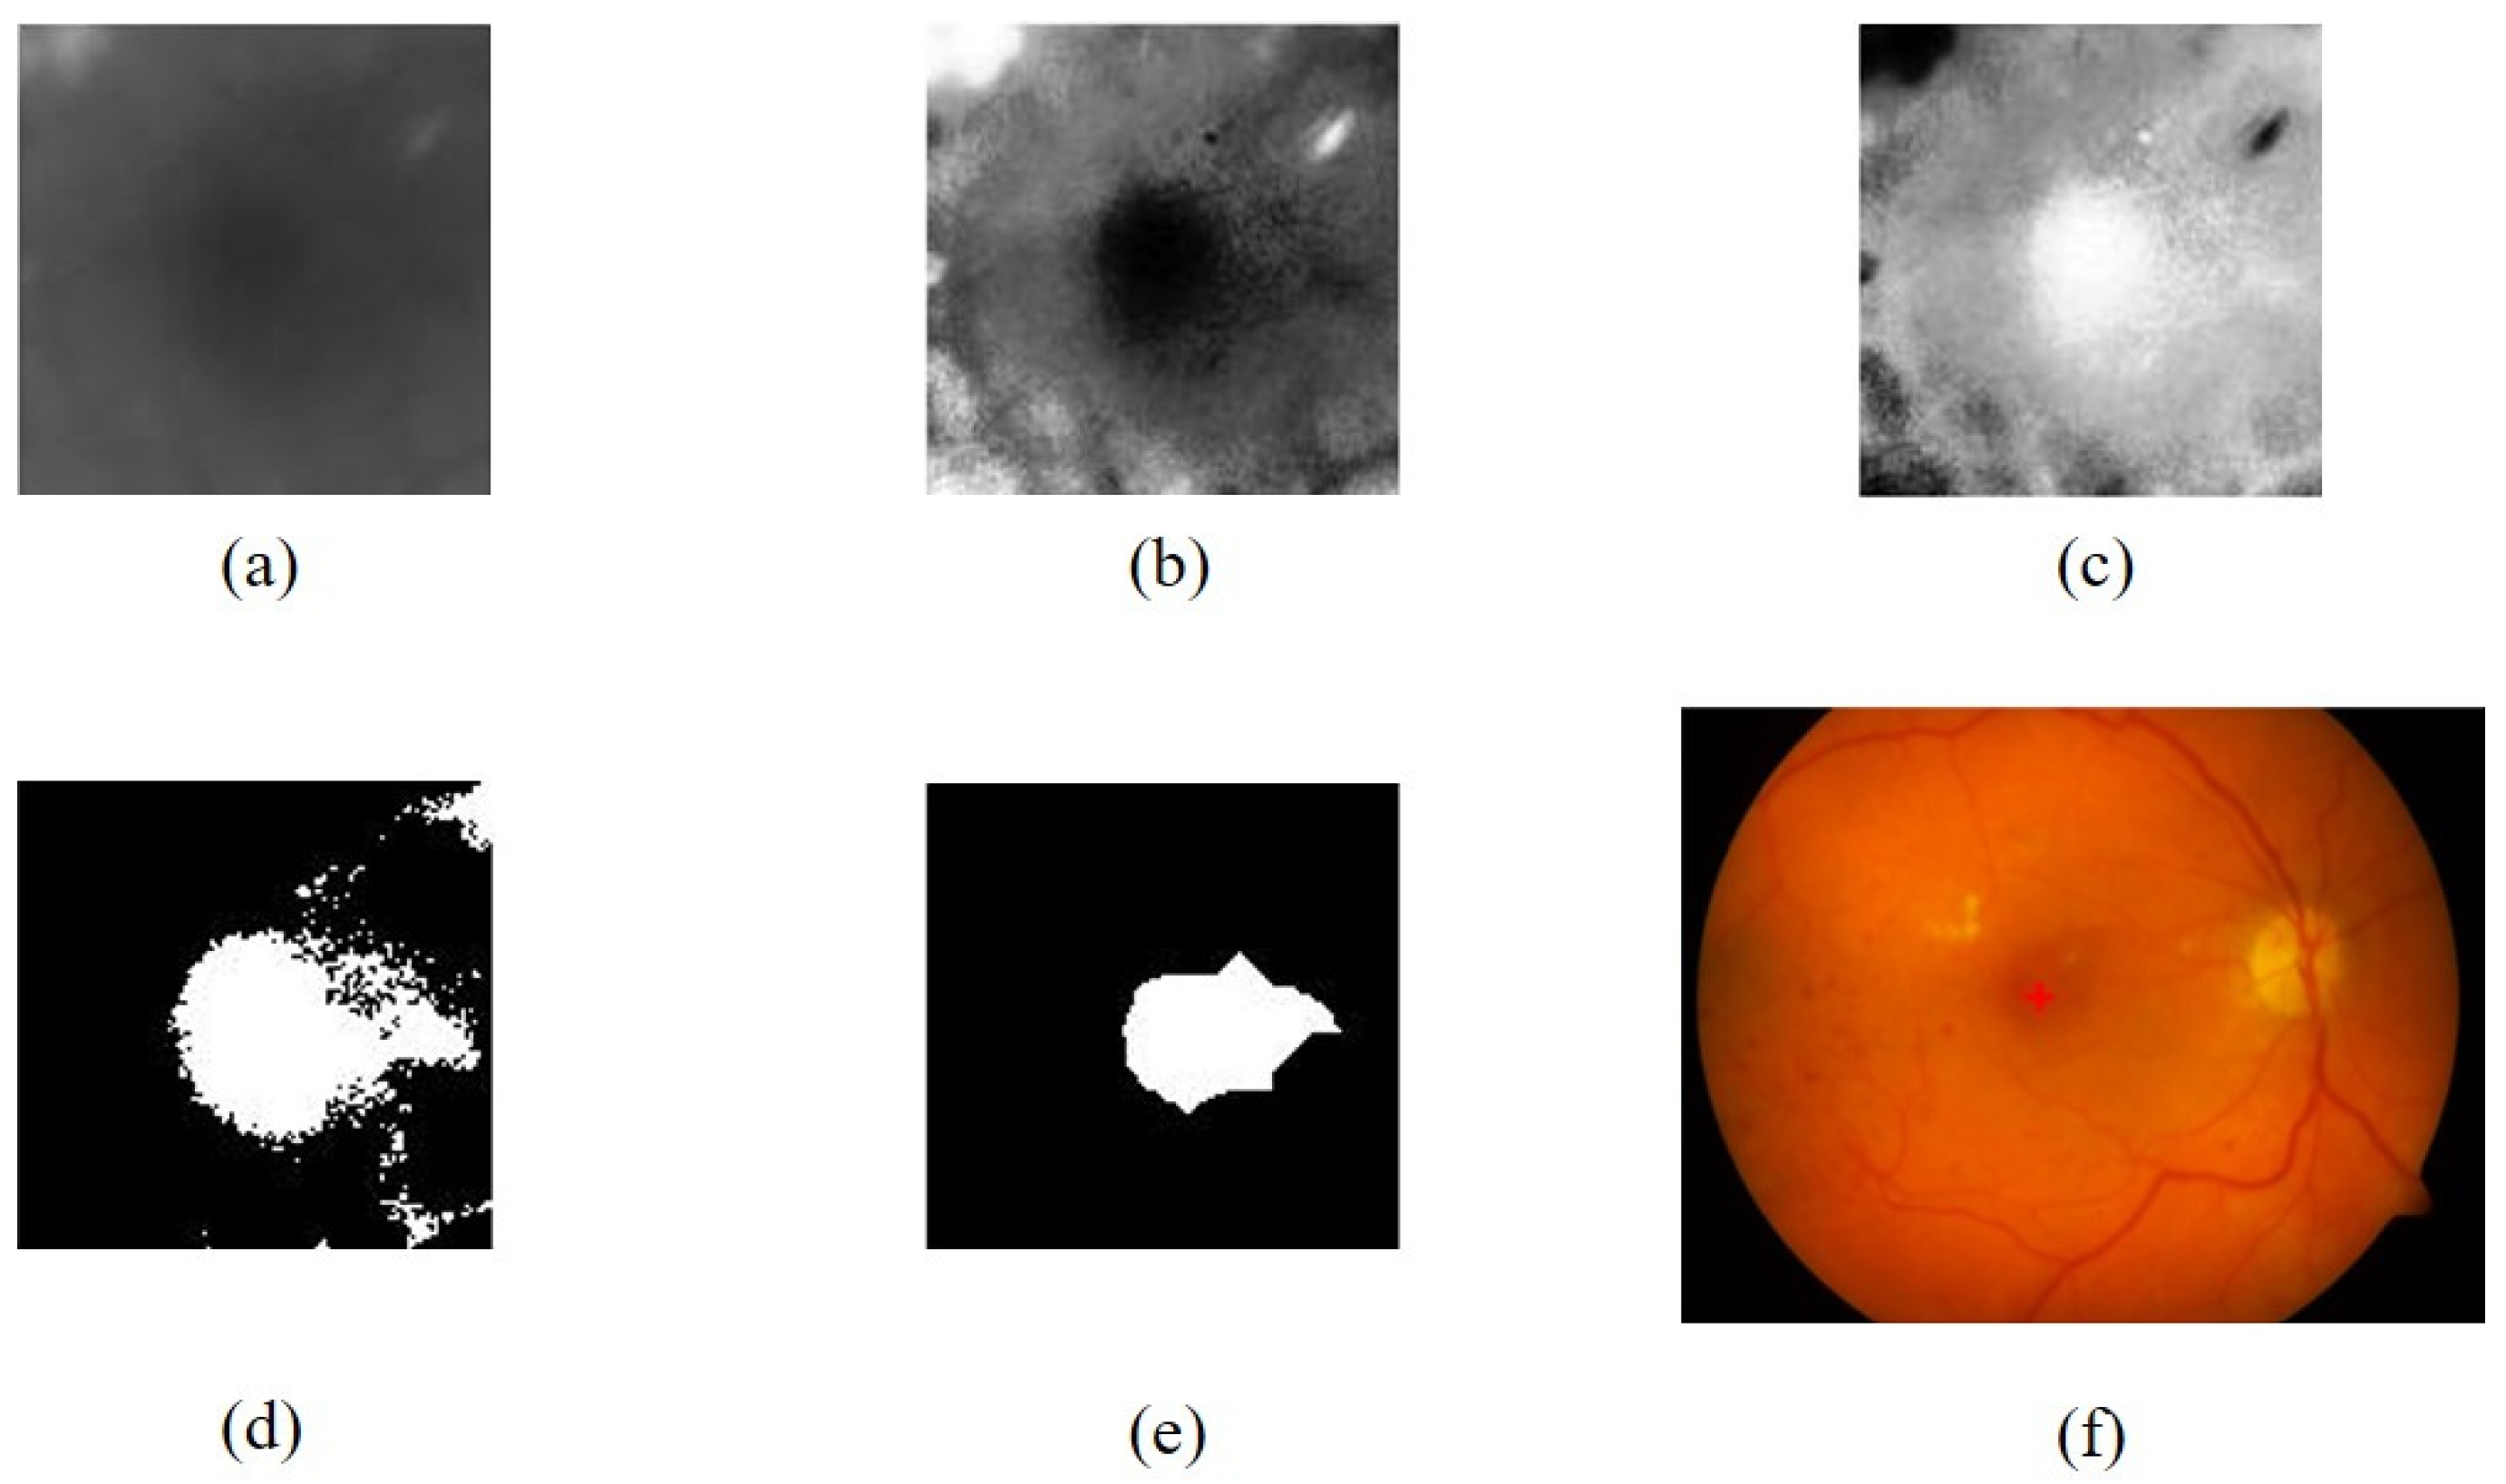
- Illumination normalization: In order to detect the OD and fovea, a thresholding approach was employed. However, it was observed that uneven illumination, as illustrated in Figure 1a, negatively impacted the detection accuracy. To address this issue, a normalization step was performed prior to the detection process. The normalization aims to reduce the excessive brightness that can occasionally be observed at the border of the FOV, as well as decreasing the light intensity in areas outside the OD region that exhibit similar intensity to the OD. In the initial phase, the resized images were subjected to contrast enhancement using Clip Limited Adaptive Histogram Equalization (CLAHE), resulting in the creation of an enhanced image denoted as Ic. This enhancement process specifically utilized the green layer, known for its superior contrast properties (Figure 1b) [31]. Furthermore, intensity normalization was conducted following the approach described in a previous study [32]. The resulting normalized image, denoted as In, is illustrated in Figure 1c;
- The FOV represents the visible area of the retina captured in an image. The size of the FOV plays a crucial role in estimating the dimensions of retinal objects, particularly the OD. This is particularly valuable in addressing variations in the proportion of retinal area displayed across different datasets. By defining the area, the search location for objects on the retina can be constrained. Additionally, the FOV size is utilized to estimate the location of the fovea through a geometric approach. Segmentation of the FOV area was accomplished by applying Otsu thresholding to the grayscale image, utilizing a threshold value of 0.2 times the Otsu threshold obtained. The segmented FOV is illustrated in Figure 1d.
2.2.2. Optic Disc Localization
2.2.3. Temporal Direction Determination
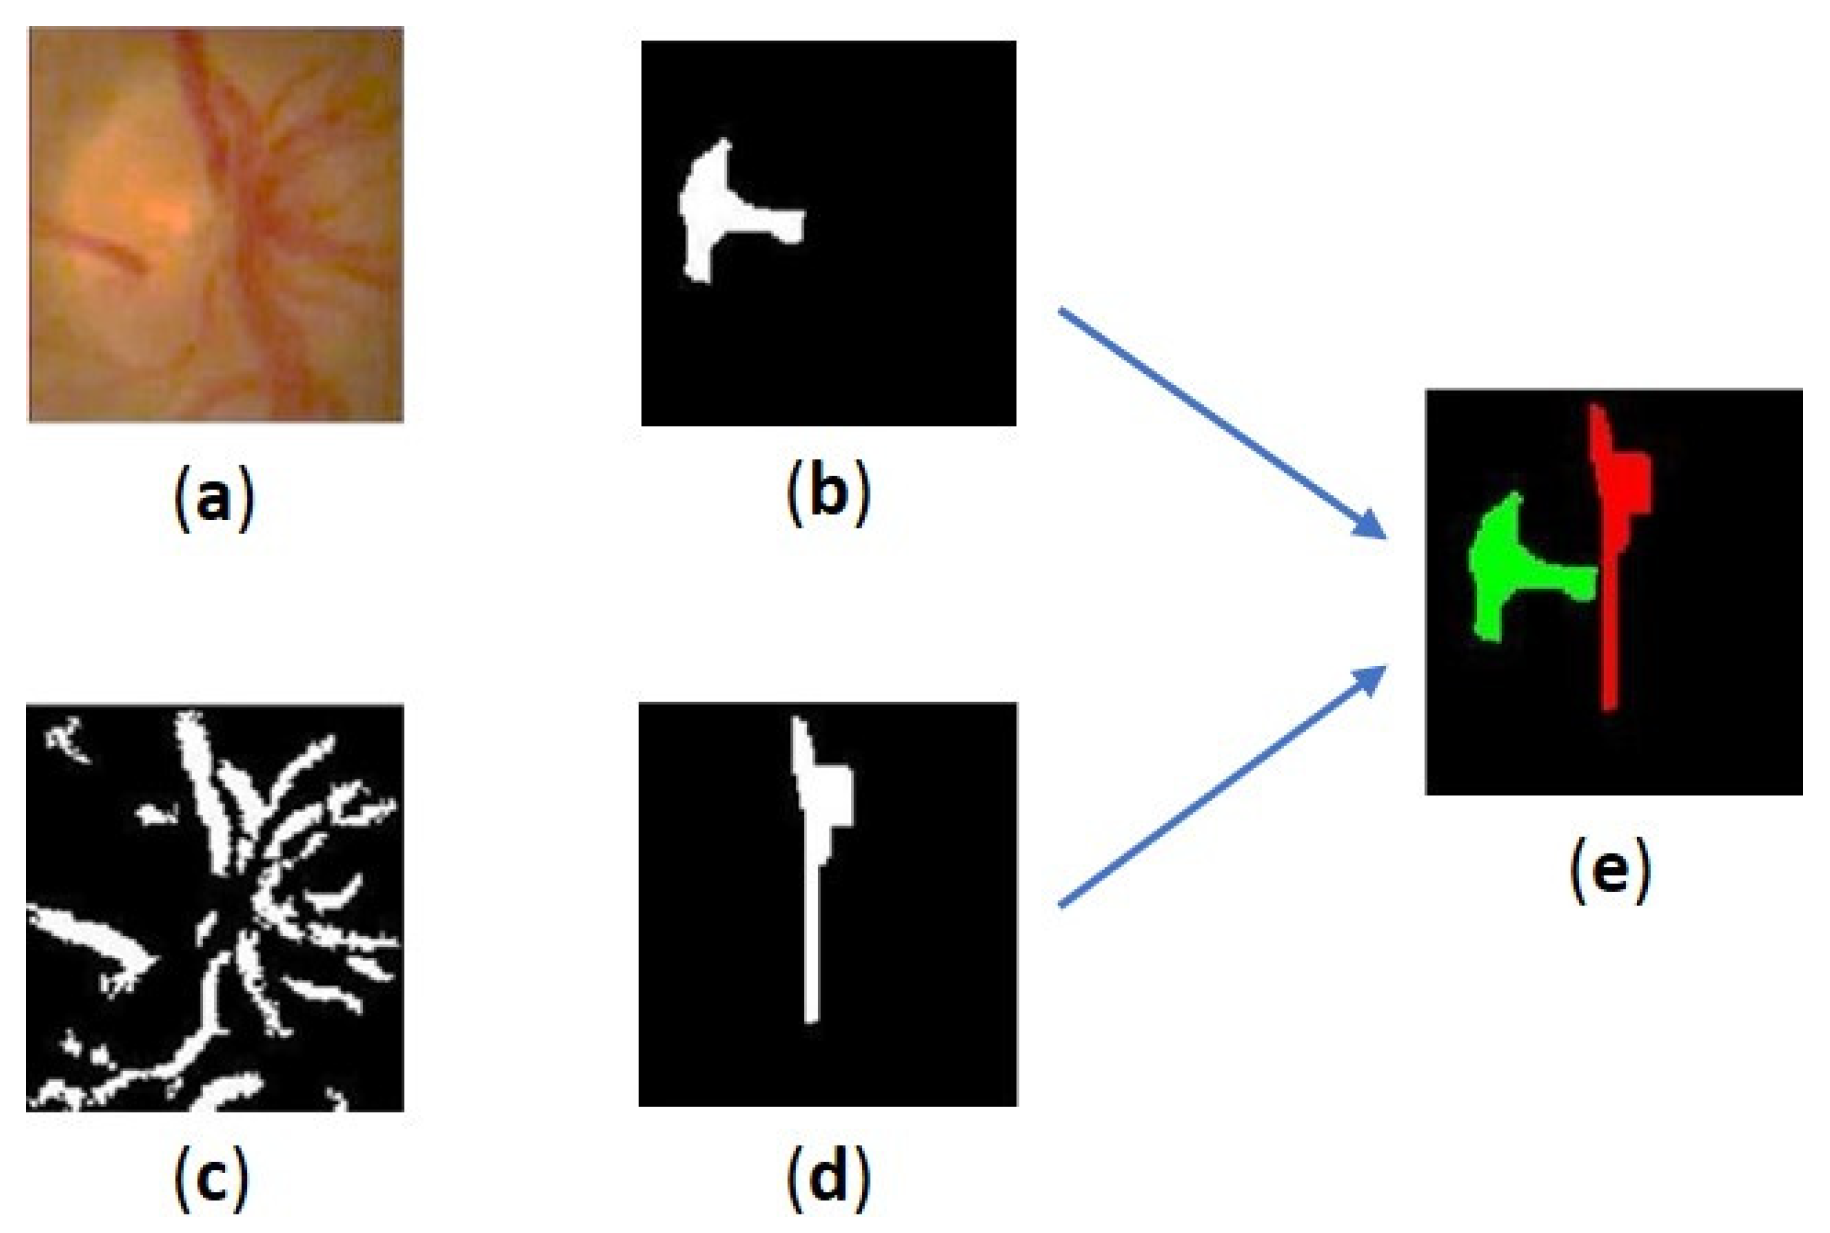
- The convergence pattern of blood vessels in the OD: We examine the convergence pattern of blood vessels within the OD. The direction of convergence can provide valuable clues regarding the temporal direction;
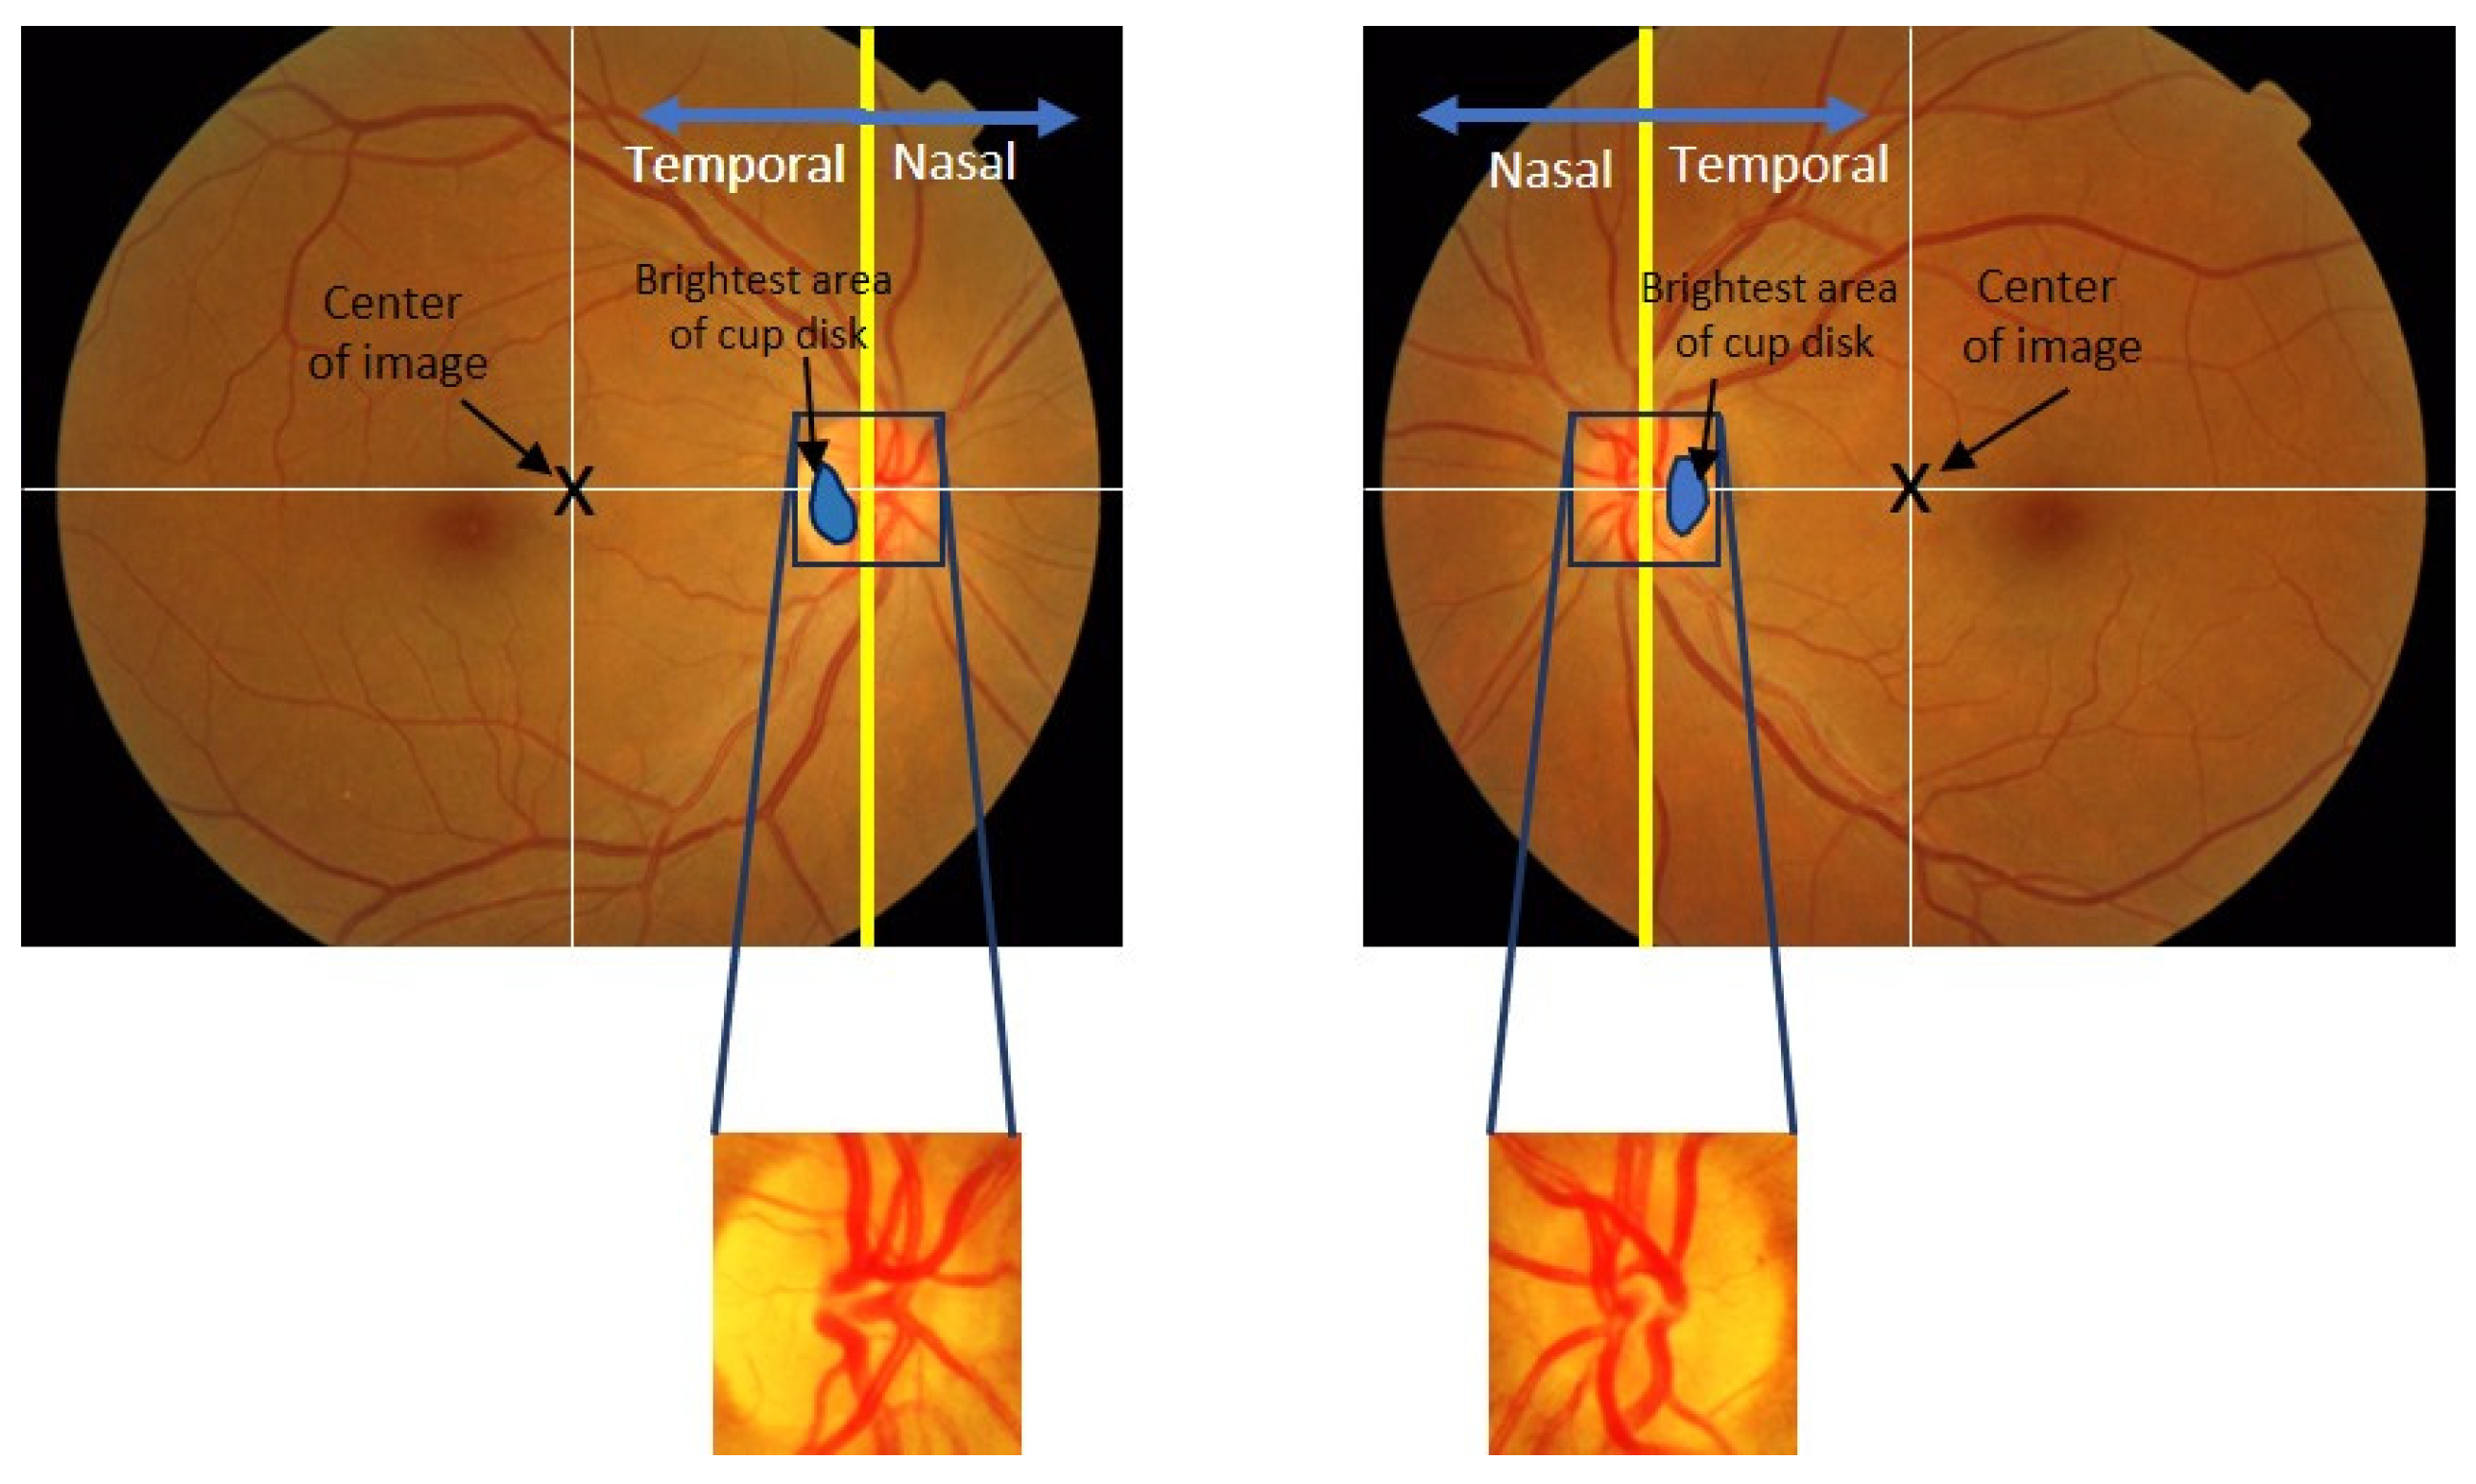
- The location of the brightest area of cup disc in the OD: We analyze the OD to identify the cup disc with the highest brightness. By assessing its position within the OD, we can infer the temporal direction;
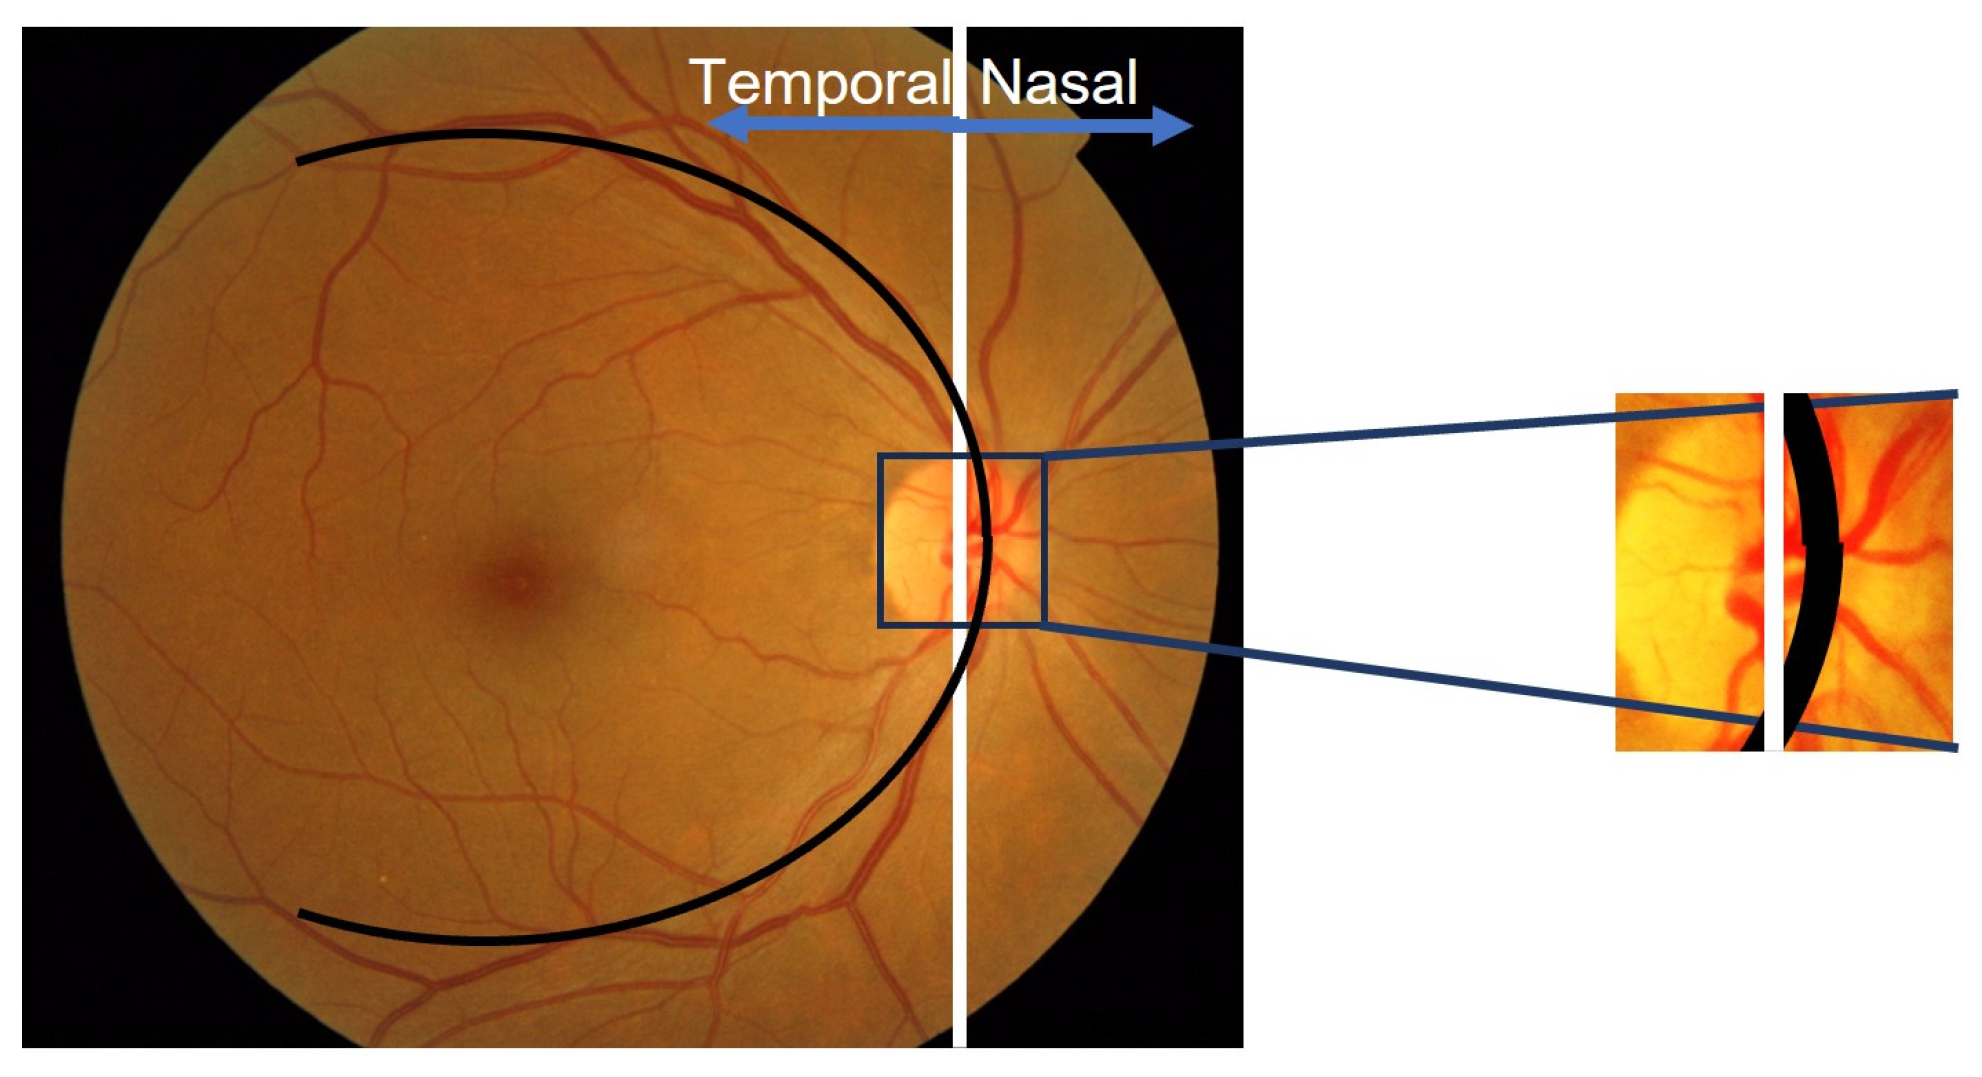
- The location of the OD in the retinal image: We investigate the position of the OD within the retinal image. Its relative location can offer insights into the temporal direction.
Convergence Pattern of Blood Vessels in the OD
Location of the Brightest Area of Cup Disc Area in an Optic Disc
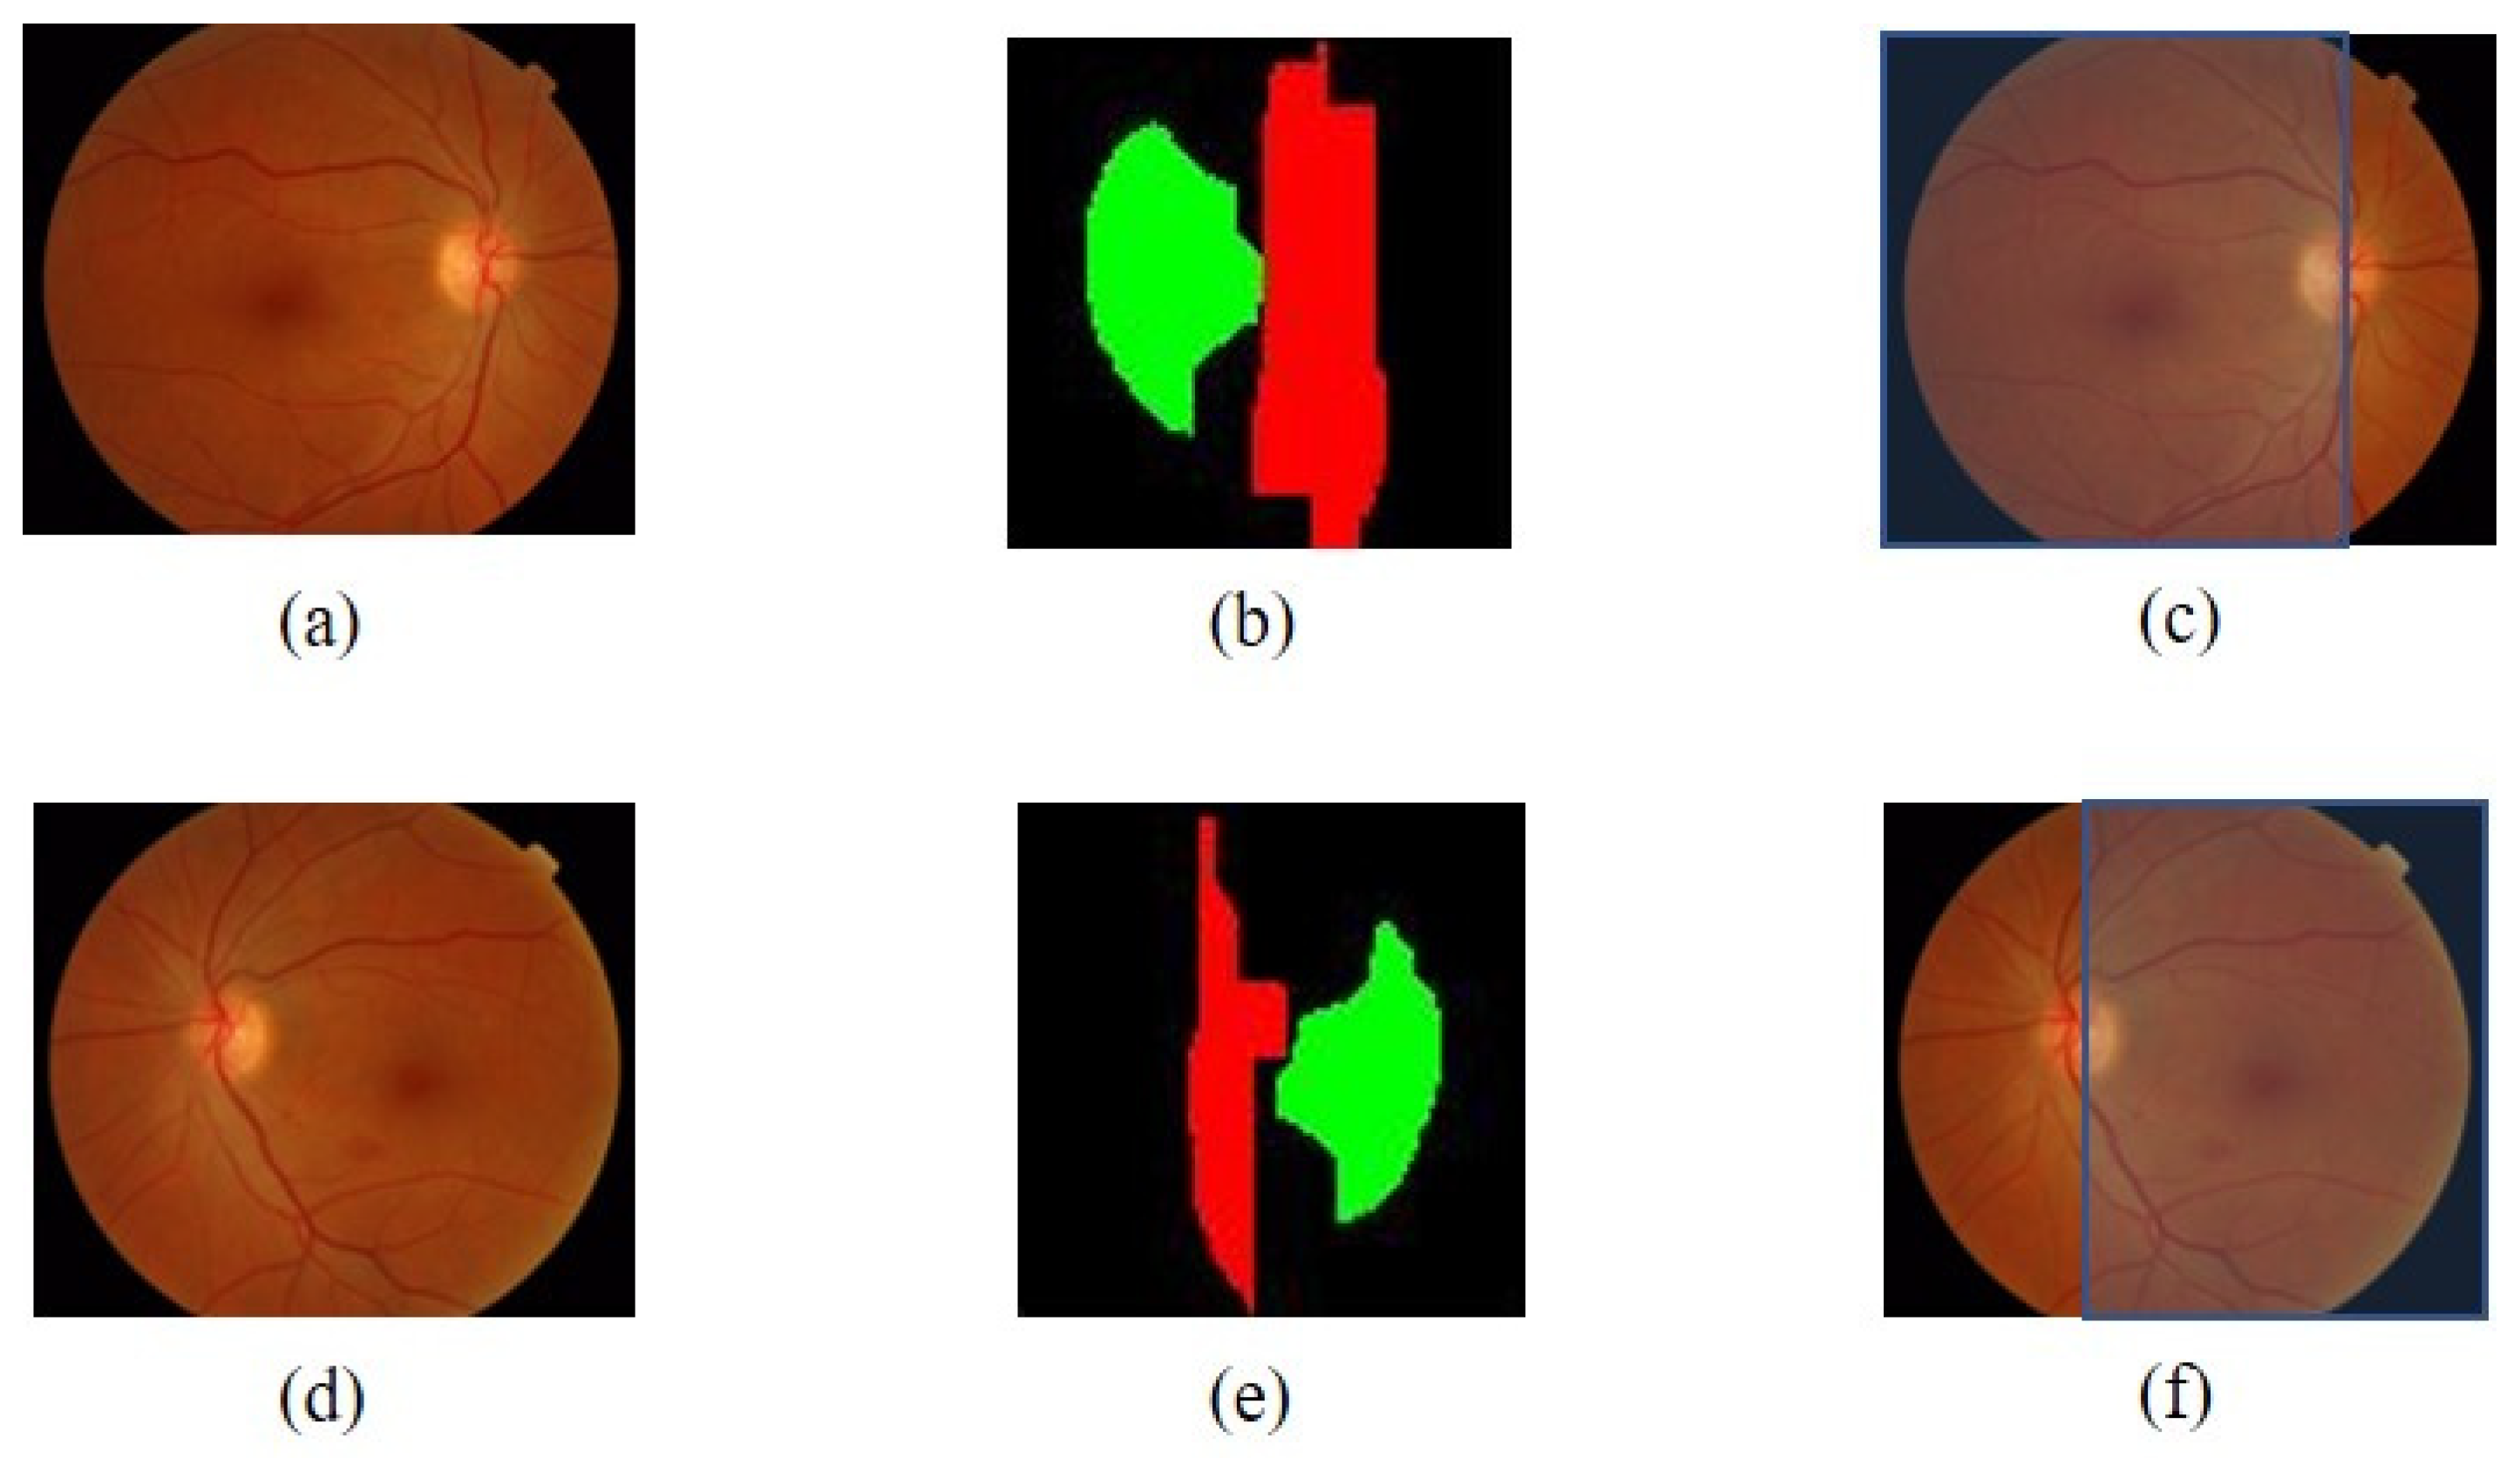
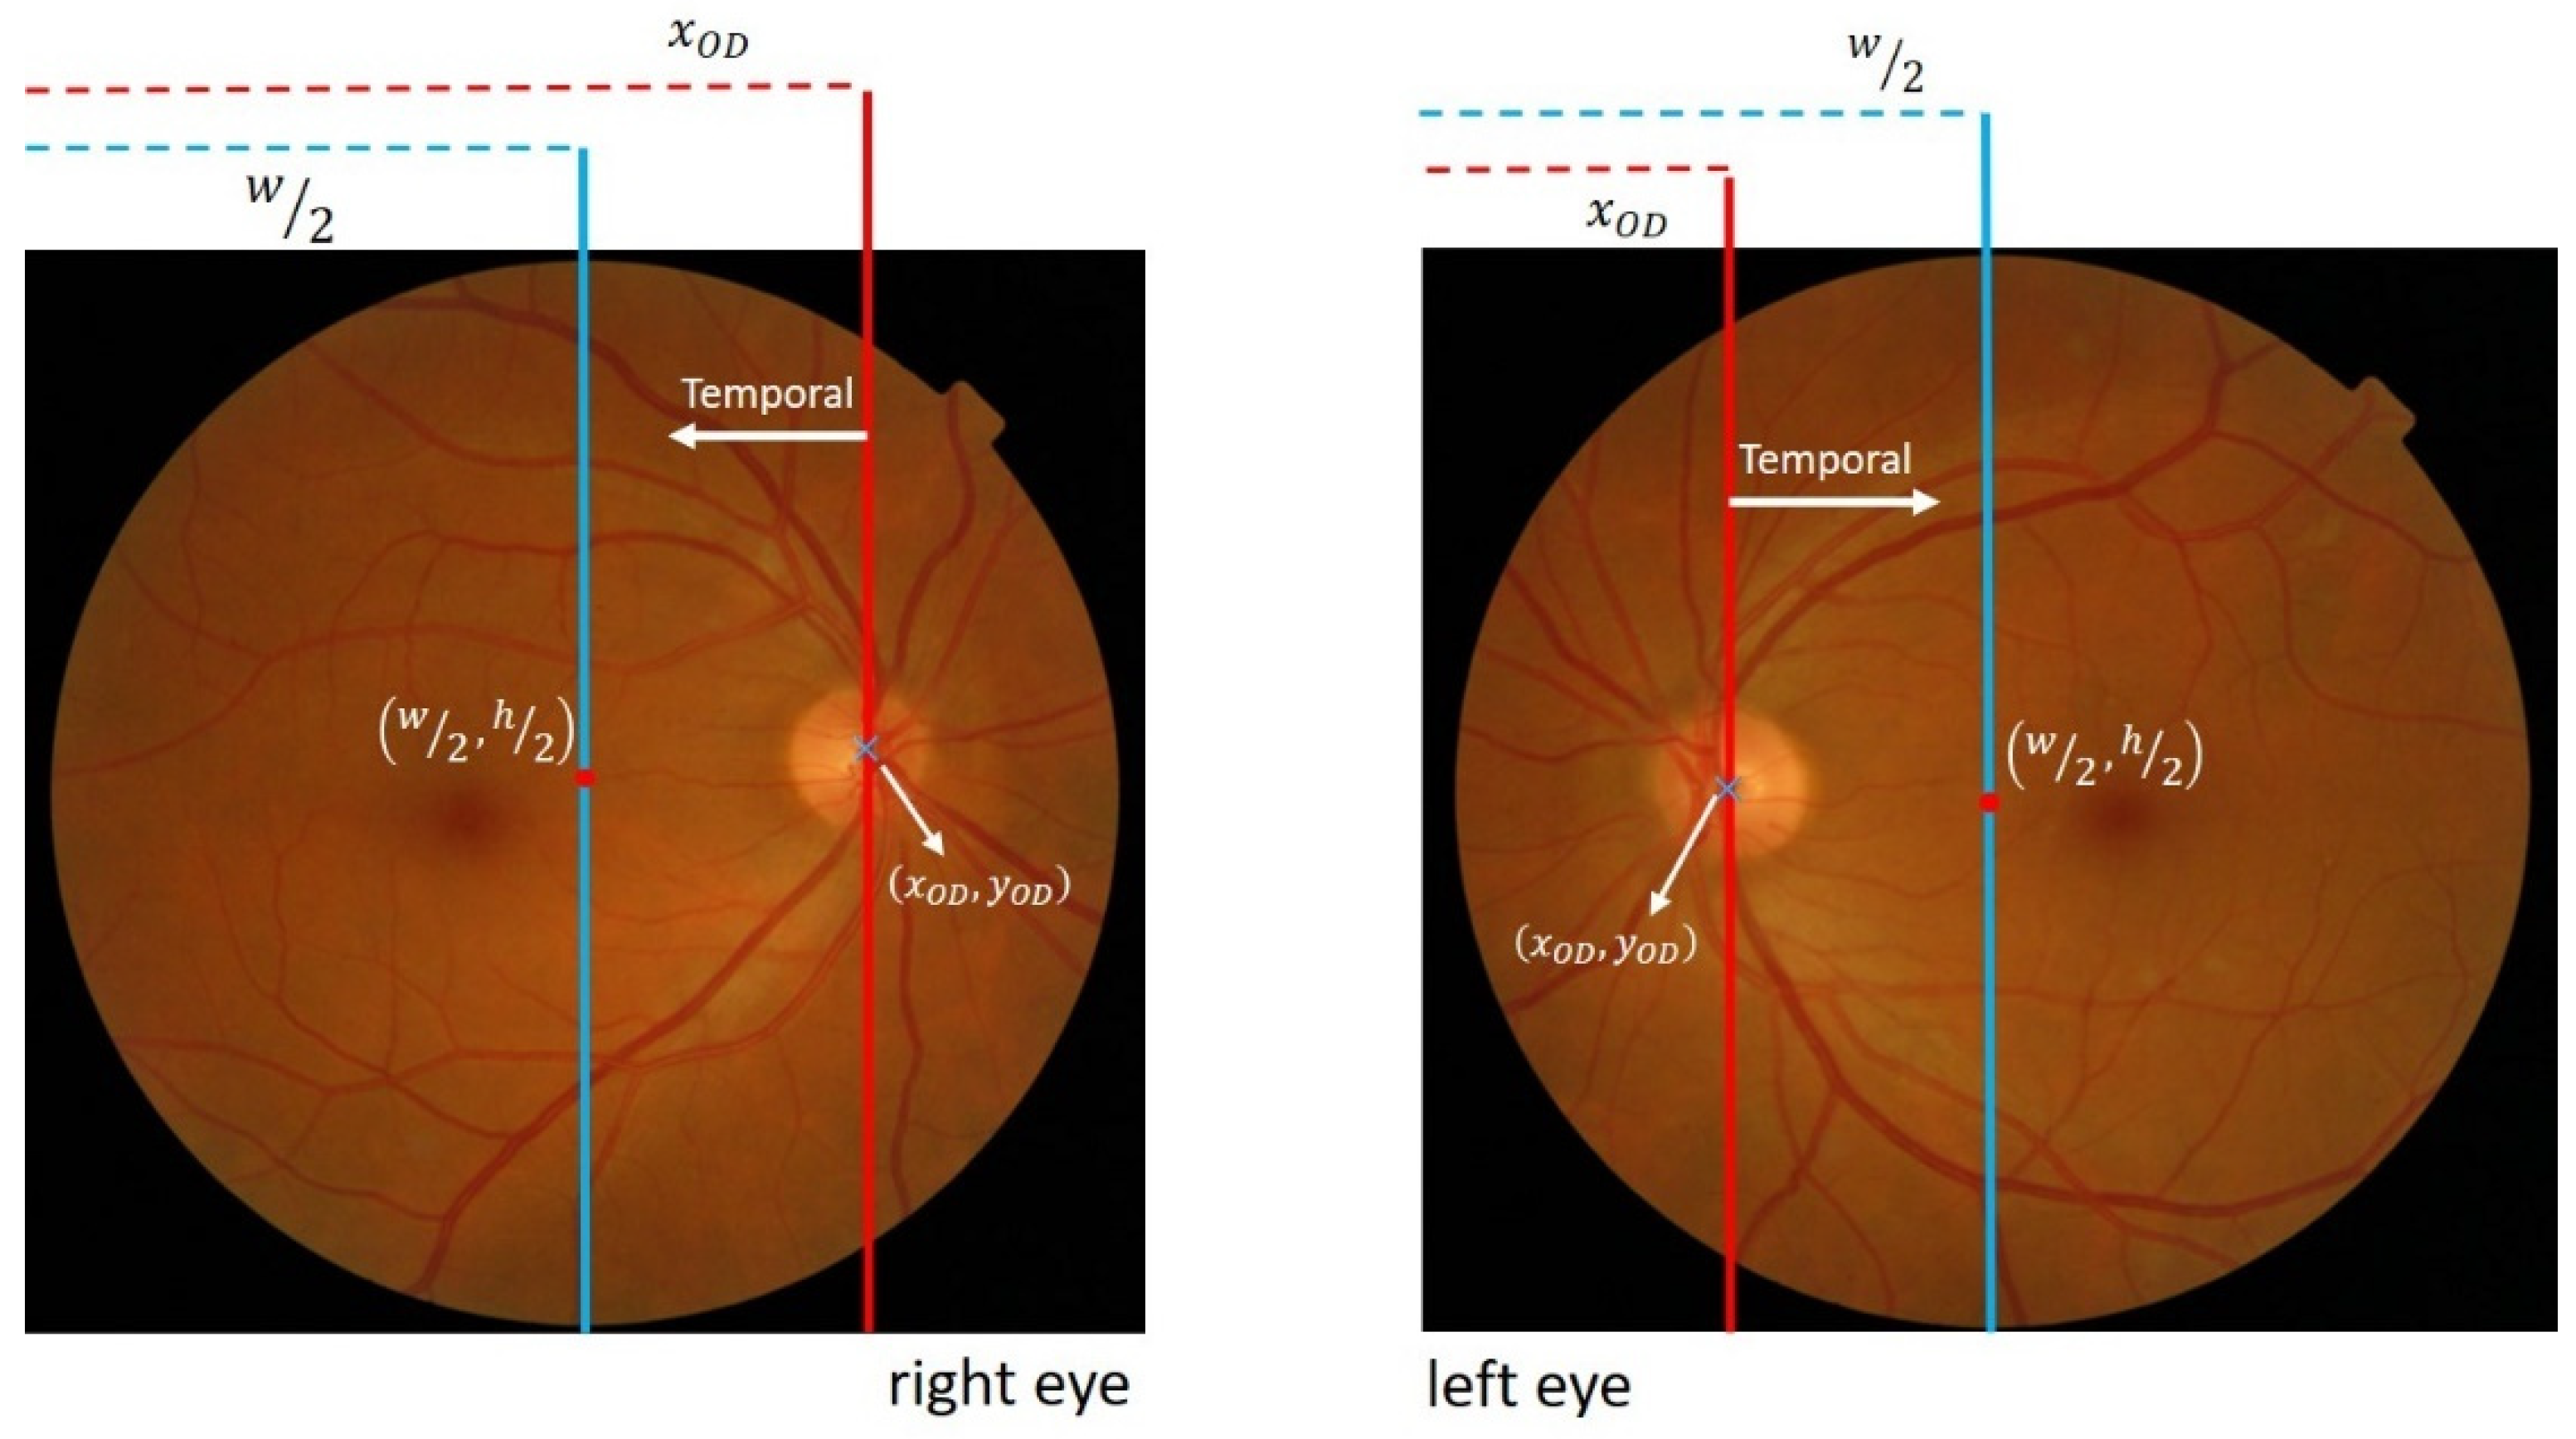
Location of the OD in the Retinal Image
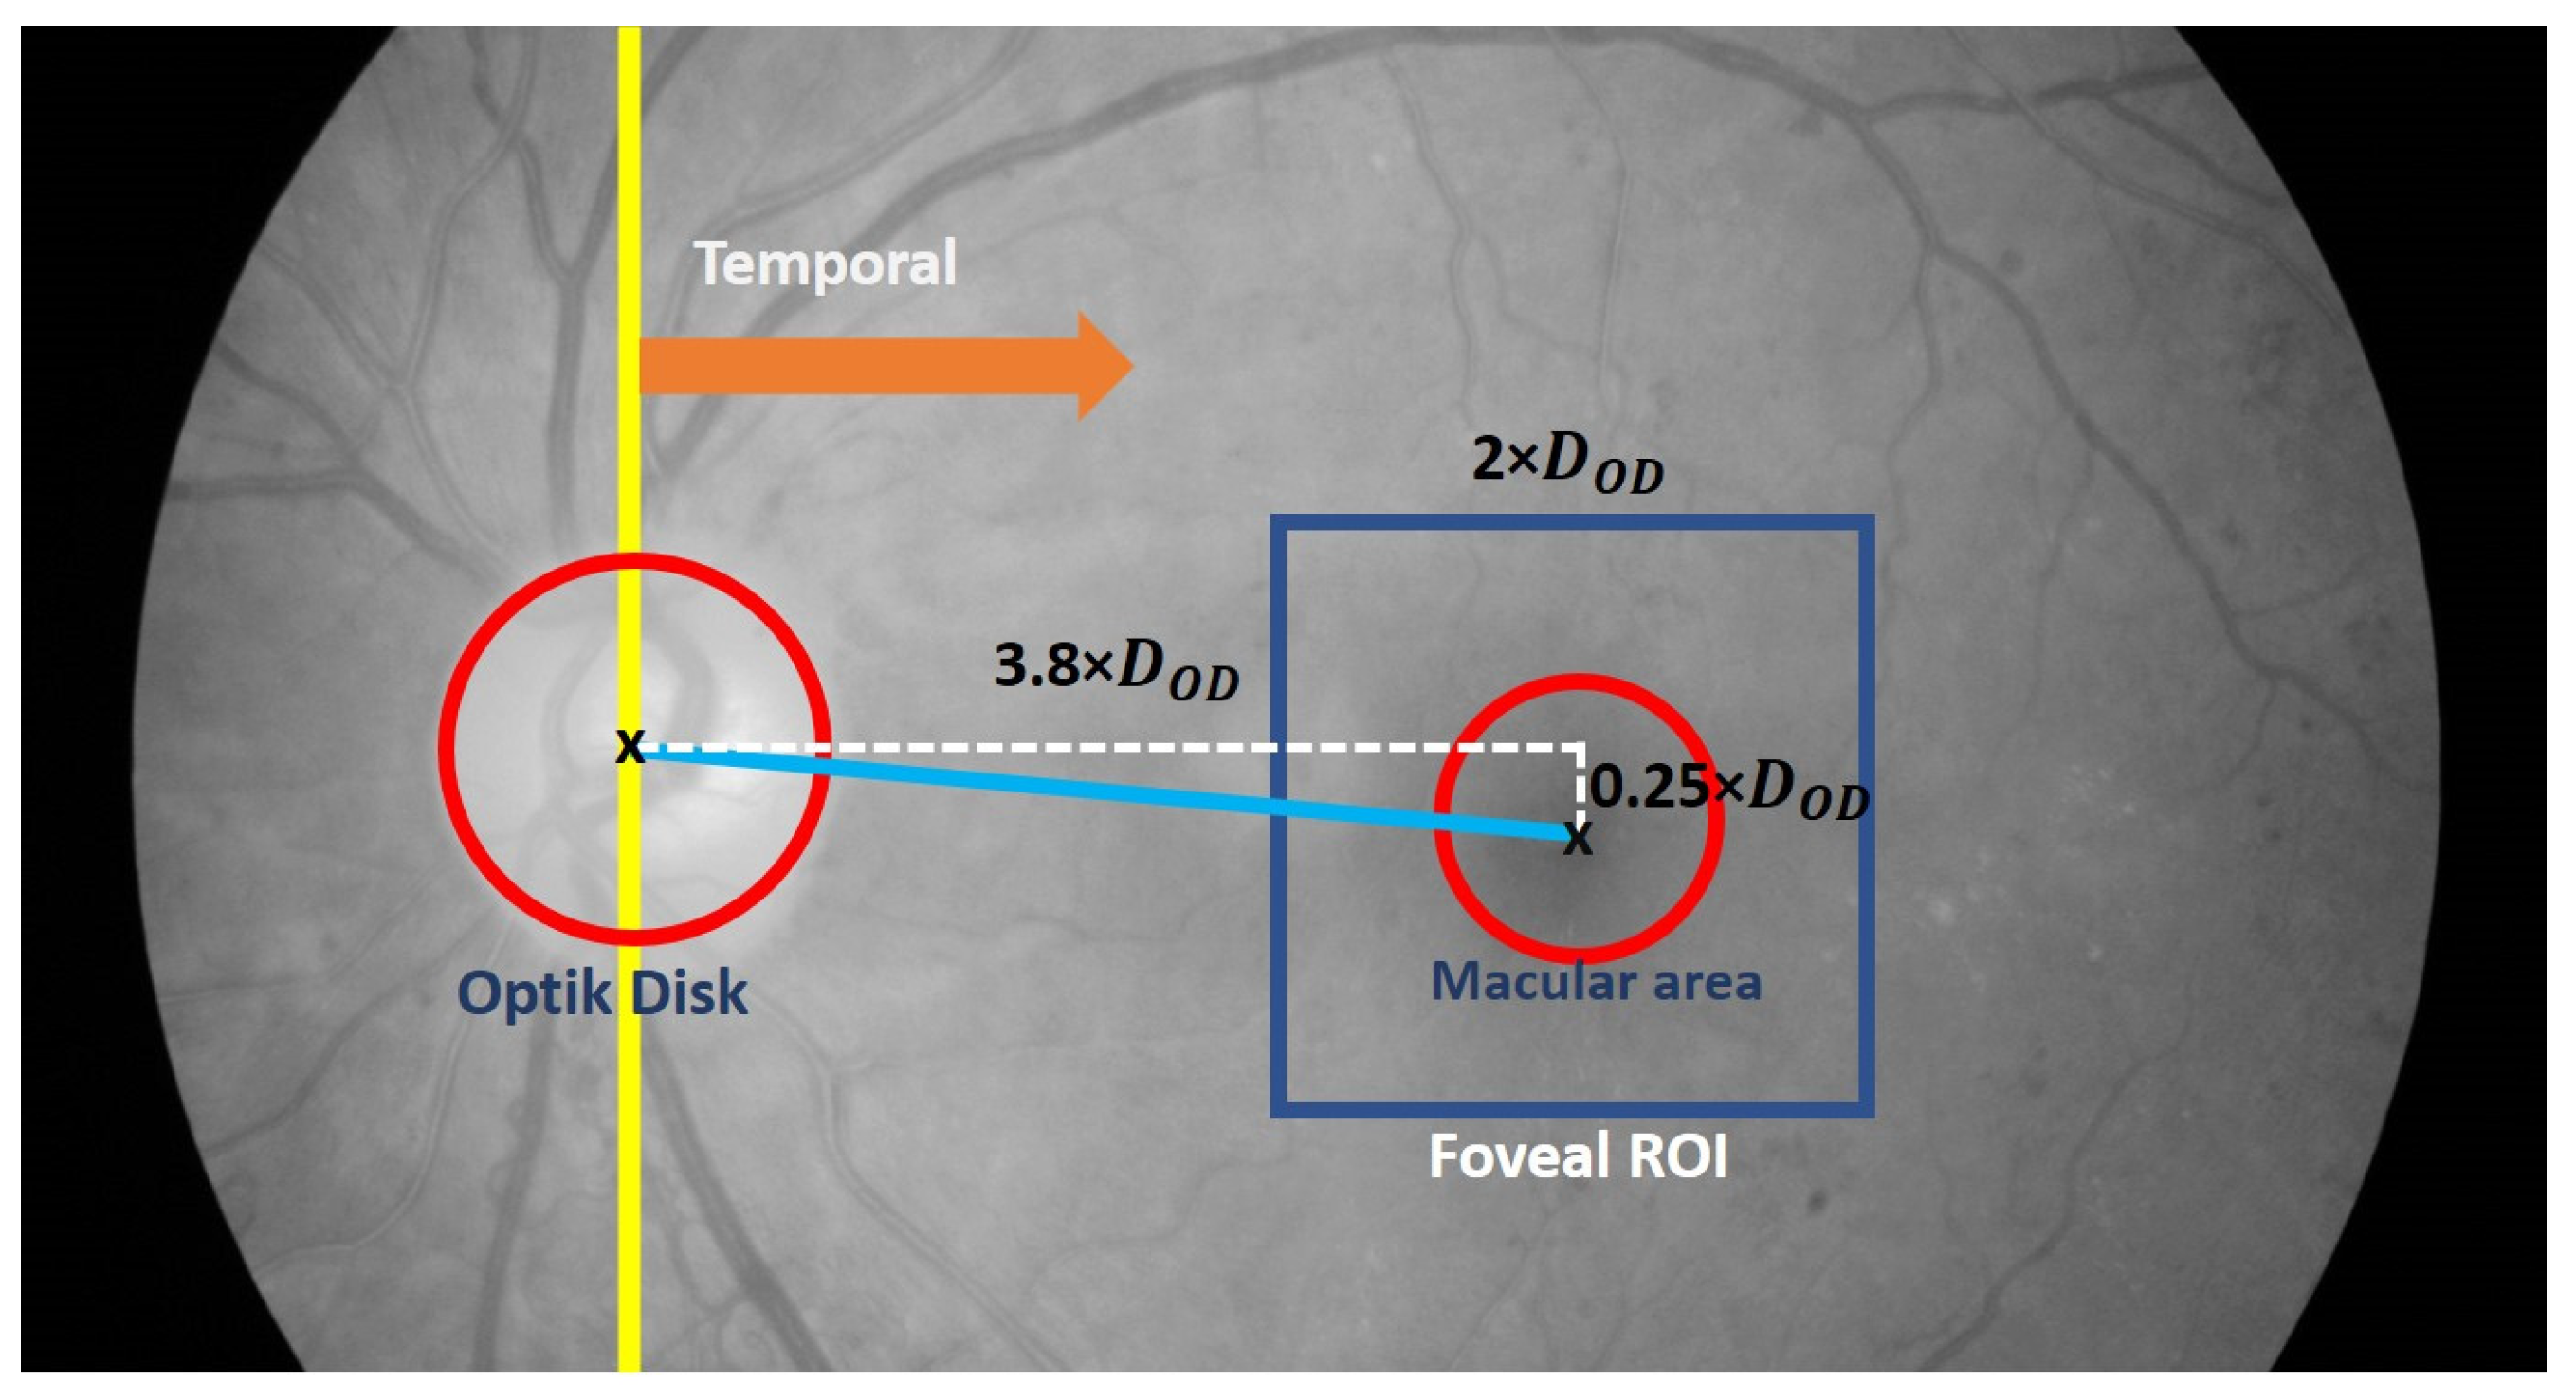
2.2.4. Fovea Detection
3. Results
4. Discussion
5. Conclusions
Author Contributions
Funding
Data Availability Statement
Conflicts of Interest
References
- Ciulla, T.A.; Amador, A.G.; Zinman, B. Diabetic Retinopathy and Diabetic Macular Edema: Pathophysiology, Screening, and Novel Therapies. Diabetes Care 2003, 26, 2653–2664. [Google Scholar] [CrossRef] [PubMed]
- Aiello, L.P.; Gardner, T.; King, G.L.; Blankenship, G.; Cavallerano, J.D.; Ferris, L.F.; Klein, R. Diabetic Retinopathy. Medicine 2015, 43, 13–19. [Google Scholar]
- Kiire, C.A.; Porta, M.; Chong, V. Medical Management for The Prevention and Treatment of Diabetic Macular Edema. Surv. Ophthalmol. 2013, 58, 459–465. [Google Scholar] [CrossRef] [PubMed]
- Medhi, J.P.; Dandapat, S. Analysis of Maculopathy in Color Fundus Images. In Proceedings of the 2014 Annual IEEE India Conference (INDICON), Pune, India, 11–13 December 2014; IEEE: Piscataway, NJ, USA, 2014; pp. 1–4. [Google Scholar]
- Ilyasova, N.; Demin, N.; Andriyanov, N. Development of a Computer System for Automatically Generating a Laser Photocoagulation Plan to Improve the Retinal Coagulation Quality in the Treatment of Diabetic Retinopathy. Symmetry 2023, 15, 287. [Google Scholar] [CrossRef]
- Al-Bander, B.; Al-Nuaimy, W.; Williams, B.M.; Zheng, Y. Multiscale sequential convolutional neural networks for simultaneous detection of fovea and optic disc. Biomed. Signal Process. Control 2018, 40, 91–101. [Google Scholar] [CrossRef]
- Wu, J.; Wang, J.; Xu, J.; Wang, Y.; Wang, K.; Shang, Z.; Ding, D.; Li, X.; Yang, G.; Jin, X.; et al. Fovea Localization in Fundus Photographs by Faster R-CNN with Physiological Prior. In Proceedings of the Ophthalmic Medical Image Analysis, Shenzhen, China, 17 October 2019; Fu, H., Garvin, M.K., MacGillivray, T., Xu, Y., Zheng, Y., Eds.; Springer International Publishing: Cham, Switzerland, 2019; pp. 156–164. [Google Scholar]
- Hasan, M.K.; Alam, M.A.; Elahi, M.T.E.; Roy, S.; Martí, R. DRNet: Segmentation and localization of optic disc and Fovea from diabetic retinopathy image. Artif. Intell. Med. 2021, 111, 102001. [Google Scholar] [CrossRef] [PubMed]
- Song, S.; Dang, K.; Yu, Q.; Wang, Z.; Coenen, F.; Su, J.; Ding, X. Bilateral-ViT For Robust Fovea Localization. In Proceedings of the 2022 IEEE 19th International Symposium on Biomedical Imaging, Kolkata, India, 28–31 March 2022. [Google Scholar]
- He, H.; Lin, L.; Cai, Z.; Tang, X. JOINED: Prior Guided Multi-task Learning for Joint Optic Disc/Cup Segmentation and Fovea Detection. arXiv 2022, arXiv:2203.00461. Available online: http://arxiv.org/abs/2203.00461 (accessed on 23 May 2023).
- Zheng, B.; Shen, Y.; Luo, Y.; Fang, X.; Zhu, S.; Zhang, J.; Wu, M.; Jin, L.; Yang, W.; Wang, C. Automated measurement of the disc-fovea angle based on DeepLabv3+. Front. Neurol. 2022, 13, 949805. [Google Scholar] [CrossRef]
- Mamoshina, P.; Vieira, A.; Putin, E.; Zhavoronkov, A. Applications of Deep Learning in Biomedicine. Mol. Pharm. 2016, 13, 1445–1454. [Google Scholar] [CrossRef]
- Royer, C.; Sublime, J.; Rossant, F.; Paques, M. Unsupervised approaches for the segmentation of dry armd lesions in eye fundus cslo images. J. Imaging 2021, 7, 143. [Google Scholar] [CrossRef]
- Lakshminarayanan, V.; Kheradfallah, H.; Sarkar, A.; Balaji, J.J. Automated detection and diagnosis of diabetic retinopathy: A comprehensive survey. J. Imaging 2021, 7, 165. [Google Scholar] [CrossRef] [PubMed]
- Camara, J.; Neto, A.; Pires, I.M.; Villasana, M.V.; Zdravevski, E.; Cunha, A. Literature Review on Artificial Intelligence Methods for Glaucoma Screening, Segmentation, and Classification. J. Imaging 2022, 8, 19. [Google Scholar] [CrossRef] [PubMed]
- Syed, A.M.; Akram, M.U.; Akram, T.; Muzammal, M. Fundus Images-Based Detection and Grading of Macular Edema Using Robust Macula Localization. IEEE Access 2018, 6, 58784–58793. [Google Scholar] [CrossRef]
- Maqsood, S.; Damasevicius, R. Detection of Macula and Recognition of Aged-Related Macular Degeneration in Retinal Fundus Images. Comput. Inform. 2021, 40, 957–987. [Google Scholar] [CrossRef]
- Fleming, A.D.; Goatman, K.A.; Philip, S.; Olson, J.A.; Sharp, P.F. Automatic Detection of Retinal Anatomy to Assist Diabetic Retinopathy Screening. Phys. Med. Biol. 2007, 52, 331–345. [Google Scholar] [CrossRef]
- Chalakkal, R.J.; Abdulla, W.H.; Thulaseedharan, S.S. Automatic Detection and Segmentation of Optic Disc and Fovea in Retinal Images. IET Image Process. 2018, 12, 2100–2110. [Google Scholar] [CrossRef]
- Zheng, S.; Pan, L.; Chen, J.; Yu, L. Automatic and Efficient Detection of The Fovea Center in Retinal Images. In Proceedings of the Proceedings—2014 7th International Conference on BioMedical Engineering and Informatics, BMEI 2014, Dalian, China, 14–16 October 2014; pp. 145–150. [Google Scholar]
- Kim, G.Y.; Lee, S.H.; Kim, S.M. Automated segmentation and quantitative analysis of optic disc and fovea in fundus images. Multimed. Tools Appl. 2021, 80, 24205–24220. [Google Scholar] [CrossRef]
- Medhi, J.P.; Dandapat, S. An Effective Fovea Detection and Automatic Assessment of Diabetic Maculopathy in Color Fundus Images. Comput. Biol. Med. 2016, 74, 30–44. [Google Scholar] [CrossRef]
- Khalid, S.; Akram, M.U.; Shehryar, T.; Ahmed, W.; Sadiq, M.; Manzoor, M.; Nosheen, N. Automated diagnosis system for age-related macular degeneration using hybrid features set from fundus images. Int. J. Imaging Syst. Technol. 2021, 31, 236–252. [Google Scholar] [CrossRef]
- Romero-Oraá, R.; García, M.; Oraá-Pérez, J.; López, M.I.; Hornero, R. A robust method for the automatic location of the optic disc and the fovea in fundus images. Comput. Methods Programs Biomed. 2020, 196, 105599. [Google Scholar] [CrossRef]
- Staal, J.; Abràmoff, M.D.; Niemeijer, M.; Viergever, M.A.; Ginneken, B. Van Ridge-Based Vessel Segmentation in Color Images of the Retina. IEEE Trans. Med. Imaging 2004, 23, 501–509. [Google Scholar] [CrossRef] [PubMed]
- Kauppi, T.; Kalesnykiene, V.; Kamarainen, J.-K.; Lensu, L.; Sorri, I.; Raninen, A.; Voutilainen, R.; Uusitalo, H.; Kälviäinen, H.; Pietilä, J. The DIARETDB1 Diabetic Retinopathy Database and Evaluation Protocol. In Proceedings of the British Machine Vision Conference 2007, Warwickshire, UK, 10–13 September 2007. [Google Scholar]
- Decencière, E.; Zhang, X.; Cazuguel, G.; Laÿ, B.; Trone, C.; Gain, P.; Massin, P.; Erginay, A.; Decencière, E.; Zhang, X.; et al. Feedback on A Publicly Distributed Image Database: The Messidor Database. Image Anal. Stereol. Int. Soc. Stereol. 2014, 33, 231–234. [Google Scholar] [CrossRef]
- Kamble, R.; Kokare, M.; Deshmukh, G.; Azmadi, F. Localization of Optic Disc and Fovea in Retinal Images using Intensity Based Line Scanning Analysis. Comput. Biol. Med. 2017, 87, 382–396. [Google Scholar] [CrossRef] [PubMed]
- Aquino, A. Establishing The Macular Grading Grid by Means of Fovea Centre Detection using Anatomical-Based and Visual-Based Features. Comput. Biol. Med. 2014, 55, 61–73. [Google Scholar] [CrossRef] [PubMed]
- Chin, K.S.; Trucco, E.; Tan, L.; Wilson, P.J. Automatic fovea location in retinal images using anatomical priors and vessel density. Pattern Recognit. Lett. 2013, 34, 1152–1158. [Google Scholar] [CrossRef]
- Ünver, H.M.; Kökver, Y.; Duman, E.; Erdem, O.A. Statistical edge detection and circular hough transform for Optic disk localization. Appl. Sci. 2019, 9, 350. [Google Scholar] [CrossRef]
- Wibawa, H.A.; Harjoko, A.; Sumiharto, R.; Sasongko, M.B. Efficient and Robust Method to Detect the Location of Macular Center Based on Optimal Temporal Determination. J. Imaging 2022, 8, 313. [Google Scholar] [CrossRef]
- Welfer, D.; Scharcanski, J.; Marinho, D.R. Fovea Center Detection Based on The Retina Anatomy and Mathematical Morphology. Comput. Methods Programs Biomed. 2011, 104, 397–409. [Google Scholar] [CrossRef]
- Septiarini, A.; Harjoko, A.; Pulungan, R.; Ekantini, R. Optic Disc and Cup Segmentation by Automatic Thresholding with Morphological Operation for Glaucoma Evaluation. Signal Image Video Process. 2017, 11, 945–952. [Google Scholar] [CrossRef]
- Biswas, S.; Khan, M.I.A.; Hossain, M.T.; Biswas, A.; Nakai, T.; Rohdin, J. Which Color Channel Is Better for Diagnosing Retinal Diseases Automatically in Color Fundus Photographs? Life 2022, 12, 973. [Google Scholar] [CrossRef]
- Fleming, A.D.; Philip, S.; Goatman, K.A.; Olson, J.A.; Sharp, P.F. Automated assessment of diabetic retinal image quality based on clarity and field definition. Investig. Ophthalmol. Vis. Sci. 2006, 47, 1120–1125. [Google Scholar] [CrossRef] [PubMed]
- Facey, K.; Cummins, E.; Macpherson, K.; Morris, A.; Reay, L.; Slattery, J. Organisation of Services for Diabetic Retinopathy Screening. Health Technology Assessment Report 1; Health Technology Board for Scotland: Edinburgh, UK; Glasgow, UK, 2002; ISBN 1903961122. [Google Scholar]
- Kolb, H.; Nelson, R.F.; Ahnelt, P.K.; Ortuño-Lizarán, I.; Cuenca, N. The Architecture of the Human Fovea. In Webvision: The Organization of the Retina and Visual System; Kolb, H., Fernandez, E., Nelson, R., Eds.; University of Utah Health Sciences Center: Salt Lake City, UT, USA, 1995. Available online: https://www.ncbi.nlm.nih.gov/books/NBK554706/ (accessed on 20 June 2023).
- Gegundez-Arias, M.E.; Marin, D.; Bravo, J.M.; Suero, A. Locating the fovea center position in digital fundus images using thresholding and feature extraction techniques. Comput. Med. Imaging Graph. 2013, 37, 386–393. [Google Scholar] [CrossRef] [PubMed]


| Method | DRIVE (%) | DiaretDB1 (%) | Messidor (%) |
|---|---|---|---|
| T1 | 100 | 100 | 98.66 |
| T2 | 100 | 100 | 99.29 |
| T3 | 100 | 100 | 100 |
| Temporal Determination Method | Accuracy (%) | Distance | Computational Time (s/Image) |
|---|---|---|---|
| DRIVE | |||
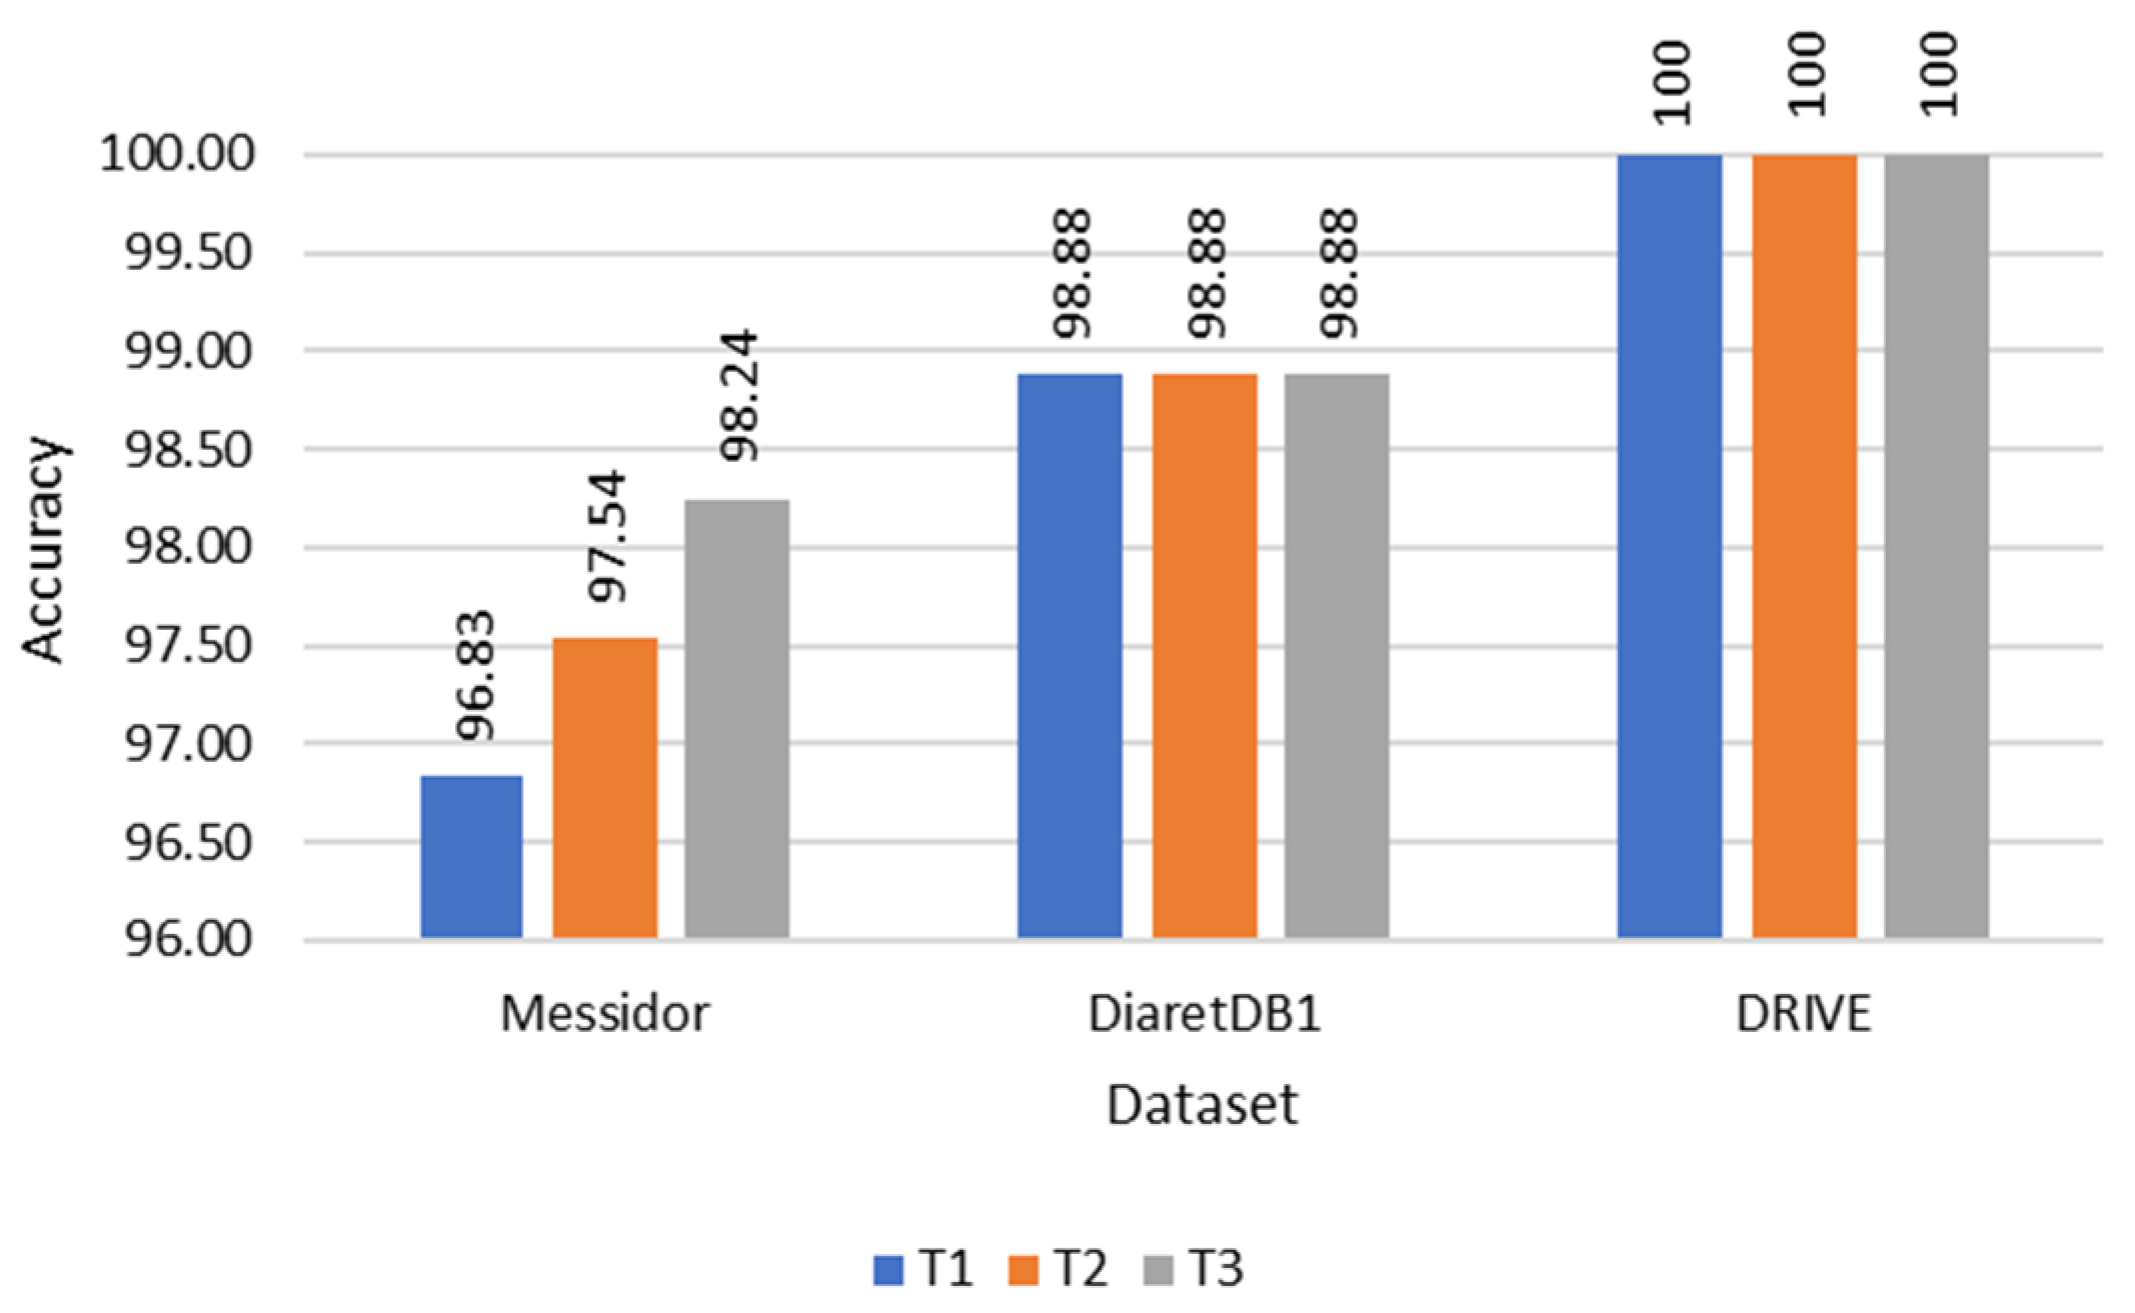
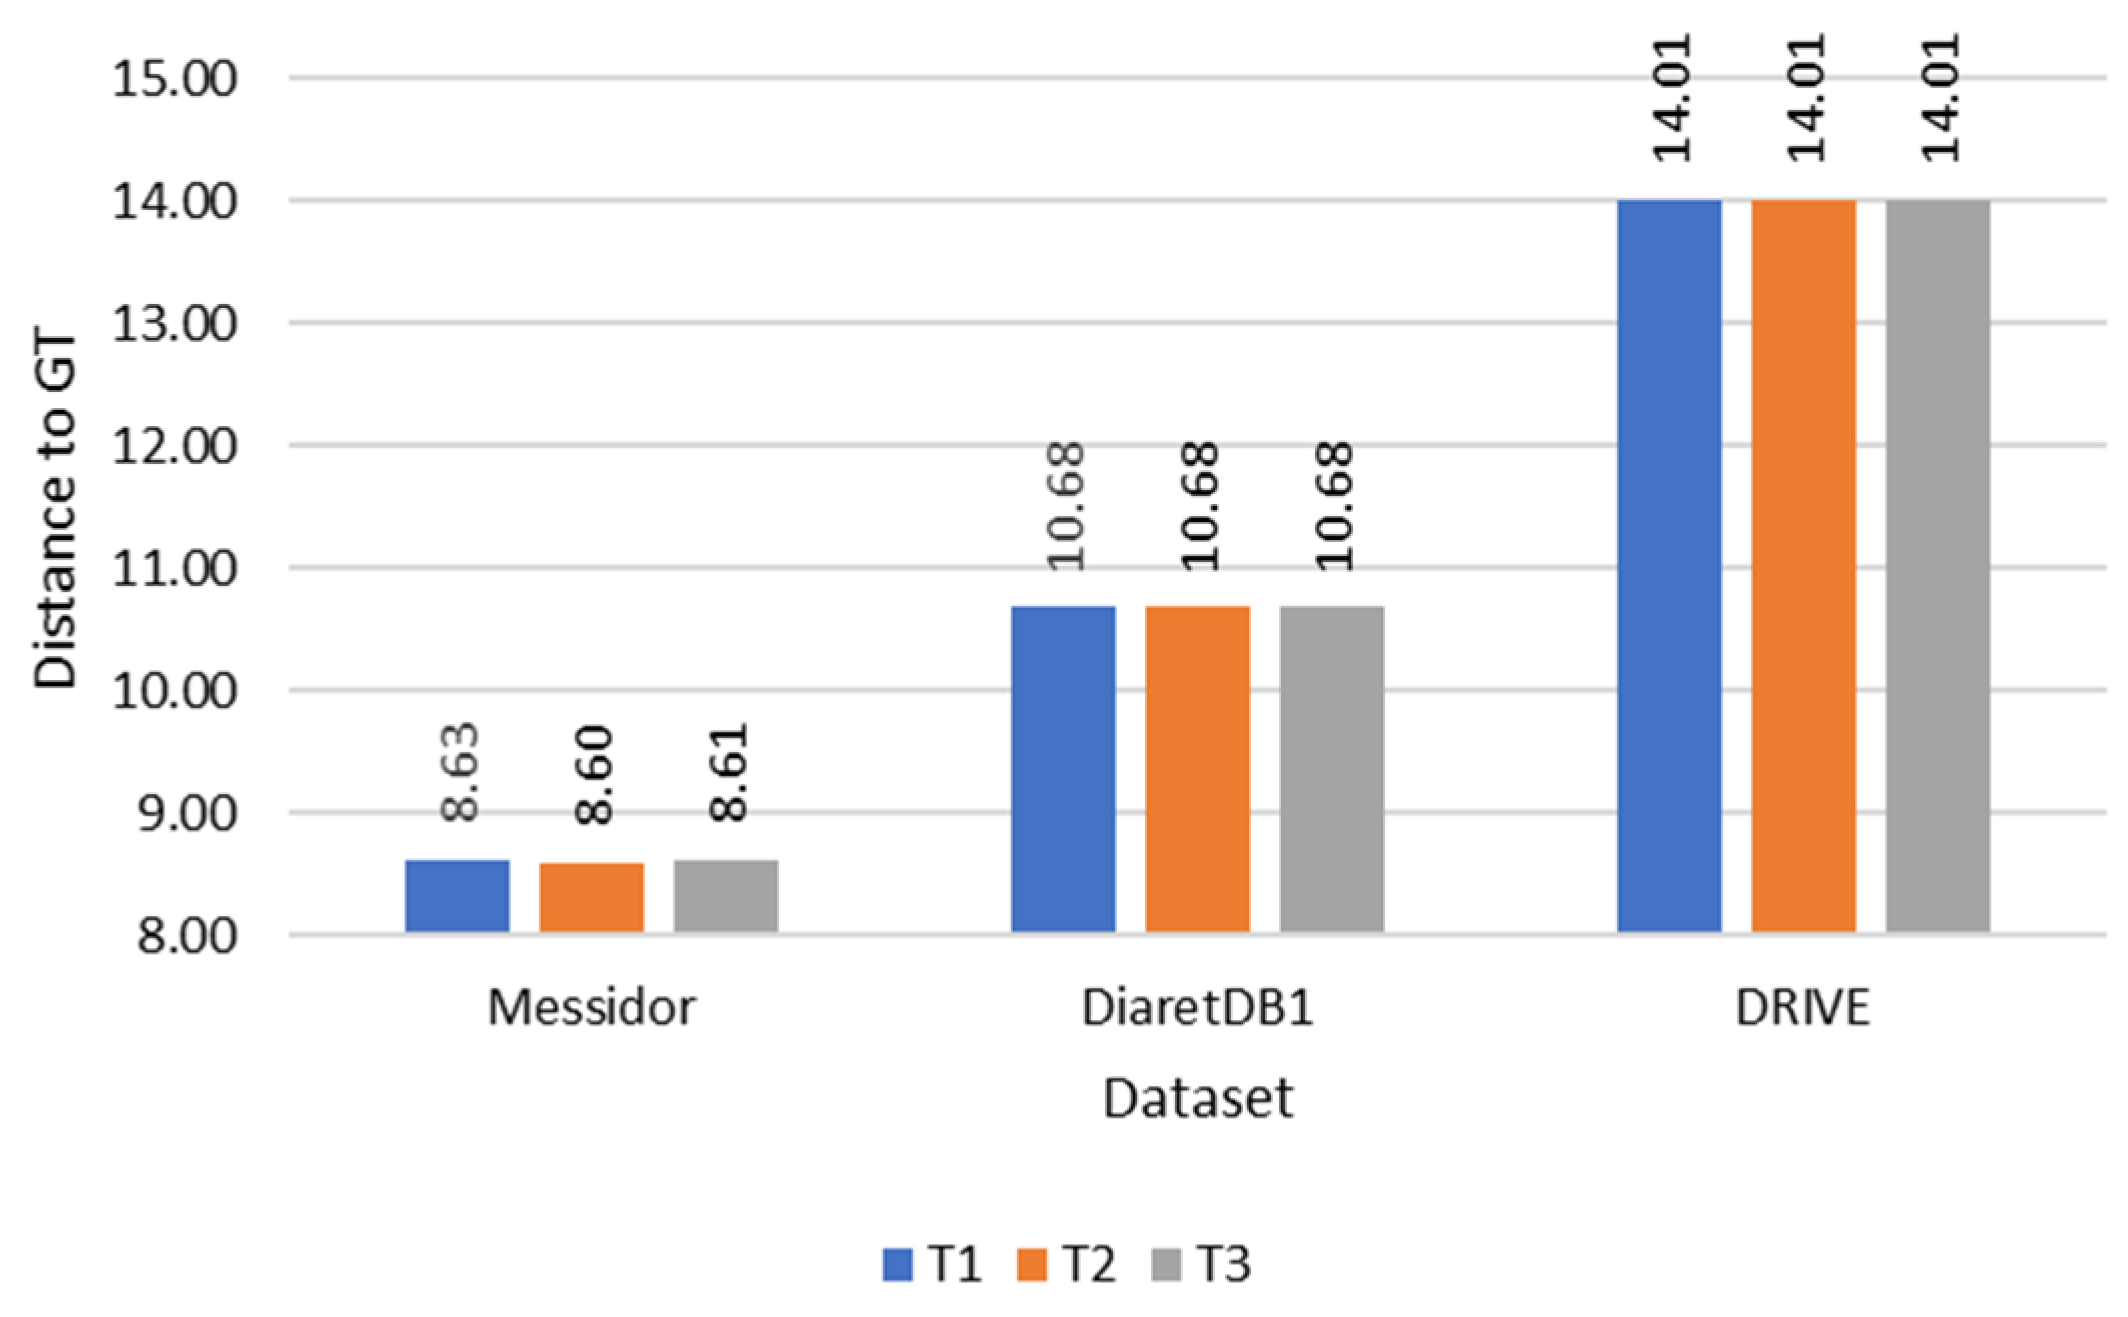
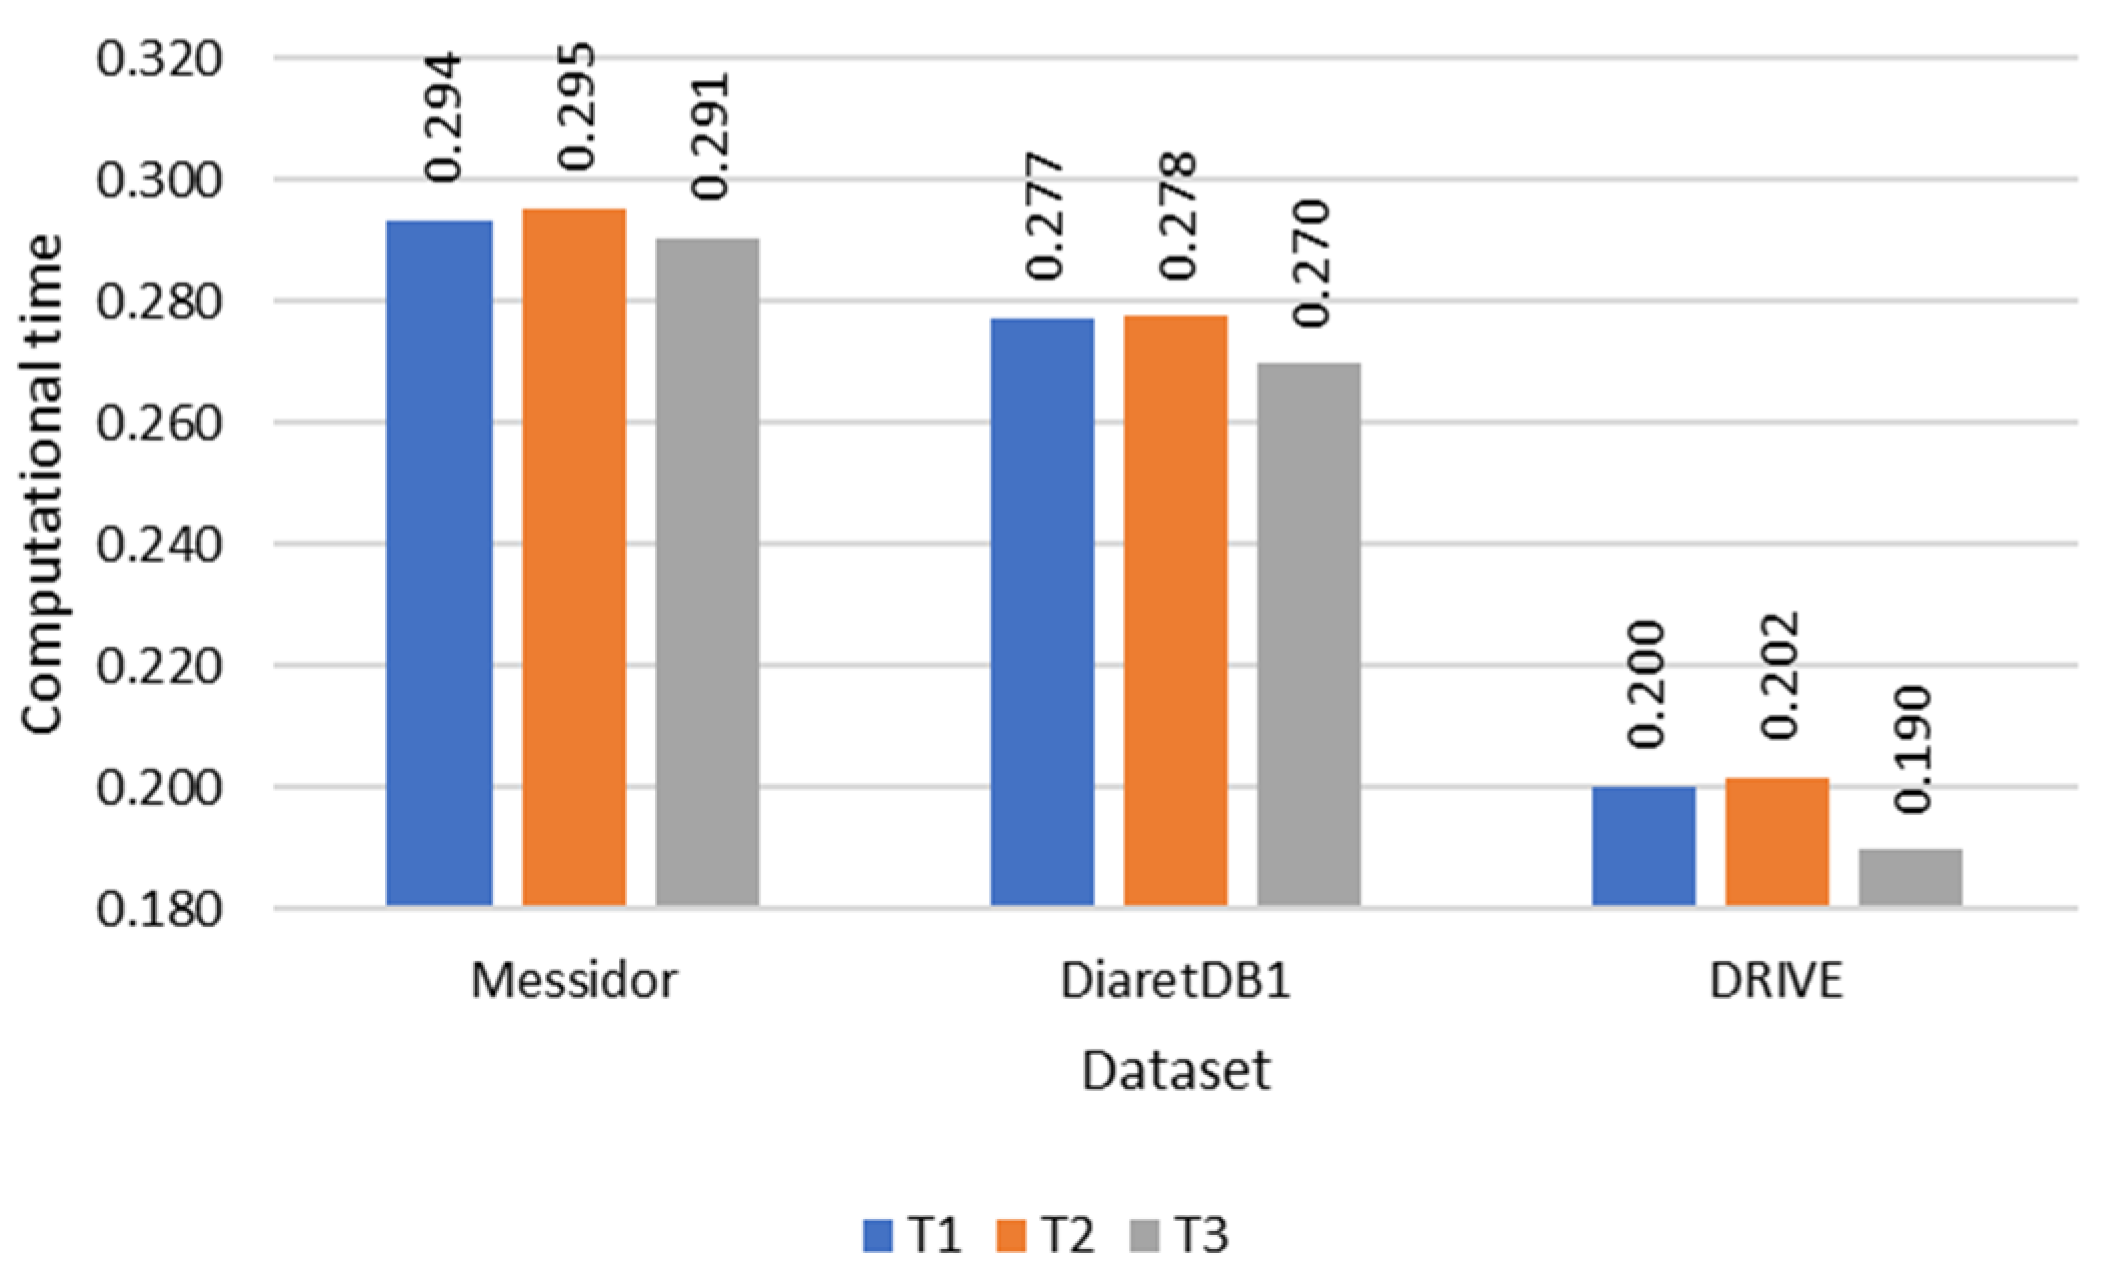
| T1 | 100 | 14.1 | 0.200 |
| T2 | 100 | 14.1 | 0.202 |
| T3 | 100 | 14.1 | 0.190 |
| DiaretDB1 | |||
| T1 | 98.88 | 10.68 | 0.277 |
| T2 | 98.88 | 10.68 | 0.278 |
| T3 | 98.88 | 10.68 | 0.270 |
| Messidor | |||
| T1 | 96.83 | 8.63 | 0.294 |
| T2 | 97.54 | 8.60 | 0.295 |
| T3 | 98.24 | 8.61 | 0.291 |
| Method | Accuracy | Computational Time (s/Image) | Computational Time Improvement |
|---|---|---|---|
| Zheng [20] | DRIVE: 100% | 12 s | 62.2× |
| DiaretDB1: 93.3% | 12 s | 43.4× | |
| Medhi [22] | DRIVE: 100% | - | - |
| DiaretDB1: 95.51% | |||
| Chalakkal [19] | DRIVE: 100% | 25 s | 130.6× |
| DiaretDB1: 95.5% | 25 s | 91.6× | |
| Messidor: 98.5% | 25 s | 85.2× | |
| Romero-oraá [24] | DRIVE: 100% | 0.54 s | 1.8× |
| DiaretDB1: 100% | 14.55 s | 52.8× | |
| Messidor: 99.67% | 27.04 s | 92.2× | |
| Al Bander [6] | Messidor: 96.6% | - | - |
| Song [9] | Messidor: 100% | - | - |
| Proposed method | DRIVE: 100% | 0.19 s | - |
| DiaretDB1: 98.87% | 0.27 s | - | |
| Messidor: 98.24% | 0.29 s | - |
Disclaimer/Publisher’s Note: The statements, opinions and data contained in all publications are solely those of the individual author(s) and contributor(s) and not of MDPI and/or the editor(s). MDPI and/or the editor(s) disclaim responsibility for any injury to people or property resulting from any ideas, methods, instructions or products referred to in the content. |
© 2023 by the authors. Licensee MDPI, Basel, Switzerland. This article is an open access article distributed under the terms and conditions of the Creative Commons Attribution (CC BY) license (https://creativecommons.org/licenses/by/4.0/).
Share and Cite
Wibawa, H.A.; Sumiharto, R.; Harjoko, A.; Sasongko, M.B. The Methods of Determining Temporal Direction Based on Asymmetric Information of the Optic Disc for Optimal Fovea Detection. Symmetry 2023, 15, 1631. https://doi.org/10.3390/sym15091631
Wibawa HA, Sumiharto R, Harjoko A, Sasongko MB. The Methods of Determining Temporal Direction Based on Asymmetric Information of the Optic Disc for Optimal Fovea Detection. Symmetry. 2023; 15(9):1631. https://doi.org/10.3390/sym15091631
Chicago/Turabian StyleWibawa, Helmie Arif, Raden Sumiharto, Agus Harjoko, and Muhammad Bayu Sasongko. 2023. "The Methods of Determining Temporal Direction Based on Asymmetric Information of the Optic Disc for Optimal Fovea Detection" Symmetry 15, no. 9: 1631. https://doi.org/10.3390/sym15091631
APA StyleWibawa, H. A., Sumiharto, R., Harjoko, A., & Sasongko, M. B. (2023). The Methods of Determining Temporal Direction Based on Asymmetric Information of the Optic Disc for Optimal Fovea Detection. Symmetry, 15(9), 1631. https://doi.org/10.3390/sym15091631