Analysis of Results of Digital Electroencephalography and Digital Vectors of Coronavirus Images upon Applying the Theory of Covariance Functions
Abstract
1. Introduction
2. The Theoretical Model
3. The Results of the Analysis
4. Conclusions
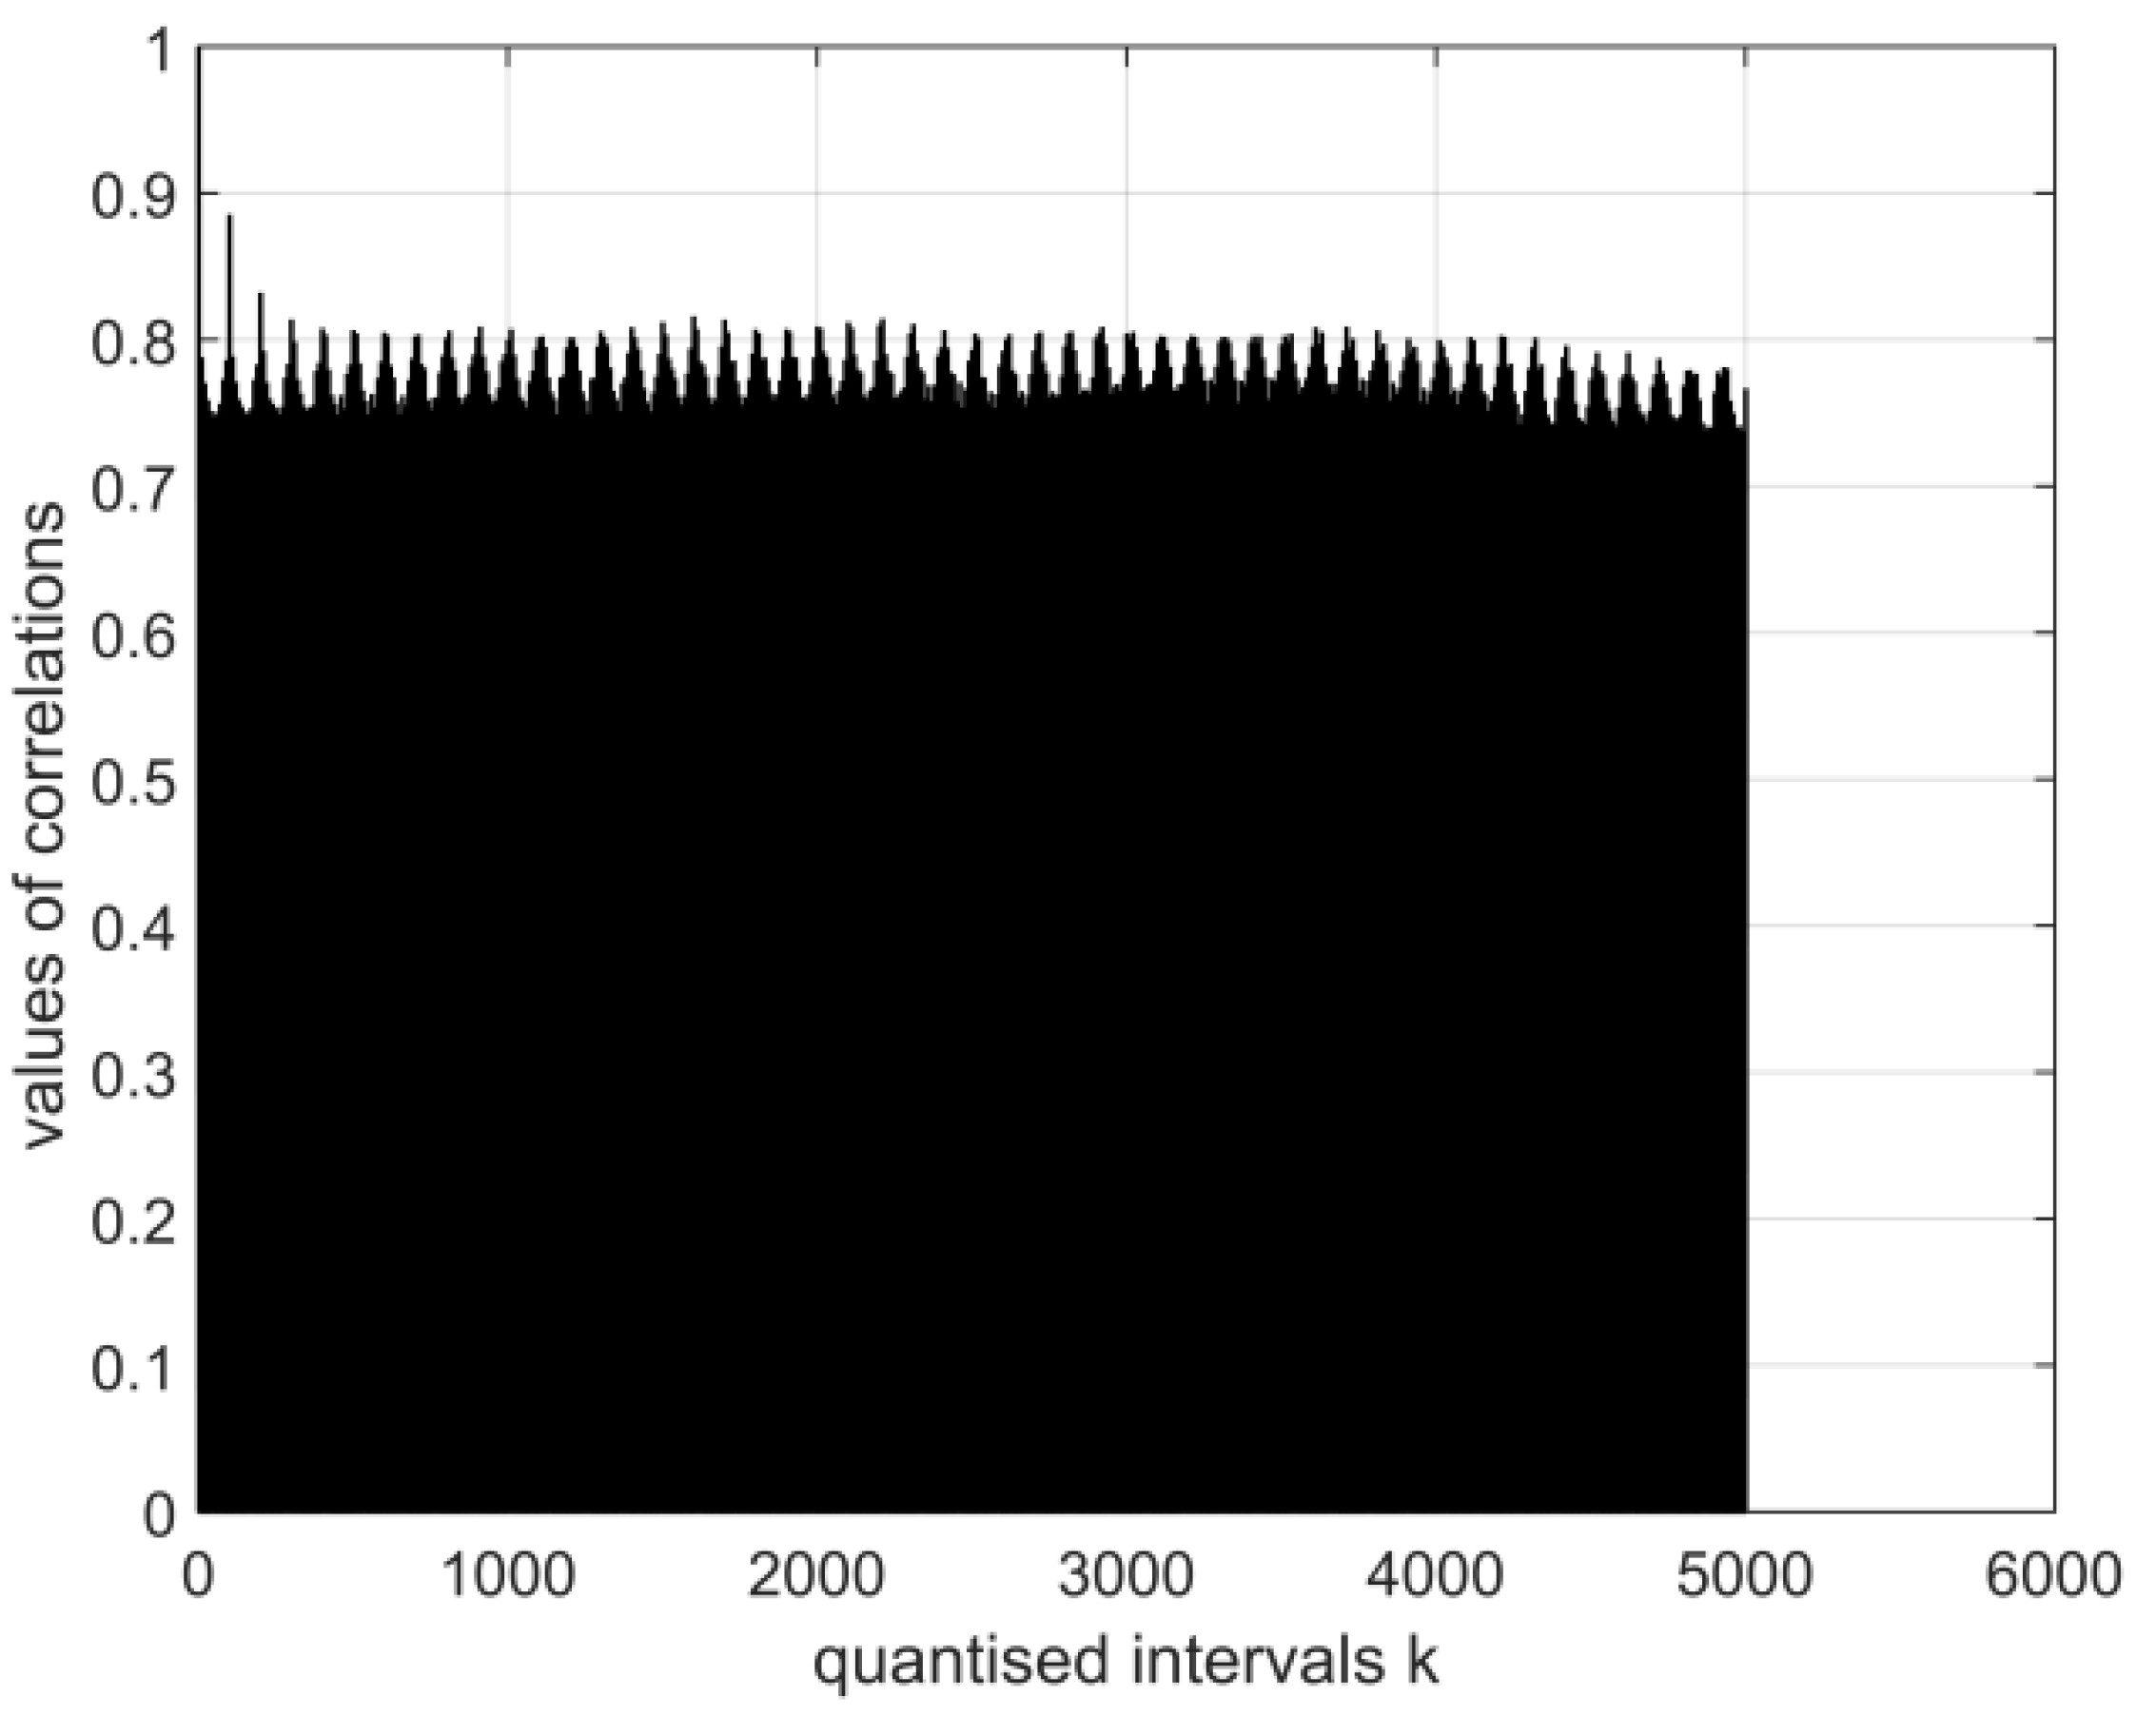
- The magnitudes of the normalised auto-covariance functions for the electroencephalography measurement results’ vectors in all quantised intervals vary in the range (1: −0.6). Their graphical expressions are asymmetric and similar. The values of the functions show the probabilistic interdependence of parameters of the relevant vectors.
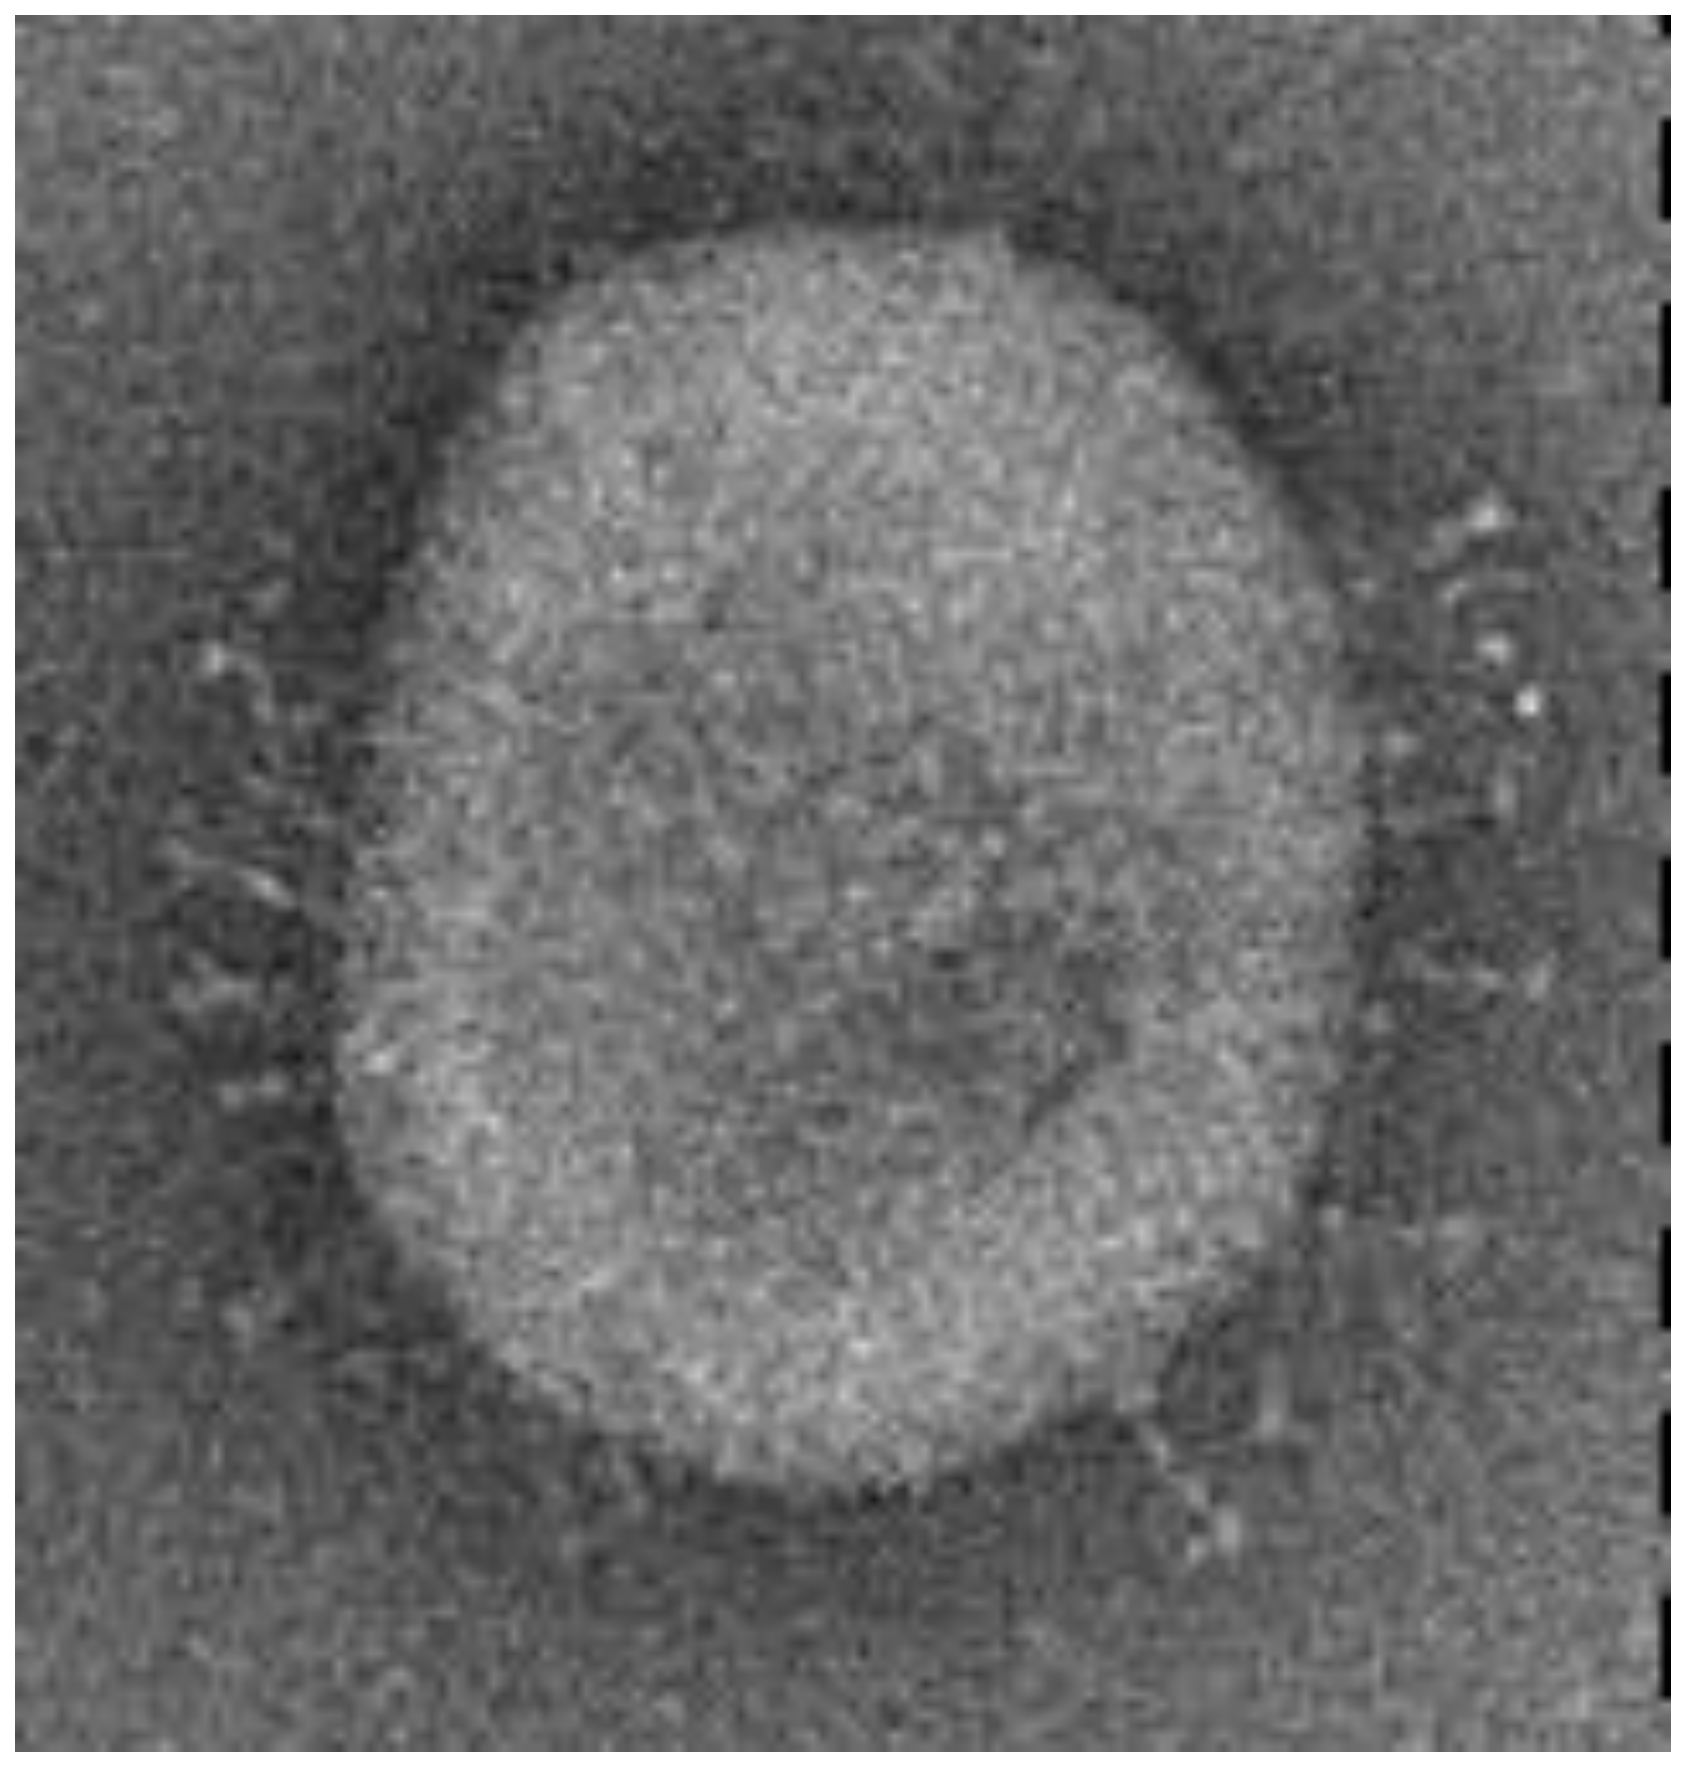
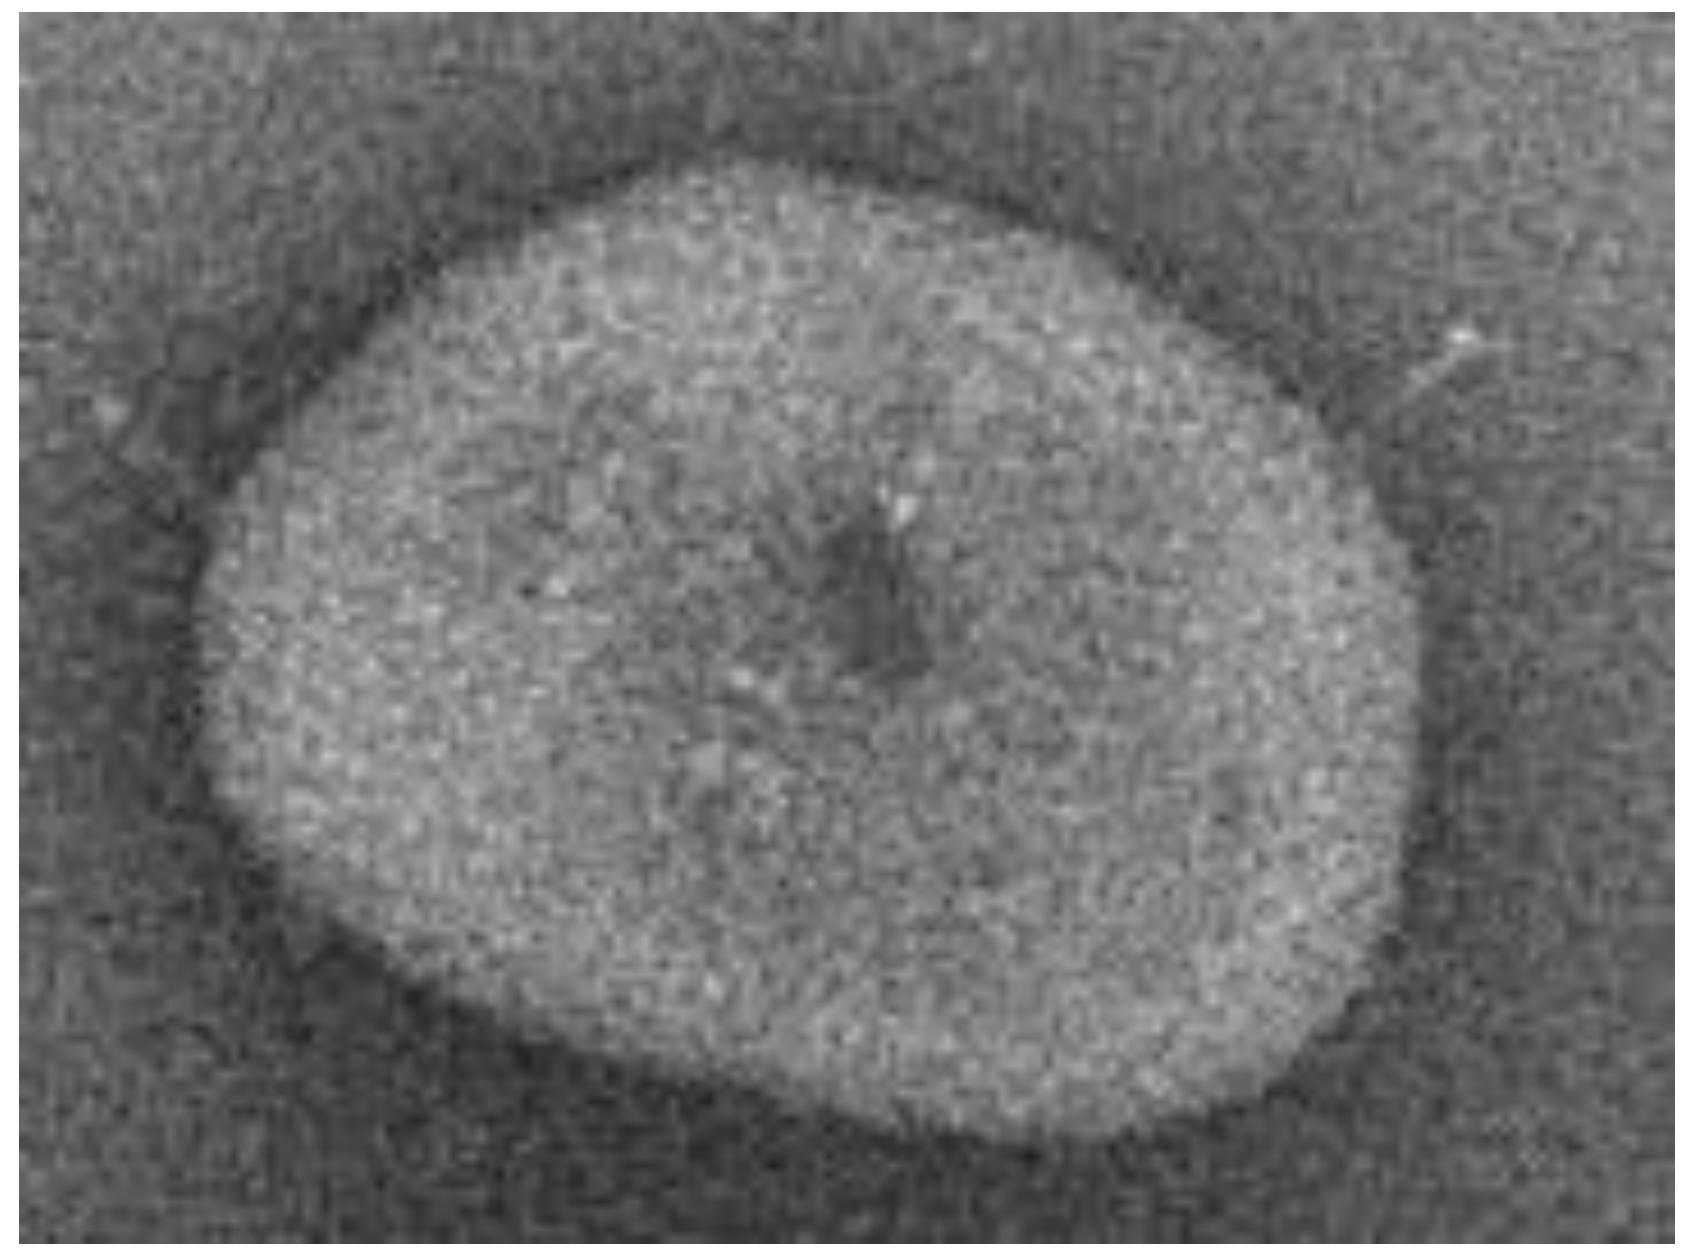
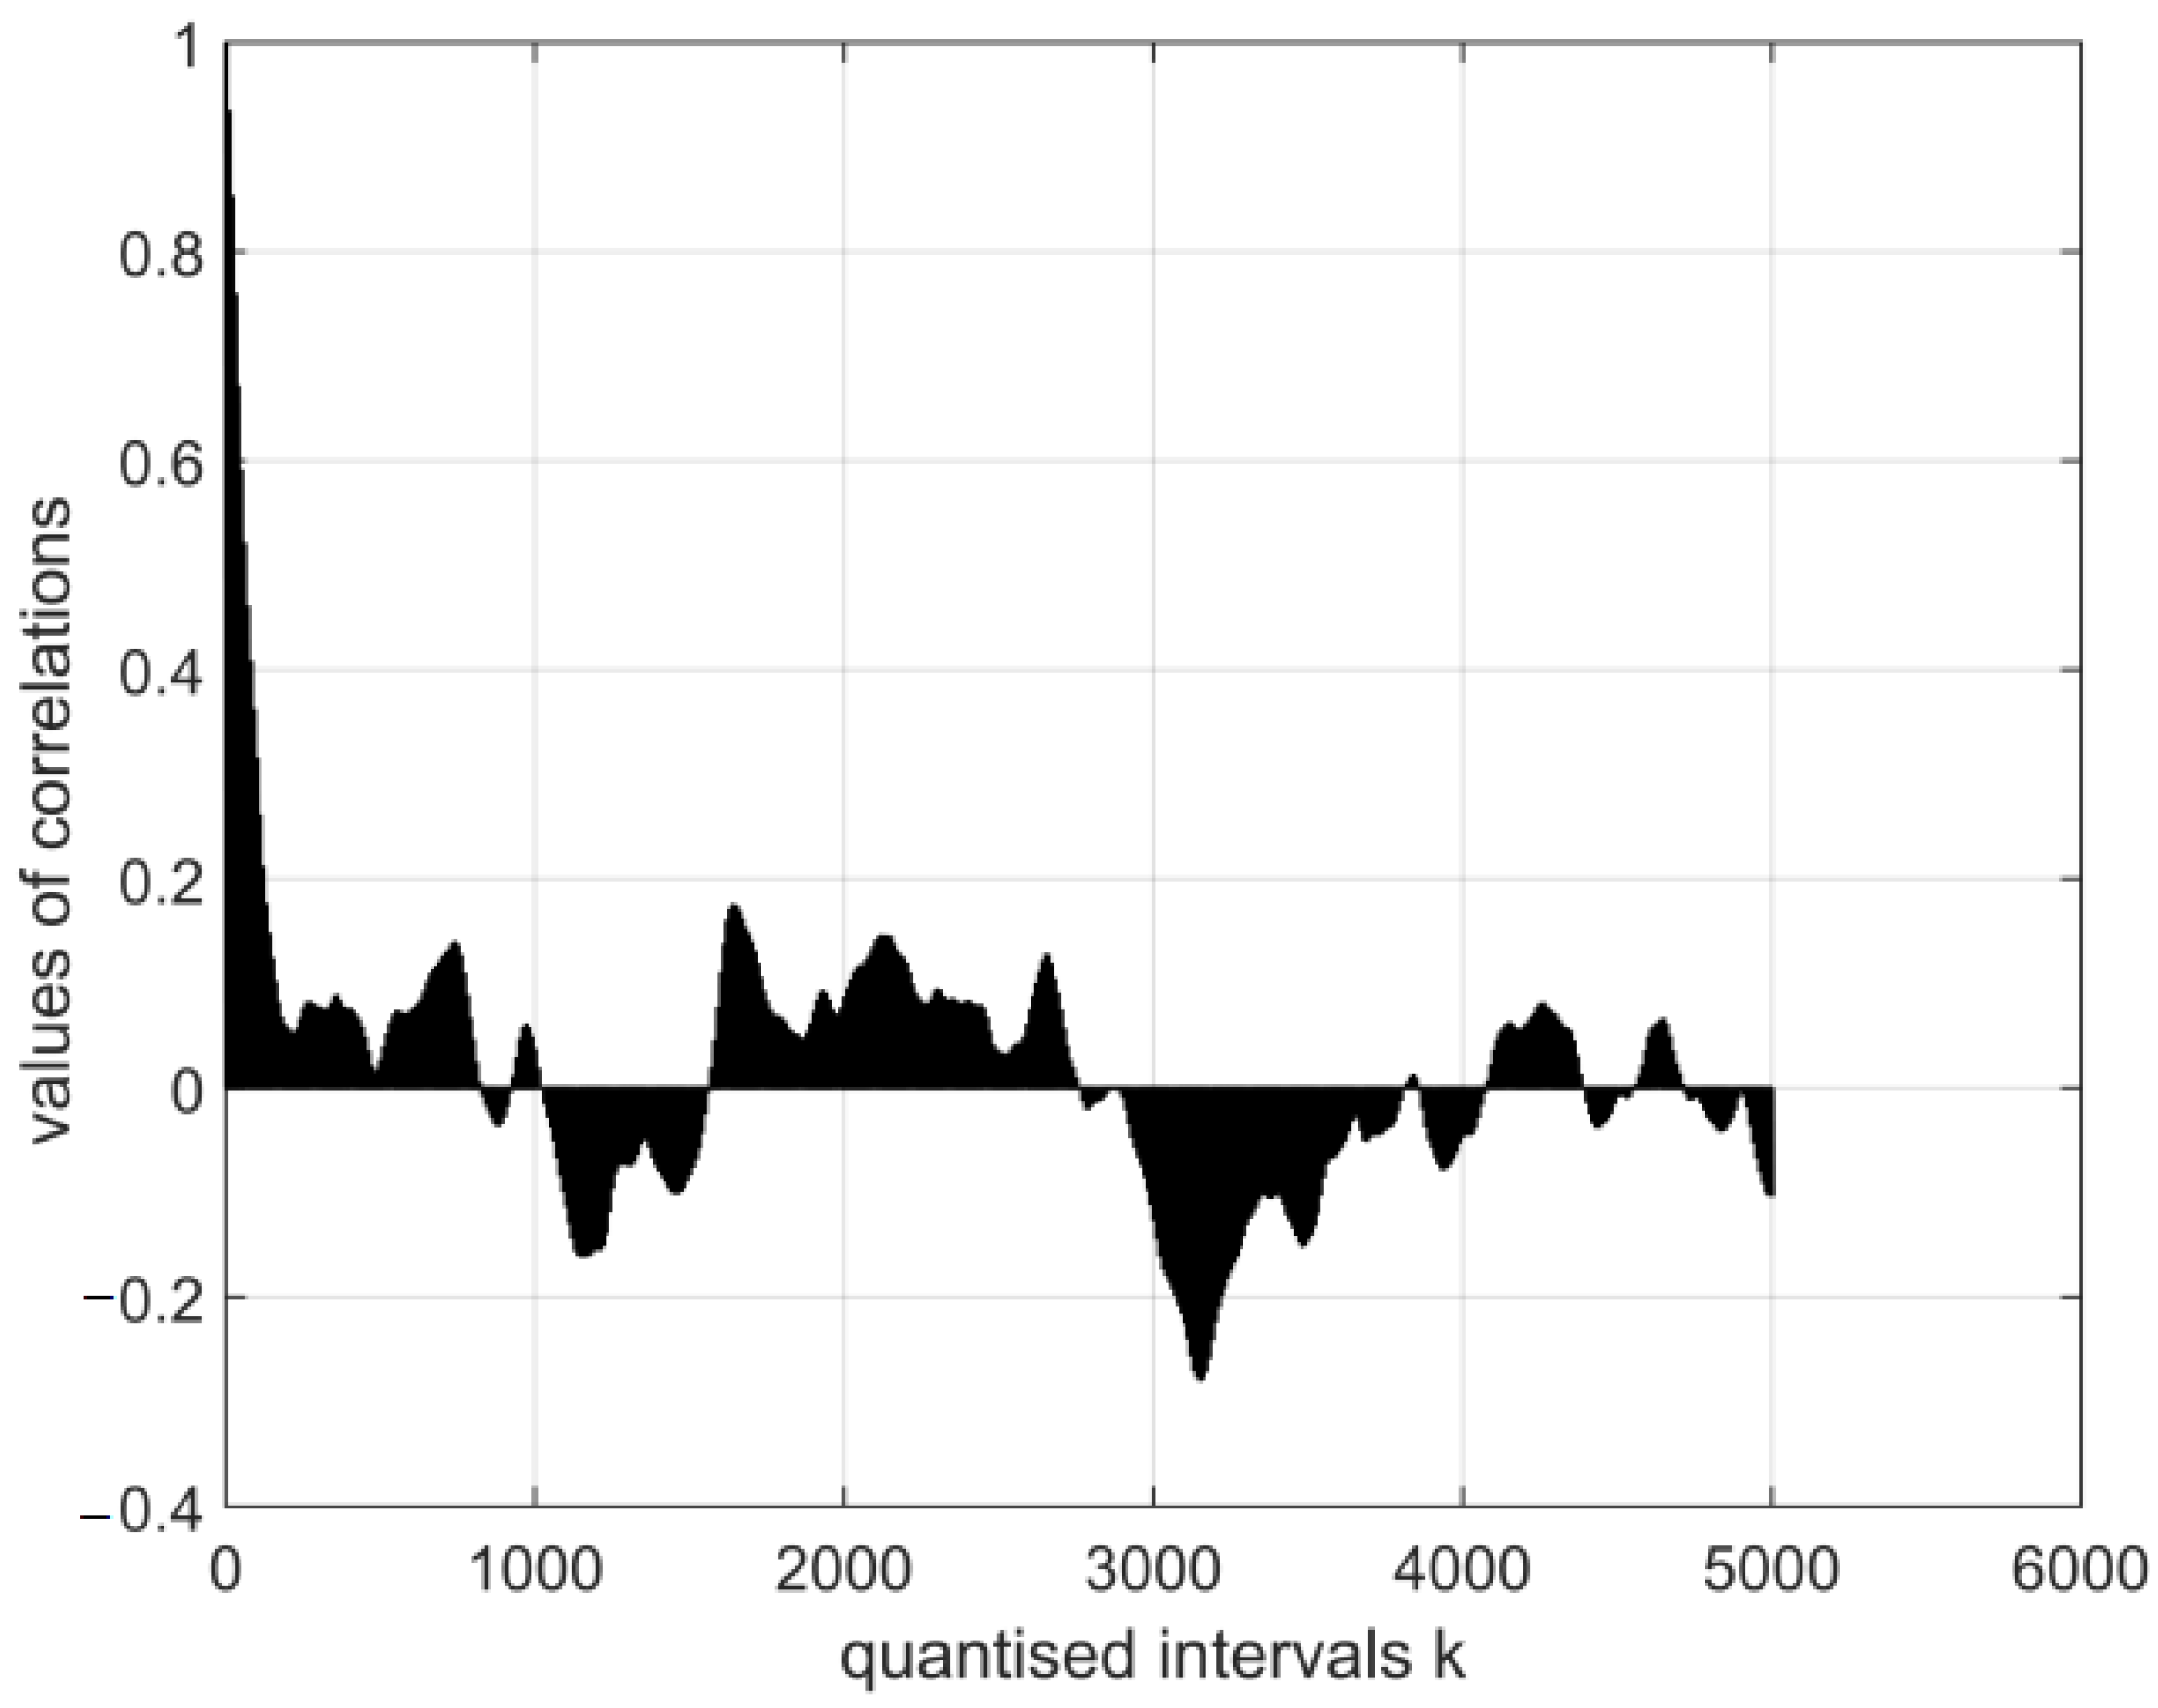
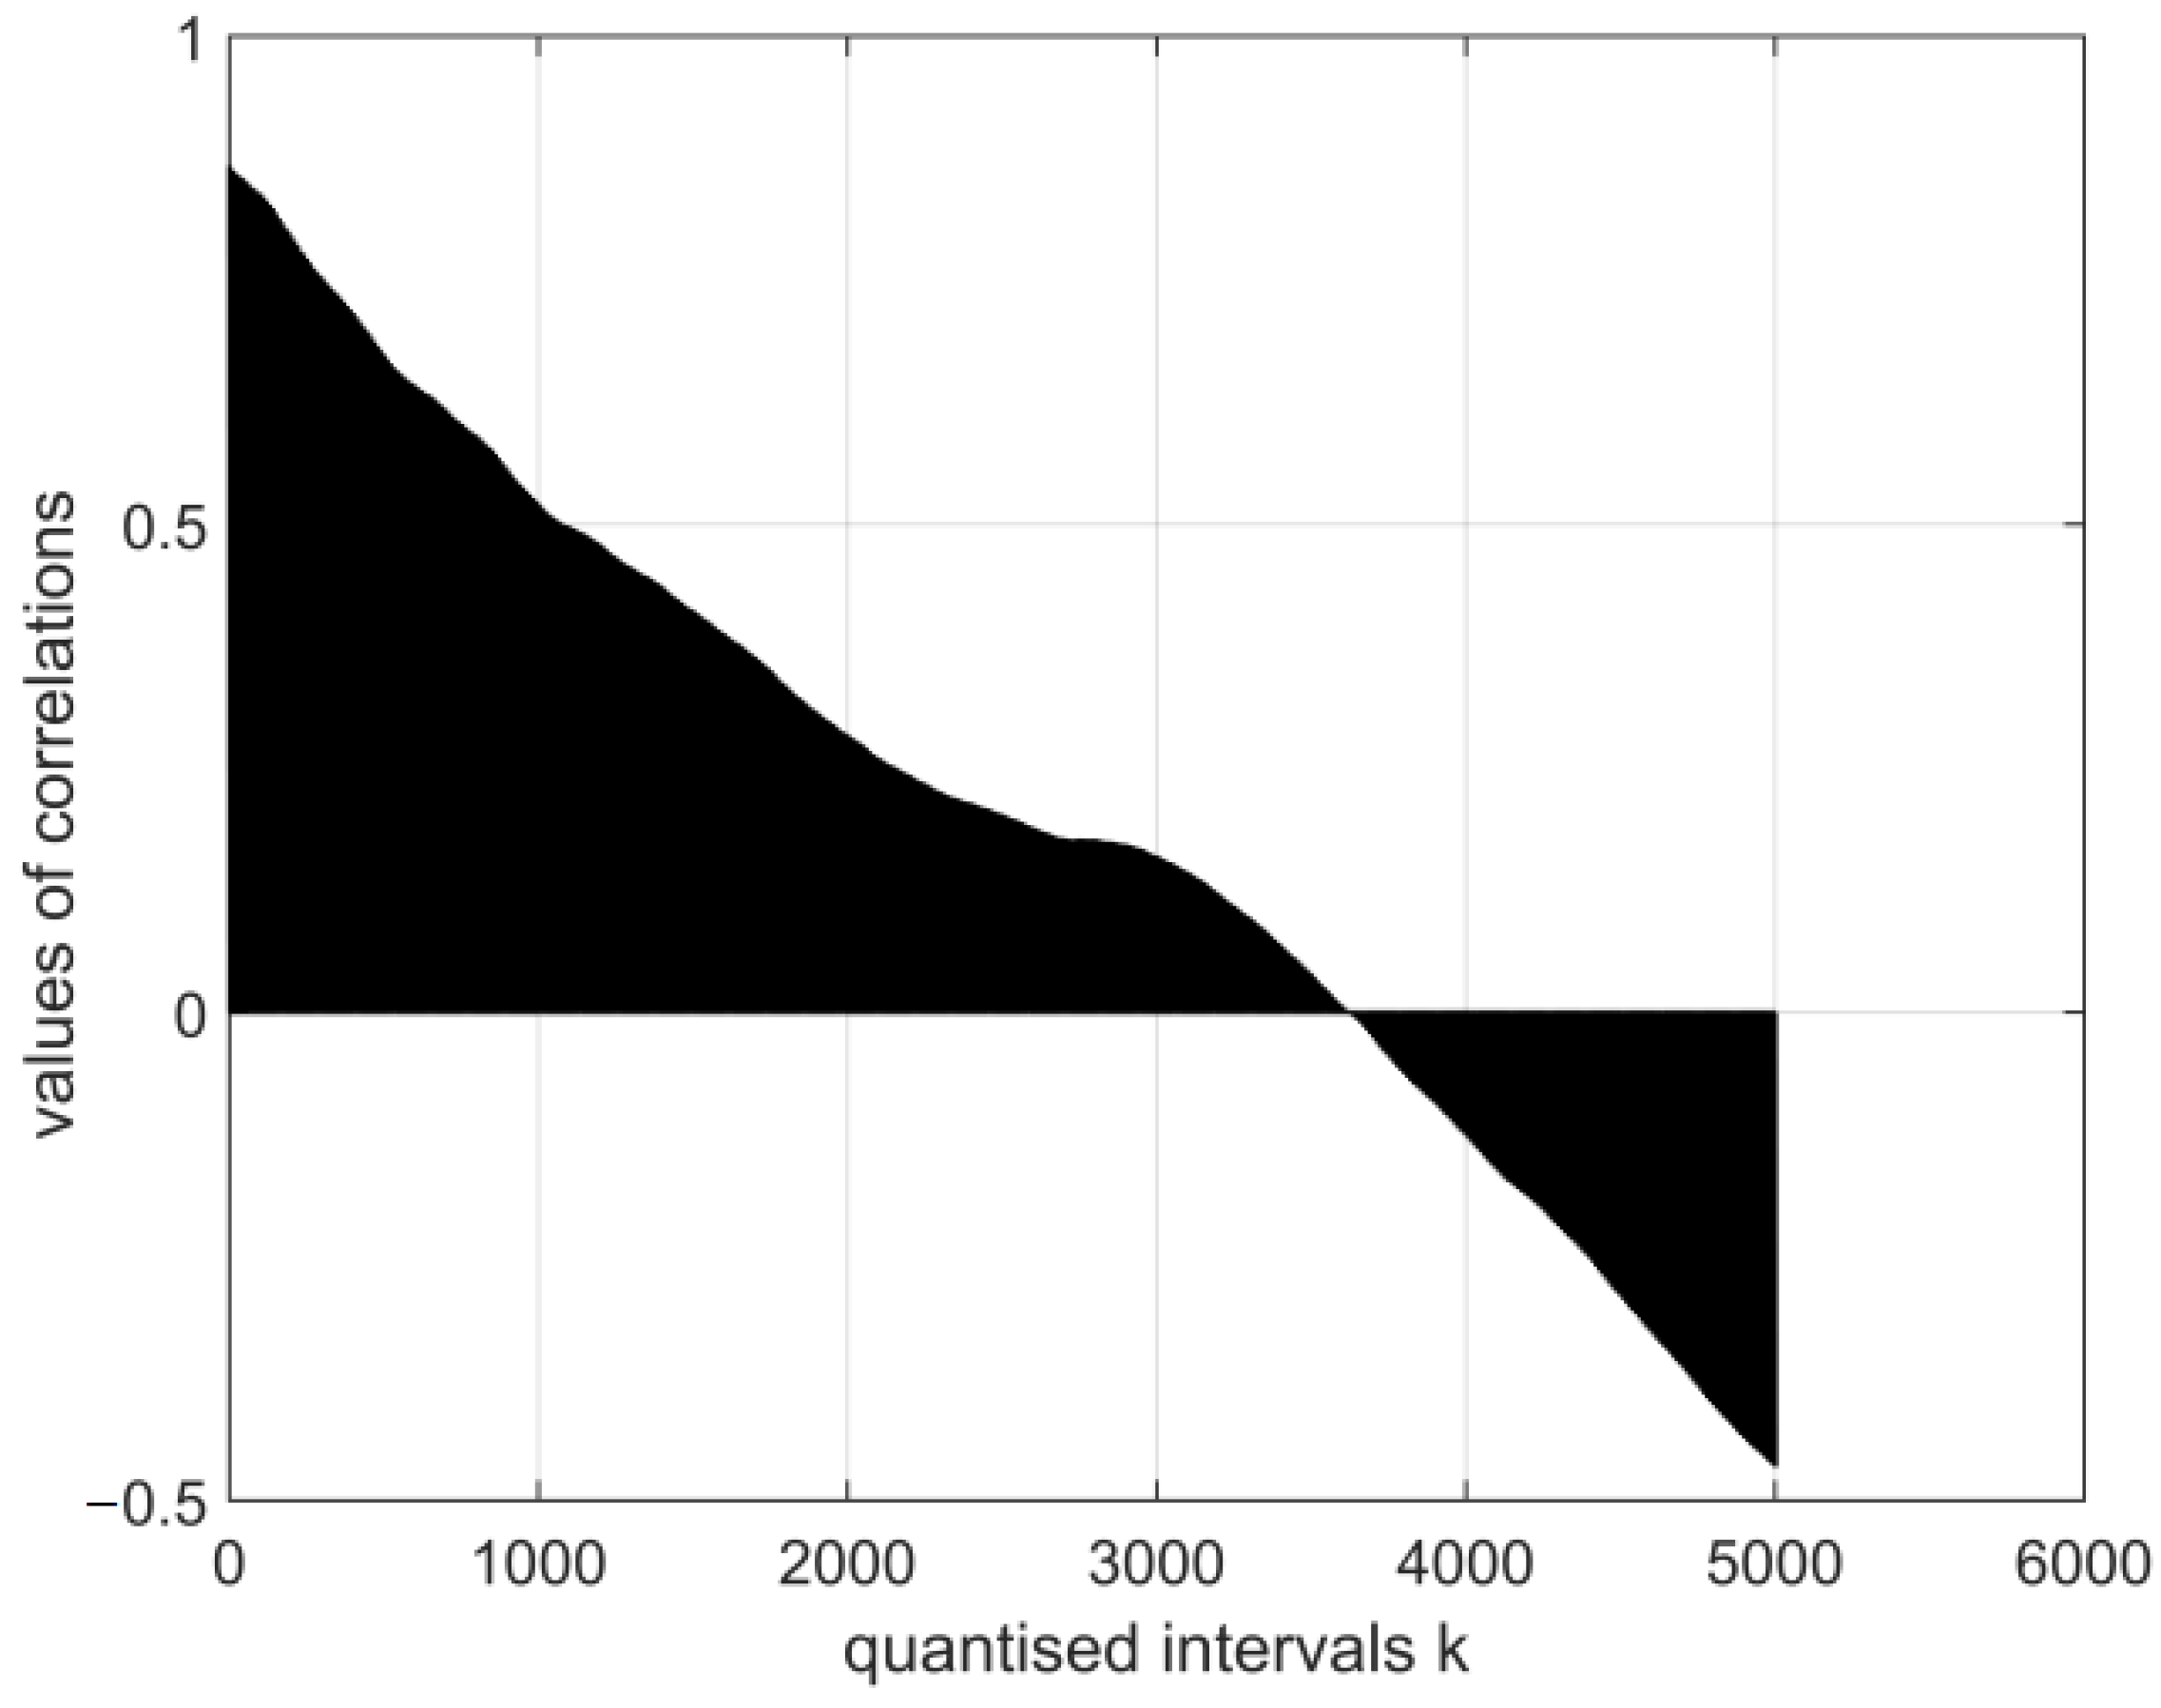
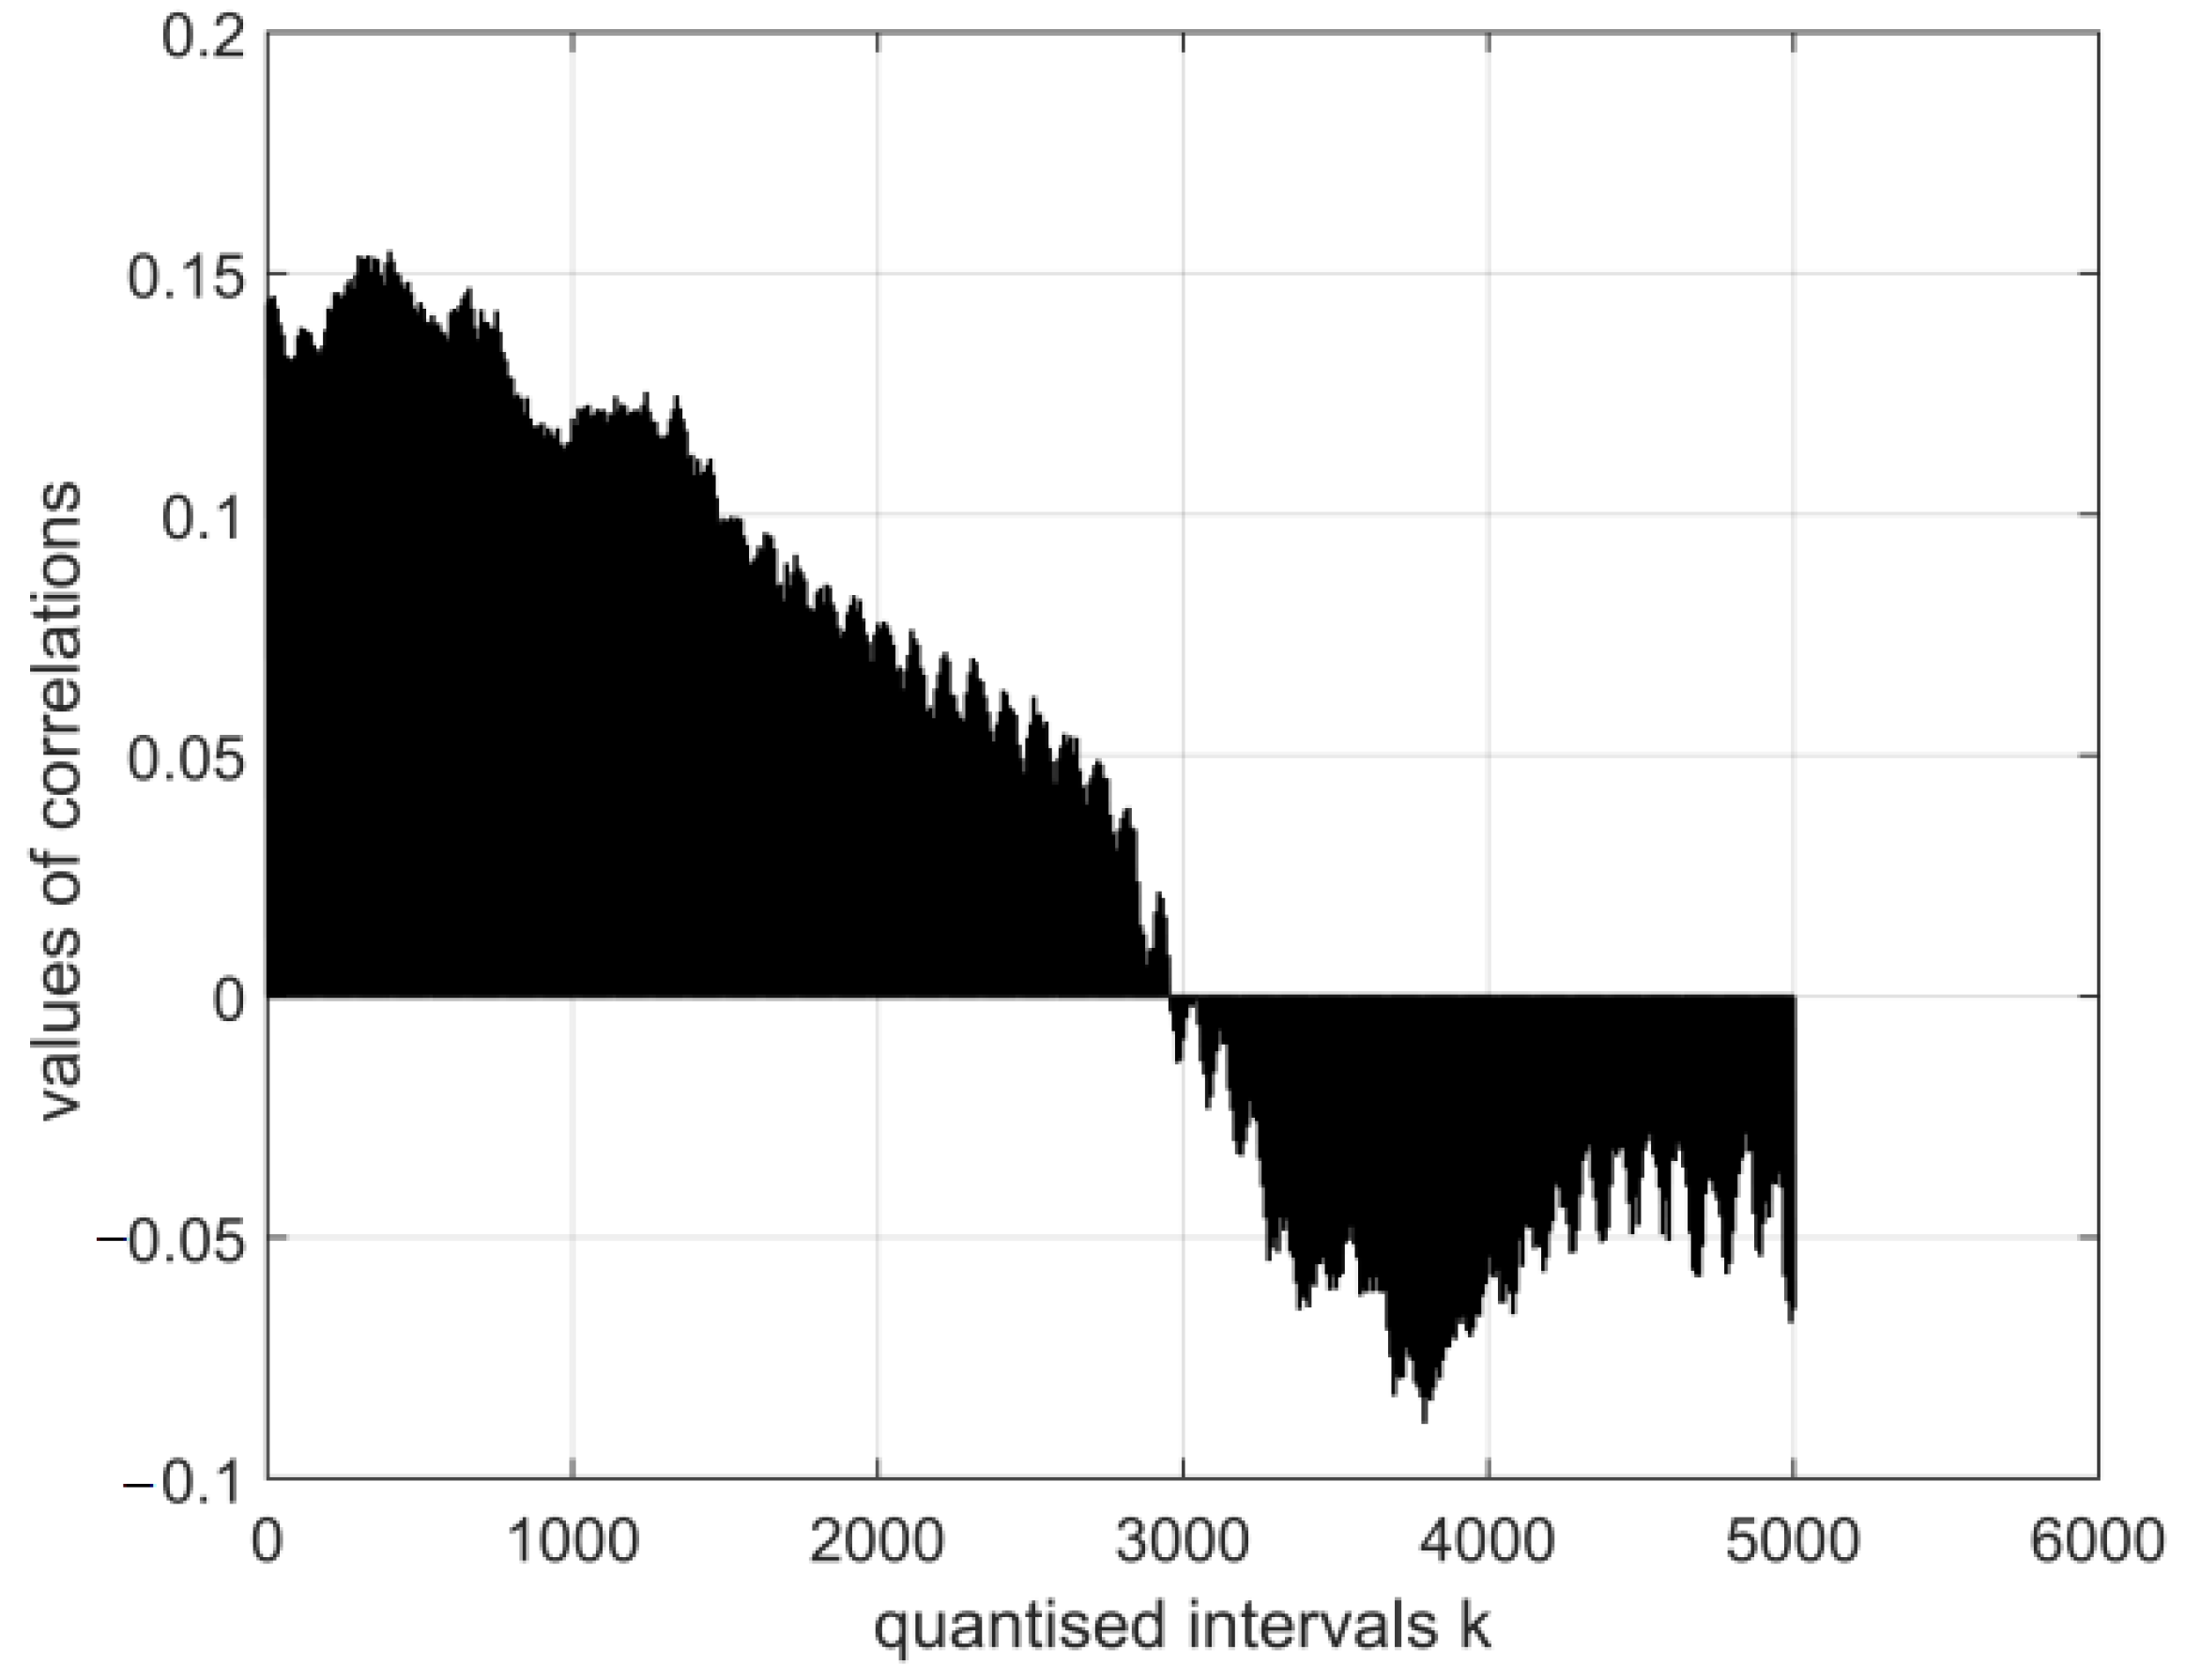
- The magnitudes of the normalised auto-covariance functions for the digital vectors of the coronavirus cor2 image parameters differ in the range (1.0: 0.1). The magnitudes of the normalised auto-covariance functions for the digital vectors of coronavirus cor4 image parameters vary in the range (1.0: −0.8). Thus, the structures of both viruses differ. In a considerable part of quantised intervals, the vector of the coronavirus cor2 image has negative values of normalised auto-covariance functions when = −0.8.
- The magnitudes of the normalised cross-covariance functions for the digital electroencephalography measurement results’ vectors E in all quantised intervals vary in the range (0.9: −0.6). The graphical expressions of the functions are asymmetric and similar.
- The magnitudes of the normalised cross-covariance functions for the electroencephalography measurement results’ vectors E and the vectors of the images of cor2 and cor4 vary in different ranges when (0.15: −0.7). The magnitudes of the normalised cross-covariance functions for the electroencephalography measurement results’ vectors E and the digital vectors of the coronavirus images within the period of all measurements are negative. Consequently, their probabilistic interdependence is negative as well.
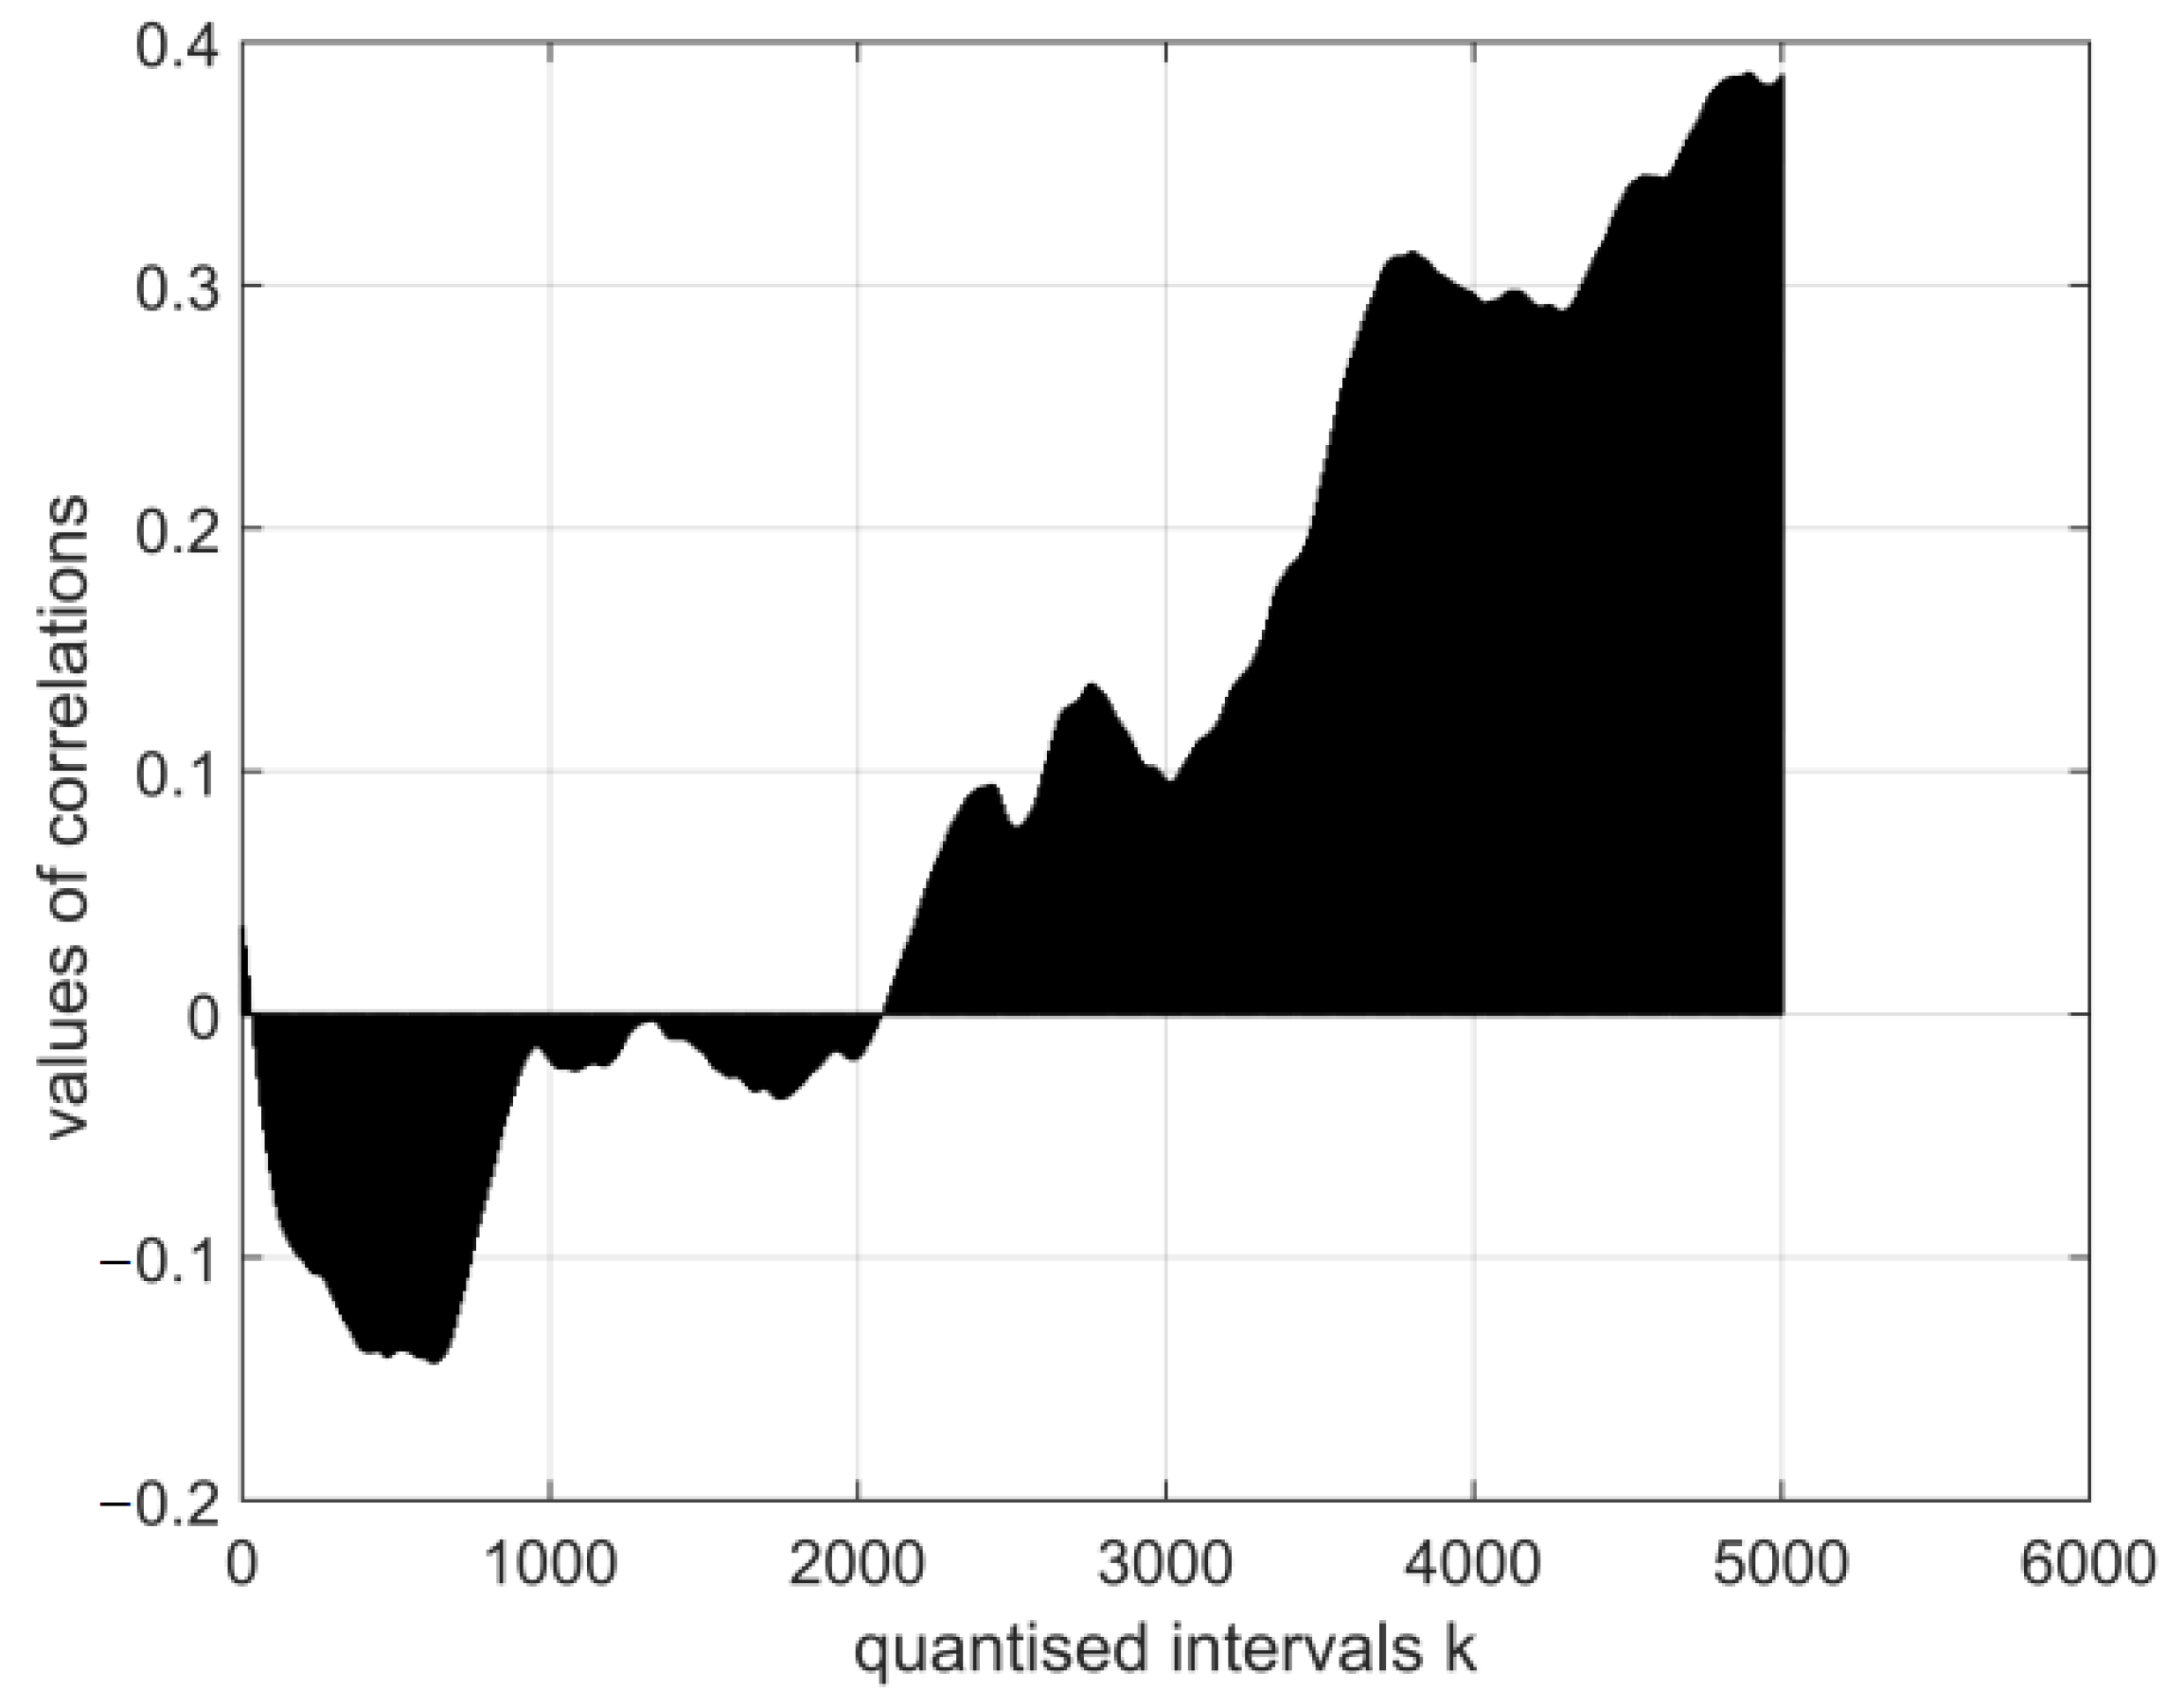
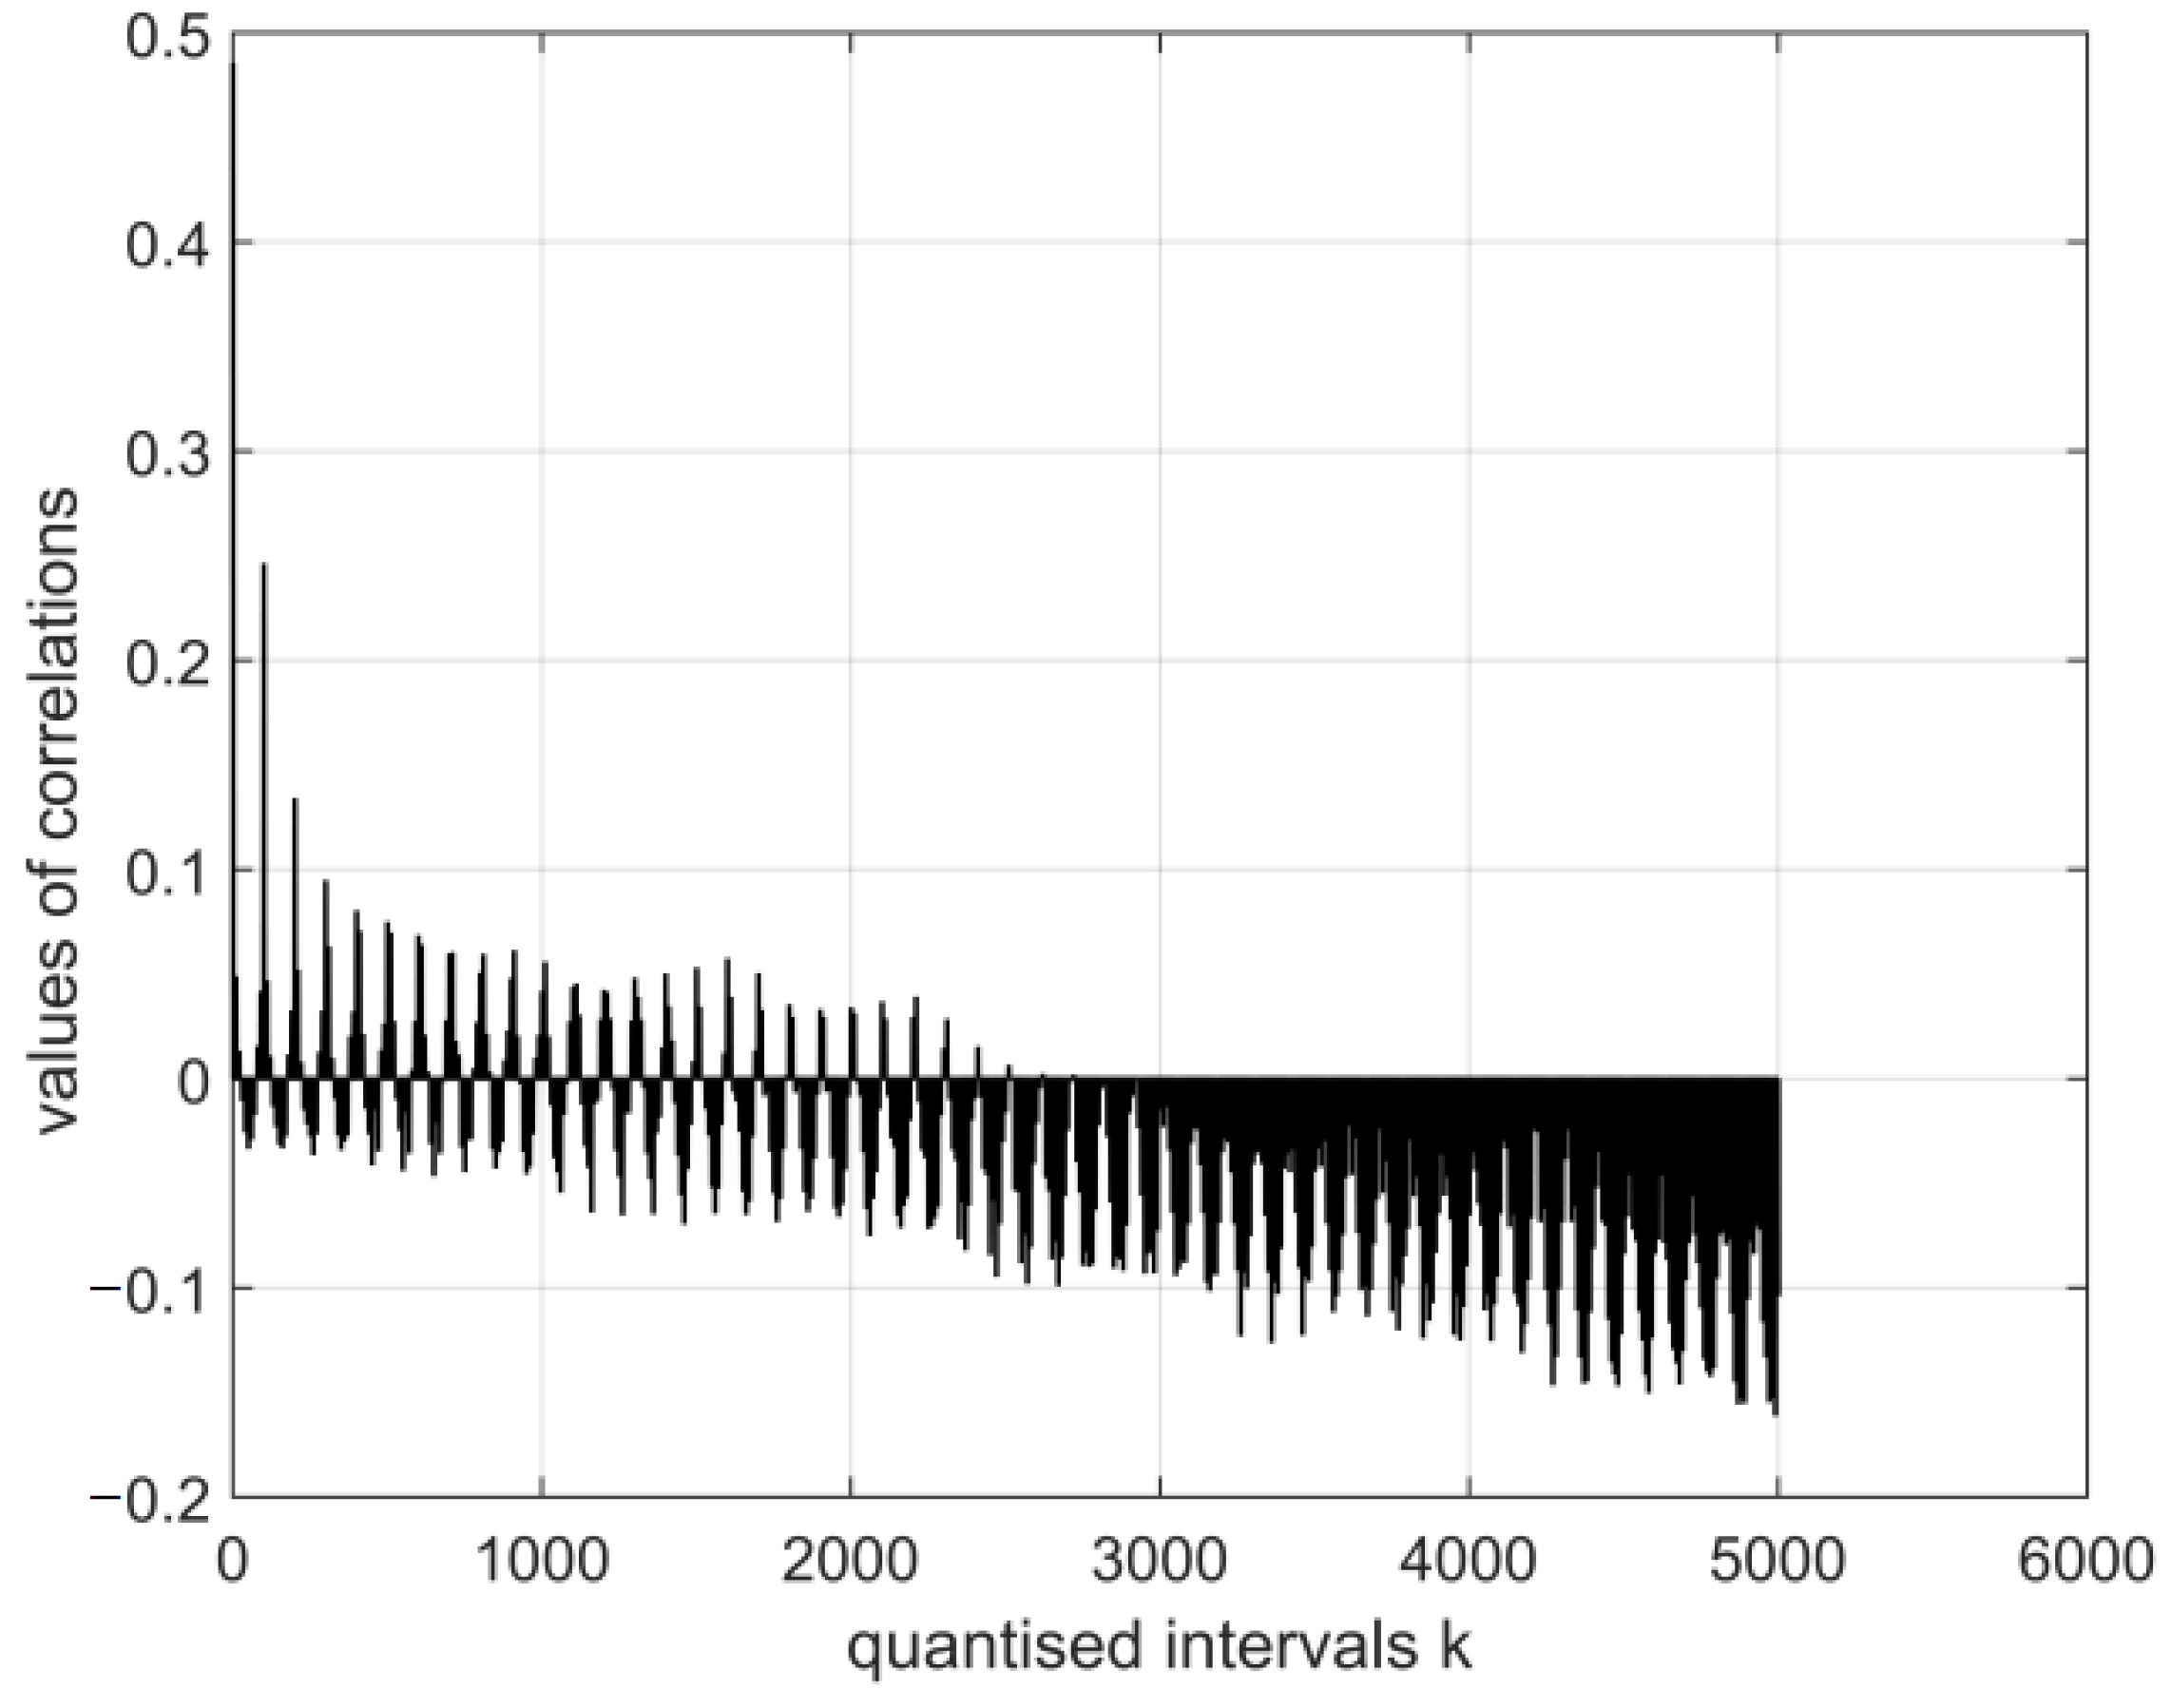
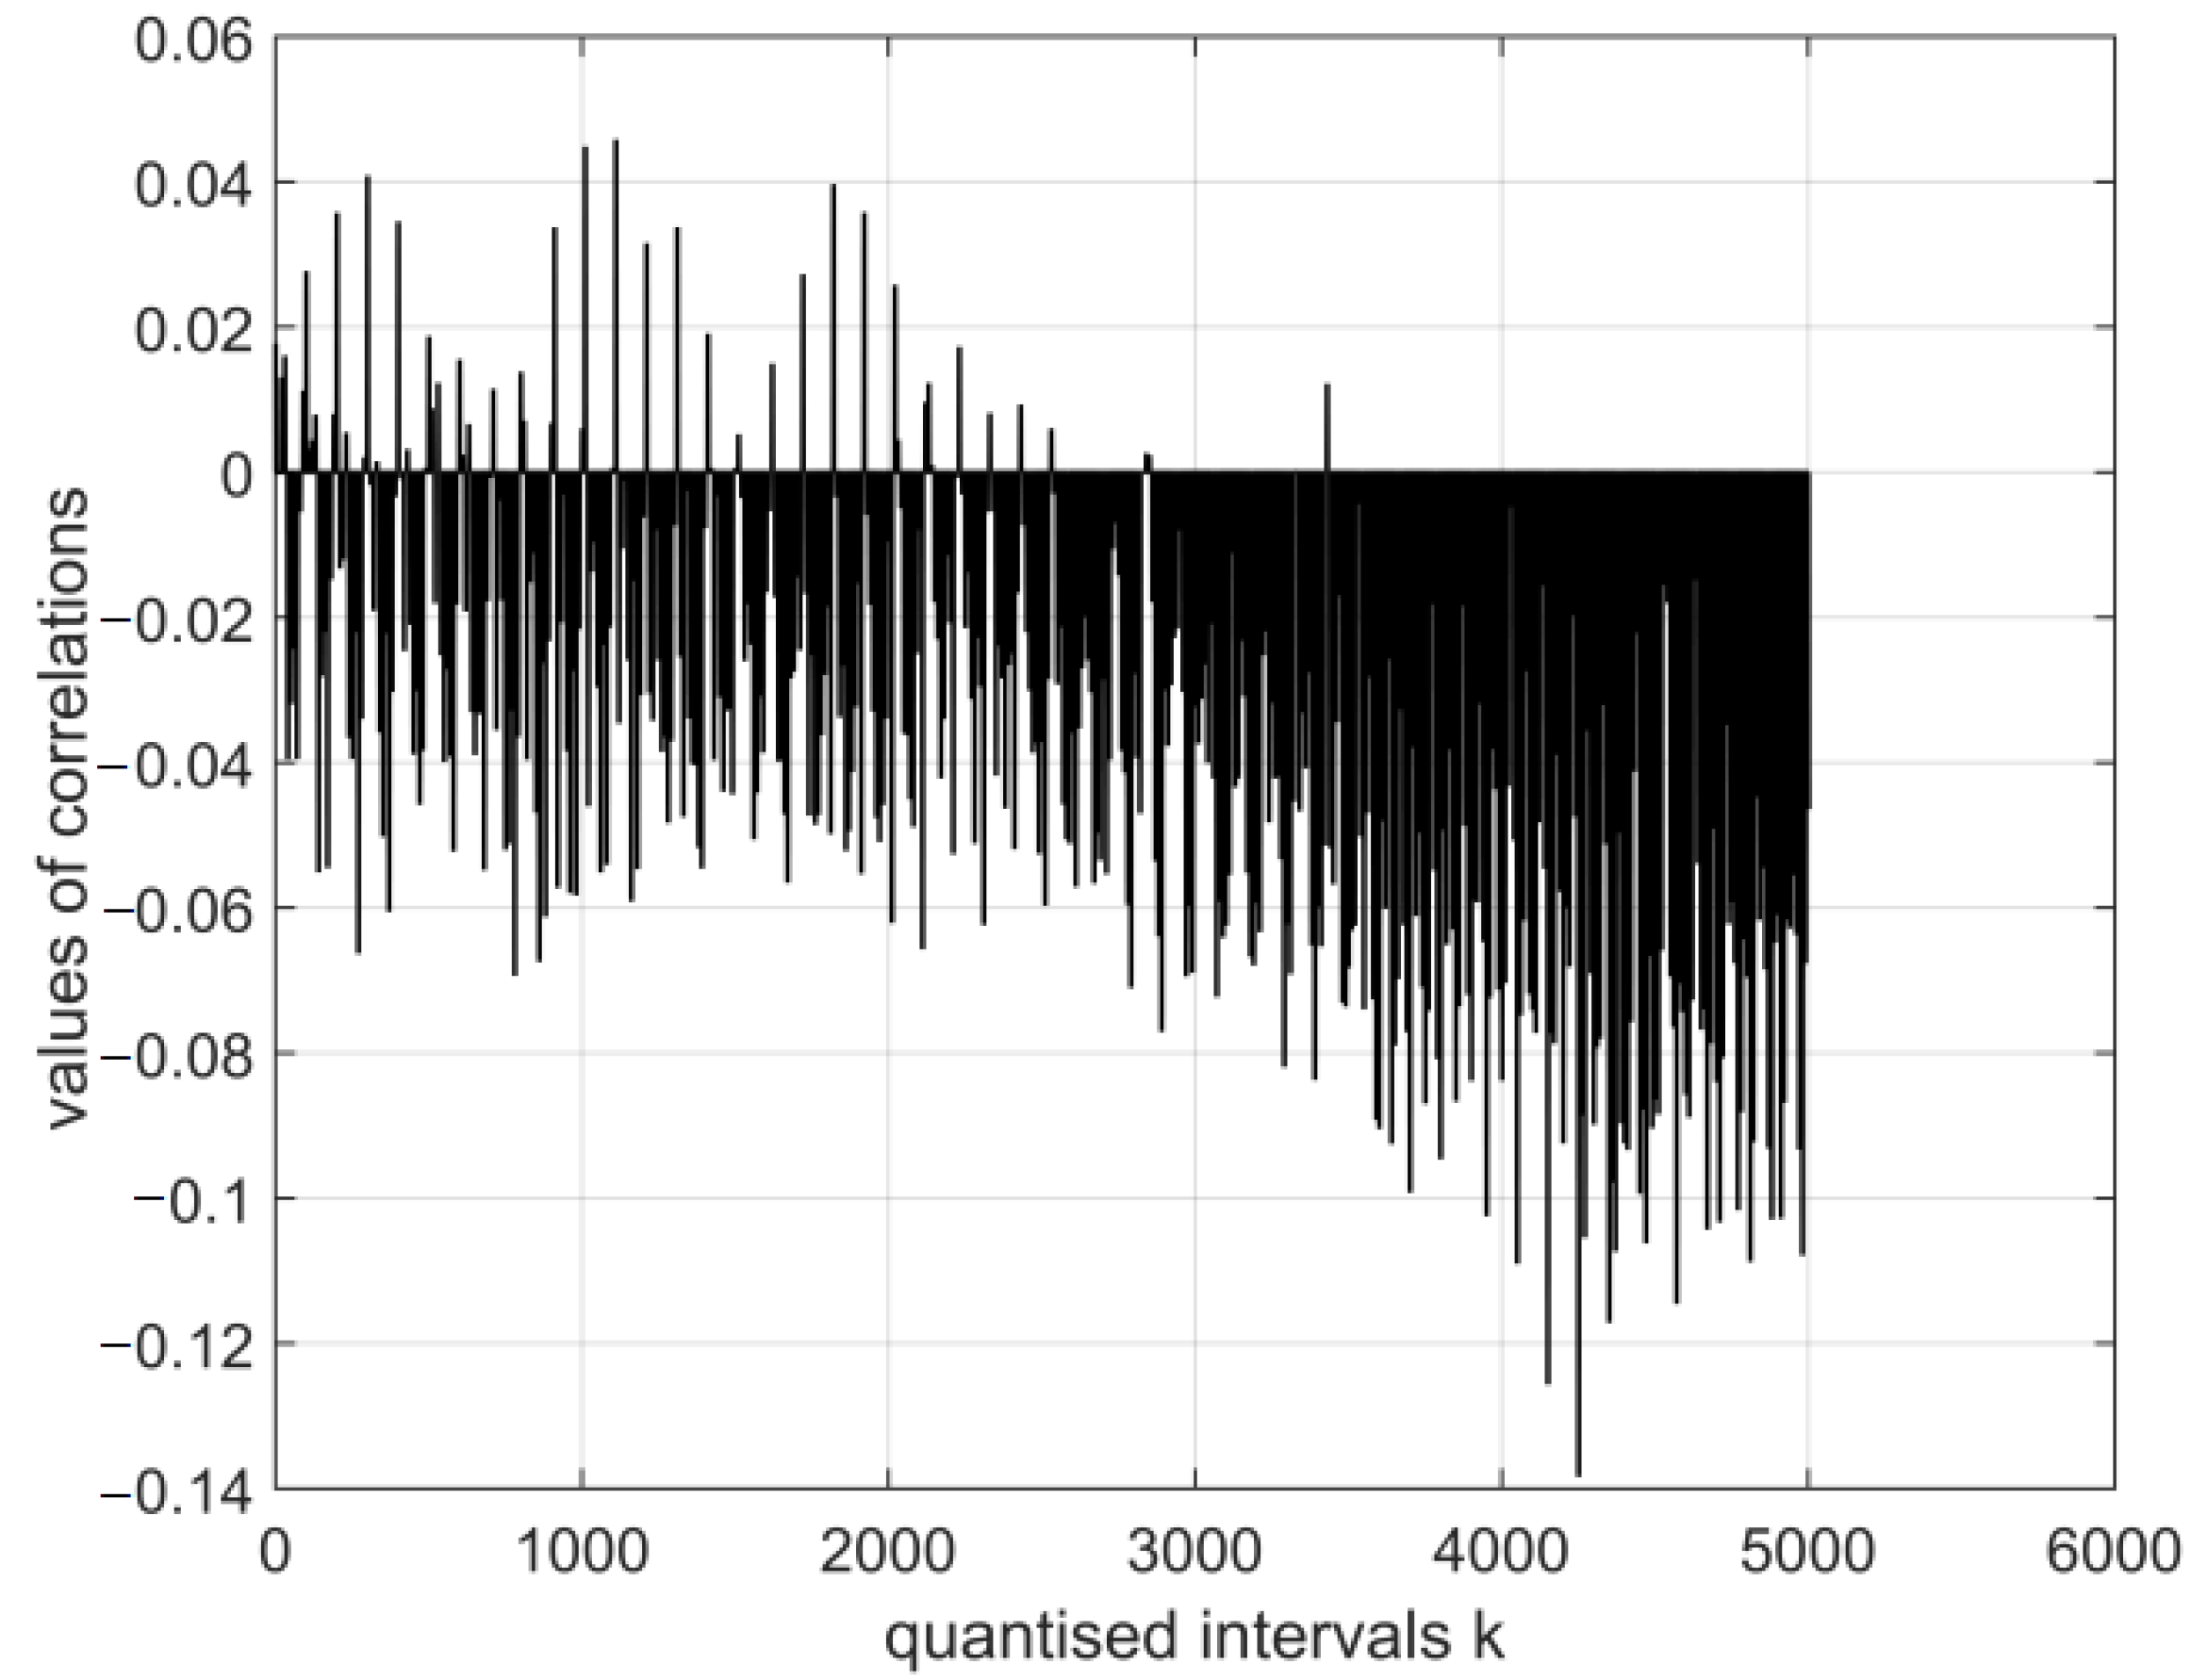
- The magnitudes of the normalised cross-covariance functions for the digital vectors of the images of cor2 and cor4 differ in the interval r (0.5: −0.15) based on the calculation in the system with vectors (E1–E12). The magnitudes of the normalised cross-covariance functions for the digital vectors of the images of cor2 and cor4 vary in the interval r (0.04: −0.14) based on the calculation in the system with vectors (E13–E30). Thus, in this case, their values are very low, and this shows an absence of interdependence between cor2 and cor4.
Author Contributions
Funding
Data Availability Statement
Conflicts of Interest
References
- Liu, S.-L.; Wang, Z.-G.; Xie, H.-Y.; Liu, A.-A.; Lamb, D.C.; Pang, D.-W. Single-virus tracking: From imaging methodologies to virological applications. Chem. Rev. 2020, 120, 1936–1979. [Google Scholar] [CrossRef] [PubMed]
- Rockx, B.; Kuiken, T.; Herfst, S.; Bestebroer, T.; Lamers, M.M.; Oude Munnink, B.B.; de Meulder, D.; van Amerongen, G.; van den Brand, J.; Okba, N.M.; et al. Comparative pathogenesis of COVID-19, MERS, and SARS in a nonhuman primate model. Science 2020, 368, 1012–1015. [Google Scholar] [CrossRef] [PubMed]
- Zhu, N.; Zhang, D.; Wang, W.; Li, X.; Yang, B.; Song, J.; Zhao, X.; Huang, B.; Shi, W.; Lu, R.; et al. A novel coronavirus from patients with pneumonia in China, 2019. N. Engl. J. Med. 2020, 382, 727–733. [Google Scholar] [CrossRef] [PubMed]
- Liu, C.; Yang, Y.; Gao, Y.; Shen, C.; Ju, B.; Liu, C.; Tang, X.; Wei, J.; Ma, X.; Liu, W.; et al. Viral Architecture of SARS-CoV-2 with Post-Fusion Spike Revealed by Cryo-Em 2020. biorXiv 2020. [Google Scholar] [CrossRef]
- Chan, J.F.-W.; Yuan, S.; Kok, K.-H.; To, K.K.-W.; Chu, H.; Yang, J.; Xing, F.; Liu, J.; Yip, C.C.-Y.; Poon, R.W.-S.; et al. A familial cluster of pneumonia associated with the 2019 novel coronavirus indicating person-to-person transmission: A study of a family cluster. Lancet 2020, 395, 514–523. [Google Scholar] [CrossRef] [PubMed]
- Walls, A.C.; Park, Y.-J.; Tortorici, M.A.; Wall, A.; McGuire, A.T.; Veesler, D. Structure, Function and Antigenicity of the SARS-CoV-2 Spike Glycoprotein 2020. Cell 2020, 180, 281–292. [Google Scholar] [CrossRef] [PubMed]
- Chen, M.; Rosenberg, J.; Cai, X.; Lee, A.C.; Shi, J.; Nguyen, M.; Wignakumar, T.; Mirle, V.; Edobor, A.J.; Fung, J.; et al. Nanotraps for the containment and clearance of SARS-CoV-2. Matter 2021, 4, 2059–2082. [Google Scholar] [CrossRef] [PubMed]
- Andreu-Sánchez, C.; Martín-Pascual, M.-Á. Fake images of the SARS-CoV-2 coronavirus in the communication of information at the beginning of the first COVID-19 pandemic. Prof. Inf. 2020, 29, 1–10. [Google Scholar] [CrossRef]
- Adnan; Ali, A.; ur Rahmamn, M.; Shah, Z.; Kumam, P. Investigation of a time-fractional COVID-19 mathematical model with Singular Kernel. Adv. Contin. Discret. Model. 2022, 2022, 34. [Google Scholar] [CrossRef] [PubMed]
- Zafar, Z.U.; Ali, N.; Inc, M.; Shah, Z.; Younas, S. Mathematical modeling of Corona virus (COVID-19) and stability analysis. Comput. Methods Biomech. Biomed. Eng. 2022, 1–20. [Google Scholar] [CrossRef] [PubMed]
- Tuncer, N.; Timsina, A.; Nuno, M.; Chowell, G.; Martcheva, M. Parameter identifiability and optimal control of an SARS-CoV-2 model early in the pandemic. J. Biol. Dyn. 2022, 16, 412–438. [Google Scholar] [CrossRef] [PubMed]
- Bajiya, V.P.; Bugalia, S.; Tripathi, J.P.; Martcheva, M. Deciphering the transmission dynamics of COVID-19 in India: Optimal control and cost effective analysis. J. Biol. Dyn. 2022, 16, 665–712. [Google Scholar] [CrossRef] [PubMed]
- Teklu, S.W. Mathematical analysis of the transmission dynamics of COVID-19 infection in the presence of intervention strategies. J. Biol. Dyn. 2022, 16, 640–664. [Google Scholar] [CrossRef] [PubMed]
- EEG Data Downloads. Available online: http://fcon_1000.projects.nitrc.org/indi/cmi_eeg/eeg.html (accessed on 9 March 2023).
- Delorme, A.; Makeig, S. EEGLAB: An open source toolbox for analysis of single-trial EEG Dynamics including independent component analysis. J. Neurosci. Methods 2004, 134, 9–21. [Google Scholar] [CrossRef] [PubMed]
- Antoine, J.P. Wavelet analysis of signals and images, a grand tour. Cienc. Mat. 2000, 18, 113–143. Available online: https://www.researchgate.net/profile/Jean-Pierre-Antoine/publication/266276315_Wavelet_analysis_of_signals_and_images/links/54329cec0cf22395f29c2cfe/Wavelet-analysis-of-signals-and-images.pdf (accessed on 1 June 2021).
- Koch, K.-R. Einführung in die Bayes-Statistik; Springer: Berlin/Heidelberg, Germany, 2000; Volume IX 225. [Google Scholar]
- Skeivalas, J. Theory and practice of GPS networks. Technika 2008, 288. [Google Scholar] [CrossRef]
- Skeivalas, J.; Parseliunas, E. On identification of human eye retinas by the covariance analysis of their digital images. Opt. Eng. 2013, 52, 073106. [Google Scholar] [CrossRef]



Disclaimer/Publisher’s Note: The statements, opinions and data contained in all publications are solely those of the individual author(s) and contributor(s) and not of MDPI and/or the editor(s). MDPI and/or the editor(s) disclaim responsibility for any injury to people or property resulting from any ideas, methods, instructions or products referred to in the content. |
© 2023 by the authors. Licensee MDPI, Basel, Switzerland. This article is an open access article distributed under the terms and conditions of the Creative Commons Attribution (CC BY) license (https://creativecommons.org/licenses/by/4.0/).
Share and Cite
Skeivalas, J.; Paršeliūnas, E.; Paršeliūnas, A.; Šlikas, D. Analysis of Results of Digital Electroencephalography and Digital Vectors of Coronavirus Images upon Applying the Theory of Covariance Functions. Symmetry 2023, 15, 1330. https://doi.org/10.3390/sym15071330
Skeivalas J, Paršeliūnas E, Paršeliūnas A, Šlikas D. Analysis of Results of Digital Electroencephalography and Digital Vectors of Coronavirus Images upon Applying the Theory of Covariance Functions. Symmetry. 2023; 15(7):1330. https://doi.org/10.3390/sym15071330
Chicago/Turabian StyleSkeivalas, Jonas, Eimuntas Paršeliūnas, Audrius Paršeliūnas, and Dominykas Šlikas. 2023. "Analysis of Results of Digital Electroencephalography and Digital Vectors of Coronavirus Images upon Applying the Theory of Covariance Functions" Symmetry 15, no. 7: 1330. https://doi.org/10.3390/sym15071330
APA StyleSkeivalas, J., Paršeliūnas, E., Paršeliūnas, A., & Šlikas, D. (2023). Analysis of Results of Digital Electroencephalography and Digital Vectors of Coronavirus Images upon Applying the Theory of Covariance Functions. Symmetry, 15(7), 1330. https://doi.org/10.3390/sym15071330


