Article

Path Loss and Auxiliary Communication Analysis of VANET in Tunnel Environments

School of Information Engineering, Yangzhou University, Yangzhou 225000, China
*
Author to whom correspondence should be addressed.
Symmetry 2023, 15(6), 1230; https://doi.org/10.3390/sym15061230
Submission received: 1 May 2023 / Revised: 25 May 2023 / Accepted: 6 June 2023 / Published: 9 June 2023

Abstract

:
Vehicular ad hoc network (VANET) communications face severe fading problems due to the signal reflections and diffractions within tunnels. Unlike the open road, the space of a tunnel is very limited, so VANET communication performance in a tunnel is seriously affected. In the process of signal transmission, the reflected signal is symmetrical with the incident signal after it is reflected by the road and the wall. In this paper, we establish a mathematical model of path loss for V2V (Vehicle-to-Vehicle) communication based on the principle of signal reflection symmetry in tunnels and considering several factors, such as the tunnel surface and the color of the tunnel wall. In addition, we use cooperative communication to form a virtual multiple-input multiple-output (V-MIMO) system, to improve the communication quality in tunnels. In the proposed system, the OBU (On-Board-unit) and RSU (Road-Side-Unit) share each other’s antennas, so that wireless cooperative communication can be employed, without increasing the number of antennas in a one-way tunnel. Therefore, this multipath fading internal electromagnetic wave propagation model can be used to improve performance. A deep reinforcement learning algorithm was used to solve the pairing problem to obtain a more accurate OBU and RSU pair, to form a V-MIMO system. Here, the RSU is regarded as an agent and interacts with the OBU in the tunnel. The optimal strategy was learned in a real-time changing simulation environment, and the experiment verified the convergence of the algorithm. The simulation results showed that, compared with the Q-learning based scheme, the optimal matching algorithm based on V-MIMO and a DQN (Deep Q-network) could effectively reduce the probability of transmission outages and improve the communication efficiency in tunnels.

1. Introduction

With the development of science and technology, the latest mobile communication technology defines three major technical scenarios: enhanced mobile Internet, massive machine-type communication, and high-reliability and low-latency communication. The VANET (vehicular ad hoc network) is an important application in high-reliability and low-latency communication scenarios [1]. A vehicular ad hoc network can be divided into three parts: the intra-vehicle network, the inter-vehicle network, and the in-vehicle mobile Internet. In the intra-vehicle network, the vehicle communicates with the mobile terminal through the built-in onboard unit (OBU), realizing mutual communication between the vehicle and the driver [2,3,4]. In the inter-vehicle network, vehicles transmit messages device-to-device (D2D) within a certain range, realizing information sharing between vehicles [5,6]. In the in-vehicle mobile Internet, the base station connects the road system and the Internet, and acts as a relay for the interconnection between vehicles and the Internet, to provide services [7,8].
In recent years, with the continuous development of the world economy, the number of cars has continued to grow. On the one hand, the significant increase in the number of cars has facilitated people’s daily travel; on the other hand, the increasing number of cars on the road has brought huge challenges to the daily operation of the transportation system. The carrying capacity of ordinary roads has reached saturation in many cities, and in this context, fully developing highway tunnel traffic has become one of the effective ways to alleviate the traffic pressure for certain vehicles. Tunnels are engineering buildings buried in the ground, and unlike open spaces on land, the space of tunnels is very limited, so the traffic problems of tunnel vehicles are different from road traffic. VANET technology plays an extremely important role in addressing road traffic issues in tunnel scenarios. In this network, the vehicle is treated as an independent node equipped with specific communication devices, and it has communication, computing, storage, sensing, and control capabilities. Real-time interaction between vehicles and the road can be achieved within a tunnel. Unlike for urban highway scenarios, scholars have paid little attention to tunnel-related traffic problems. The information transmission in a tunnel environment with V2X (Vehicle-to-Everything) can be divided into line-of-sight (LOS) propagation and non-line-of-sight (NLOS) propagation [9]. Moreover, the signal transmission in a tunnel is restricted in a certain space limited by the tunnel wall, the ground, and the top wall [10]. Thus, the space is narrow and unique. On account of the special characteristics of the tunnel environment, there are many reflections and diffractions, so V2V communication has a large number of paths, in addition to the simplest LOS propagation path. Therefore, the received signal is composed of multipath signals. These propagation paths of signals are different in length and direction, which leads to a varying time, amplitude, and angle of arrival at the receiving antenna. After being superimposed at the receiving vehicle, in-phase superposition may occur and enhance the signal strength, or anti-phase superposition may occur and weaken the signal. Under these circumstances, the amplitude of the received signal changes drastically, resulting in multipath fading. This multipath fading seriously deteriorates the quality of the received signal, affects the reliability of the communication, reduces the coverage of the communication, and restricts the V2X signal transmission in a tunnel. These are the issues that affect VANET communication in a tunnel. Therefore, it is necessary to conduct in-depth research on the characteristics and rules of path loss in tunnels [11], such as the propagation mechanism in a tunnel environment.
In the process of VANET communication between vehicles in a tunnel, the topology of VANET has the characteristics of high-speed dynamic change, which is mainly manifested in the following aspects. First, the density distribution of network nodes (vehicles) is different with different times and locations [12]. Second, the network topology is not fixed, due to the uneven movement of network nodes [13]. Thus, the wireless channel is unstable, and the real-time transmission of messages by VANET is greatly affected by the signal propagation path when a vehicle is driving in a tunnel [14]. The tunnel environment is complex, and research about the signal propagation in tunnels is relatively scarce. There are still many problems that need to be deeply explored and studied.
At present, signal propagation models include the Okumura-Hata model [15], COST-231 Hata model [16], LEE model [17], CCIR model [18], Egli model [19], Longley-Rice Model [20], and Kriging model [21]. The parameters in the Okumura Data model are easy to obtain and use. However, significant factors such as the height and density of buildings, as well as the distribution of streets, were not considered, resulting in significant errors between the predicted and actual values [15]. The COST-231 Hata model can be used to estimate the path loss of cellular communication in urban environments [16]. The LEE model is suitable for measuring data, and the main parameters are easy to obtain and adjust, with high accuracy, a simple algorithm, and fast calculation [17]. The work in [20] used the Longley Rice model to predict the wireless signal propagation of rural railways, and the predicted results were compared with the measurement results using actual instruments. In addition, comparisons were made with the predictions of the Okumura Data model. The results demonstrated that the Longley Rice model is suitable for railway communication prediction with irregular terrain. The study in [19] successfully established an optimized path loss model in a mountainous environment with a frequency of 2100 MHz 3G UMTS. The results indicated that the COST-231 Hata model performed better in predicting path loss in rural and urban environments than the Hata, Egli, and ECC-33 models, and the optimized Egli model performed best in suburban areas. The study in [21] utilized a Kriging model for predicting the path loss in the very high frequency (VHF) band, using geostatistical methods. The prediction accuracy of path loss based on the widely established empirical path loss propagation model was relatively evaluated. The results revealed the applicability of geostatistical methods for predicting path loss. Each signal propagation model has a different scope and applicable environment, so these propagation models cannot be directly applied to a tunnel environment.
In most countries, tunnels generally use asphalt or concrete pavements [22]. Considering the safety issues in tunnels, high temperatures will cause serious damage to vehicles and internal facilities [23,24], so fireproof coatings are applied around tunnel walls, and different fireproof coatings and road surfaces have different influences on the signal reflections and diffractions [25]. These influences should be considered.
Multiple-input multiple-output (MIMO) communication systems utilize multiple spatially separated antennas for multiplexing and diversity gain [26]. Relatively independent signal paths can be obtained through independent channel gain matrices, which improve the spectral efficiency [27]. After the signal is transmitted in a multipath manner, it can resist multipath fading by being received and combined by multiple antennas at the receiver. Although the use of multi-antenna technology brings attractive performance gains, the cost cannot be ignored. On the one hand, multi-antenna technology requires increasing the number of radio frequency modules, thereby increasing the equipment cost. On the other hand, adding antennas will also increase the volume and power consumption of the device, as well as the cost. In order to ensure that the transmission channels are not correlated, it is necessary to ensure that the antenna spacing is greater than the maximum spacing of the channels [28].
Virtual MIMO technology (V-MIMO), which has been deeply studied for wireless sensor networks, can solve some problems of the traditional MIMO technology. V-MIMO technology utilizes multiple single antenna terminals, to cooperate with each other to form an effective antenna array [29]. After receiving the information forwarded by the cooperative partner, the terminal combines the signals to achieve spatial diversity gain. Traditional MIMO communication technology can be divided into single input single output (SISO), single input multiple output (SIMO), multiple input single output (MISO), and multiple input multiple output (MIMO) according to the configuration and number of transceiver antennas [30,31]. Similarly, in V-MIMO communication, there is also such a division according to the number of cooperative nodes participating. V-SISO means that when only the source node transmits, only the destination receives. V-MISO means that when the source node and its surrounding users transmit information at the same time, only the destination receives it. V-SIMO means when the source node alone transmits, the destination node and its cooperating nodes receive information at the same time. V-MIMO means that when the sending and receiving nodes coexist in cooperating nodes, they send and receive information at the same time.
As a technology for interconnecting thousands of vehicles, a VANET can use V-MIMO and combine artificial intelligence technology to improve the communication performance of vehicles. Reinforcement learning is one of the main topics in the field of artificial intelligence, and this includes several parts, such as the agent, environment, action, and reward [32]. In general, the model defines the main body of decision making as the agent, and the factors that can affect the agent’s decision making are referred to as the surrounding conditions. The agent can accumulate learning experience by interacting with the surrounding conditions continually [33]. In the interaction process, the agent can choose a suitable action according to a learned strategy based on the current state. The environment gives certain feedback according to the action selected by the agent in a certain state. The feedback gives a reward in the environment. The reward is achieved by continuously adjusting the strategy to maximize the long-term benefits. Intelligent agents can accumulate experience by using environmental perception and action interaction, continuously utilizing learned experience to finish the designated task. Therefore, the core of reinforcement learning is the interaction between the subject and the environment through continuous learning processes [34]. The agent learns strategies and makes beneficial choices through the information fed back by the environment. The Q-Learning algorithm, as one of the classic reinforcement learning algorithms and mainly solves reinforcement learning problems by establishing tables to store Q-values. DQN is a combination of Q-Learning and neural networks. The neural network obtains Q-values for corresponding behaviors through input state and behavior analysis of the network structure, which directly replaces the generation of Q-tables in Q-Learning and improves the efficiency of reinforcement learning [34].
The contributions of this work can be summarized as follows:
(1)
We propose a new path loss calculation scheme that can be used for information transmission between vehicles in tunnels. In the proposed scheme, not only the factors of the road and tunnel wall are considered, but also the differences in reflection coefficient between the road materials and tunnel wall fireproof coatings, which can better improve the accuracy of vehicle information transmission.
(2)
We propose a solution based on a reinforcement learning algorithm to improve the efficiency of vehicle RSU collaboration, to solve the problem of poor communication performance between vehicles in tunnels and improve the information transmission efficiency. By utilizing V-MIMO technology, vehicles can share their own data with each other, and vehicles and RSUs can also collaborate to transmit data.
The structure of the article is as follows: The first chapter introduces the relevant theories, and then the second chapter is divided into three parts. The first part is about the calculation of path length and loss, the second part is about the analysis of the V-MIMO model applied to vehicles, and finally the third part is an analysis of the simulation results.

2. System Model

2.1. Analysis of Path Loss in a Tunnel

2.1.1. Path Length

In order to improve the accuracy of vehicle information transmission in a tunnel, it is necessary to design a more suitable and accurate signal propagation model, the following assumptions were made before proposing the system model.
First, suppose the road surface in the tunnel is concrete or asphalt. Considering the particulars of the tunnel, the top of the tunnel is partly coated with fireproof paint, and the color of the fire retardant paint is black or white.
Second, suppose the speed of vehicles is constant and the moving direction is the same when driving inside the tunnel. The height of each vehicle is H 2  = 1.5 m. The transmitter and receiver are located in the center of the vehicle and keep in the same horizontal position. The euclidean distance between the two communication vehicles is within 10 m.
Then, suppose the top of the tunnel wall and the ground are flat, and the signal reflected from the top or the ground is regarded as specular reflection [34].
Finally, due to the particularity of the tunnel environment, there are countless indirect paths for O B U 1 to transmit signals to O B U 2 , as shown in Figure 1. In this closed environment, this space is composed of countless two-dimensional planes, and the signal propagates in each two-dimensional plane, so we can intercept a plane perpendicular to the ground for research.
Shown in Figure 1 is the model proposed in this paper, where both the incident and reflected rays are on a two-dimensional plane. When the two vehicles drive at a constant speed and are relatively stationary, the signal propagation between O B U 1 and O B U 2 should also be in a two-dimensional plane. There are two paths for the signal propagation of the vehicle in the tunnel. The first is the direct path marked by the red line in Figure 1, where O B U 1 directly transmits the signal to O B U 2 . The second is the indirect path, which is divided into two types. One is where the propagating signal passes through the ground and then reflects to O B U 2 , as shown by the yellow line in Figure 1. The other is where the propagating signal passes through the top of the tunnel wall and then reflects to O B U 2 , as shown by the blue line in Figure 1 [35]. The green line represents the ground reflection first, then the tunnel top reflection. The violet line represents the reflection from the top of the tunnel first and then from the road surface.
The following is a detailed analysis of the signal propagation path according to the difference in the number of signal reflections.
(1)
One-time reflection path
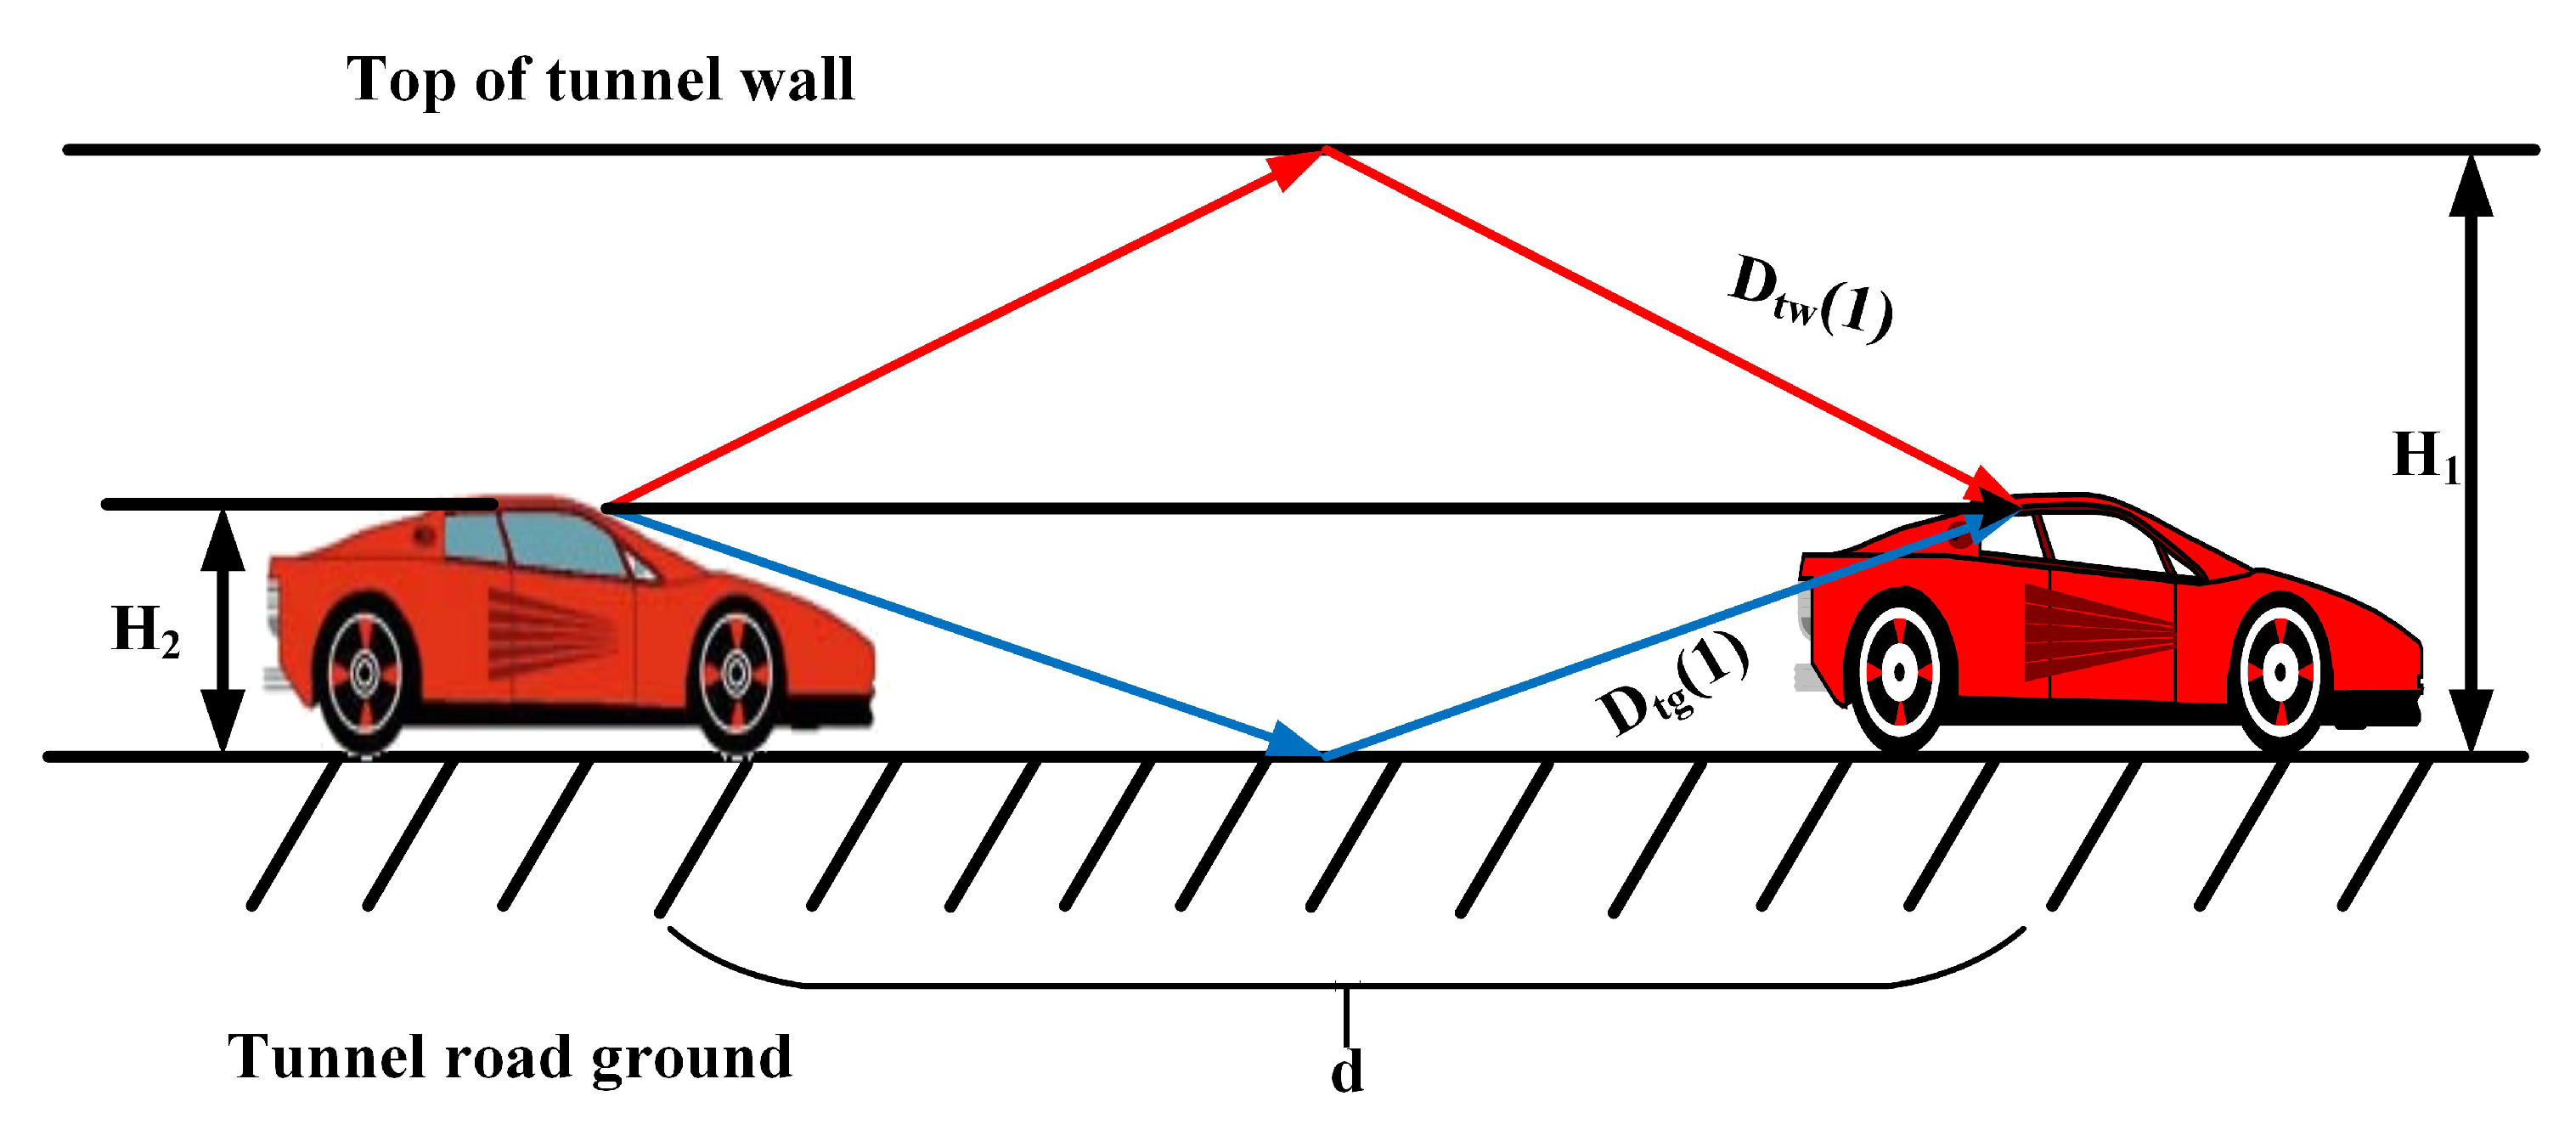
As shown in Figure 2, H 1 is the height of the tunnel, H 2 is the height of the car, and d is the length of the direct propagation path of the signal between OBUs, which directly reaches the receiver without any reflections. D t w (1) is the length of the indirect propagation path between vehicles, which reaches the receiver through tunnel wall reflection, and D t g (1) is the length of the indirect propagation path between vehicles, which reaches the receiver through ground reflection. According to the geometric relationship presented in Figure 2, D t g (1) and D t w (1) can be obtained:
D t g ( 1 ) = ( 2 H 2 ) 2 + d 2
D t w ( 1 ) = ( 2 H 1 2 H 2 ) 2 + d 2
(2)
Two-time reflection path
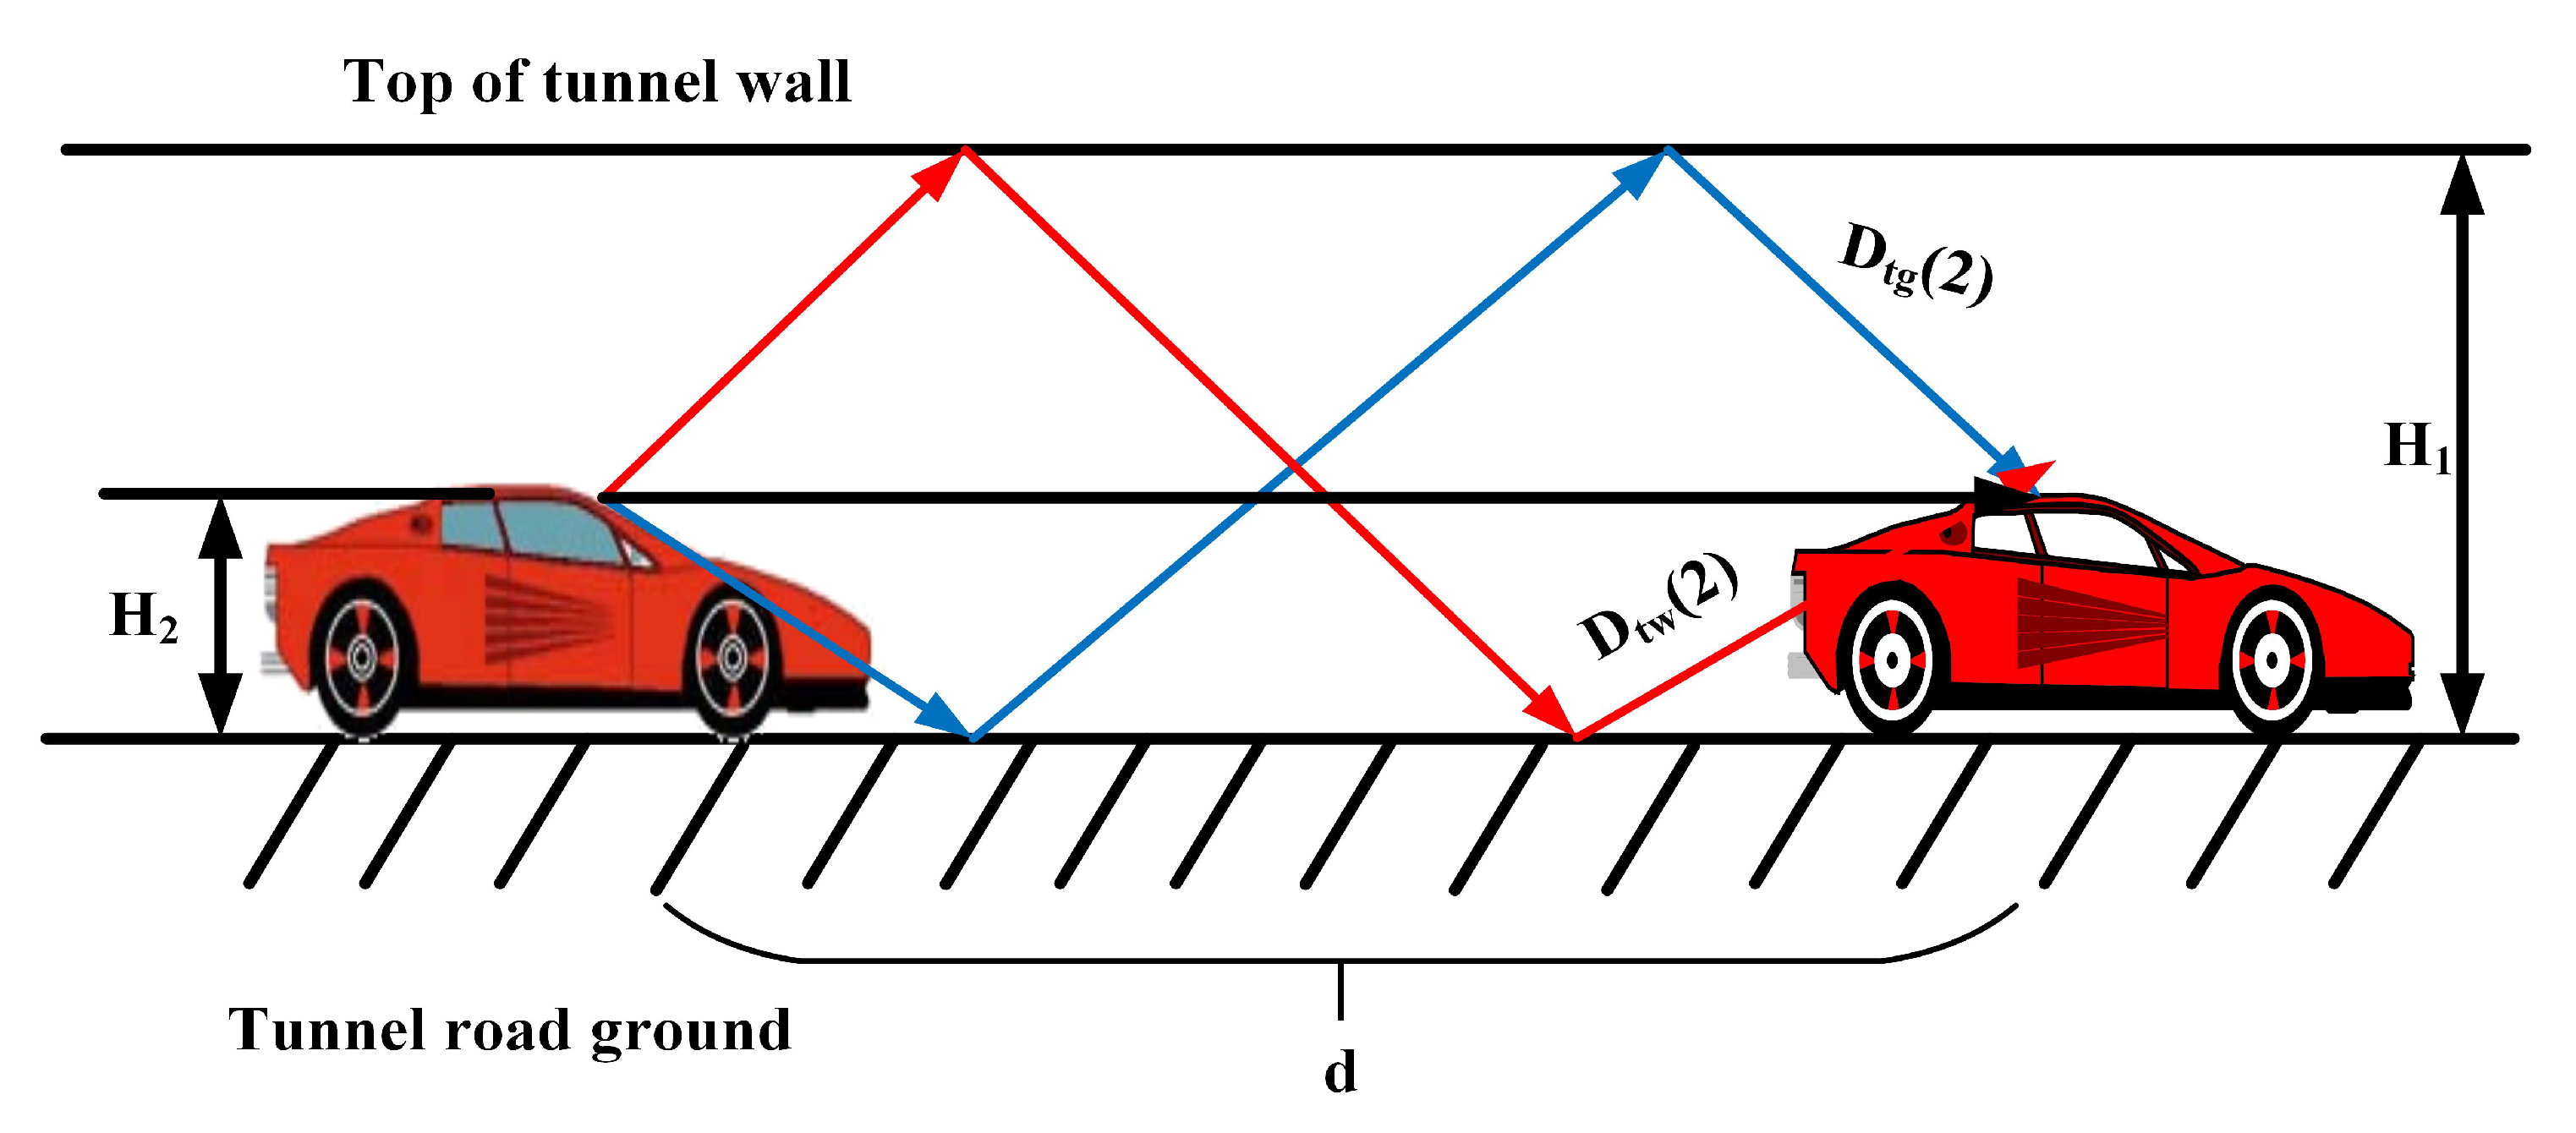
Figure 3 shows the two-time reflections path. The blue line D t g (2) represents the ground reflection first, then by the tunnel top reflection. The red line D t w (2) represents the reflection from the top of the tunnel first and then from the road surface. According to the geometric properties shown in Figure 3, the path lengths for the two-time reflection can be expressed as
D t g ( 2 ) = ( 2 H 1 ) 2 + d 2
D t w ( 2 ) = ( 2 H 1 ) 2 + d 2
(3)
Three-time reflections path
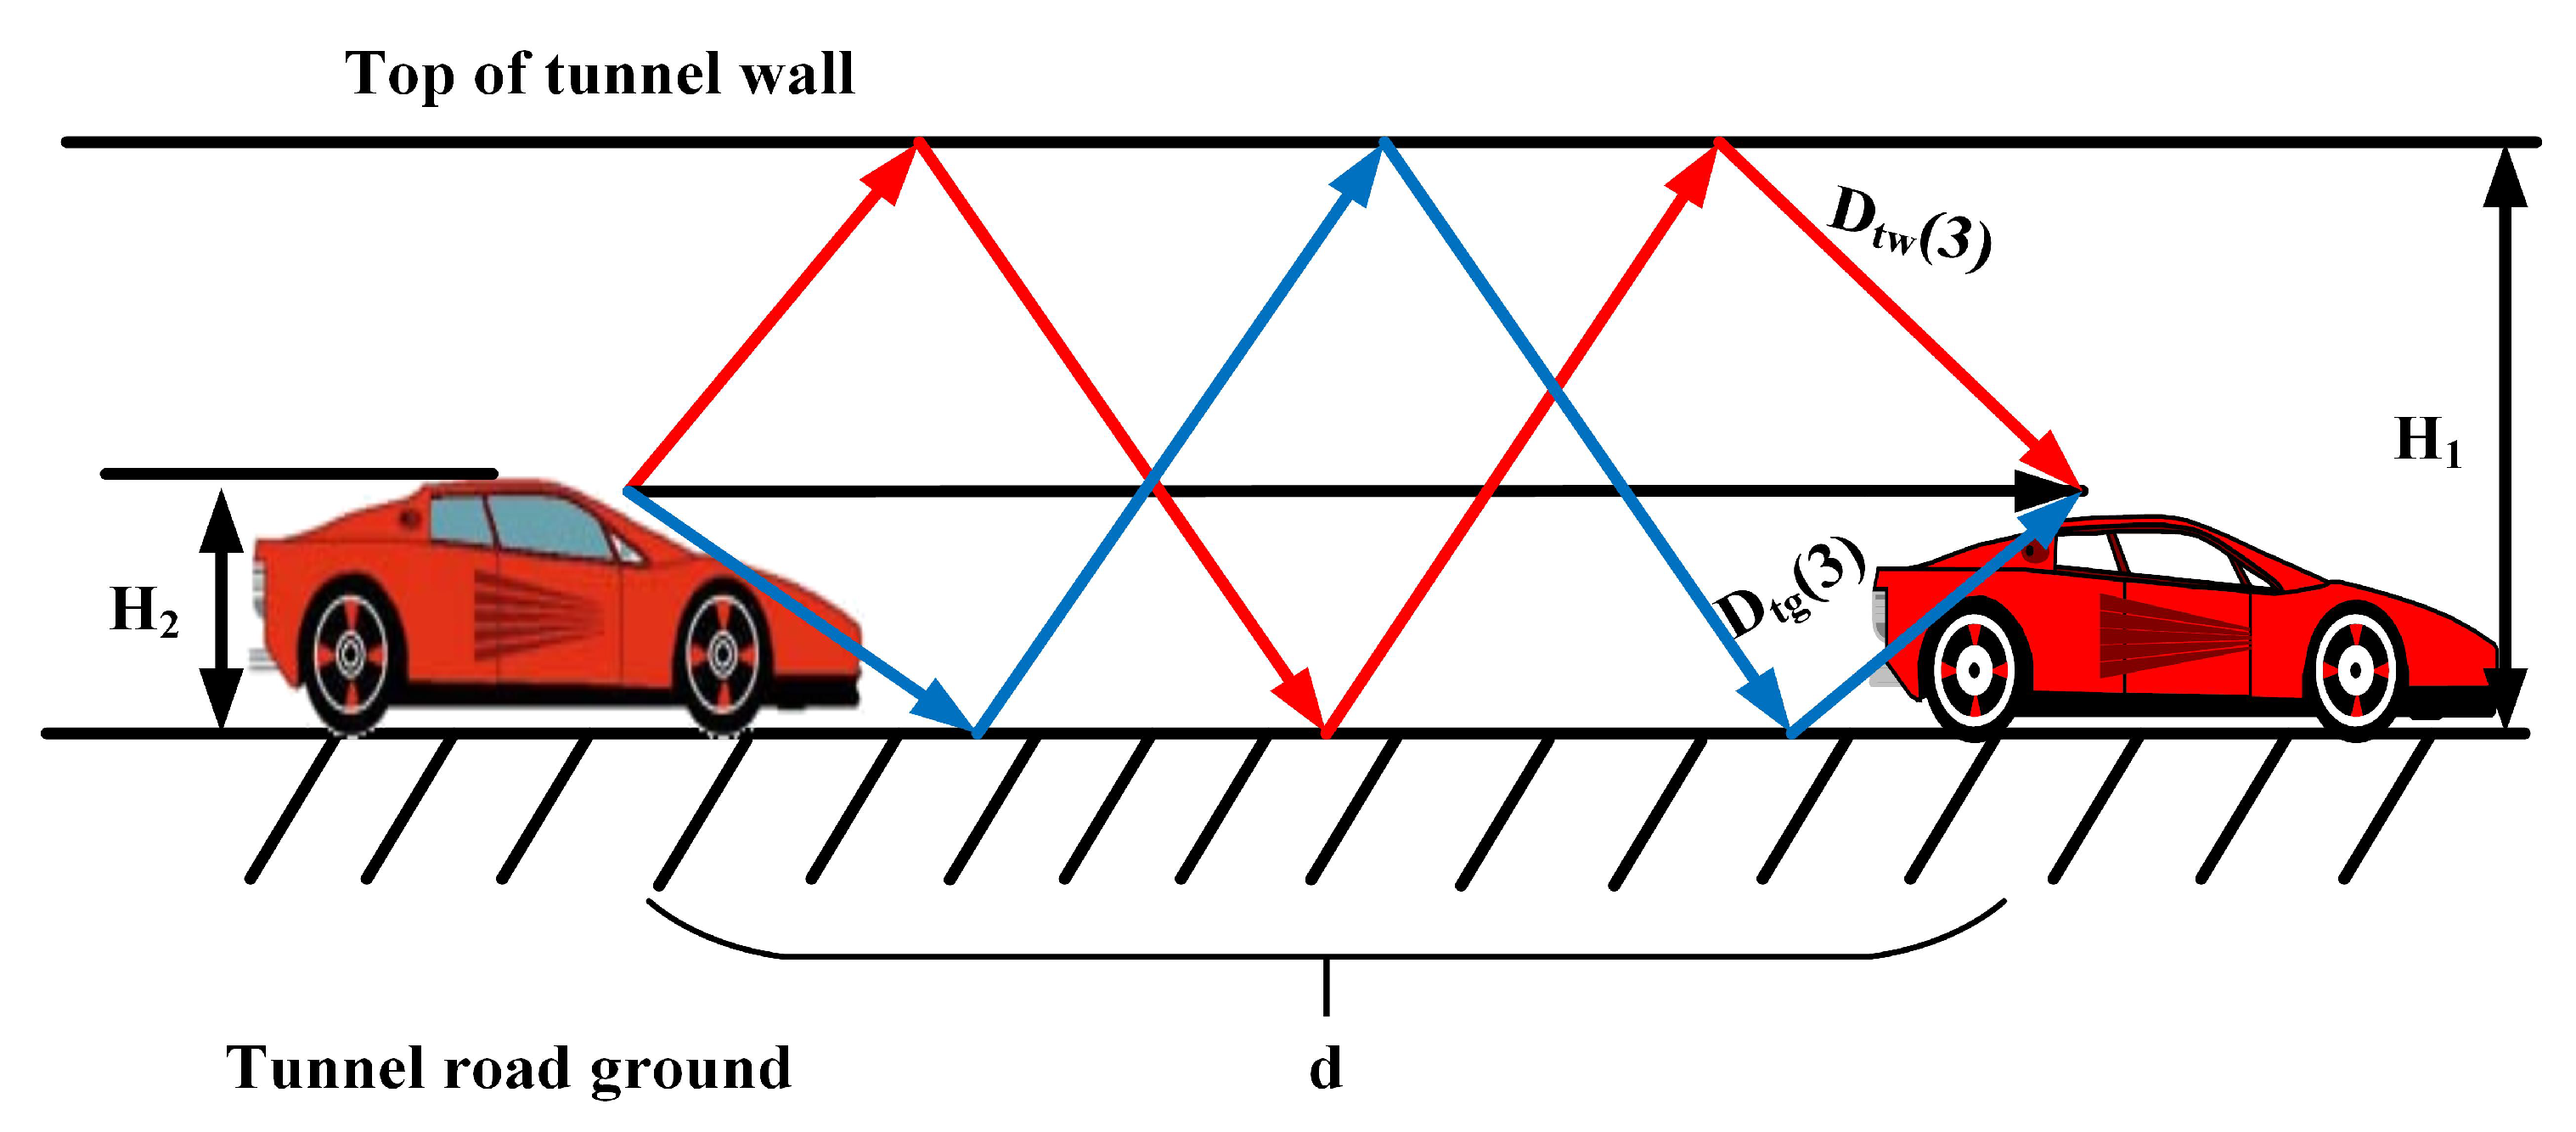
Figure 4 shows the three-time reflection path. The blue line D t g (3) represents the first reflection from the road surface, followed by the reflection from the top, and then the reflection from the road surface, and finally reaching the receiver. The red line D t w (3) represents the reflection first from the top, next the reflection from the road surface, and then the reflection from the top, and finally reaching the receiver. According to the geometric properties of the Figure 4, the following results can be obtained for the three-time reflection case:
D t g ( 3 ) = ( 2 H 1 + 2 H 2 ) 2 + d 2
D t w ( 3 ) = ( 4 H 1 2 H 2 ) 2 + d 2
(4)
n-time refelection path
According to the above Formulas (1)–(6), we can deduce the length of the signal propagation path after n times of reflection:
D t g ( n ) = { { n [ 0.5 + 0.5 × ( 1 ) n + 1 ] } H 1 + [ 1 + ( 1 ) n 1 ] H 2 } 2 + d 2
D t w ( n ) = { { n + [ 0.5 + 0.5 × ( 1 ) n + 1 ] } H 1 + [ ( 1 ) n 1 ] H 2 } 2 + d 2
where D t g (n) represents the path length that starts to be reflected by the road surface, and D t w (n) represents the path length that starts to be reflected by the top of the tunnel. Due to the different reflection coefficients, the total length of the path from the ground to the top of the tunnel is D t g d (n):
D t g d ( n ) = 0.5 × D t g ( n ) n = e v e n n     1 2 n D t g ( n ) n = o d d
Reflected from the ground, the total length of the path that has traveled to the road is D t g s (n):
D t g s ( n ) = 0.5 × D t g ( n ) n = e v e n n   +   1 2 n D t g ( n ) n = o d d
In the same way, starting from the top of the tunnel, the total length D t w d (n) of the path going to the road is:
D t w d ( n ) = 0.5 × D t w ( n ) n = e v e n n     1 2 n D t w ( n ) n = o d d
Reflected from the top of the tunnel, the total length of the path that has traveled to the top of the tunnel D t w s (n):
D t w s ( n ) = 0.5 × D t w ( n ) n = e v e n n   +   1 2 n D t w ( n ) n = o d d

2.1.2. Path Loss Calculation

For a directly propagated signal, the signal power can be expressed as [9]
P L = ( G t G r ) λ 4 π Γ e ( j 2 π d / λ ) L
where G t and G r are the gains of the O B U 1 and O B U 2 antennas, and Γ is the reflection coefficient, λ is the wavelength, and L is the total length of the path.
For a signal that is reflected n times from the road ground, the signal power can be calculated as
P D t g = ( G t G r ) λ 4 π ( Γ 1 e ( j 2 π D t g s / λ ) D t g s + Γ 2 e ( j 2 π D t g d / λ ) D t g d )
Γ 1 is the reflection coefficient of the signal passing through the road surface, and Γ 2 is the reflection coefficient of the signal passing through the top of the tunnel.
Similarly, for the signal that starts to reflect n times through the top of the tunnel, the signal power can be calculated as:
P D t w = ( G t G r ) λ 4 π ( Γ 1 e ( j 2 π D t w d / λ ) D t w d + Γ 2 e ( j 2 π D t w s / λ ) D t w s )
Thus, the total power of signal transmission is equal to the signal power of direct propagation plus the signal power of indirect propagation, which is presented in the following formula:
P t o t a l = P L + i = 1 n ( P D t g + P D t w )
The path loss when arriving at the OBU is
L O B U = 10 lg P t o t a l P L 1
According to the ITU-RP.1238 propagation model [36], the path loss for the tunnel free space transmission can be written as
L t f = 20 lg f + 20 lg d 28 ( d B )
Therefore, the total path loss of the vehicle in the tunnel is expressed as
L sum = L t f + L O B U

2.2. V-MIMO Model in a Tunnel

2.2.1. The Probability of Successful V2R (Vehicle-to-RSU) Transmission in a Tunnel

The V-MIMO system is composed of several vehicles and RSUs that support receiving and transmitting terminals. The adjacent relay transmitting and receiving terminals form a multi-level distributed V-MIMO system. When transmitting information, the transmitting vehicle shares the information to be sent with other wireless terminals that form multiple inputs within a certain range, ensuring that other terminals within the multiple inputs will contain copies of the sent data. Then, all wireless terminals with multiple inputs unite to send the data to the next multi-input terminal, continuously engaging in this behavior and transmitting the information until the destination terminal receives the signal sent by the source terminal.
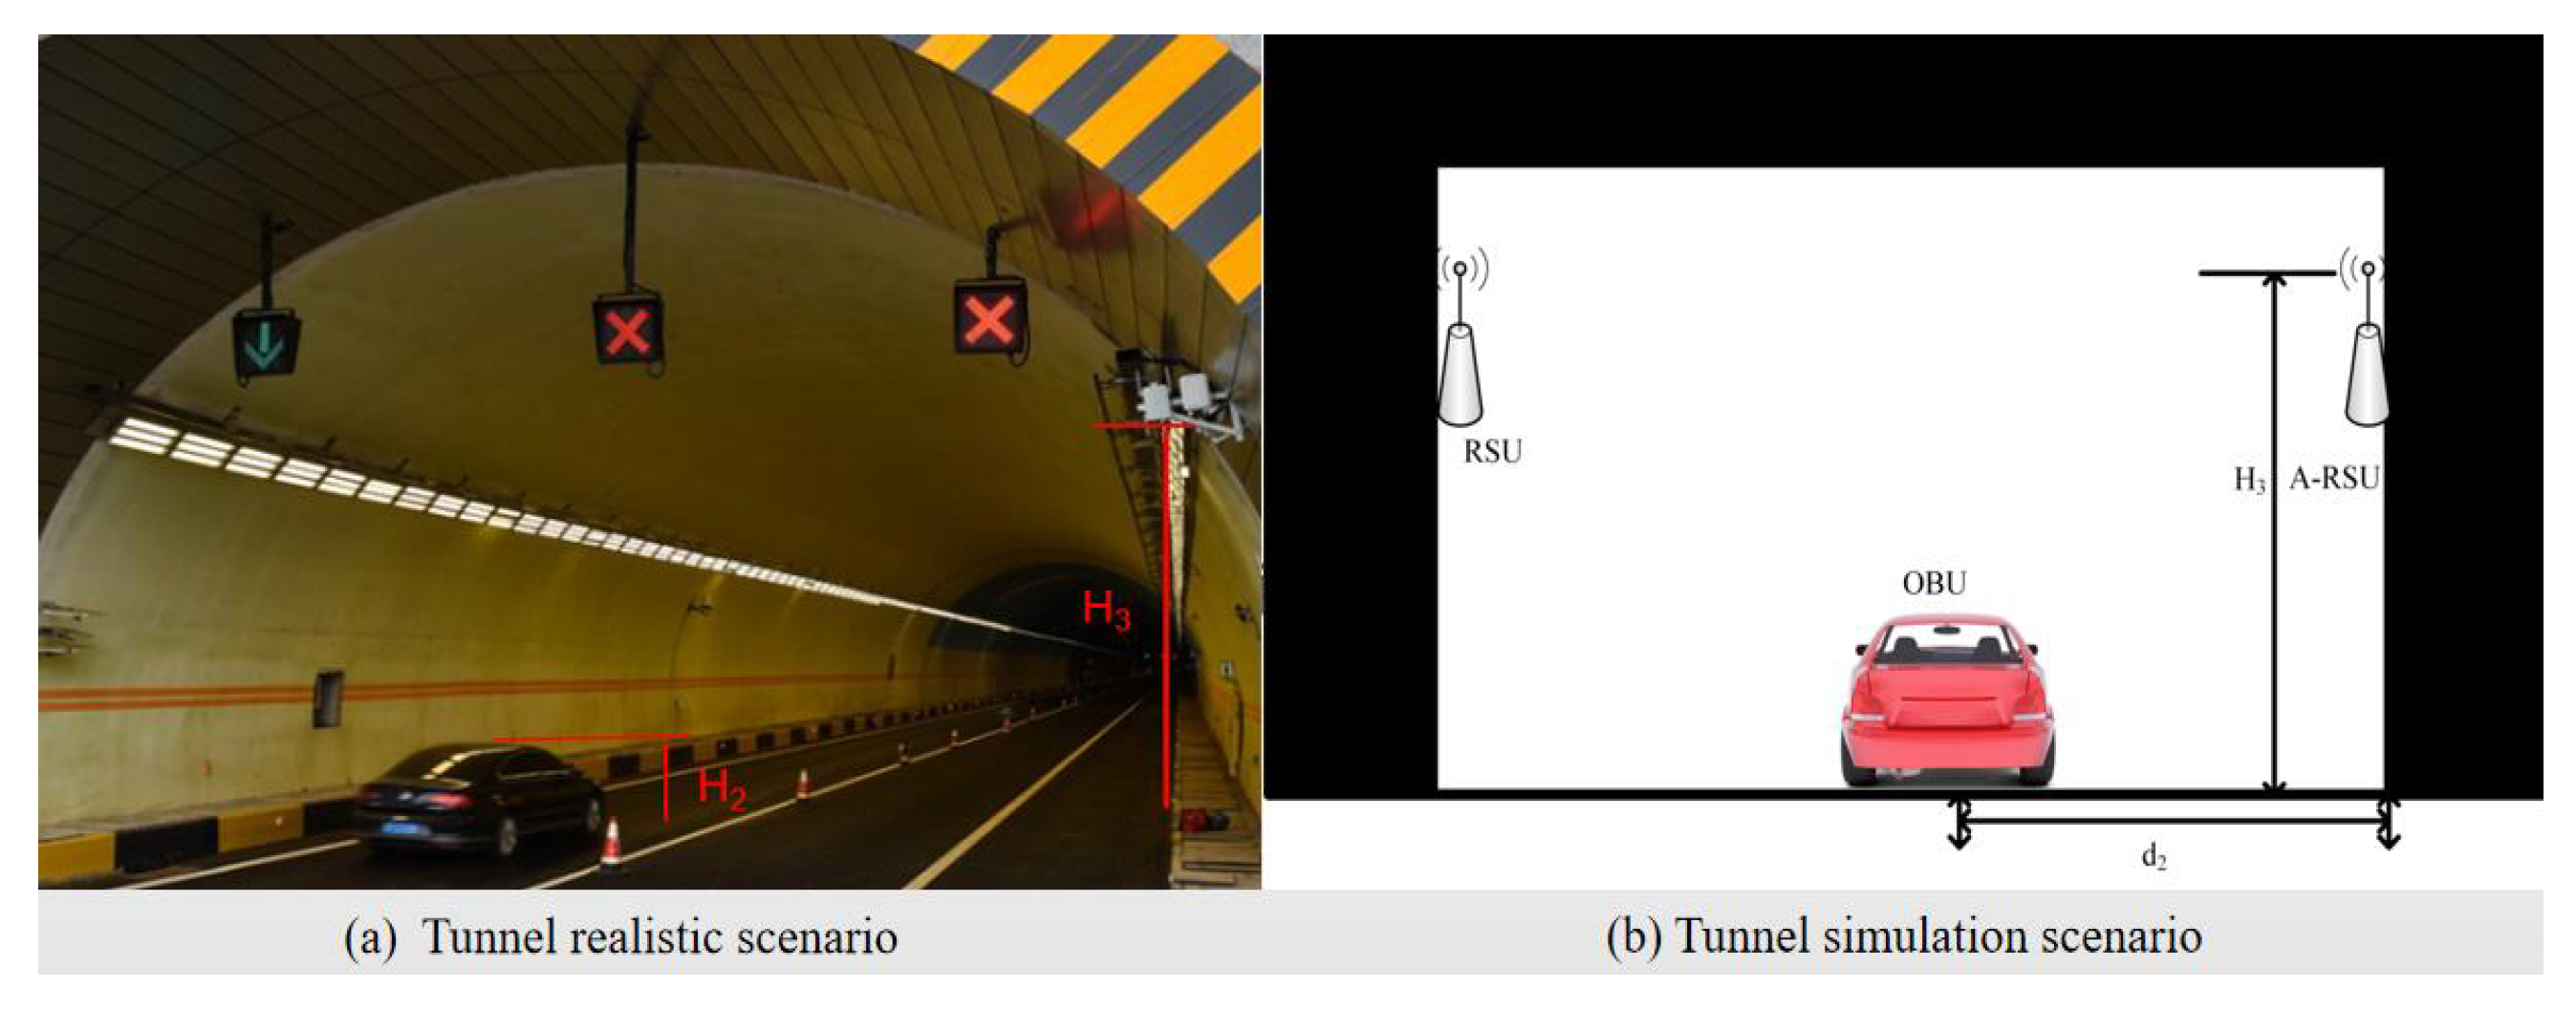
Within Figure 5, Figure 5a shows a physical image of the vehicle driving in the tunnel. In order to more intuitively express the state of the vehicle and RSU, Figure 5b shows a simulated image of a vehicle driving in the tunnel. As shown in Figure 5b, it is assumed that a pair of RSUs are deployed on the two sides of the tunnel wall. Suppose the RSUs can transmit their own messages and receive safety messages from the automotive node. One is the agent-RSU, abbreviated as A-RSU, which is a device with the capabilities of communication, computing, storage, automatic control, and so on. The other is an ordinary RSU. The height of the two RSUs from the ground is H 3 meters, as shown in Figure 5b.
For the communication transmission link established by a RSU and the vehicle user, if the free space path loss model or the shadow fading model is used, it is difficult to reflect the attenuation changes in the signal with distance and obstacles at the same time. Therefore, following the literature, a mixed channel model of line-of-sight and non-line-of-sight is used to reflect signal changes. Assuming that the distance between any OBU within the RSU signal range detection and the projected position of the RSU on the ground is d 2 , as shown in Figure 5b, the received power gain obtained by the OBU from the LOS and the NLOS respectively is as follows [37]:
G r = ( H 3 ) 2 + d 2 2 a r L O S η ( H 3 ) 2 + d 2 2 a r N L O S
where a r is the path loss index of V2R transmission, and η is the additional attenuation coefficient of NLOS transmission. H 3 refers to the distance from the A-RSU antenna position to the ground. Assume that the RSU transmit power is P t . According to the channel transmission power formula, the received power of the OBU can be obtained:
P r e = P t G r
Due to the influence of the different positions of the OBU and the height of the RSU in the tunnel environment, the probability that the OBU can establish communication with the RSU through LOS transmission is [37]
P L O S = 1 1 + A exp ( B [ arctan H 3 d 2 A ] )
where A and B are constants determined by the tunnel environment.
Correspondingly, the probability that the OBU can establish a transmission with the RSU through the NLOS transmission link is
P N L O S = 1 P L O S
Considering the two transmission situations that actually exist in tunnel communication, the total channel power obtained by the OBU can be expressed as [38]
P s u m = P L O S . P r e L O S + ( 1 P L O S ) P r e N L O S
Assuming that P n o is the noise power, then we obtain the signal-to-noise ratio(SNR) of the OBU:
S N R = P s u m P n o
Let the SNR of any OBU transmitted through V2R be γ 1 , and γ 1 can be obtained from Equation (25) above. According to the literature [37], the SNR threshold for successfully decoding the message received by the OBU in the LOS environment is γ 2 , and the SNR threshold in the NLOS environment is γ 3 . When the SNR value is greater than the SNR threshold, the OBU can pass the transmission. Therefore, for the OBU, the probability of successful transmission is expressed as
P s u c c e s s = P L O S Pr ( γ 1 γ 2 ) + P N L O S Pr ( γ 1 γ 3 ) = P L O S Pr ( d 2 P t γ 2 P n o 2 a r ( H 3 ) 2 ) + P N L O S Pr ( d 2 P t γ 3 P n o 2 a r ( H 3 ) 2 )

2.2.2. Analysis of V-MIMO Transmission in Tunnels

(1)
V-MIMO Case
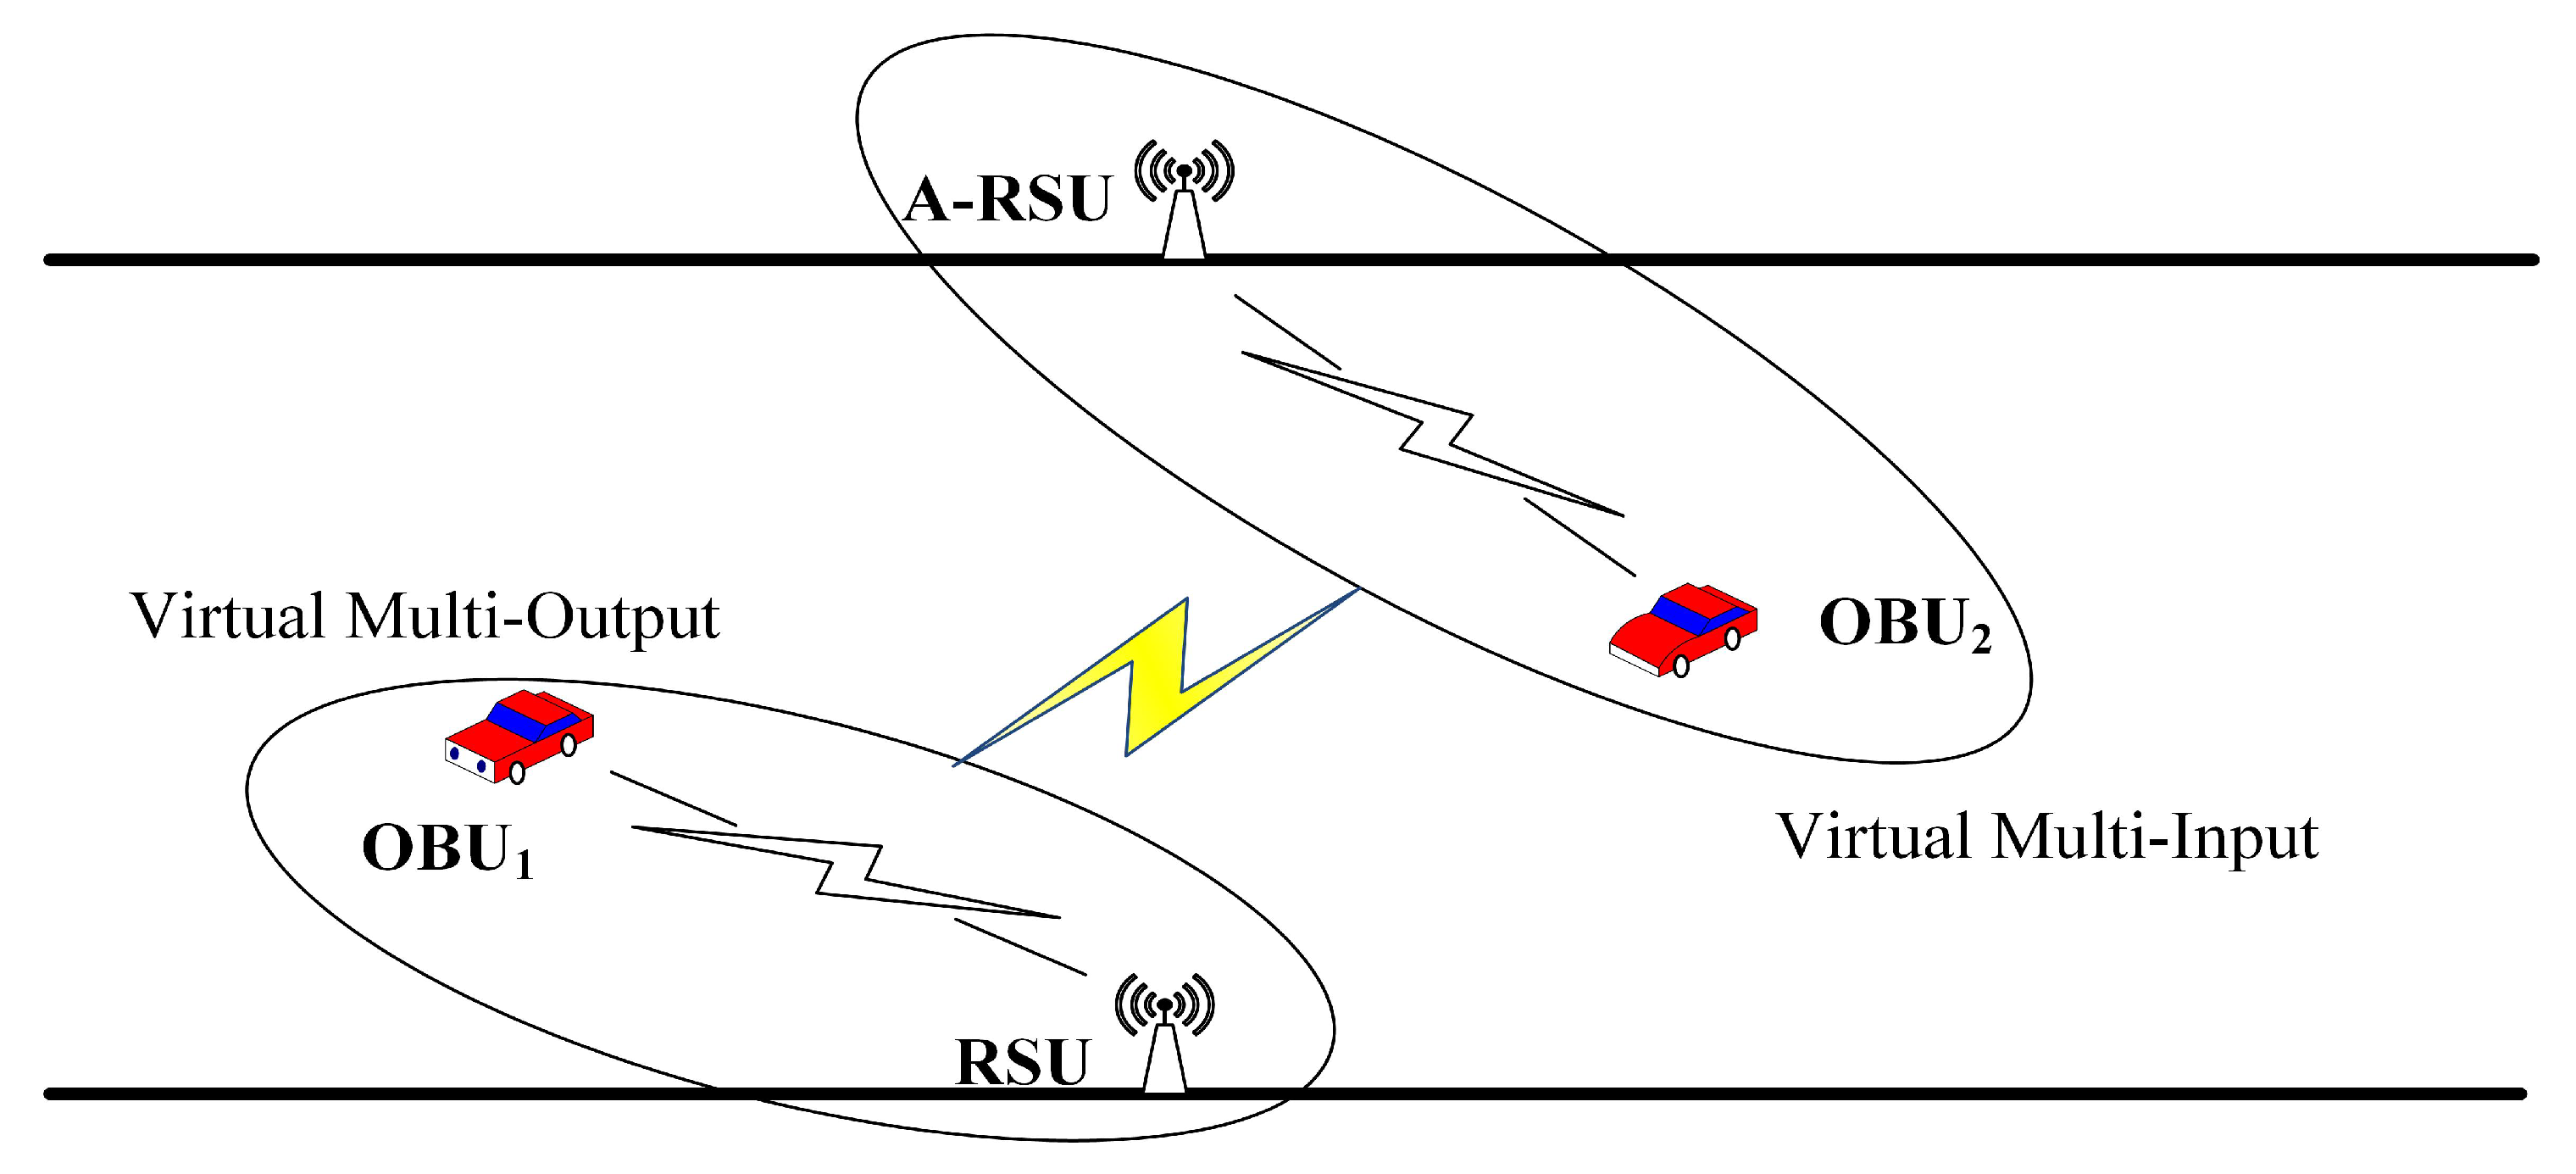
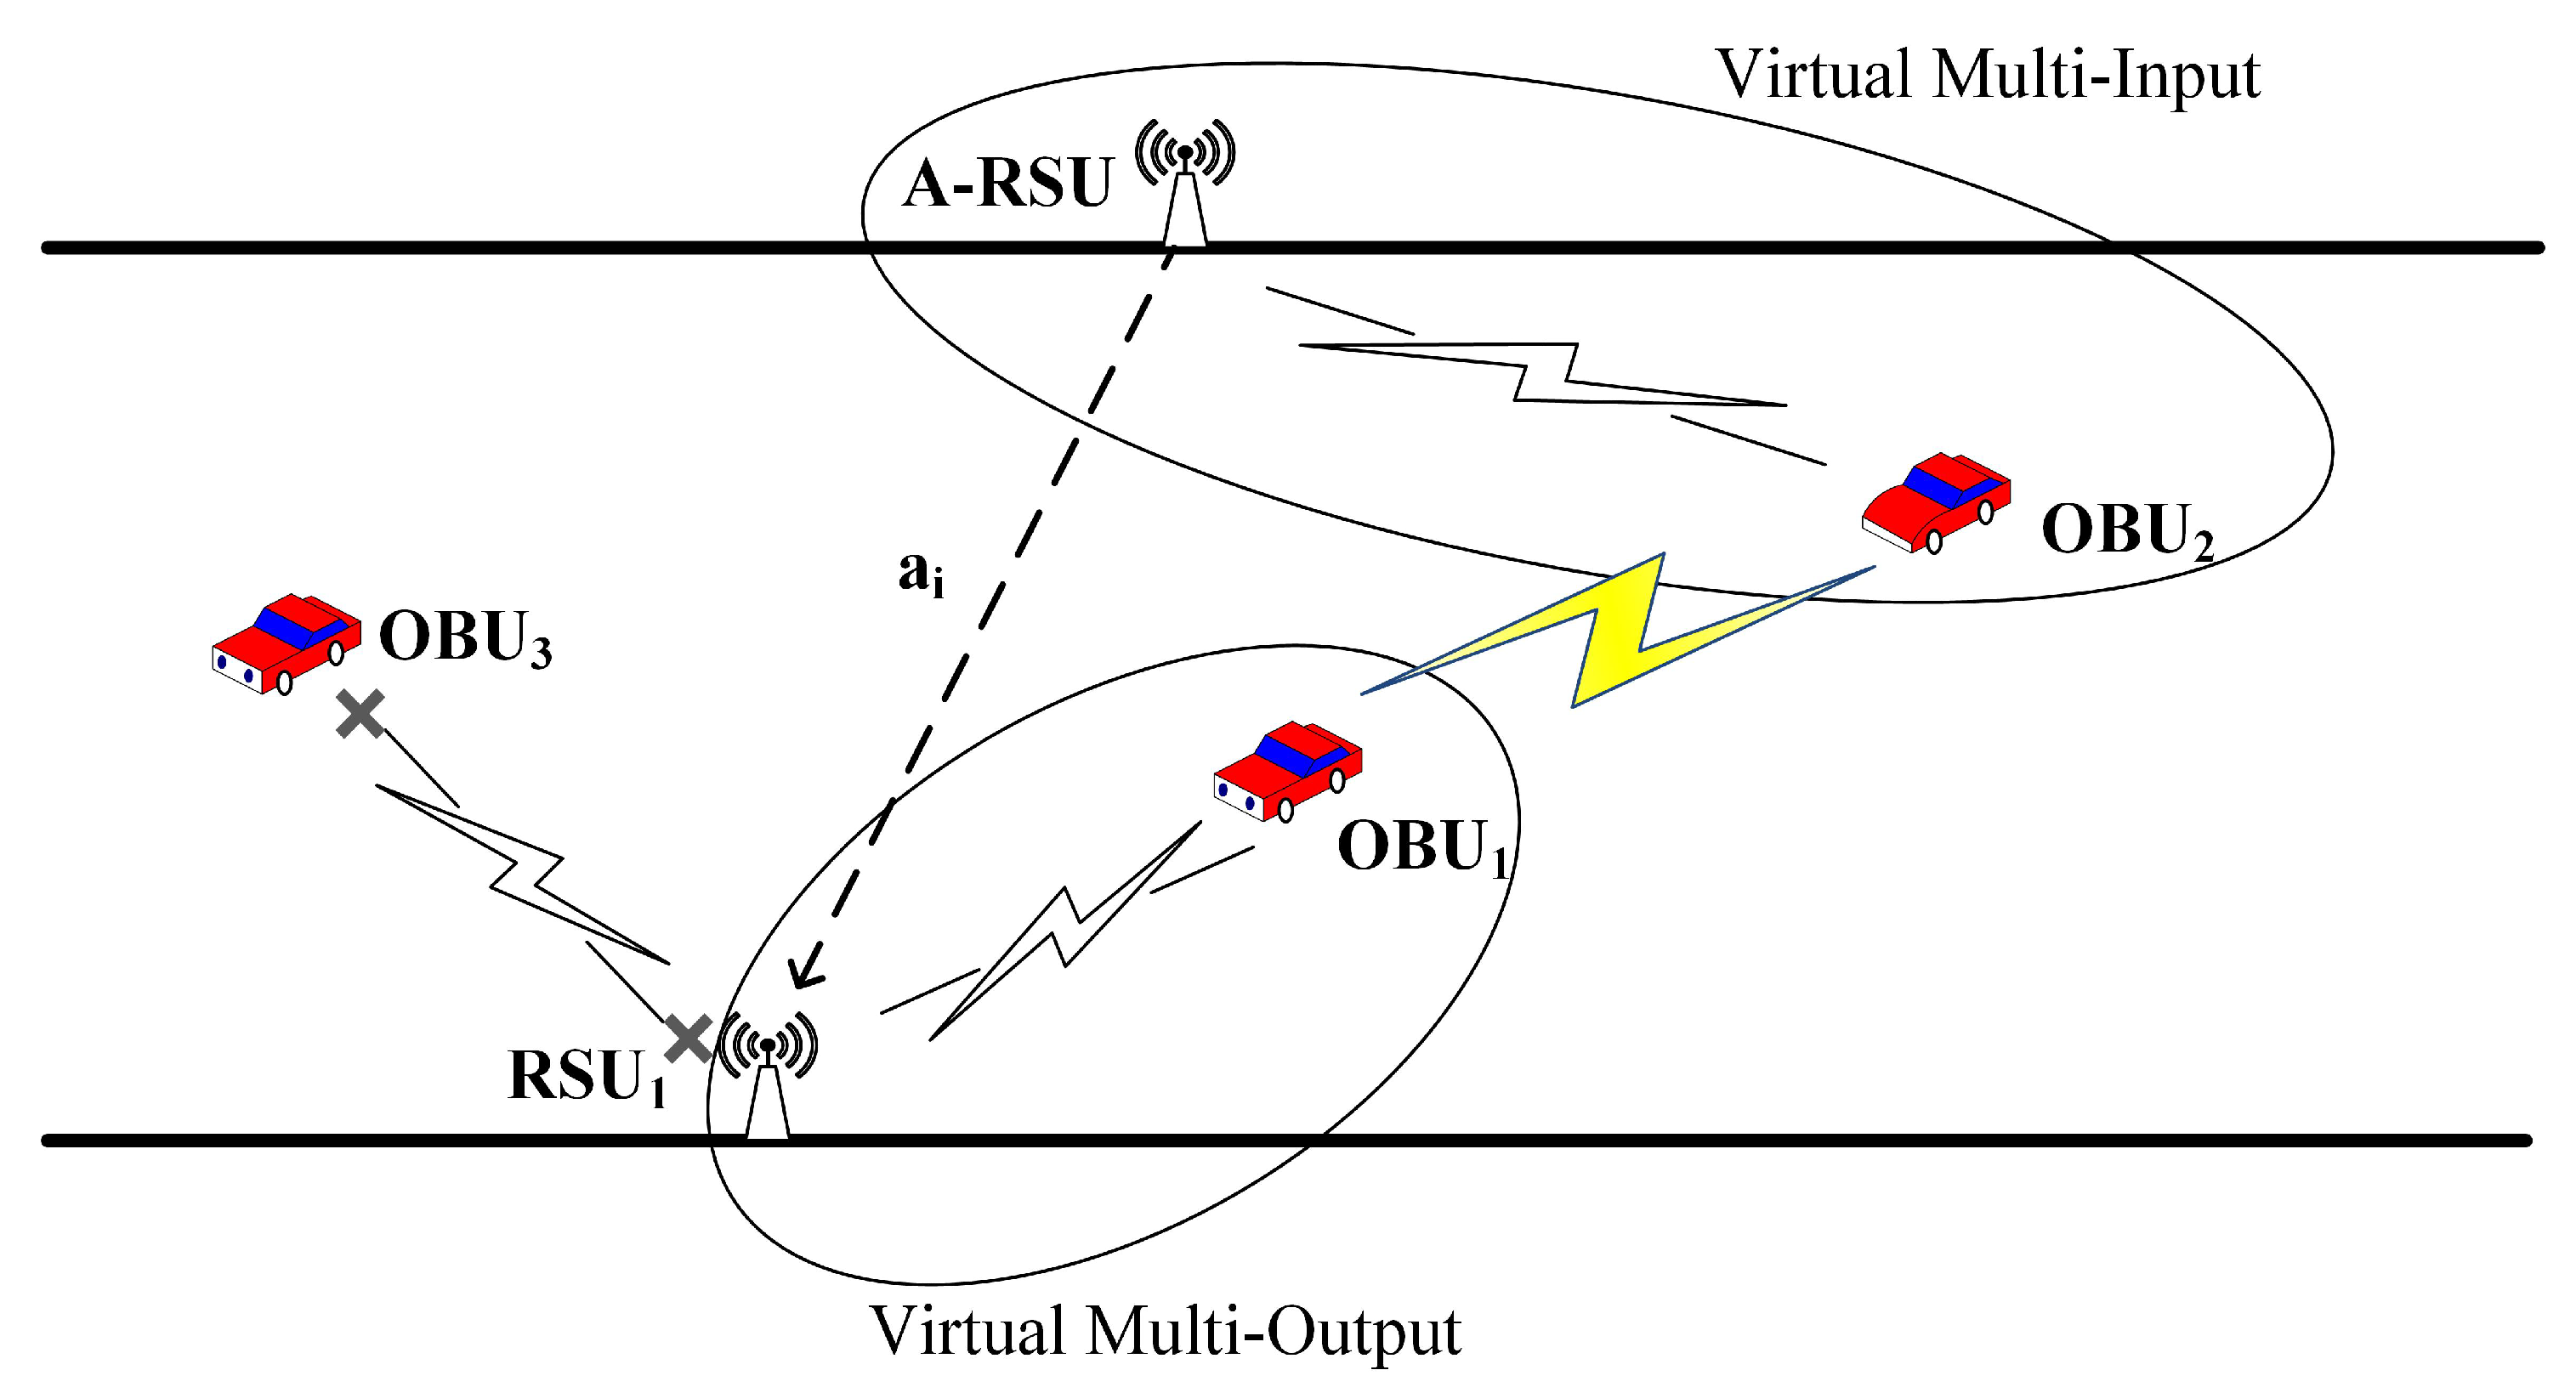
As shown in Figure 6, when the vehicle is driving in the tunnel, a V-MIMO system is formed by using cooperative communication to share each vehicles antennas with the two RSUs in the tunnel, improving the wireless communication quality. That is, the tunnel wireless cooperative communication can improve the channel capacity using the multipath fading of electromagnetic wave propagation in the tunnel, without increasing the number of antennas for each node, and thereby improving the wireless communication performance of vehicles in the tunnel.
In the Figure 6, the transmitter is a virtual multi-input, composed of O B U 2 and A-RSU; the receiver is a virtual multi-output, composed of O B U 1 and RSU; and a virtual MIMO system is formed. The signal transmission is mainly multipath fading, so it can be treated as a Rayleigh fading channel; and assuming that the CSI (channel state information) is unknown, then the capacity of the virtual MIMO system is obtained as [39]
C 1 = log 2 det ( I 2 + S N R 2 H H H ) bps / Hz
where I 2 is the second-order matrix, H is the channel matrix, H H is the conjugate transposed channel matrix, H H H is the semi-positive definite Hermitian matrix, and d e t ( ) represents the determinant of the correlation matrix. In the virtual MIMO environment, the outage probability of the V2V communication link is P o u t , which is obtained using the following:
P o u t = k m m ! e k ( 1 C j C m a x P s u c c e s s ) k ( j = 1 , 2 , 3 n )
k is the maximum number of OBUs that the A-RSU can handle within a certain range at time t, and m is the actual traffic flow. C j is the actual channel capacity, and C m a x is the maximum channel capacity that can be achieved under the current environment.
(2)
V-SIMO Case
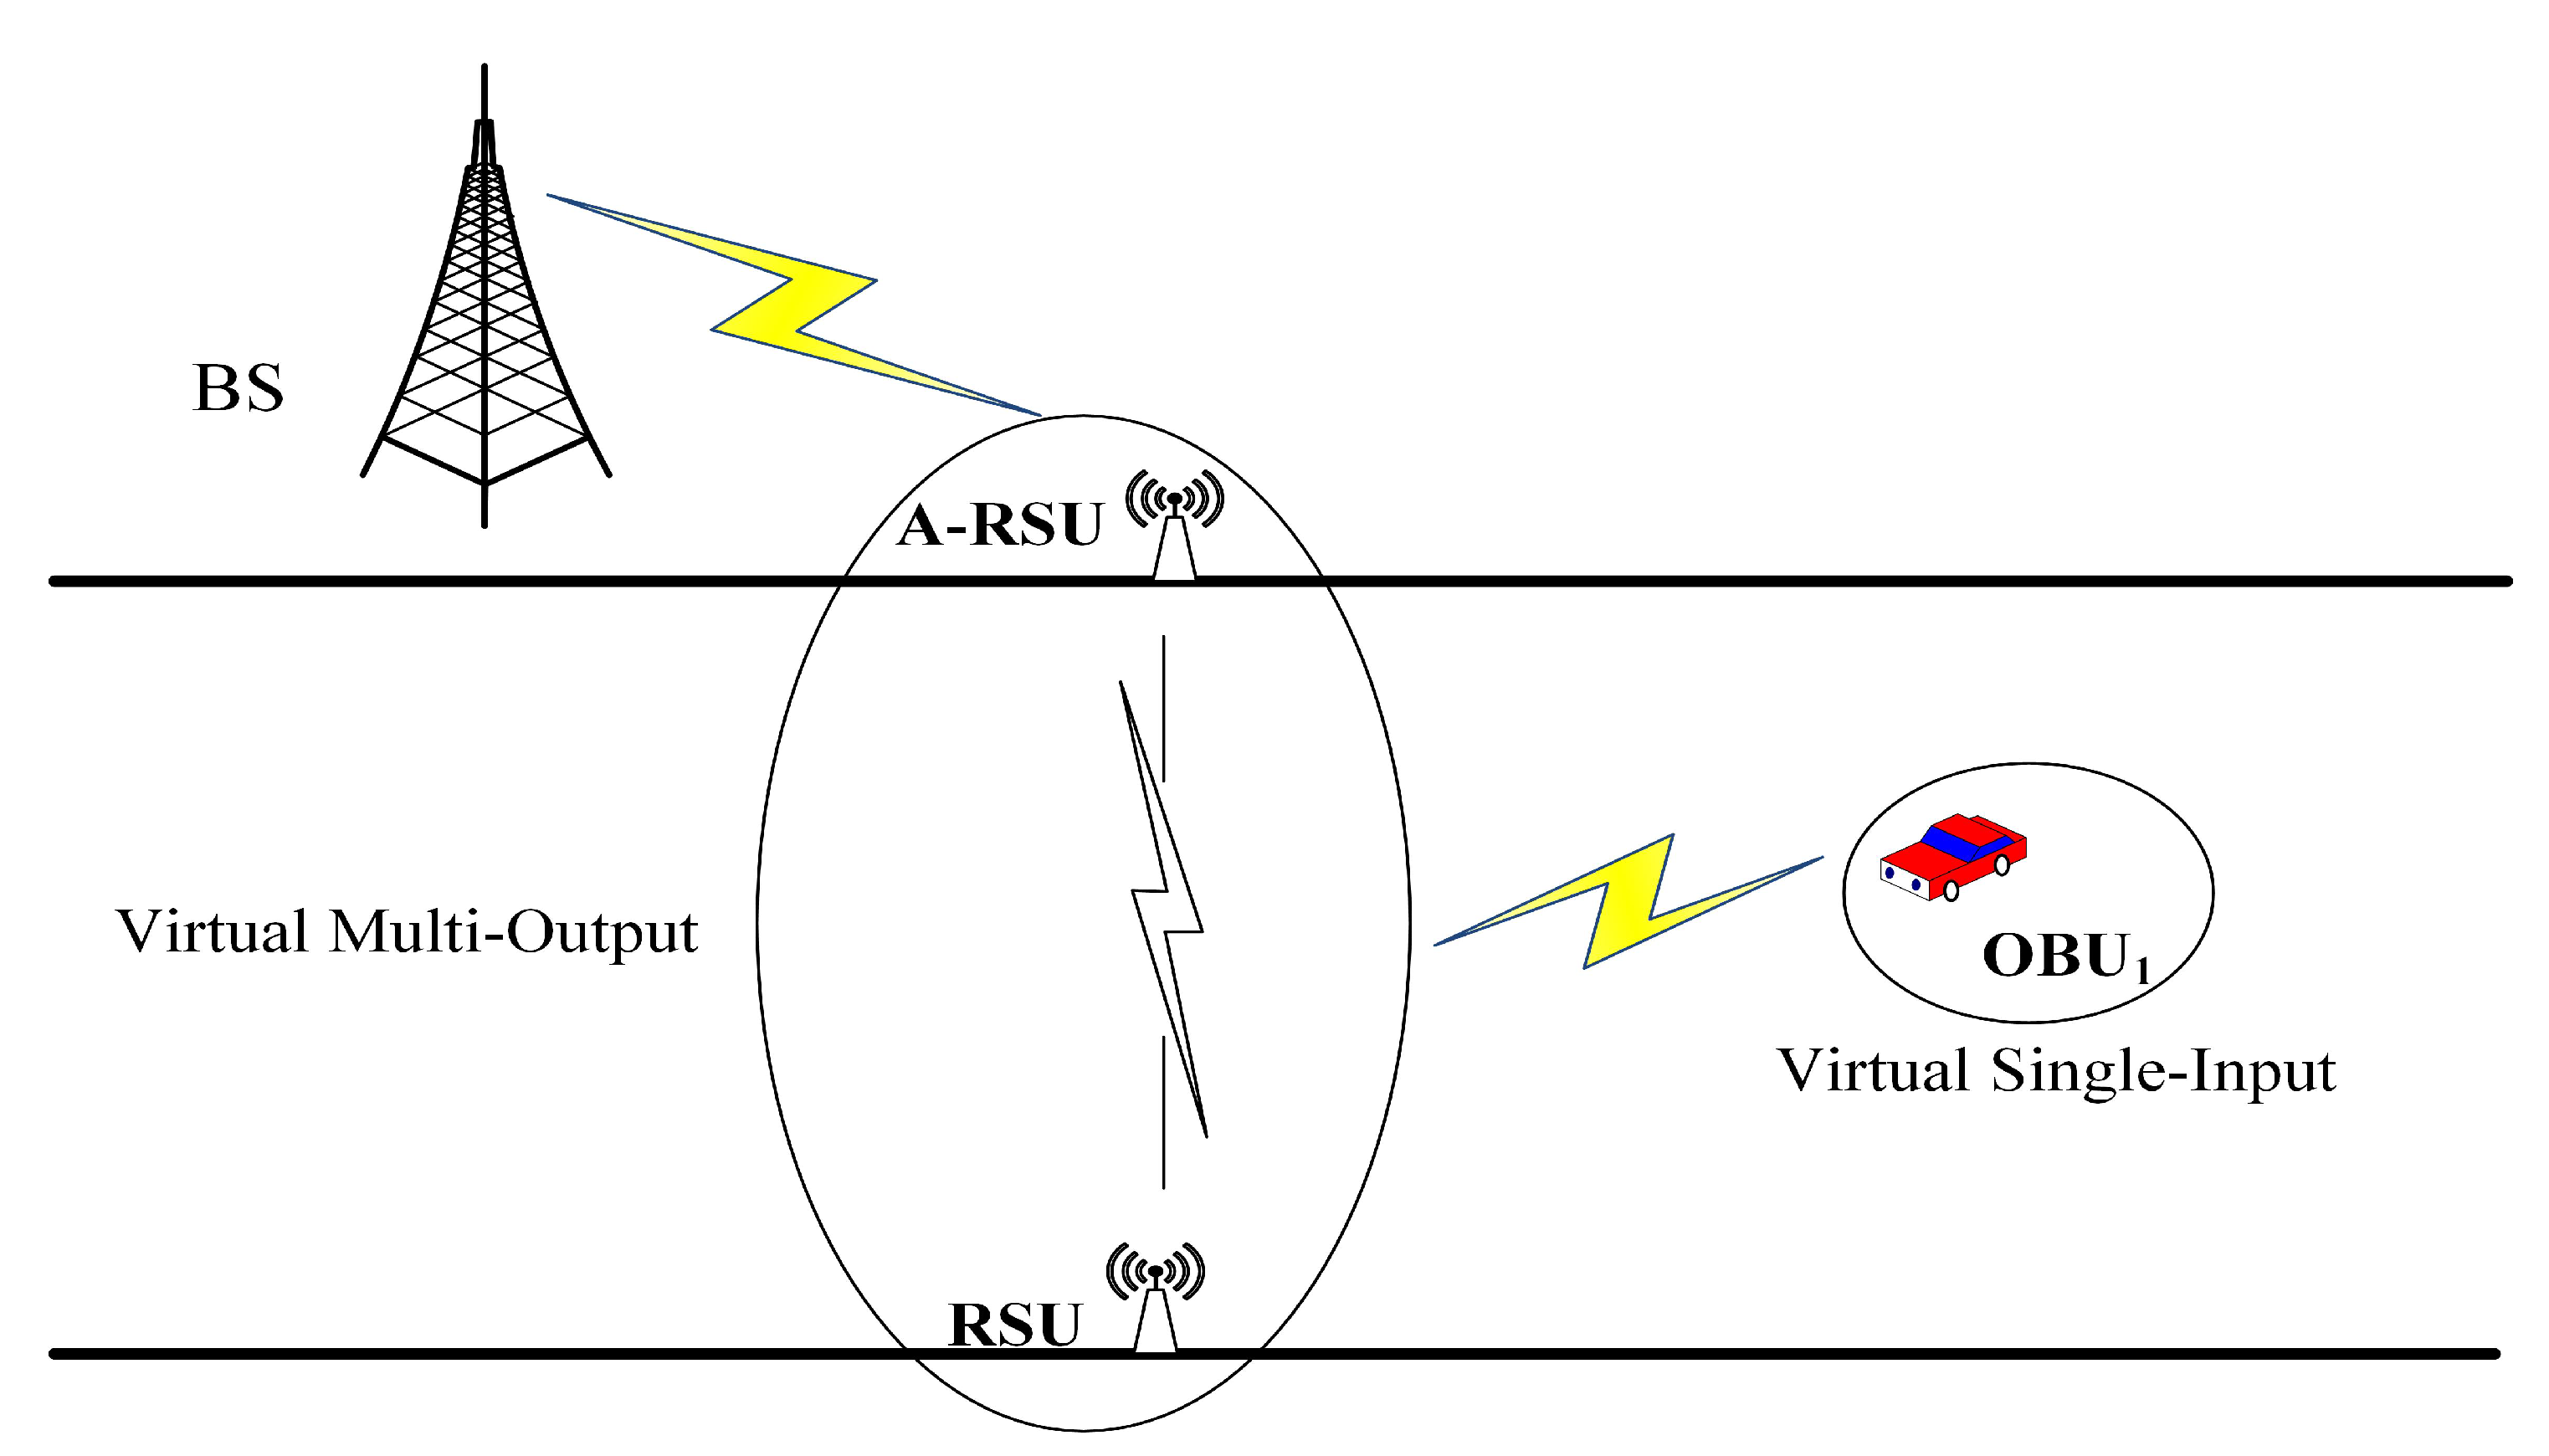
As shown in Figure 7, if there is only one vehicle driving in the tunnel, it needs to communicate with the external base station, and it transmits signals with the RSU. In this case, the O B U 1 is used as a virtual single input, and then the two RSUs are paired with each other as virtual multiple outputs, to form a virtual SIMO system. In this case, the capacity of the system is
C 2 = log 2 det ( I 2 + S N R × H H H ) bps / Hz
(3)
V-MISO Case
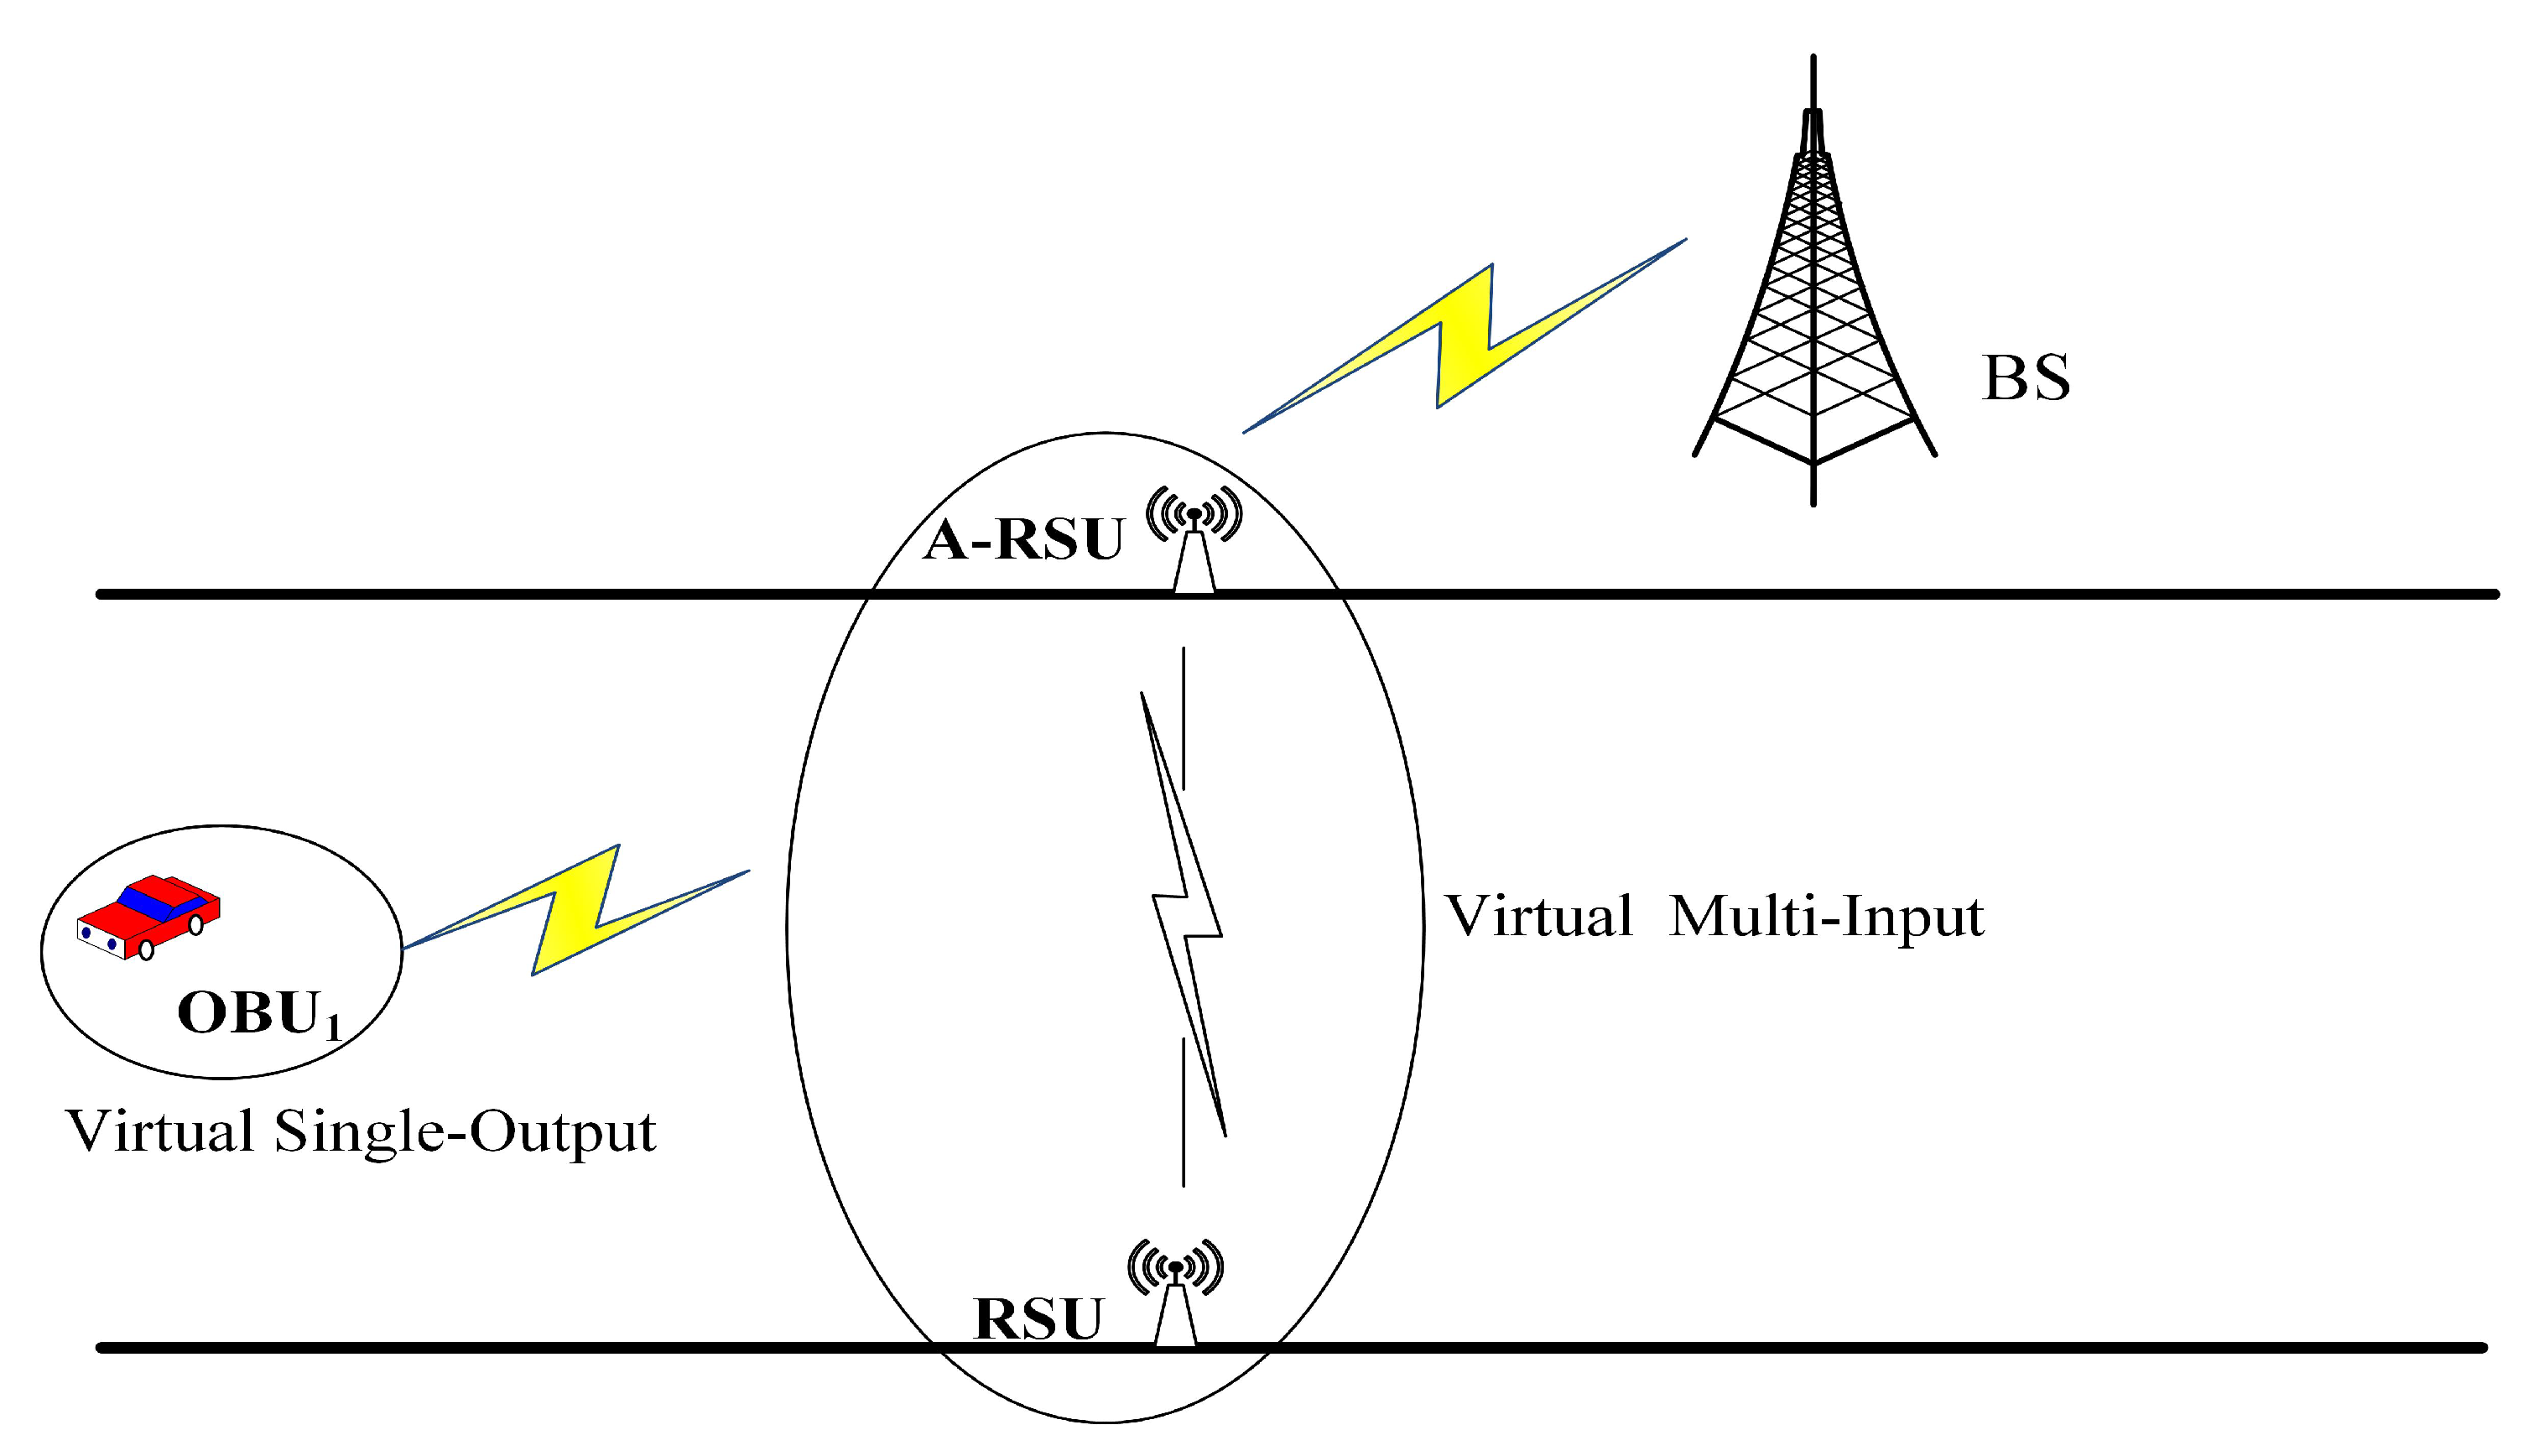
As shown in Figure 8, if there is only one vehicle driving in the tunnel, the external base station needs to transmit information using this vehicle. The base station and RSU first transmit the signals, and then the RSU sends messages to the O B U 1 . At this time, the two RSUs are paired with each other as a virtual multi-input system, and the O B U 1 is used as a virtual single output, to form a virtual MISO system. At this time, the capacity of the system is
C 3 = log 2 det ( I 1 + S N R 2 H H H ) bps / Hz
where I 1 is the first-order matrix.
(4)
V-SISO Case
As shown in Figure 9, if there is only one vehicle driving in the tunnel and only one RSU communicates with the OBU, the RSU is used as a virtual multi-input. Meanwhile, the O B U 1 is used as a virtual single output to form a virtual SISO system. At this time, the capacity of the system is
C 4 = log 2 det ( I 1 + S N R × H H H ) bps / Hz

2.3. Application of Deep Reinforcement Learning Models in Tunnels

Since the path loss between vehicles in the tunnel is relatively large, in order to better use the V-MIMO to improve the communication quality, the A-RSU requires real-time interactive decision-making with the environment. To improve the V2V communication quality, a deep-Q network using deep reinforcement learning theory, that is, the DQN method, is used to analyze the V2V communication path loss by building a reinforcement learning framework. In V2V scenarios, the current state of the system is only related to the state and action of the previous moment. Thus, this process can be viewed as a Markov decision process (MDP), which can be expressed as
M D P = ( s i , a i , p i , r i )
where s i represents the state set, a i represents the action set, p i represents the state transition probability, and r i represents the reward.
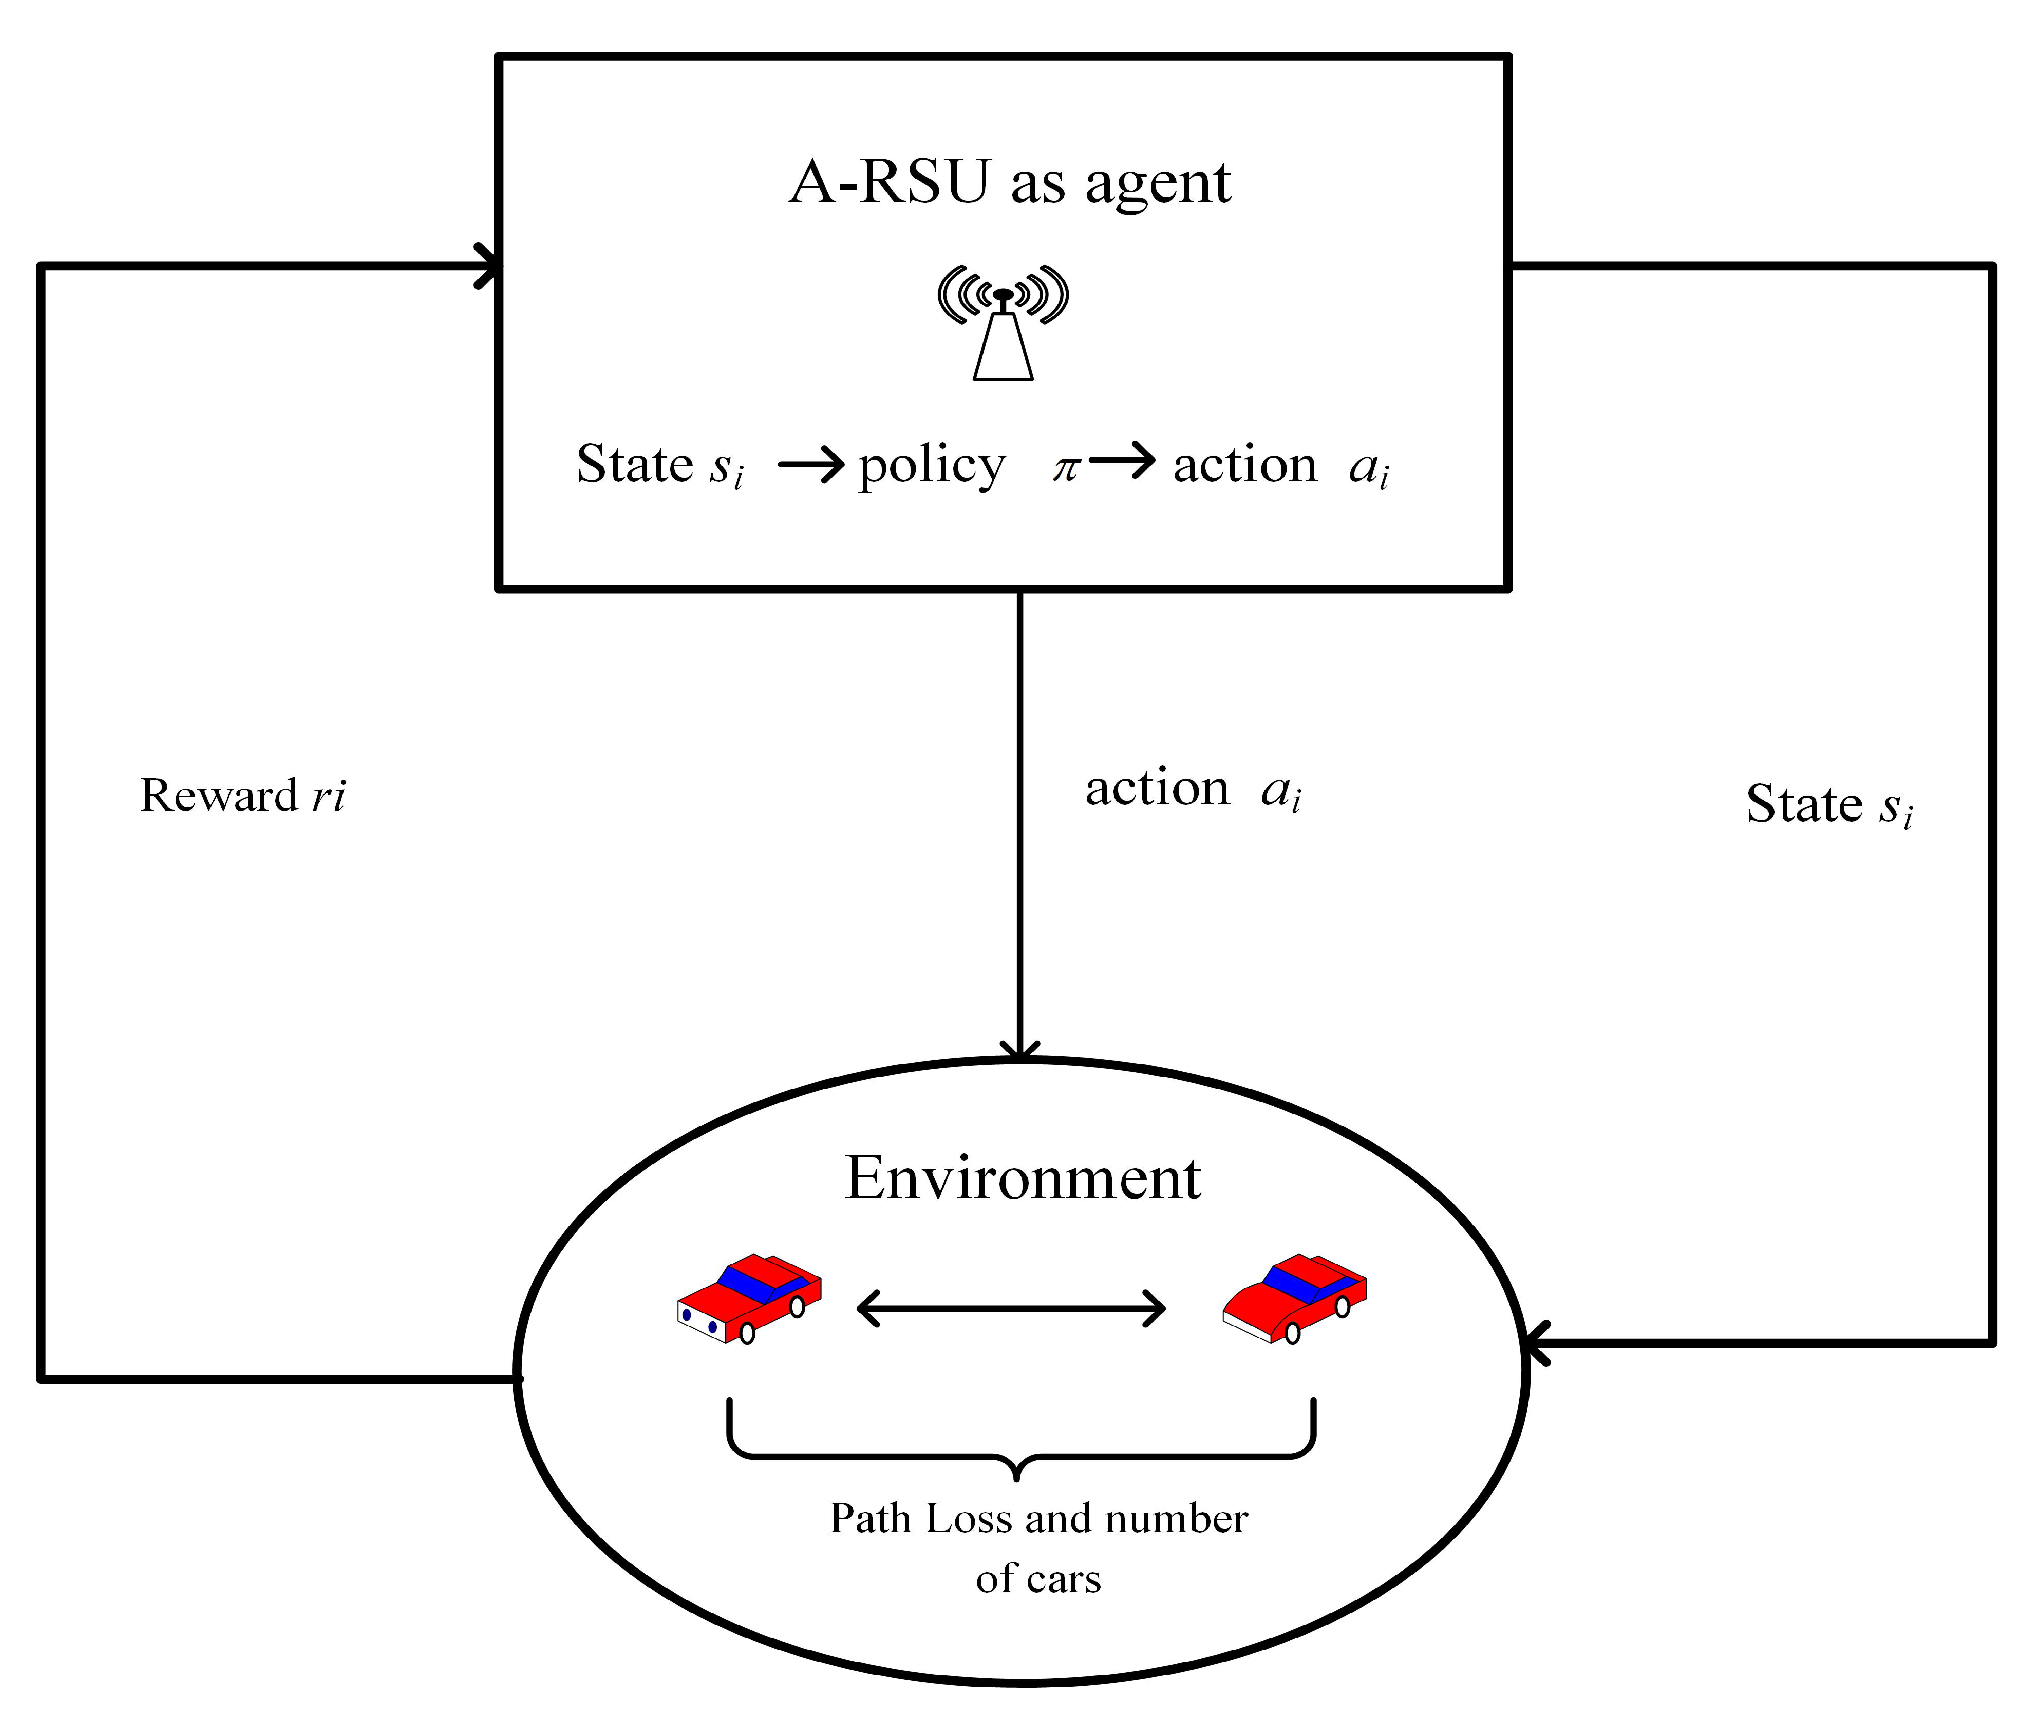
In this paper, V-MIMO technology is combined with a deep reinforcement learning algorithm DQN (named V-DQN) to obtain a better performance. The A-RSU deployed on one side of the tunnel wall is used as the learning agent in the DQN. The number of OBUs and the path loss of V2V within the detection range of the RSU signal are set as the environment. The framework of the A-RSU interacts with the continuous environment and makes decisions during the entire reinforcement learning process, as shown in the Figure 10. At time T, the A-RSU observes a current state from the environment, and then the A-RSU takes the corresponding actions based on policy π , according to the observed state. The policy π is determined by the state-action value function; that is, the strategy function Q in reinforcement learning and the corresponding Q value is obtained, and the Q value is measured by the deep learning part. According to the behavior of the RSU, in the next slot, the environment moves to the next state s i + 1 , and the A-RSU obtains a gain from the environment.
The three key elements of the optimal matching algorithm based on V-DQN are the state space, action space, and reward function.
The number of vehicles n o and the path loss between vehicles L s u m present in (19) are used as the state space of the deep reinforcement learning algorithm, denoted as:
s i = { L s u m , n o } , n o = { 0 , 1 , 2 , 3 S }
For the action space, there are four cases when the A-RSU faces tunnel vehicle communication. First, only two vehicles communicate within the monitoring range. The transmit power of auxiliary V2V communication is P t . If the vehicle communication effect is not good, the A-RSU interferes with the RSU and induces the RSU to perform auxiliary communication with the following vehicles. This situation is shown in the Figure 11. At this time, the transmission power is P t d . Third, there is no need to communicate between the vehicles, and the vehicle only needs to communicate with the RSU. This situation is shown in Figure 11, and in this case, the A-RSU is connected with the RSU to form a virtual multi-output system, and the transmission power is set as P t c . The last case is where there no vehicles pass through the tunnel, so the A-RSU is in a monitoring state. In this case, the power is P t s . Considering the above four cases, the action space can be written as
a i = { P t , P t d , P t c , P t s }
Suppose the RSU can successfully establish transmission with the OBU, and the correct V-MIMO technology can be used in a certain period of time to maximize the channel. Then, the appropriate capacity probability under the successful transmission can be treated as the reward function, which is expressed as follows:
r i = E ( a i | s i ) = P s u c c e s s C j C max
The deep reinforcement learning algorithm DQN uses the state s i and behavior parameter as the input of the neural network of Θ n , and then analyzes the Q value under different behaviors using a neural network, so as to form a mapping relationship between the state−behavior and the Q value. The estimated Q function is used to replace the above method of updating the Q table, thereby effectively accelerating the learning convergence speed of the agent A-RSU and achieving an efficient learning effect. This uses two convolutional neural networks with the same structure: one is used to estimate the Q value under the current state behavior, and the other is used as the target Q network to update the Q value [40]. Here, the experience replay mechanism is adopted in the DQN method. Setting up a memory replay unit allows storing the experience data obtained by the online interaction between the agent A-RSU and the vehicle communication environment in the tunnel in the process of training the neural network. In this way, the network parameters are updated each time during training, and a small batch of sample data from the memory playback unit is randomly selected and trained [41]. Meanwhile, the stochastic gradient descent method is used to break the correlation between the sample data and make the updating of the neural network more efficient.
For a given state behavior ( s i , a i ), the Q ( s i a i ) can be calculated according to the policy π , which is a measure of the quality of the behavior made at the current moment. Once the Q value of each behavior is known, the agent A-RSU can make appropriate behavior choices in the current state:
a i = arg max Q ( s i , a i )
The agent A-RSU performs actions that maximize the Q value. In the case that the dynamic information of the tunnel environment cannot be known in advance, the iterative update of the following equation can be used to obtain the optimal Q value under the optimal strategy
Q ( s i , a i ) = Q ( s i , a i ) + α [ r i + 1 + γ max Q ( s i + 1 , a i + 1 ) ( s i , a i ) ]
α represents the learning rate of the agent A-RSU. γ represents the reward discount factor of the agent A-RSU.
The target Q network is expressed as
y i = r i + max Q ( s i , a i , θ n )
The loss function is the mean square error loss function, as follows:
L ( θ n ) = E [ ( y i Q ( s i , a i , θ n ) ) 2 ]
The parameters of the neural network are updated using the gradient descent method:
θ n = θ n + Q ( s i , a i , θ n ) [ r i + γ max Q ( s i + 1 , a i + 1 , θ n ) Q ( s i + 1 , a i + 1 , θ n ) ]
The proposed V-DQN algorithm can be summarized as follows: the agent creates a strategy in the action space, and selects the appropriate power size as the action strategy. After the vehicle user equipment receives the action strategy, the communication module executes the action strategy. Then, the environment gives feedback and uses this feedback to reward or punish the action accordingly. This process is then executed in a loop, until the optimal strategy is found, according to the environment. M represents the maximum training round. T represents the number of loop traversals. The detail description of the proposed Algorithm 1 is shown in the following.
Algorithm 1 Optimal channel matching algorithm based on V-DQN
1:
Initialize the memory playback unit D and Q network parameters
2:
for  e p i s o d e = 1 : M   do
3:
   Initialize tunnel vehicle environment information and status
4:
   for  i = 1 : T  do
5:
     A-RSU uses a greedy strategy to select a i according to the vehicle environment state s i
6:
     A-RSU obtains instant reward r i according to the execution of action a i
7:
     A-RSU transitions to the next state s i + 1
8:
     Store the data ( s i , a i , r i , s i + 1 ) in D
9:
     Randomly extract a set of empirical data in D ( s i + 1 , a i + 1 , r i + 1 , s i + 2 )
10:
      y i = r i f i n a l s t a t e
11:
      y i = r i + m a x Q ( s i , a i , θ n ) n o n f i n a l s t a t e
12:
     Use the mean squared loss function to update all parameters of the Q network through gradient backpropagation
13:
   end for
14:
end for

3. Performance Evaluation

3.1. The Relationship between the Path Loss and the Reflection Times

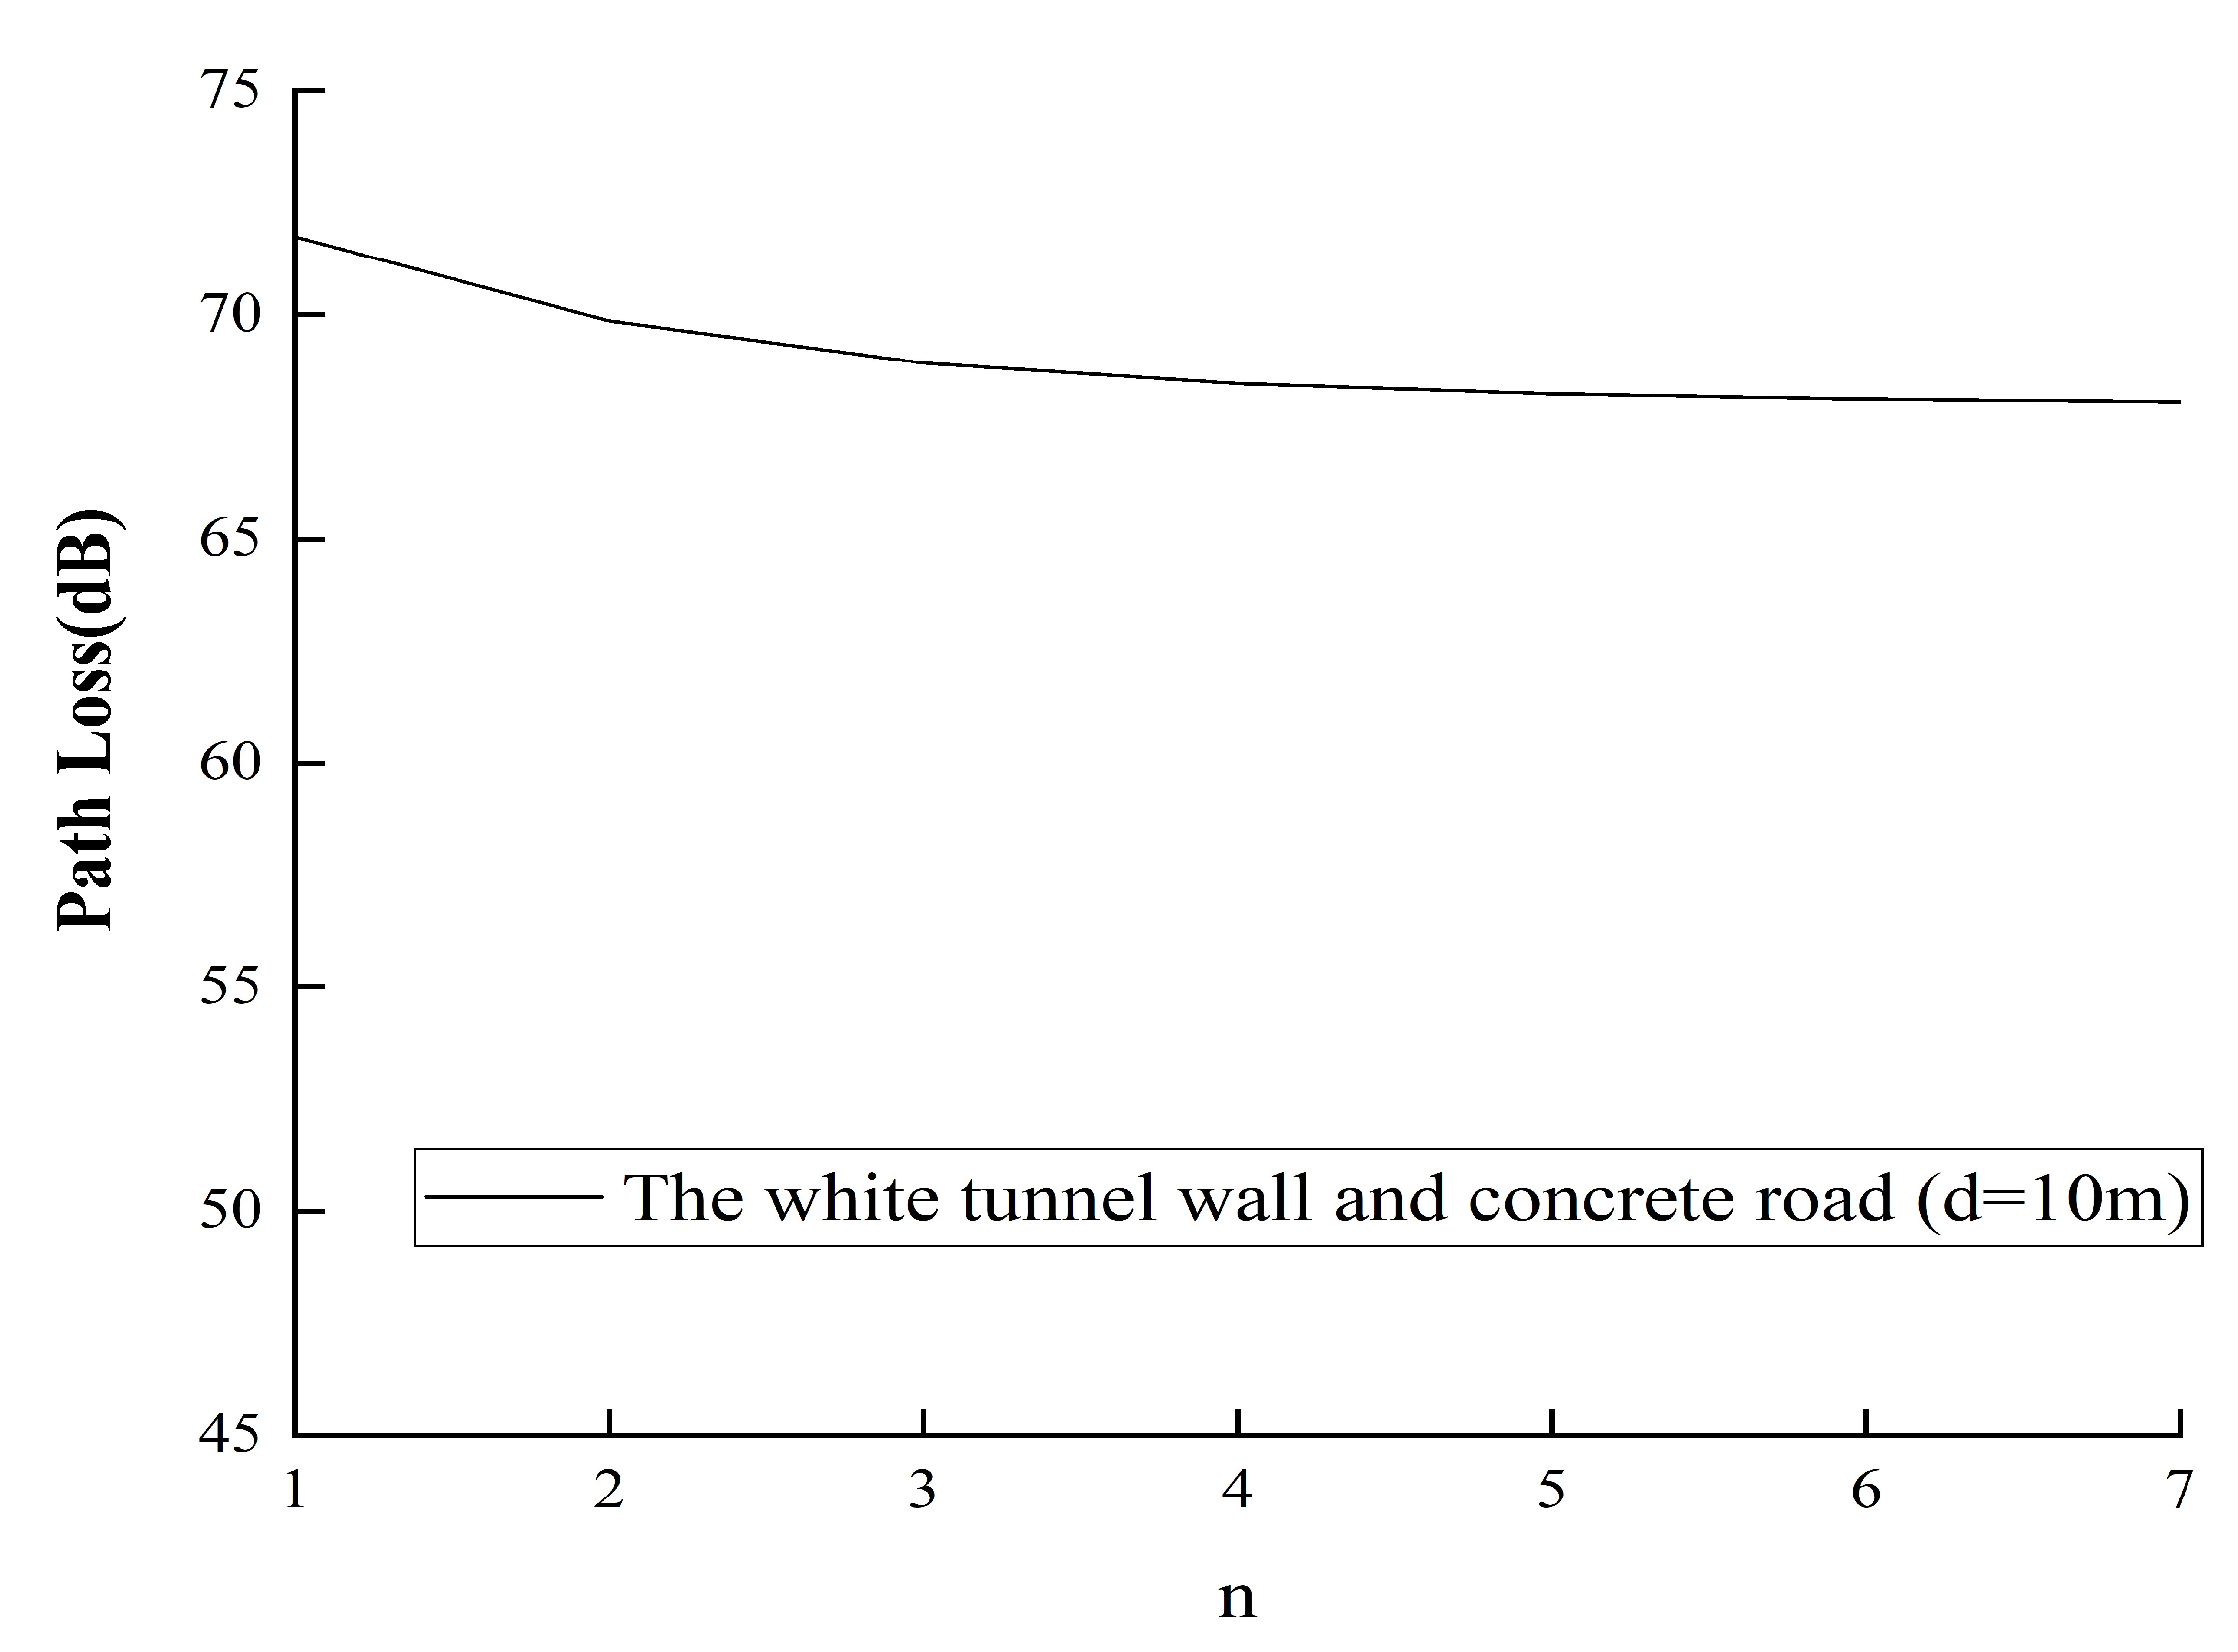
As shown in Figure 12, a tunnel environment was randomly selected in this article. In the case of white walls and concrete roads, the safety distance of the vehicle remained unchanged. As the number of reflections n increased, the numerical difference was significant when n was within the range of 1 to 3. When n was greater than 3, the curve became more and more stable.

3.2. Analysis of V2V Path Loss under Different Reflections

The simulation was based on Matlab. It simulated a one-way tunnel. The related parameters in the simulation were set as follows: the height of the tunnel was H 1 = 8 m, and the height of the OBU was H 2 = 1.5 m. The frequency of the VANET radio wave was 5.8GHz, with λ = 0.05 m. Considering that the reflection coefficient of the tunnel pavement was different from the reflection at the top of the tunnel wall, this article mainly studied the path of the first three reflections.
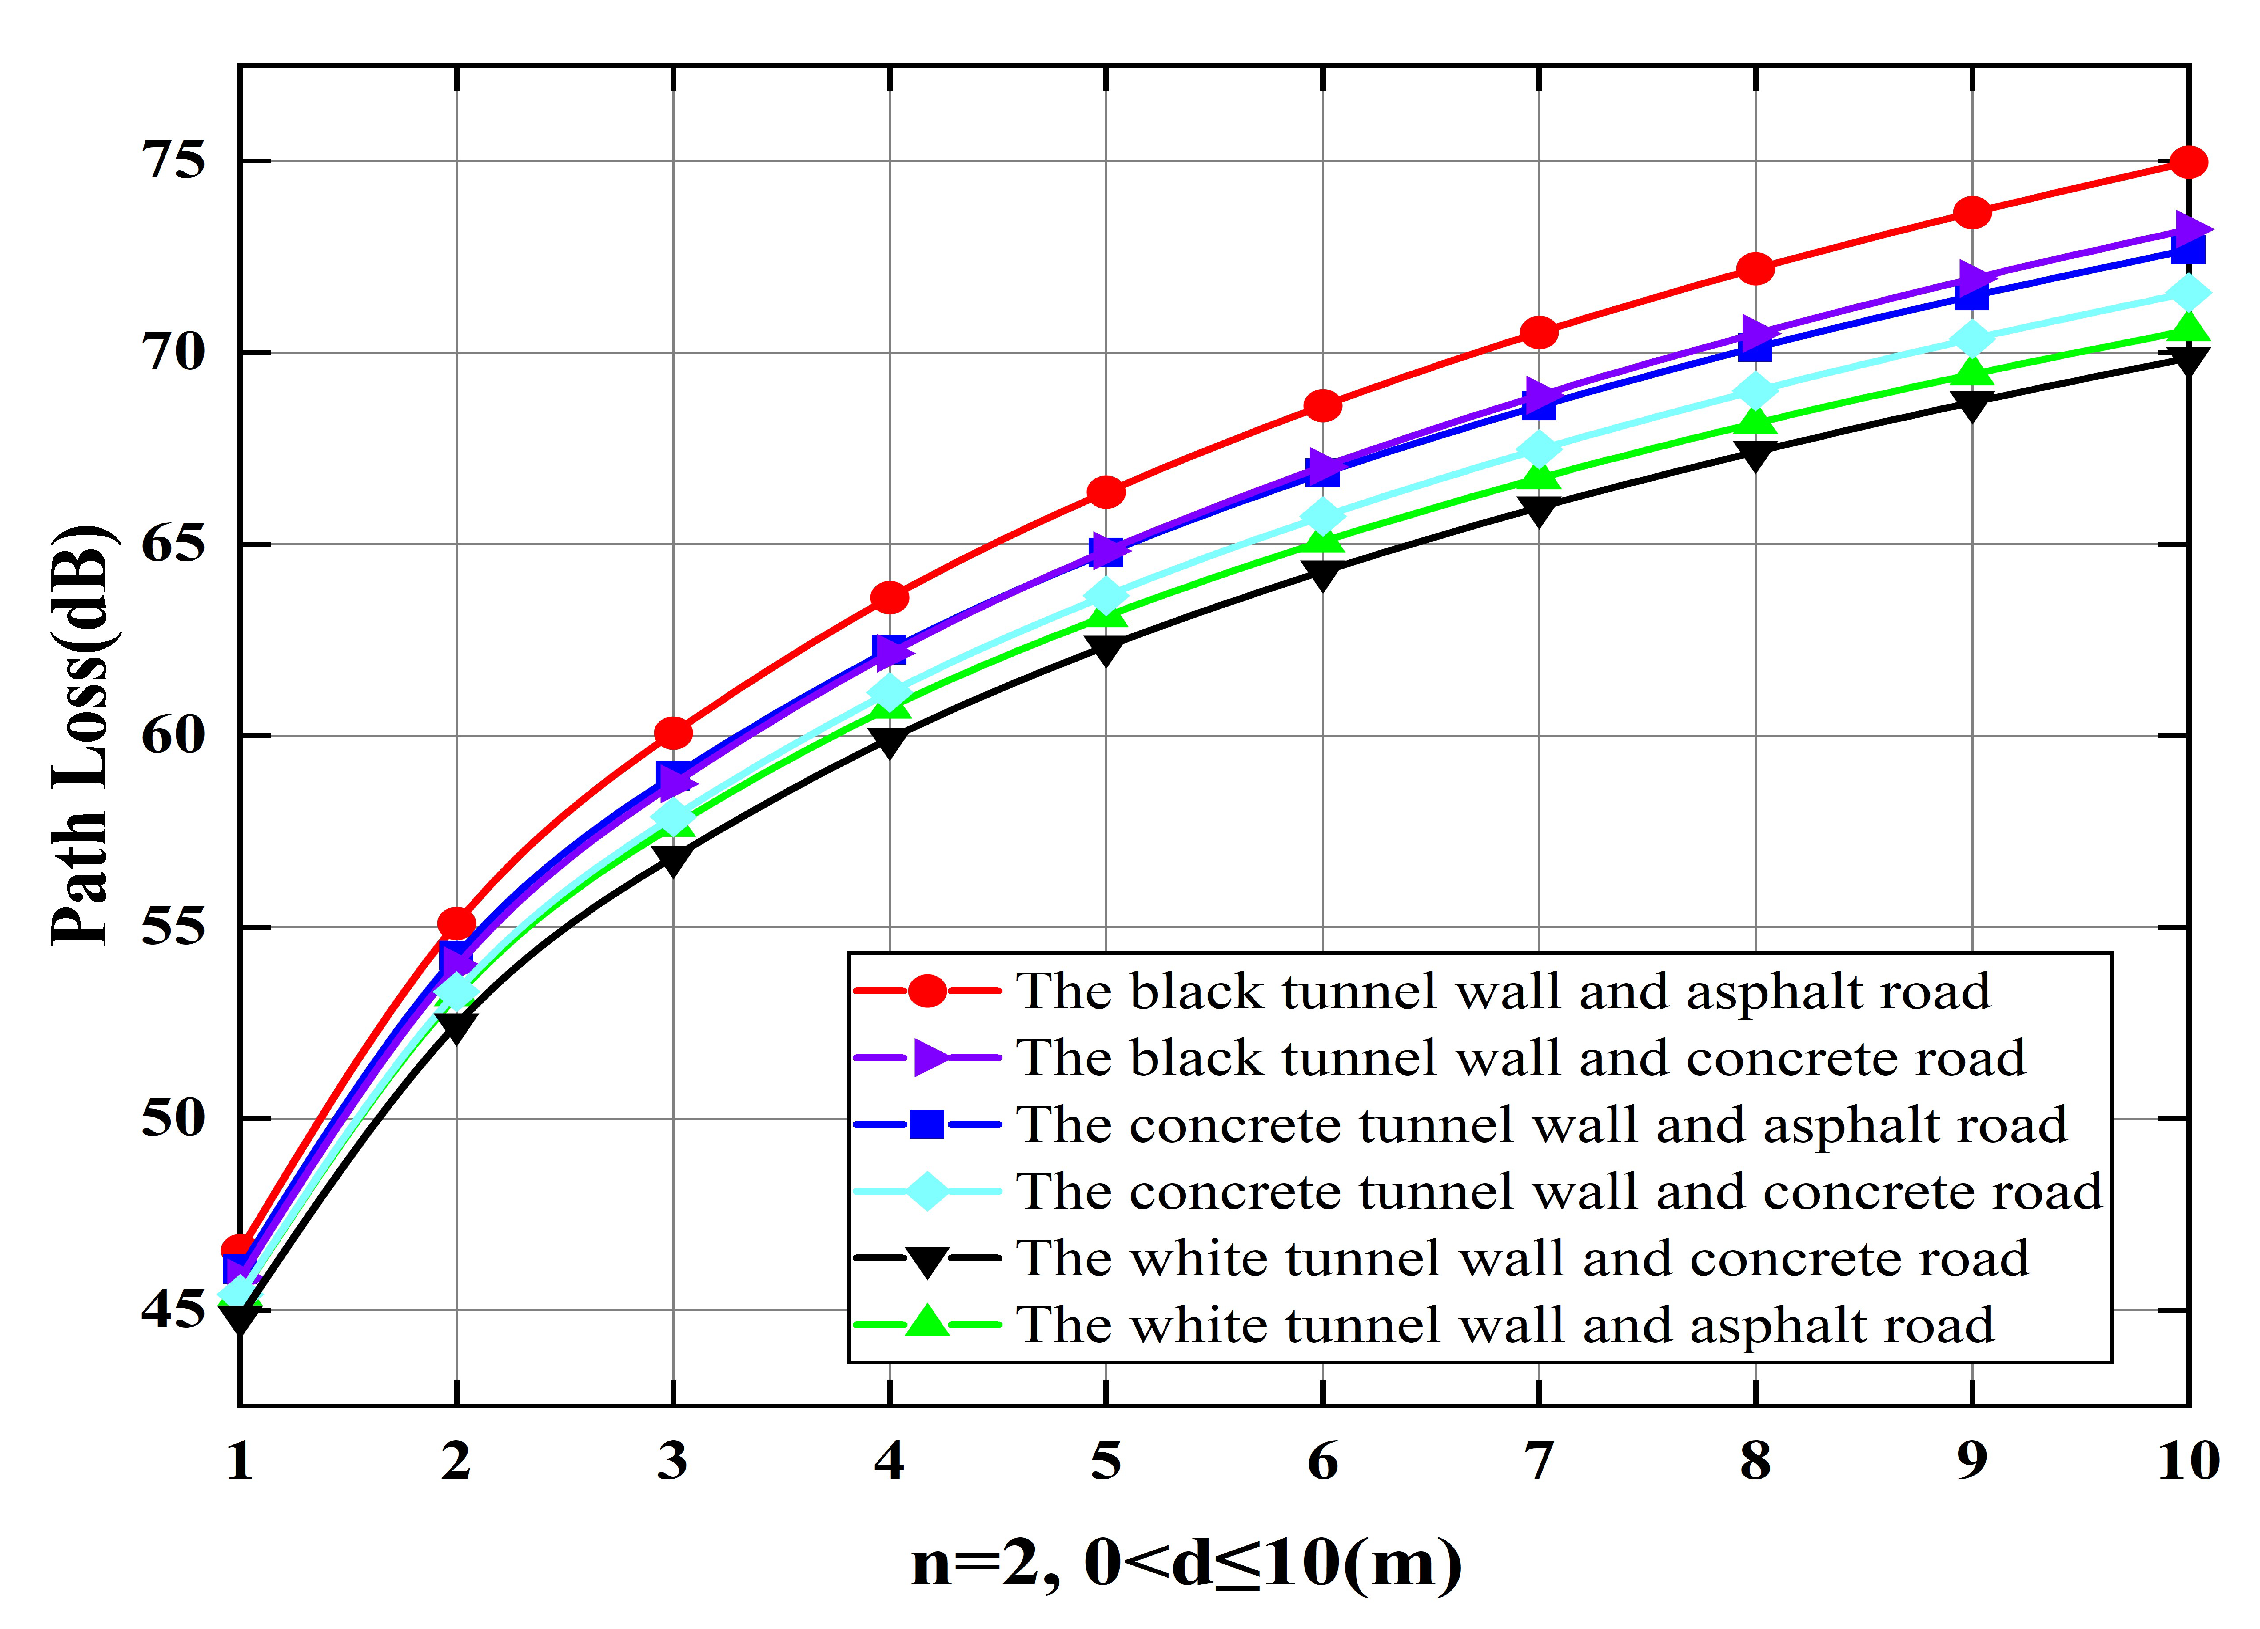
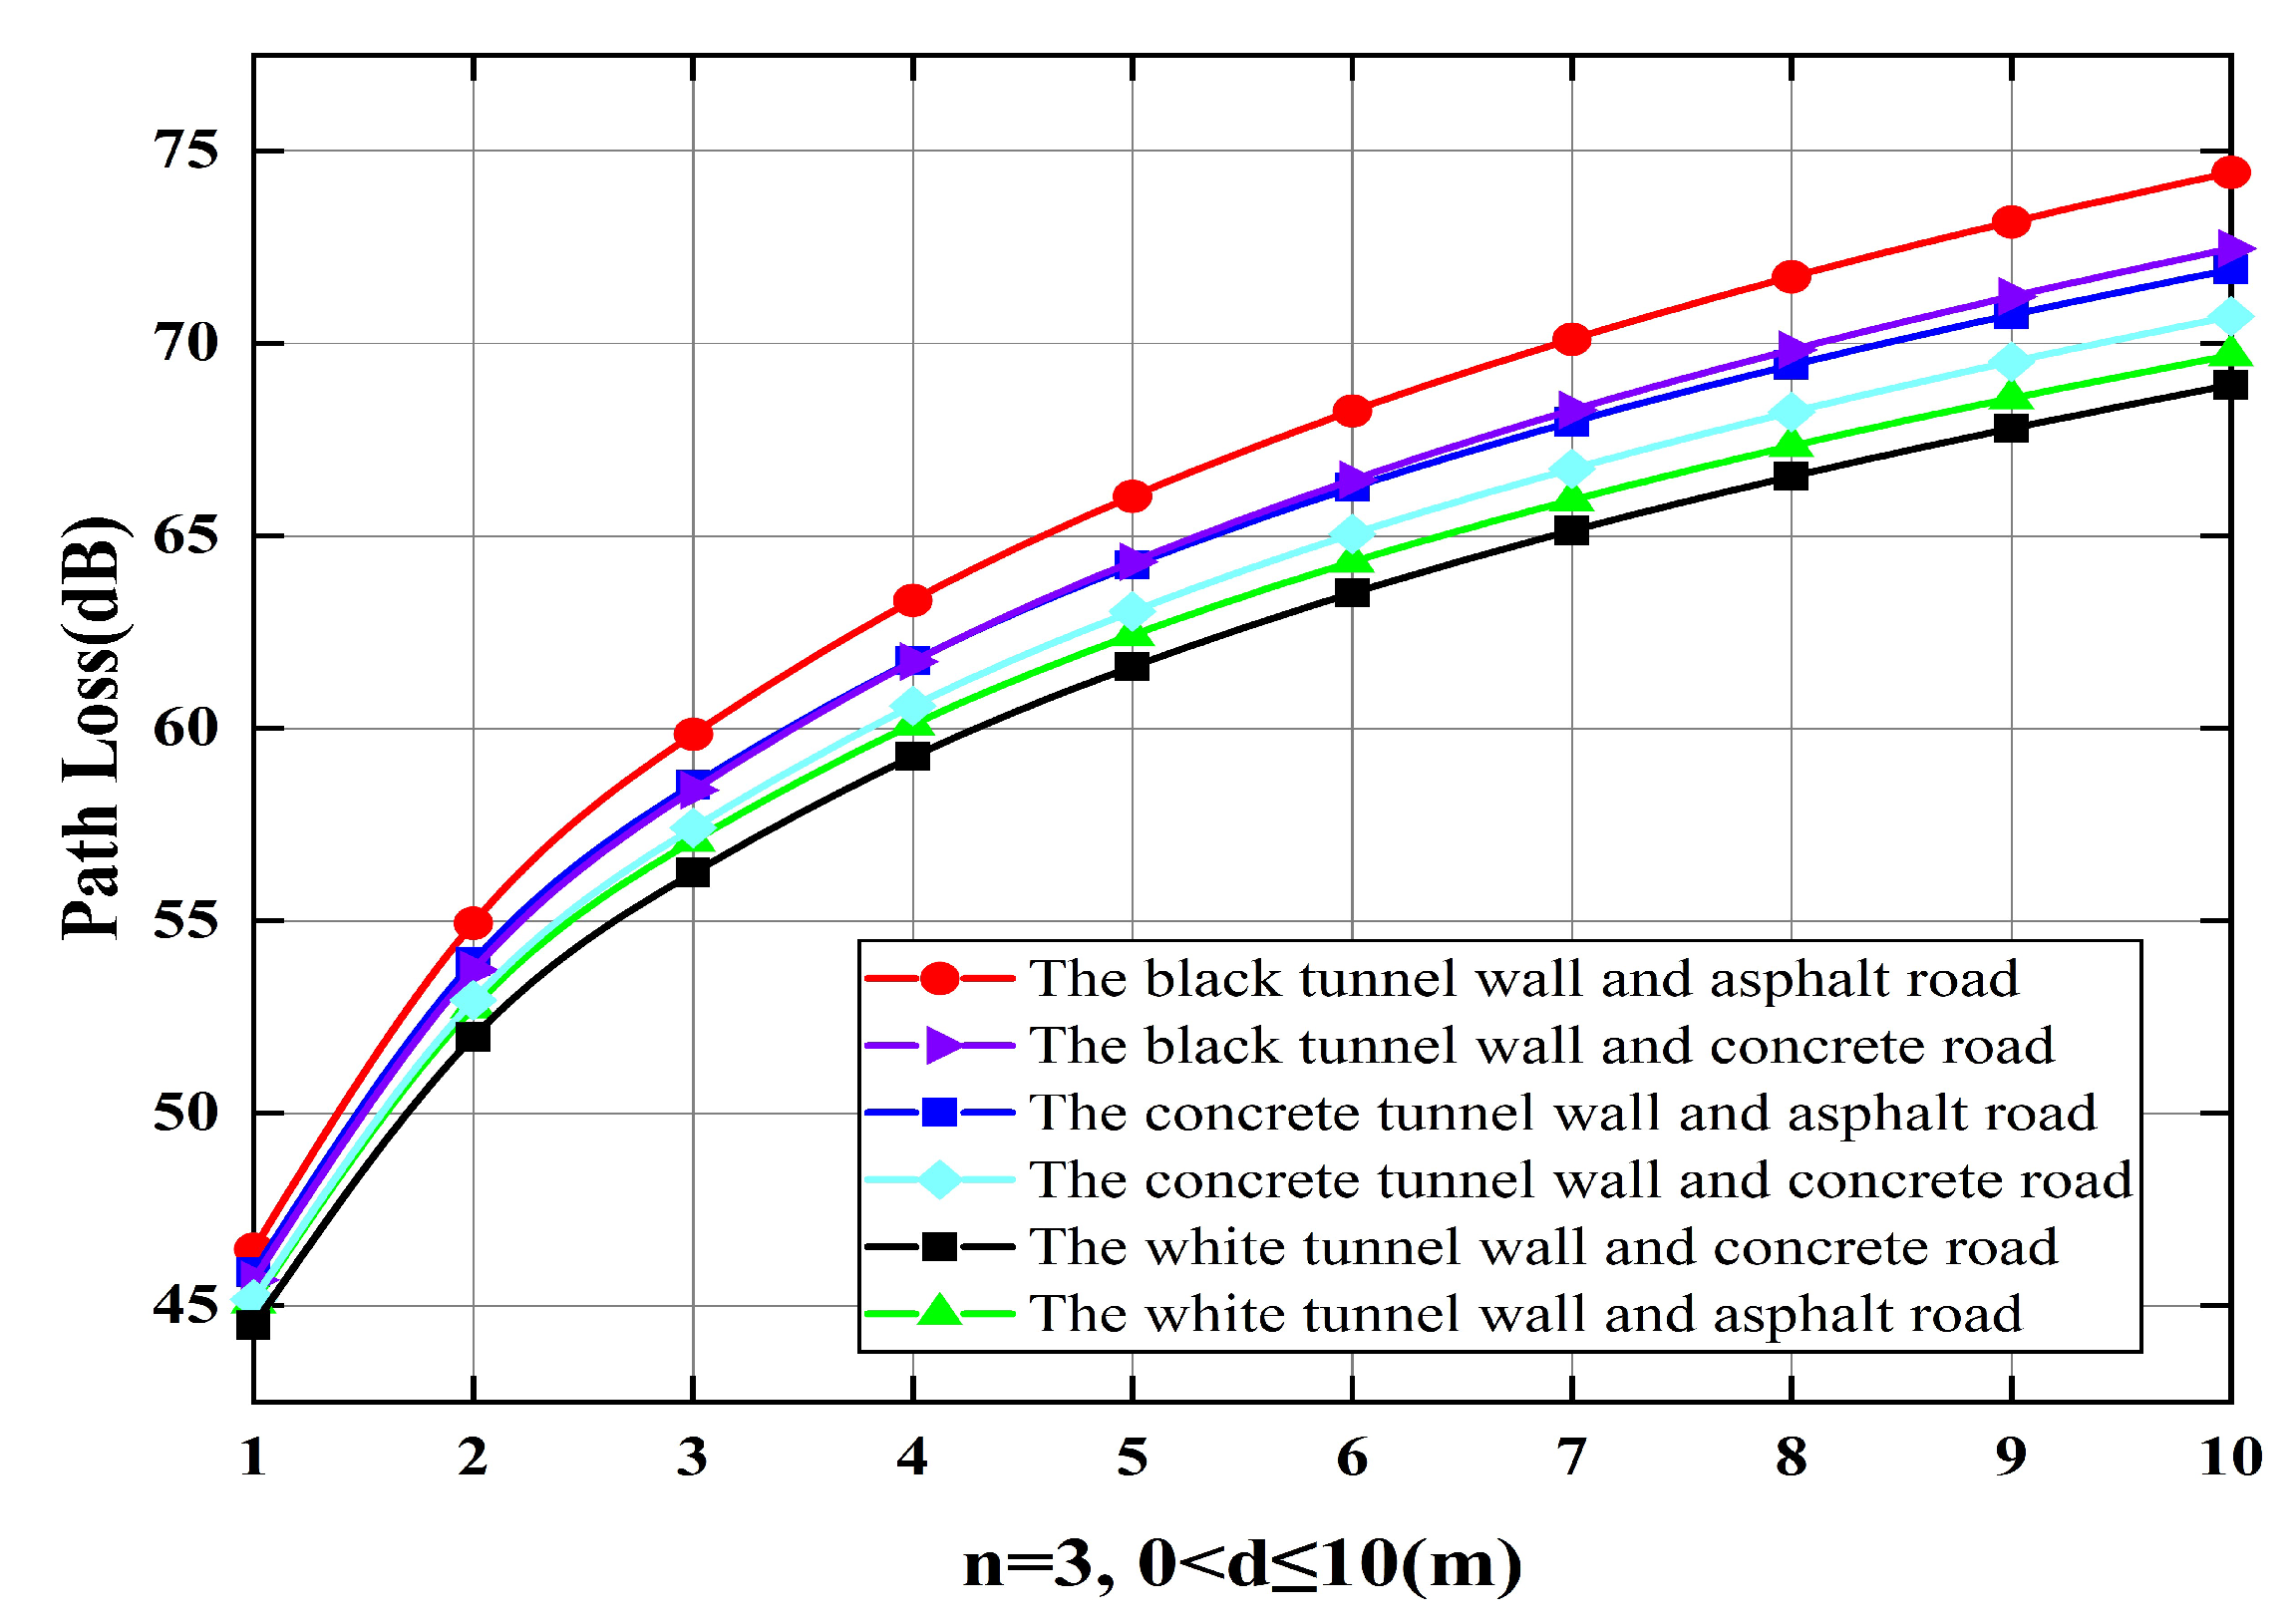
When two vehicles communicated in the tunnel, it was assumed that there were n times reflection paths during the communication period. Several different fireproof coatings and road surfaces were studied under different reflection coefficients. Here, the reflection coefficient of the black tunnel wall was 0.01, the reflection coefficient of the white tunnel wall was 0.78, the reflection coefficient of the asphalt road was 0.14, and the reflection coefficient of the concrete tunnel wall and road was 0.31 [42]. The simulation results are shown in the following Figure 13, Figure 14 and Figure 15:
As shown in Figure 13, Figure 14 and Figure 15, when the distance d increased, the path loss inside the tunnel increased. At the same time, as the distance increased, the difference in path loss between the black tunnel wall and the asphalt road became larger and larger compared to the path loss between the white tunnel wall and the cement road. By comparing these three different reflections, we can infer that at the same distance, when the vehicle traveled on the asphalt road and with the black tunnel wall, the signal propagation path loss was the maximum. When the vehicle traveled on the concrete road and with the white tunnel wall, the signal propagation path loss was the minimum.
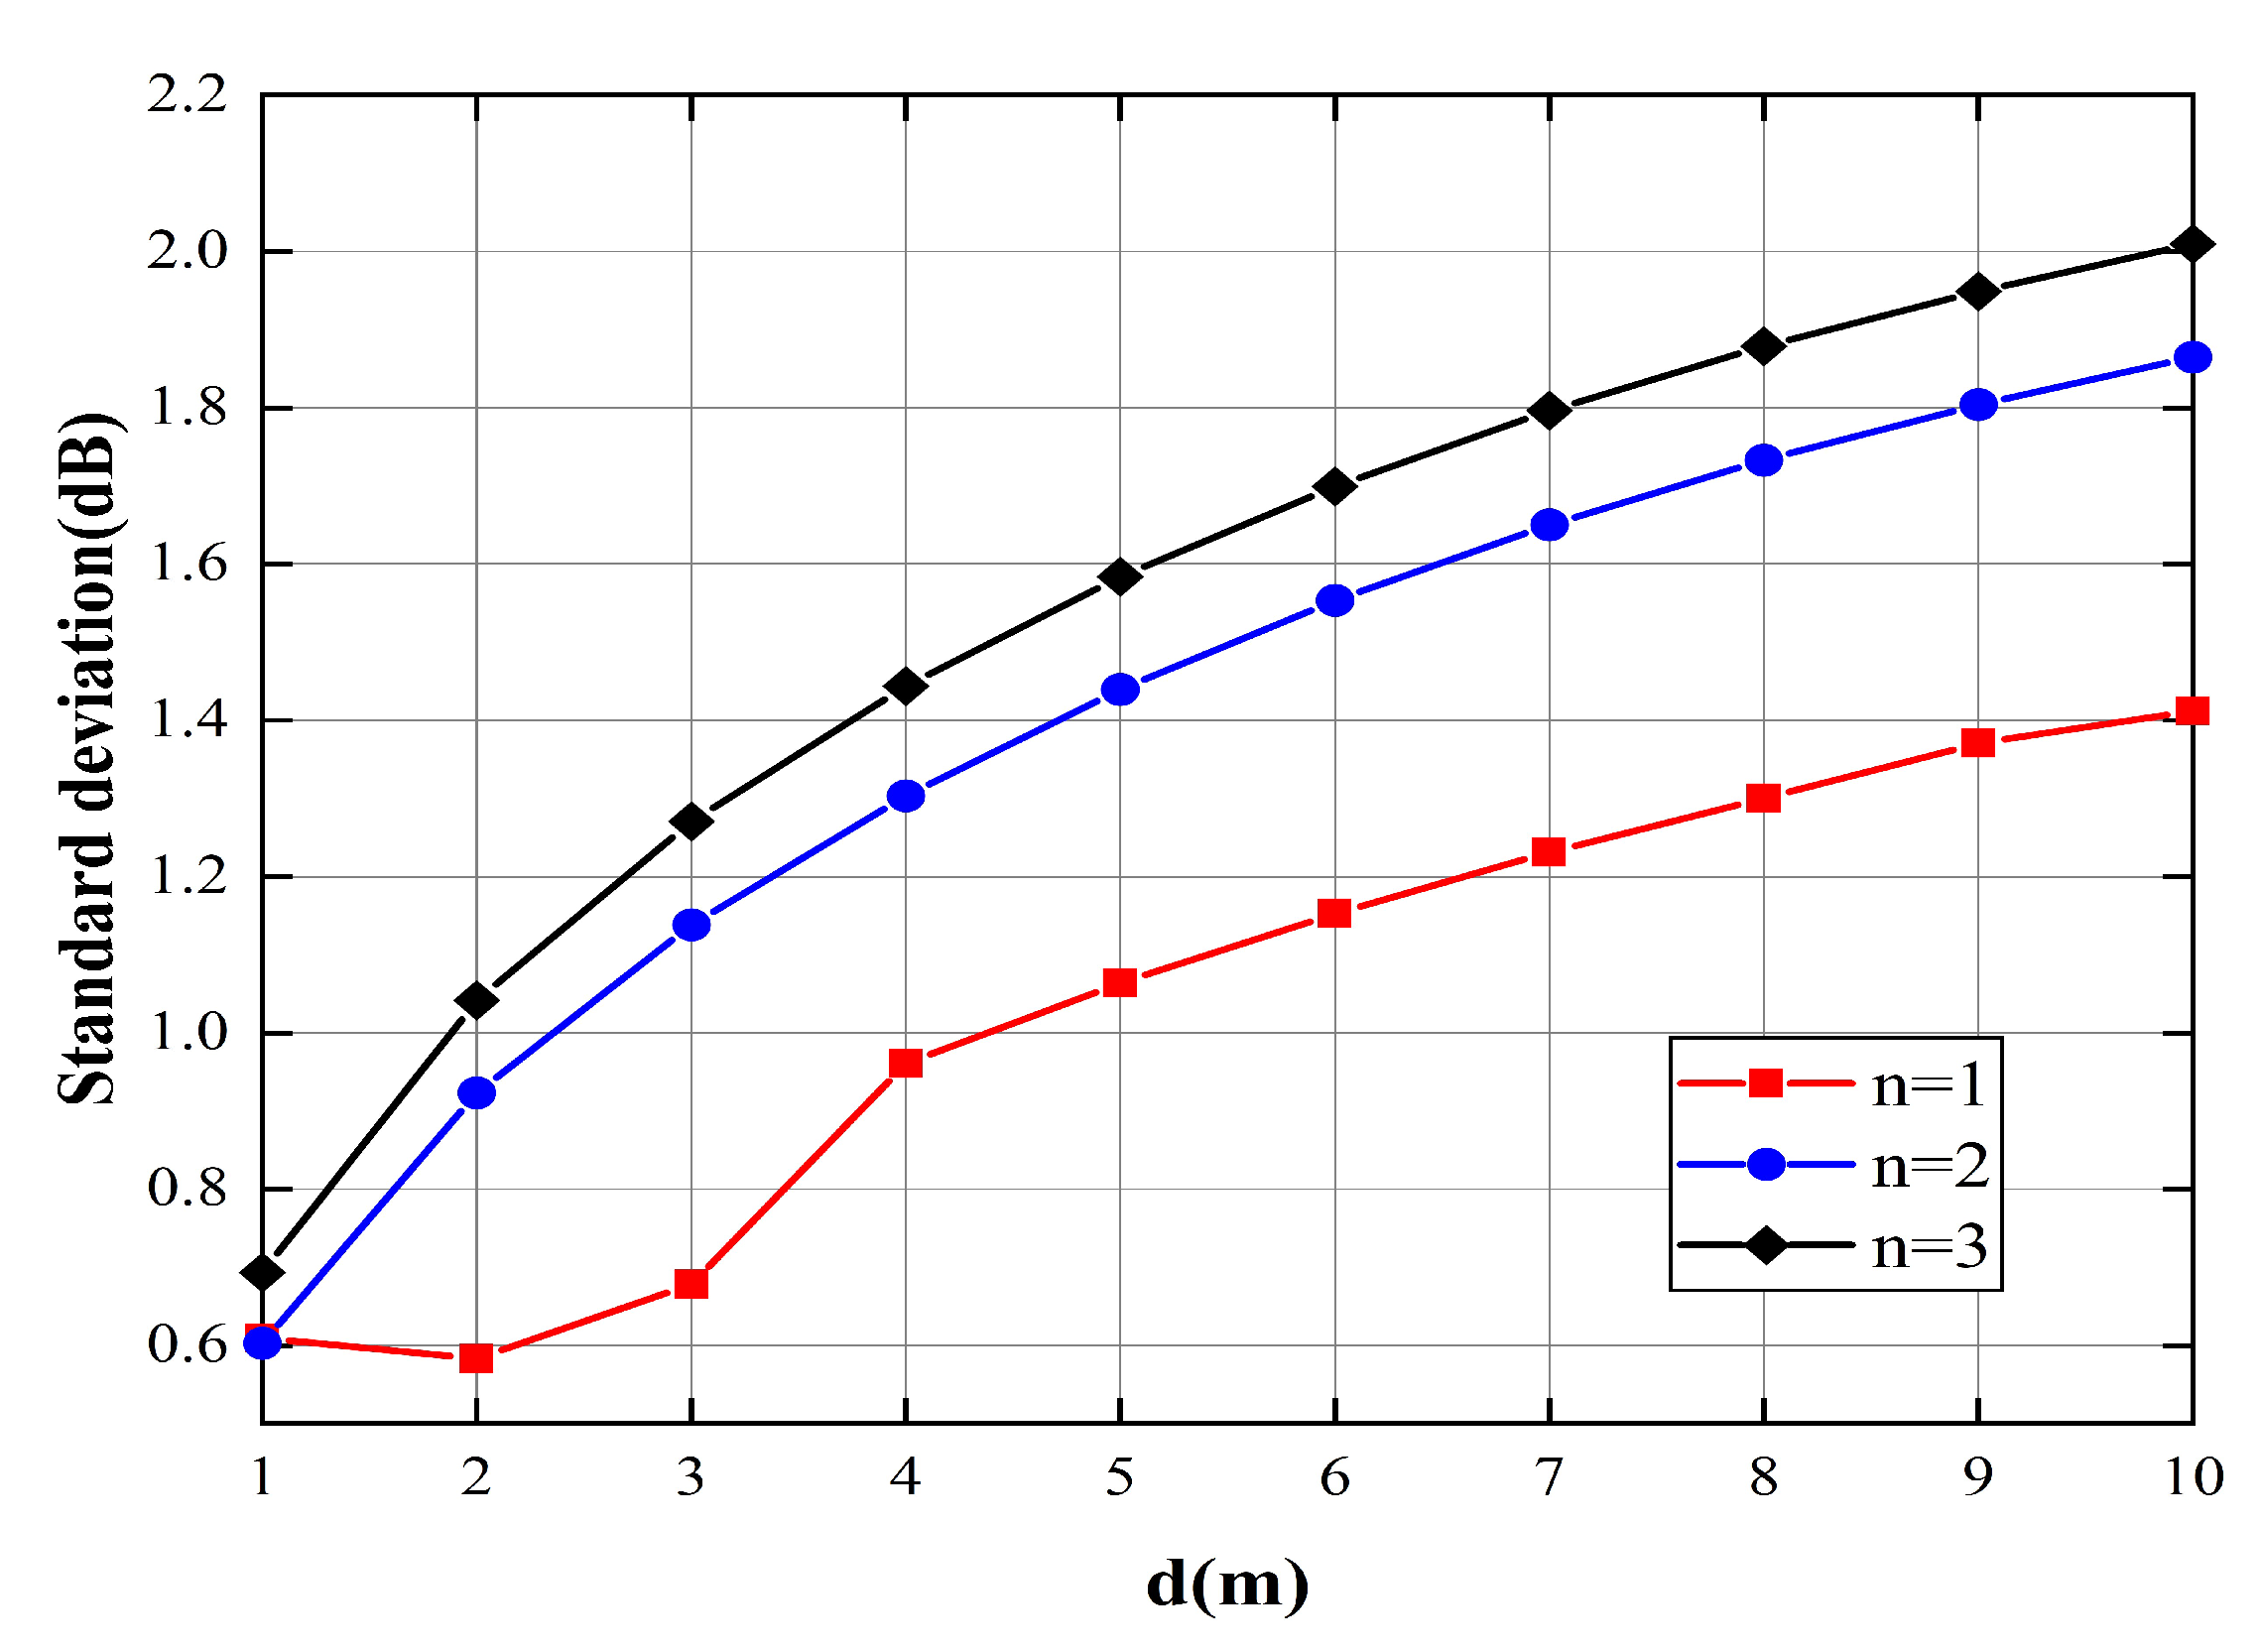
The standard deviation represents the degree of dispersion of the sample data. Through vertical comparison, we could obtain the reflection times of the signal and the influence of the tunnel environment on the path loss at the same distance. The simulation results are shown in Figure 16.
In Figure 16, when n = 1, the standard deviation increased relatively steadily. Considering the reflections, the weight of the first reflection (that is n = 1) was much higher than the others, as shown in the above Figure 12. In addition, the path loss was also very sensitive to the path length distance between the transmitter and receiver. When the distance was shorter than 4 m, this meant that the direct path contributed the most compared with the other reflection path. Thus, when n = 1 and d was less than 4 m, the curve showed a small fluctuation. When n = 2 or n = 3, the standard deviation rose sharply with distance. The larger the standard deviation, the more discrete the data. On the contrary, the smaller the standard deviation, the more stable the data. Therefore, we can conclude that as the number of reflections increased, the signal became more susceptible to the influence of different environments.

3.3. Analysis of V-MIMO Channel Capacity Simulation in a Tunnel

The simulation results are shown in Figure 17.
According to Figure 17, with the increase of the SNR, the channel capacity of the system also increased. The gap between the channel capacity of V-MIMO and the channel capacity of the other three techniques gradually increased, while the gap between the other three methods was small with the increase of the SNR. Meanwhile, the MIMO channel capacity had the maximum growth rate, so it had the best communication quality. On the contrary, the SISO had the minimum growth rate, thus its communication effect was not good. The reason for this was that the channel capacity was affected by the number of receivers and senders. When both receivers and senders increased, the channel capacity continued to increase. Therefore, when the communication path loss of the two vehicles in the tunnel was relatively large, using the V-MIMO improved the reliability of OBU signal transmission.

3.4. Analysis of Deep Reinforcement Learning

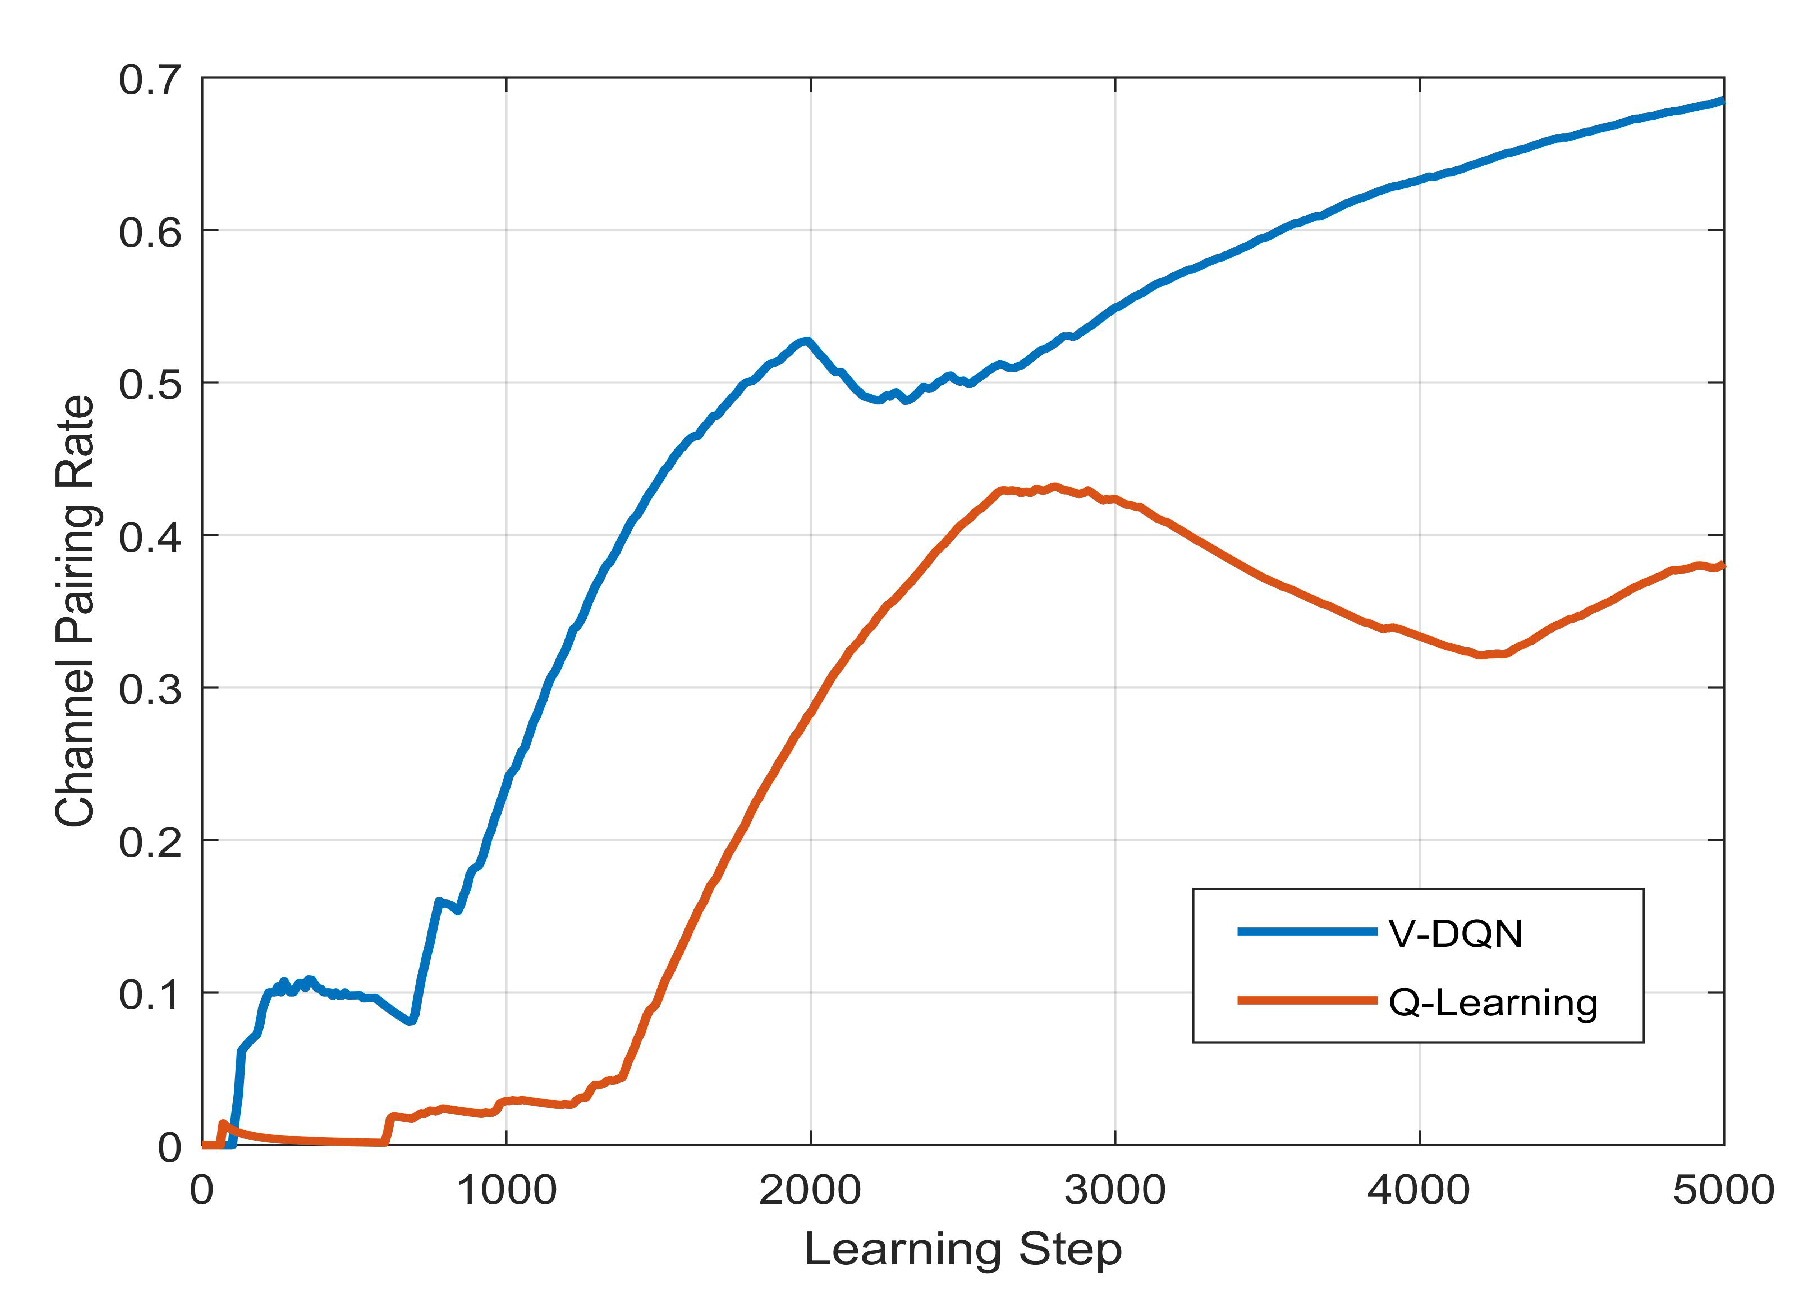
The related simulation parameters are shown in the above Table 1. The body Q learning algorithm was compared and analyzed. Here, 5000 training rounds were set. The training results are shown in the following figures:
From Figure 18, we can see that the training efficiency of V-DQN was relatively high. Although there were small fluctuations during training, it was more stable than the Q-learning algorithm. With the strengthening of the deep neural network strategy, the V-DQN greatly improved the channel matching. The rate was finally trained to about 0.7 at 5000 iterations. The Q-learning algorithm had a relatively large fluctuation range during training, and finally only trained to about 0.4.
Figure 19 shows the relationship between the outage probability and the number of OBUs. In Figure 19, it appears that, for the three cases, the V-DQN algorithm performed better than the other two algorithms. Although the difference was relatively small in numerical terms, there were still some differences in a vertical comparison. From a horizontal comparison perspective, it can be seen that the V2R outage probability decreased as the number of OBUs increased. This was because, according to the vehicle movement model, the smaller the vehicle density, the smaller the average vehicle spacing. Therefore, in order to ensure the reliability of the V2R link, the RSU needed to increase the transmit power, and the total V2R channel capacity gradually increased. At the same time, the DQN with multiple hidden layers had more complex network layers, so compared with the Q-learning algorithm, the learning effect with environmental data was better. This shows that the proposed V-DQN could effectively improve the communication in a high-density traffic environment.

4. Conclusions

This paper mainly analyzed the performances of vehicle communication in a tunnel. First, by establishing a mathematical model, the influence of different road surfaces and tunnel walls on V2V communication path loss was analyzed. The simulation results showed that, at the same distance, when vehicles communicated with asphalt roads and black tunnels, the signal propagation path loss was the highest, while when vehicles communicated with concrete roads and white tunnels, the signal propagation path loss was the lowest. Then, aiming at the problem of the relatively large path loss in tunnel V2V communication, a method combining V-MIMO technology and a deep reinforcement learning algorithm(V-DQN) was proposed. The simulation results showed that the V-DQN could achieve a higher total capacity compared with the traditional Q learning method, and it had a low probability of interruption. In addition, the simulation results showed that the DQN demonstrated a significant improvement in convergence speed and stability, which has guiding significance for future research on tunnel–vehicle communication optimization.

Author Contributions

Validation, W.W.; Formal analysis, Y.P.; Resources, M.Y.; Writing—original draft, H.J.; Writing—review & editing, C.L.; Visualization, Q.W. All authors have read and agreed to the published version of the manuscript.

Funding

Jiangsu University Student Innovation Training Program: 2022111117070Z; National Natural Science Foundation of China: 61401387.

Data Availability Statement

Data is contained within the article.

Conflicts of Interest

The authors declare no conflict of interest.

References

  1. Boban, M.; Kousaridas, A.; Manolakis, K.; Eichinger, J.; Xu, W. Connected Roads of the Future: Use Cases, Requirements, and Design Considerations for Vehicle-to-Everything Communications. IEEE Veh. Technol. Mag. 2018, 13, 110–123. [Google Scholar] [CrossRef]
  2. Ferreira, M.; Damas, L.; Conceicão, H.; d’Orey, P.M.; Fernandes, R.; Steenkiste, P.; Gomes, P. Self-automated parking lots for autonomous vehicles based on vehicular ad hoc networking. In Proceedings of the 2014 IEEE Intelligent Vehicles Symposium, Dearborn, MI, USA, 8–11 June 2014; pp. 472–479. [Google Scholar] [CrossRef]
  3. 3GPP. Study on LTE Support for V2X Services (Release 14); Tech. Rep. 3GPP TR 22.885 V1.0.0; 3rd Generation Partnership Project: Sophia Antipolis, France, 2015. [Google Scholar]
  4. Fodor, G.; Do, H.; Ashraf, S.A.; Blasco, R.; Sun, W.; Belleschi, M.; Hu, L. Supporting Enhanced Vehicle-to-Everything Services by LTE Release 15 Systems. IEEE Commun. Stand. Mag. 2019, 3, 26–33. [Google Scholar] [CrossRef]
  5. Martinez, F.J.; Toh, C.; Cano, J.; Calafate, C.T.; Manzoni, P. Emergency Services in Future Intelligent Transportation Systems Based on Vehicular Communication Networks. IEEE Intell. Transp. Syst. Mag. 2010, 2, 6–20. [Google Scholar] [CrossRef]
  6. 3GPP. Study Enhancement of 3GPP Support for 5G V2X Services (Release 15); Tech. Rep. 3GPP TR 22.886 V1.0.0; 3rd Generation Partnership Project: Sophia Antipolis, France, 2016. [Google Scholar]
  7. Chen, S.; Hu, J.; Shi, Y.; Peng, Y.; Fang, J.; Zhao, R.; Zhao, L. Vehicle-to-Everything (v2x) Services Supported by LTE-Based Systems and 5G. IEEE Commun. Stand. Mag. 2017, 1, 70–76. [Google Scholar] [CrossRef]
  8. Kapoor, A.; Kumar, P.; Mishra, R. High Gain Modified Vivaldi Vehicular Antenna for IoV Communications in 5G Network. Heliyon 2022, 8, e09336. [Google Scholar] [CrossRef]
  9. Fernández, H.; Rubio, L.; Rodrigo-Peñarrocha, V.M.; Reig, J. Path Loss Characterization for Vehicular Communications at 700 MHz and 5.9 GHz Under LOS and NLOS Conditions. IEEE Antennas Wirel. Propag. Lett. 2014, 13, 931–934. [Google Scholar] [CrossRef]
  10. Hrovat, A.; Kandus, G.; Javornik, T. A Survey of Radio Propagation Modeling for Tunnels. IEEE Commun. Surv. Tutorials 2014, 16, 658–669. [Google Scholar] [CrossRef]
  11. Klozar, L.; Prokopec, J. Propagation path loss models for mobile communication. In Proceedings of the 21st International Conference Radioelektronika, Brno, Czech Republic, 19–20 April 2011; pp. 1–4. [Google Scholar] [CrossRef]
  12. Tian, J.; Meng, F. Comparison Survey of Mobility Models in Vehicular Ad-Hoc Network (VANET). In Proceedings of the 2020 IEEE 3rd International Conference on Automation, Electronics and Electrical Engineering (AUTEEE), Shenyang, China, 20–22 November 2020; pp. 337–342. [Google Scholar] [CrossRef]
  13. Li, H.; Zhou, Y.; Shen, B.; Ling, L.; Xia, J.; Yang, T.; Lu, Q.; Zhou, Y.; Liu, Y. Research on Tunnel Wireless Communication Technology. In Proceedings of the 2020 International Conference on Wireless Communications and Smart Grid (ICWCSG), Qingdao, China, 12–14 June 2020; pp. 72–75. [Google Scholar] [CrossRef]
  14. Shakhobiddinov, A.; Shamsiev, A.; Narzullaev, I.; Shoniyozov, G. About Organization of Mobile Communications in Long Car Tunnels. In Proceedings of the 2019 International Conference on Information Science and Communications Technologies (ICISCT), Tashkent, Uzbekistan, 4–6 November 2019; pp. 1–3. [Google Scholar] [CrossRef]
  15. Rashdi, M.A.; Nadir, Z.; Al-Lawati, H. Applicability of Okumura–Hata Model for Wireless Communication Systems in Oman. In Proceedings of the 2020 IEEE International IOT, Electronics and Mechatronics Conference (IEMTRONICS), Vancouver, BC, Canada, 9–12 September 2020; pp. 1–6. [Google Scholar] [CrossRef]
  16. Akhpashev, R.V.; Andreev, A.V. COST 231 Hata adaptation model for urban conditions in LTE networks. In Proceedings of the 2016 17th International Conference of Young Specialists on Micro/Nanotechnologies and Electron Devices (EDM), Erlagol, Russia, 30 June–4 July 2016; pp. 64–66. [Google Scholar] [CrossRef]
  17. Galvan-Tejada, G.M. WiMAX urban coverage based on the Lee model and the Deygout diffraction method. In Proceedings of the 2010 7th International Conference on Electrical Engineering Computing Science and Automatic Control, Tuxtla Gutierrez, Mexico, 8–10 September 2010; pp. 294–299. [Google Scholar] [CrossRef]
  18. Wang, W.; Zhang, Y.; Yao, W.; Wang, S. The propagation model of RFID systems in ETC. In Proceedings of the 2009 IEEE International Conference on Communications Technology and Applications, Beijing, China, 16–18 October 2009; pp. 54–57. [Google Scholar] [CrossRef]
  19. Onipe, J.A.; Alenoghena, C.O.; Salawu, N.; Numan, P.E. Optimal Propagation Models for Path-loss Prediction in a Mountainous Environment at 2100MHz. In Proceedings of the 2020 International Conference in Mathematics, Computer Engineering and Computer Science (ICMCECS), Ayobo, Nigeria, 18–21 March 2020; pp. 1–6. [Google Scholar] [CrossRef]
  20. Prior, P.; Cota, N. Railways Communications Propagation Prediction over Irregular Terrain using Longley-Rice Model. In Proceedings of the 2021 28th International Conference on Telecommunications (ICT), London, UK, 1–3 June 2021; pp. 1–5. [Google Scholar] [CrossRef]
  21. Abdulrasheed, I.Y.; Faruk, N.; Surajudeen-Bakinde, N.T.; Olawoyin, L.A.; Oloyede, A.A.; Popoola, S.I. Kriging based model for path loss prediction in the VHF band. In Proceedings of the 2017 IEEE 3rd International Conference on Electro-Technology for National Development (NIGERCON), Owerri, Nigeria, 7–10 November 2017; pp. 173–176. [Google Scholar] [CrossRef]
  22. Zhi, F. “Soft Ribs” of Tunnel Asphalt Pavement. China Highw. 2006, 22, 88–89. (In Chinese) [Google Scholar]
  23. Wang, S.; Lin, Z.; Yu, S. The characteristic and damage of fire accidents in road tunnel. Fire Sci. Technol. 2011, 30, 337–340. (In Chinese) [Google Scholar]
  24. Zhou, M. On features and hazards of fire accidents in road tunnels. Shanxi Archit. 2013, 39, 156–157. (In Chinese) [Google Scholar]
  25. Yao, Y.D.; Yin, G.F.; Cheng, X.W.; Gou, X.L. Design and Properties of Fire-Proof Coating for Tunnels. Key Eng. Mater. 2007, 40, 1753–1755. [Google Scholar] [CrossRef]
  26. Hanzo, L.; El-Hajjar, M.; Alamri, O. Near-Capacity Wireless Transceivers and Cooperative Communications in the MIMO Era: Evolution of Standards, Waveform Design, and Future Perspectives. Proc. IEEE 2011, 99, 1343–1385. [Google Scholar] [CrossRef] [Green Version]
  27. Alamouti, S.M. A simple transmit diversity technique for wireless communications. IEEE J. Sel. Areas Commun. 1998, 16, 1451–1458. [Google Scholar] [CrossRef]
  28. Jiang, J.; Dianati, M.; Imran, M.A.; Tafazolli, R.; Zhang, S. Energy-Efficiency Analysis and Optimization for Virtual-MIMO Systems. IEEE Trans. Veh. Technol. 2014, 63, 2272–2283. [Google Scholar] [CrossRef] [Green Version]
  29. Watanabe, I.; Nishimori, K.; Taniguchi, R.; Murakami, T. Effectiveness of the virtual massive MIMO in 5G with OFDM. In Proceedings of the International Symposium on Antennas and Propagation (ISAP), Osaka, Japan, 25–28 January 2021; pp. 211–212. [Google Scholar]
  30. Gong, Y.; Wang, X. Channel Capacity Analysis and Simulations of Distributed MIMO System. In Proceedings of the 2009 5th International Conference on Wireless Communications, Networking and Mobile Computing, Beijing, China, 24–26 September 2009; pp. 1–4. [Google Scholar] [CrossRef]
  31. Khurana, M.; Krishna, C.R. MIMO-based spatial diversity scheme in VANET scenario. In Proceedings of the 2015 1st International Conference on Next Generation Computing Technologies (NGCT), Dehradun, India, 4–5 September 2015; pp. 257–261. [Google Scholar] [CrossRef]
  32. Foerster, J.; Nardelli, N.; Farquhar, G.; Afouras, T.; Torr, P.H.S.; Kohli, P.; Whiteson, S. Stabilising experience replay for deep multi-agent reinforcement learning. In Proceedings of the 34th International Conference on Machine Learning, Sydney, Australia, 6–11 August 2017; Volume 70, pp. 1146–1155. [Google Scholar]
  33. Mnih, V.; Kavukcuoglu, K.; Silver, D.; Graves, A.; Antonoglou, I.; Wierstra, D.; Riedmiller, M. Playing Atari with Deep Reinforcement Learning. arXiv 2013, arXiv:1312.5602. [Google Scholar]
  34. Mnih, V.; Kavukcuoglu, K.; Silver, D.; Rusu, A.A.; Veness, J.; Bellemare, M.; Graves, A.; Riedmiller, M.; Fidjeland, A.K.; Ostrovski1, G.; et al. Human-level control through deep reinforcement learning. Nature 2015, 518, 529–533. [Google Scholar] [CrossRef] [PubMed]
  35. Li, C.; Zhang, D.H.Z.; Chen, W.; Du, Y.; Hu, X. A Path Loss Calculation Scheme for Highway ETC Charging Signal Propagation. Wseas Trans. Signal Process. 2014, 10, 301–308. [Google Scholar]
  36. ITU-R P.1238-7; Propagation Data and Prediction Methods for the Planning of Indoor Radio Communication Systems and Radio Local Area Networks in the Frequency Range 900 MHz to 100 GHz. International Telecommunication Union: Geneva, Switzerland, 2012; pp. 1–26.
  37. Mozaffari, M.; Saad, W.; Bennis, M.; Debbah, M. Unmanned Aerial Vehicle With Underlaid Device-to-Device Communications: Performance and Tradeoffs. IEEE Trans. Wirel. Commun. 2016, 15, 3949–3963. [Google Scholar] [CrossRef]
  38. He, Z.; Zhang, B.; Wang, J.; Wang, L.; Ren, Y.; Han, Z. Performance Analysis and Optimization for V2V-assisted UAV Communications in Vehicular Networks. In Proceedings of the IEEE International Conference on Communications (ICC), Dublin, Ireland, 7–11 June 2020; pp. 1–6. [Google Scholar] [CrossRef]
  39. Yang, H.; He, Y. Correlated Channel Capacity of Virtual MIMO Based on Distributed Satellites. Comput. Sci. 2015, 42, 276–278. (In Chinese) [Google Scholar]
  40. Jiang, L.; Huang, H.; Ding, Z. Path planning for intelligent robots based on deep Q-learning with experience replay and heuristic knowledge. IEEE/CAA J. Autom. Sin. 2020, 7, 1179–1189. [Google Scholar] [CrossRef]
  41. Ye, H.; Li, G.Y.; Juang, B.F. Deep Reinforcement Learning Based Resource Allocation for V2V Communications. IEEE Trans. Veh. Technol. 2019, 68, 3163–3173. [Google Scholar] [CrossRef] [Green Version]
  42. Xiao, Y.; Du, Z.; Feng, C.; Wang, M. Study on Reflection Coefficient of Tunnel Ceiling Materials to the Road Average Luminance. J. Wuhan Univ. Technol. (Transp. Sci. Eng.) 2015, 39, 363–366. (In Chinese) [Google Scholar]
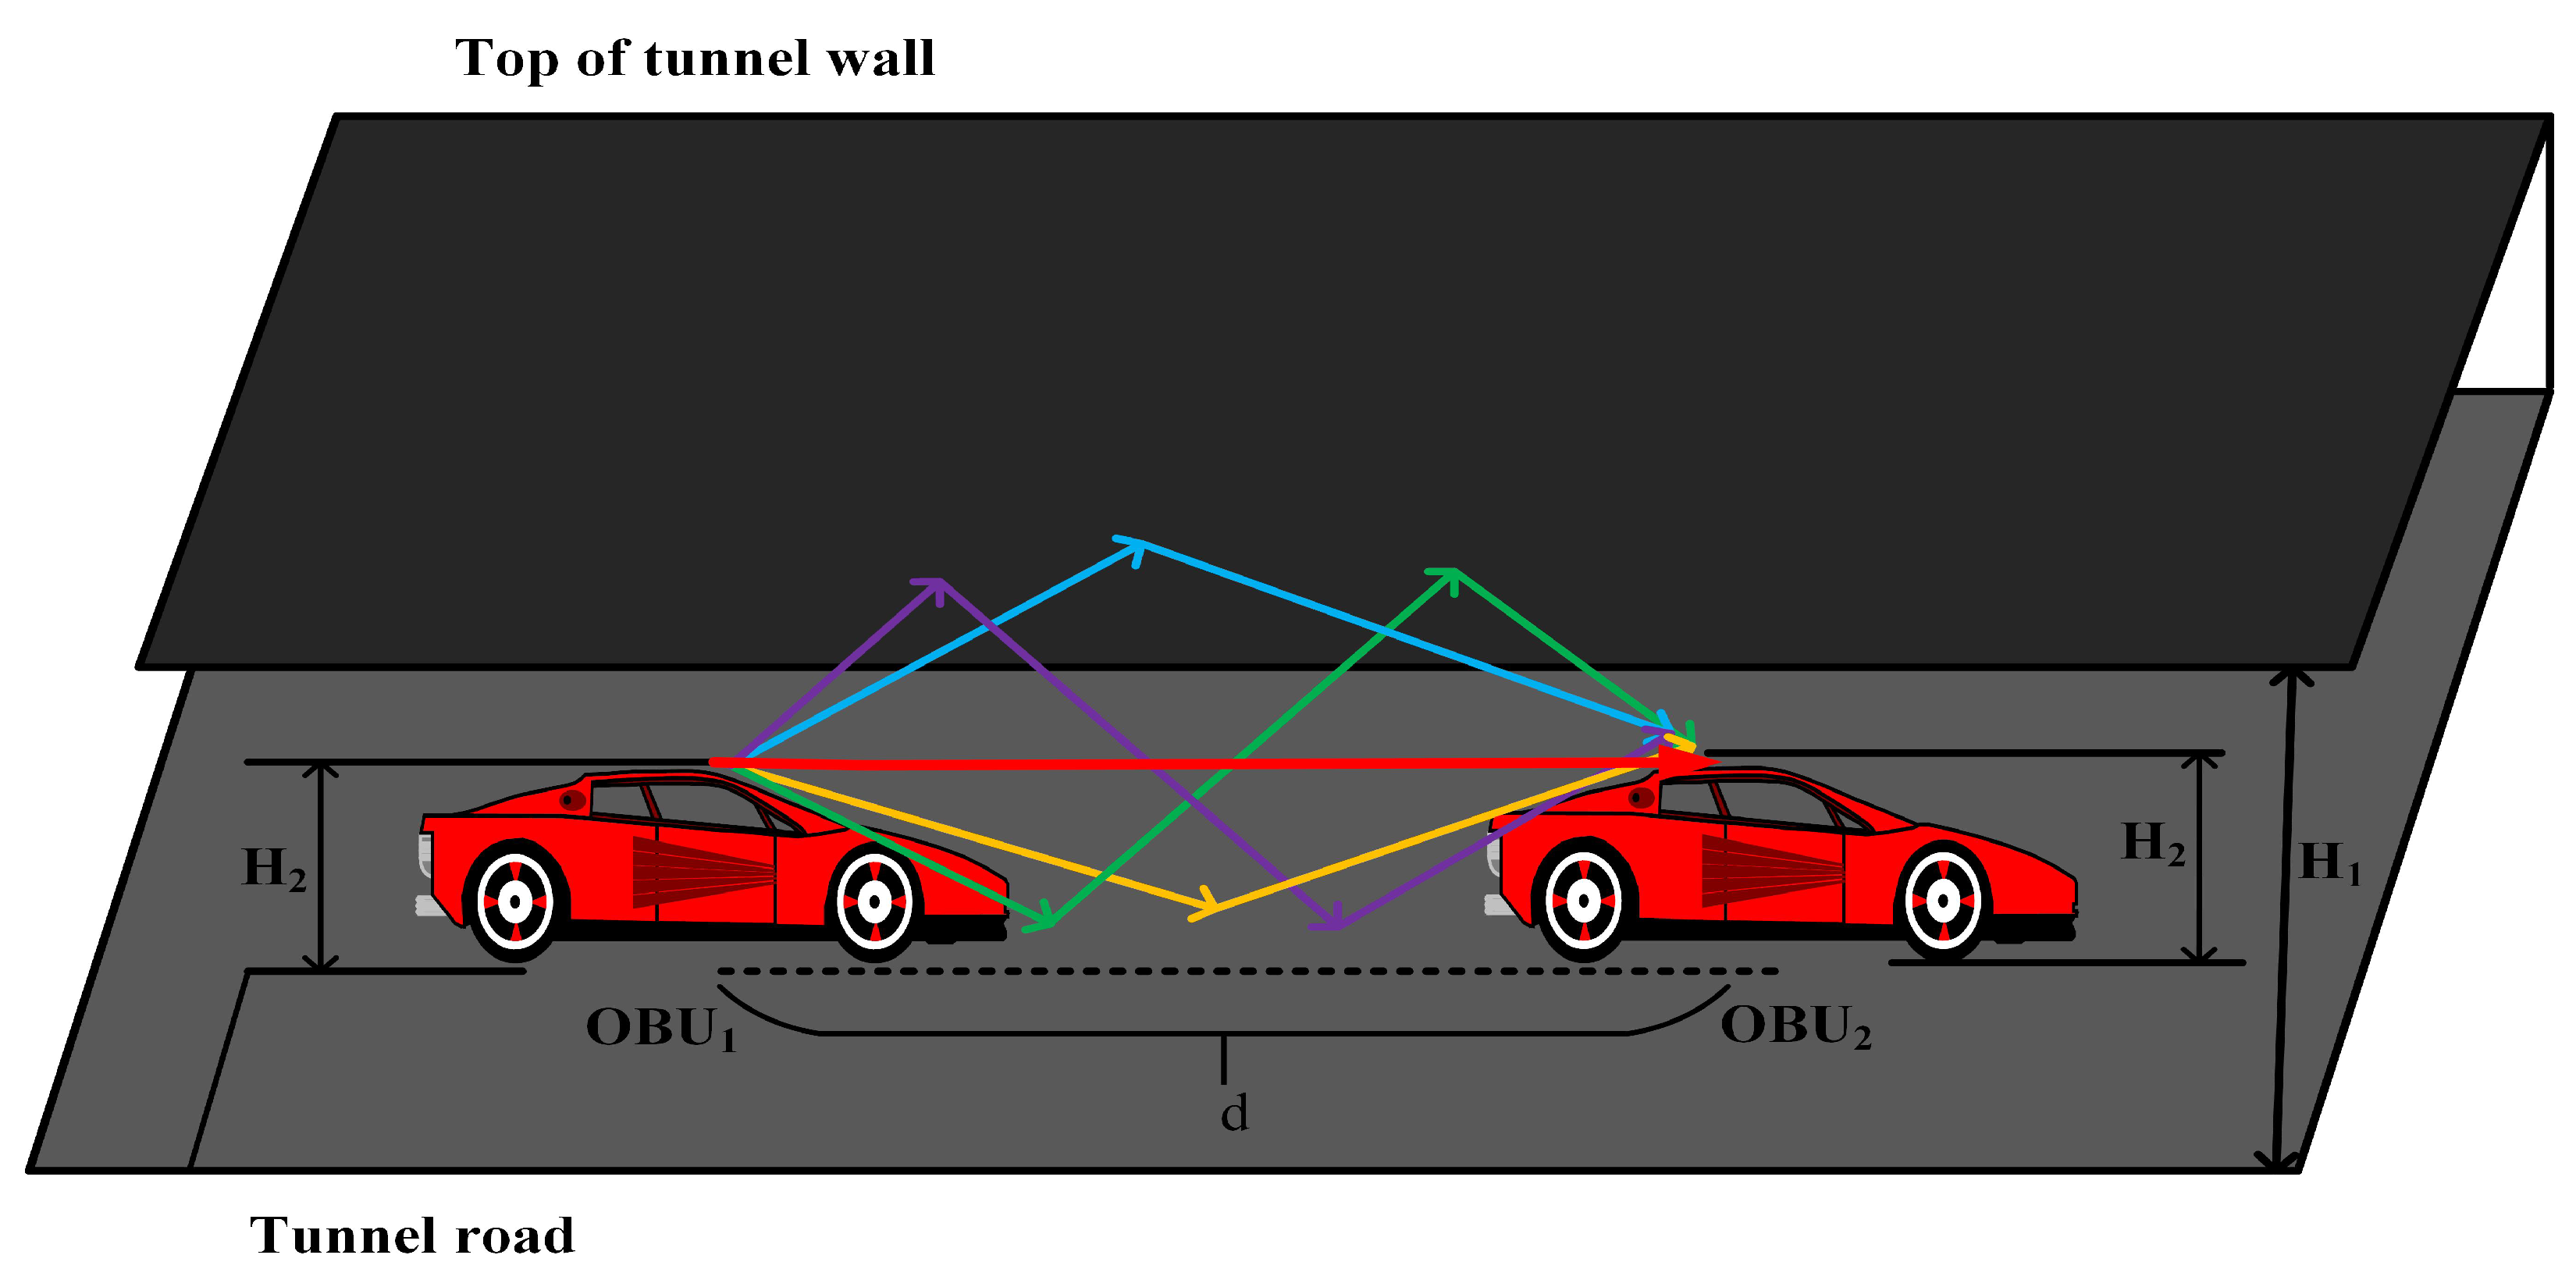
Figure 1. Vehicle Signal Propagation Model in a Tunnel.
Symmetry 15 01230 g001
Figure 2. One-time reflection path.
Symmetry 15 01230 g002
Figure 3. Two-time reflection path.
Symmetry 15 01230 g003
Figure 4. Three-time reflections path.
Symmetry 15 01230 g004
Figure 5. Vehicles and RSUs in tunnels.
Symmetry 15 01230 g005
Figure 6. V-MIMO.
Figure 6. V-MIMO.
Symmetry 15 01230 g006
Figure 7. V-SIMO.
Figure 7. V-SIMO.
Symmetry 15 01230 g007
Figure 8. V-MISO.
Figure 8. V-MISO.
Symmetry 15 01230 g008
Figure 9. V-SISO.
Figure 9. V-SISO.
Symmetry 15 01230 g009
Figure 10. Application of Reinforcement Learning in Tunnel Environments.
Symmetry 15 01230 g010
Figure 11. Application of Reinforcement Learning in Tunnel Environments.
Symmetry 15 01230 g011
Figure 12. The influence of reflection times on path loss.
Symmetry 15 01230 g012
Figure 13. Path loss under 6 different reflection coefficients when n = 1 reflection.
Symmetry 15 01230 g013
Figure 14. Path loss under 6 different reflection coefficients when n = 2 reflections.
Symmetry 15 01230 g014
Figure 15. Path loss under 6 different reflection coefficients when n = 3 reflections.
Symmetry 15 01230 g015
Figure 16. Standard deviation of the number of reflections with different tunnel environments.
Symmetry 15 01230 g016
Figure 17. Channel capacity of V-MIMO vs. SNR.
Symmetry 15 01230 g017
Figure 18. Training results of the V-DQN and Q-Learning.
Symmetry 15 01230 g018
Figure 19. Outage probability of V2R.
Symmetry 15 01230 g019
Table 1. Related parameters of V−DQN.
Simulation ParametersParameter Value
Carrier frequency5.8 GHz
Noise power P n o −125 dB
Additional attenuation coefficient of NLOS link η 20 dB
Environmental parameters A, B in tunnel scene0.2, 12
V2R transmit power P t 0.5 W
Height of A-RSU H 3 6 m
A-RSU interference power P t d 1 W
R2R transmission power0.5 w
SNR threshold10 dB
V2R Path Loss Index a r 3
Learning rate0.01
Reward discount Factor γ 0.8
Road typeone-way tunnel
Disclaimer/Publisher’s Note: The statements, opinions and data contained in all publications are solely those of the individual author(s) and contributor(s) and not of MDPI and/or the editor(s). MDPI and/or the editor(s) disclaim responsibility for any injury to people or property resulting from any ideas, methods, instructions or products referred to in the content.