Article

Robust Image Hashing Using Histogram Reconstruction for Improving Content Preservation Resistance and Discrimination

1
School of Data Science and Technology, Heilongjiang University, Harbin 150080, China
2
College of Mathematics Physics and Information Engineering, Jiaxing University, Jiaxing 314001, China
3
EIAS Data Science Lab, College of Computer and Information Sciences, Prince Sultan University, Riyadh 11586, Saudi Arabia
4
Department of Mathematics and Computer Science, Faculty of Science, Menoufia University, Shebin EI-Koom 32511, Egypt
*
Author to whom correspondence should be addressed.
Symmetry 2023, 15(5), 1088; https://doi.org/10.3390/sym15051088
Submission received: 25 March 2023 / Revised: 10 May 2023 / Accepted: 10 May 2023 / Published: 15 May 2023

Abstract

:
This paper proposes a new image hashing method, which uses histogram reconstruction to solve the problem of the histogram not being sensitive to the change of pixel position, while ensuring the robustness of the hashing algorithm against common content preservation attacks (such as blurring, noise addition and rotation). The proposed algorithm can resist arbitrary angles of rotation, possibly because the reconstructed histogram leverages the rotational symmetry and its own invariance to rotation operations. We measure the similarity between different images by calculating the Hamming distance of the hash vectors of different images. Our experiments show that the proposed method performs well in robustness and discrimination compared with other established algorithms. In addition, we conduct a receiver operating characteristic curve analysis to further verify the superior overall performance of our image hash method.

1. Introduction

Due to the rapid advancement in computer and communication technology, there has been a massive increase in multimedia information. This has resulted in several challenges such as increased storage costs and difficulties in retrieving information. At the same time, advancements in content creation technologies, such as Photoshop, have made it more challenging to determine the authenticity of multimedia information. To address these issues, image hashing technology can be utilized. The image hashing is similar to the traditional cryptographic hash function, as it can also reduce the storage requirements by compressing the image into a compact hash vector. Image hashing has been extensively researched and applied for various purposes, including authentication [1,2,3,4], identification [5,6,7], quality assessment [8,9], and tampering detection [10,11,12,13].
Image hashing has five important properties including robustness, discrimination, one-way function, compactness and unpredictability [14,15]. One-way function indicates that the attacker cannot deduce the content of the image from its final hash vector with an appropriate hashing algorithm. The concept of compactness emphasizes that the dimensionality of the hash vector should be significantly less than that of an image, indicating a reduction in size for efficient representation. The unpredictability indicates that the keys used for different hash vectors generation are different, thus ensuring the security of the hashing algorithm to a certain extent. Robustness and discrimination are the two most important properties. Robustness is described as follows:
P ( H m ( T ) H m ( T c ) ) 1 α , 0 α < 1 ,
and discrimination is described as follows:
P ( H m ( T ) H m ( T ) ) 1 γ , 0 γ < 1 .
in addition, unpredictability can be described as follows:
P ( H m ( T ) H m ( T ) ) 1 μ , 0 μ < 1 ,
where T represents an original image, T c expresses a copy of T and H m ( . ) indicates an image hashing function, which is related to the secret key m. Both α , γ and μ are close to zero. The concept of robustness in image hashing pertains to the degree of similarity between the hashes of images that share the same visual content. On the other hand, discrimination refers to the ability of an image hashing algorithm to generate dissimilar hashes for images that exhibit visual differences. Robustness refers to the ability of an image hash function to generate consistent hash values for the same image despite variations in image content, such as compression, noise, and other forms of distortion. A robust image hash function should be able to withstand various types of attacks and preserve the original image’s perceptual content. This property is particularly important in applications that involve image authentication or identification, where the hash values should remain unchanged even when the image undergoes some transformation or modification. Discrimination, on the other hand, refers to the ability of an image hash function to generate unique hash values for different images, such that even small changes in the image content result in significantly different hash values. Discrimination is crucial in image retrieval applications, where the goal is to find similar images in a large database, as well as in copyright protection applications, where the hash values serve as unique identifiers for copyrighted images. Ideally, a good image hash function should have both robustness and discrimination properties. Such a function should be able to generate consistent and unique hash values for different images, even in the presence of image distortions or modifications. Achieving these properties can be challenging and often requires a careful balance between robustness and discrimination, depending on the specific application requirements.
The histogram of an image provides a statistical representation of the distribution of pixel values. It is a useful tool for various applications, such as image retrieval and authentication, as it captures the characteristics of an image’s color, brightness, and contrast. One of the advantages of using histograms in image processing is their resilience to geometric transformations such as rotation or shearing [16]. This means that the shape of the histogram remains unchanged even when the image is transformed. This property is important in applications where image authentication or retrieval needs to be performed on transformed images. In watermarking applications, the histogram is often used to identify appropriate pixel groups for embedding a watermark [17]. This is achieved by selecting pixel groups that have similar characteristics based on the mean of pixel values. By doing so, the watermark can be embedded in areas of the image that are less likely to be perceptually significant. Another approach to using the histogram in image hashing is to divide it into multiple levels and generate the image hash based on these levels [18]. This can be useful in applications where a more fine-grained comparison of images is required. However, while the histogram provides valuable information about the statistical characteristics of pixels in an image, it does not take into account the relationship between pixels. This means that certain types of image manipulation, such as those that alter the spatial arrangement of pixels, may not be captured by the histogram alone. Therefore, it is important to use complementary techniques, such as those that analyze the spatial relationships between pixels, in combination with the histogram for more robust image processing applications.
This study proposes an innovative method for the reconstruction of histograms that overcomes the constraints associated with conventional histograms. Extensive experimentation has been conducted using a diverse set of images to evaluate the effectiveness of our algorithm. The results demonstrate its robustness against common non-malicious image manipulations such as rotation and blurring, as well as its remarkable discriminatory capability. A comparison with existing methods highlights the superiority of our image hashing scheme.
The forthcoming sections of this article are structured as follows: Section 2 provides a comprehensive survey of recent progress. In Section 3, we explicate the algorithmic methodology in detail. Section 4 presents and evaluates the results of the experiments conducted. Finally, we concludes our contribution to the research in the Section 5.

2. Literature Review

Image hashing has found widespread applications across various domains, including image quality evaluation. Over time, researchers have introduced various image hashing techniques that leverage different features. By categorizing existing algorithms, there exist several categories of image hashing methods, which include transform-domain-feature-based approaches, spatial-feature-based approaches, statistical-feature-based approaches, and matrix-factorization-based approaches.

2.1. Transform Domain Feature

The robustness of transform-based methods is better than some spatial image hashing methods, because it takes less time to extract features in the transform domain. Ram et al. proposed an effective method to generate image hashing by combining singular value decomposition (SVD) and discrete wavelet transform (DWT) [19]. The author firstly converts the image to HSV space and applies 2D-DWT on V components. SVD is employed to obtain the singular value. Finally, the first right and left singular values are concatenated to form a hash vector. Based on the results of the experiments, it can be concluded that this scheme possesses a high level of robustness against image modifications such as brightness and contrast adjustments, JPEG compression, rotation, watermarking, and others. Furthermore, it is also sensitive to malicious modifications. Moreover, this scheme has the ability to detect and locate tampered areas. From the experimental results, we conclude that this scheme has great robustness on brightness and contrast adjustment, JPEG compression, rotation, watermark, etc. This technology is also sensitive to malicious operations. In addition, this scheme can locate the tampered area. Tang et al. used weighted DWT to assess images quality [8]. Tang extracts the edge image using Canny operator and then divided the edge image into several sub-blocks. For each block, different sub-bands are obtained by applying 2D-DWT. Then assign different weights to sub-bands where the sum of weights is 1. Finally, these weighted DWT features are concatenated and quantized to generate image hashing. Experiments show that this method is resistant to most content-preservation operations except for large angle rotations. In [20], Lei et al. employed radon transform (RT) to design an image hashing scheme. In this scheme, RT operations are first carried out and the moment features are calculated to resist these transformations. Following this, feature points undergo a discrete Fourier transform (DFT), and the resulting DFT coefficients are concatenated to produce the hash. Empirical evaluations have shown the efficacy of this hashing method in withstanding typical non-malicious attacks.

2.2. Spatial Feature

Local feature points are very important image features and have attracted extensive attention from scholars. Ouyang and colleagues [21] proposed a novel image hashing method that leverages quaternion Zernike moments (QZMs) in combination with the scale invariant feature transform (SIFT) for enhanced performance. Specifically, the QZMs were employed as global features to facilitate image retrieval, while the SIFT features were utilized to pinpoint regions of tampering. This approach represents a notable advancement in the field of image hashing. Abbas and colleagues [22] proposed a perceptual image hashing approach that employs Noise Resistant Local Binary Pattern (NRLBP) and Discrete Cosine Transform (DCT) to improve fidelity. Initially, the input image was partitioned into several blocks, with DCT coefficients subsequently extracted from each sub-block. The NRLBP algorithm was then applied to calculate the corresponding histogram for each sub-block, and these histograms were subsequently concatenated to generate the hash vector. This scheme is resistant to several non-malicious attacks except rotation. Moreover, this scheme can detect the tampering area, which is less than 3% of the original image size. Xue et al. designed a scheme employing the key points and local region features [23]. The algorithm extracted the key points according to SIFT and saliency detection. Then, they extracted local binary pattern (LBP) operator as local feature points according to these key points. Finally, they combined the key points and local area feature into a hash vector.

2.3. Statistical Features

For image hashing, the most commonly used statistical features are histograms and invariant moments. Xiang [16] designed a geometric robust scheme using a histogram. Xiang found that the relative relationship between different bins remains unchanged in a geometrical attack. Based on Xiang’s research, researchers reconstruct histograms in different ways to enhance the shape invariance of histograms [3,18,24,25,26], thereby enhancing the robustness of perceptual hash algorithms. Choi [18] divided the histogram into different levels and assigns different weight factors according to the levels. Tang [24] computed the color vector angle of image pixels, extracted the histogram and then compressed the histogram to generate image hashing. Gharde [25] used a fuzzy color histogram to design an image authentication scheme. Overall, this method achieves a satisfactory performance for geometrical attacks. However, the discrimination of this algorithm has the potential to be improved. Besides histograms, moment invariants [27] are also useful image features. Tang [28] integrated a saliency map and moment invariants to generate hashing. The method can resist a variety of content-preservation operations. Zhao [29] employed Zernike moments as a means of identifying manipulated regions within an image. To accomplish this, Zhao partitioned the original image into multiple sub-blocks and computed the Zernike moments of each sub-block. The resultant values were subsequently combined to create a hash. This approach offers the capacity to both identify and localize instances of image tampering. A novel method based on a Gaussian Hermite moment is proposed [30]. This method is formed by computing Gaussian Hermite moments of grayscale images and extracting invariants of different orders of moments. In summary, statistical feature extraction methods utilize the symmetry and invariance properties present in images or data to enhance robustness against rotation or other geometric attacks. By leveraging the symmetry of objects and the invariance to geometric transformations, these methods extract stable and discriminative feature representations, enabling algorithms to maintain accuracy and stability when confronted with rotation or other geometric attacks. In other words, image hashing based on statistical features has a satisfactory performance on robustness.

2.4. Matrix Decomposition

The matrix decomposition methods often used in image hashing are SVD, non-negative matrix decomposition (NMF), etc. From Kozat’s [31] point of view, the content-keeping operations are part of the linear operators. Kozat regards the spectral matrix invariants as features and employs twice SVD to conduct hashing. Monga [32] found that geometric attacks can be thought of as independent and identically distributed noises of images. So, Monga extracted the image hash by employing NMF. Tang [10] proposed a model by combining NMF and ring partition. The input image is divided into some rings. The method has a great classification performance. Wu [33] incorporated a salient region (SR) with NMF to generate hashing. The SR-NMF hashing is very resistant to most content-preserving operations in addition to rotation. Combining center-symmetric local binary patterns (CSLBP) and SVD, Davarzani [34] designed an image hashing algorithm. Davarzani extracted CSLBP from the original grayscale image. The SVD-CSLBP hash is resistant to JPEG compression, blurring, and brightness changes. Moreover, this scheme has the ability to locate tampered regions. The researchers [35] present an image hashing algorithm based on tensor decomposition. The researchers first extract features from multiple views, including structure, edge, and color features. Then, they construct a high-order tensor based on these views. Next, they apply the Tucker decomposition algorithm to generate a hash code from the tensor. The experimental results demonstrate that this algorithm exhibits strong robustness.

3. The Proposed Scheme

The algorithmic procedure encompasses three distinct stages. The initial step in image processing involves pre-processing, which comprises several operations such as image graying, resizing, and Gaussian low-pass filtering. The next stage involves histogram reconstruction of the images, followed by the third step, which entails extracting image hashing from the reconstructed histogram. This process is a common approach in the field of image processing and computer vision to extract features and information from images. By applying pre-processing techniques and reconstructing the histogram, it is possible to identify significant visual features that can be used for image recognition and analysis. The whole process is shown in Figure 1.

3.1. Pre-Processing

In most cases, a color image is composed of pixels corresponding to the red (R), green (G), and blue (B) color channels. The combination of pixel values across these three channels generates a vast array of distinct colors. However, this process also results in the generation of a considerable amount of extraneous or redundant information that is of limited utility. Since our scheme does not require color information, we convert the three-channel color image into a grayscale image. The three channels are converted into one channel by the following equation:
G r a y ( x , y ) = ( R ( x , y ) + G ( x , y ) + B ( x , y ) ) / 3 .
After converting an image to grayscale, we employ bilinear interpolation to resize it to a fixed size of M × M . This is a common technique used to preserve the aspect ratio of the original image while increasing or decreasing its size. Bilinear interpolation involves computing new pixel values based on the weighted average of neighboring pixels. The resulting image has smoother edges and more accurate color representation than other interpolation methods. Overall, this process helps to standardize images for further analysis and processing. Furthermore, the resize operation can withstand the impact of scaling operations.
To significantly reduce the effects of noise or filtering, Gaussian low-pass filtering [33] will be employed. The Gaussian filtering is calculated as follows:
I σ = I G σ ,
where I is the image, * means convolution operation, and G σ is defined as
G σ = 1 2 π σ e ( x 2 + y 2 ) 2 σ 2 ,
where σ is the standard deviation.

3.2. Reconstructing Histogram

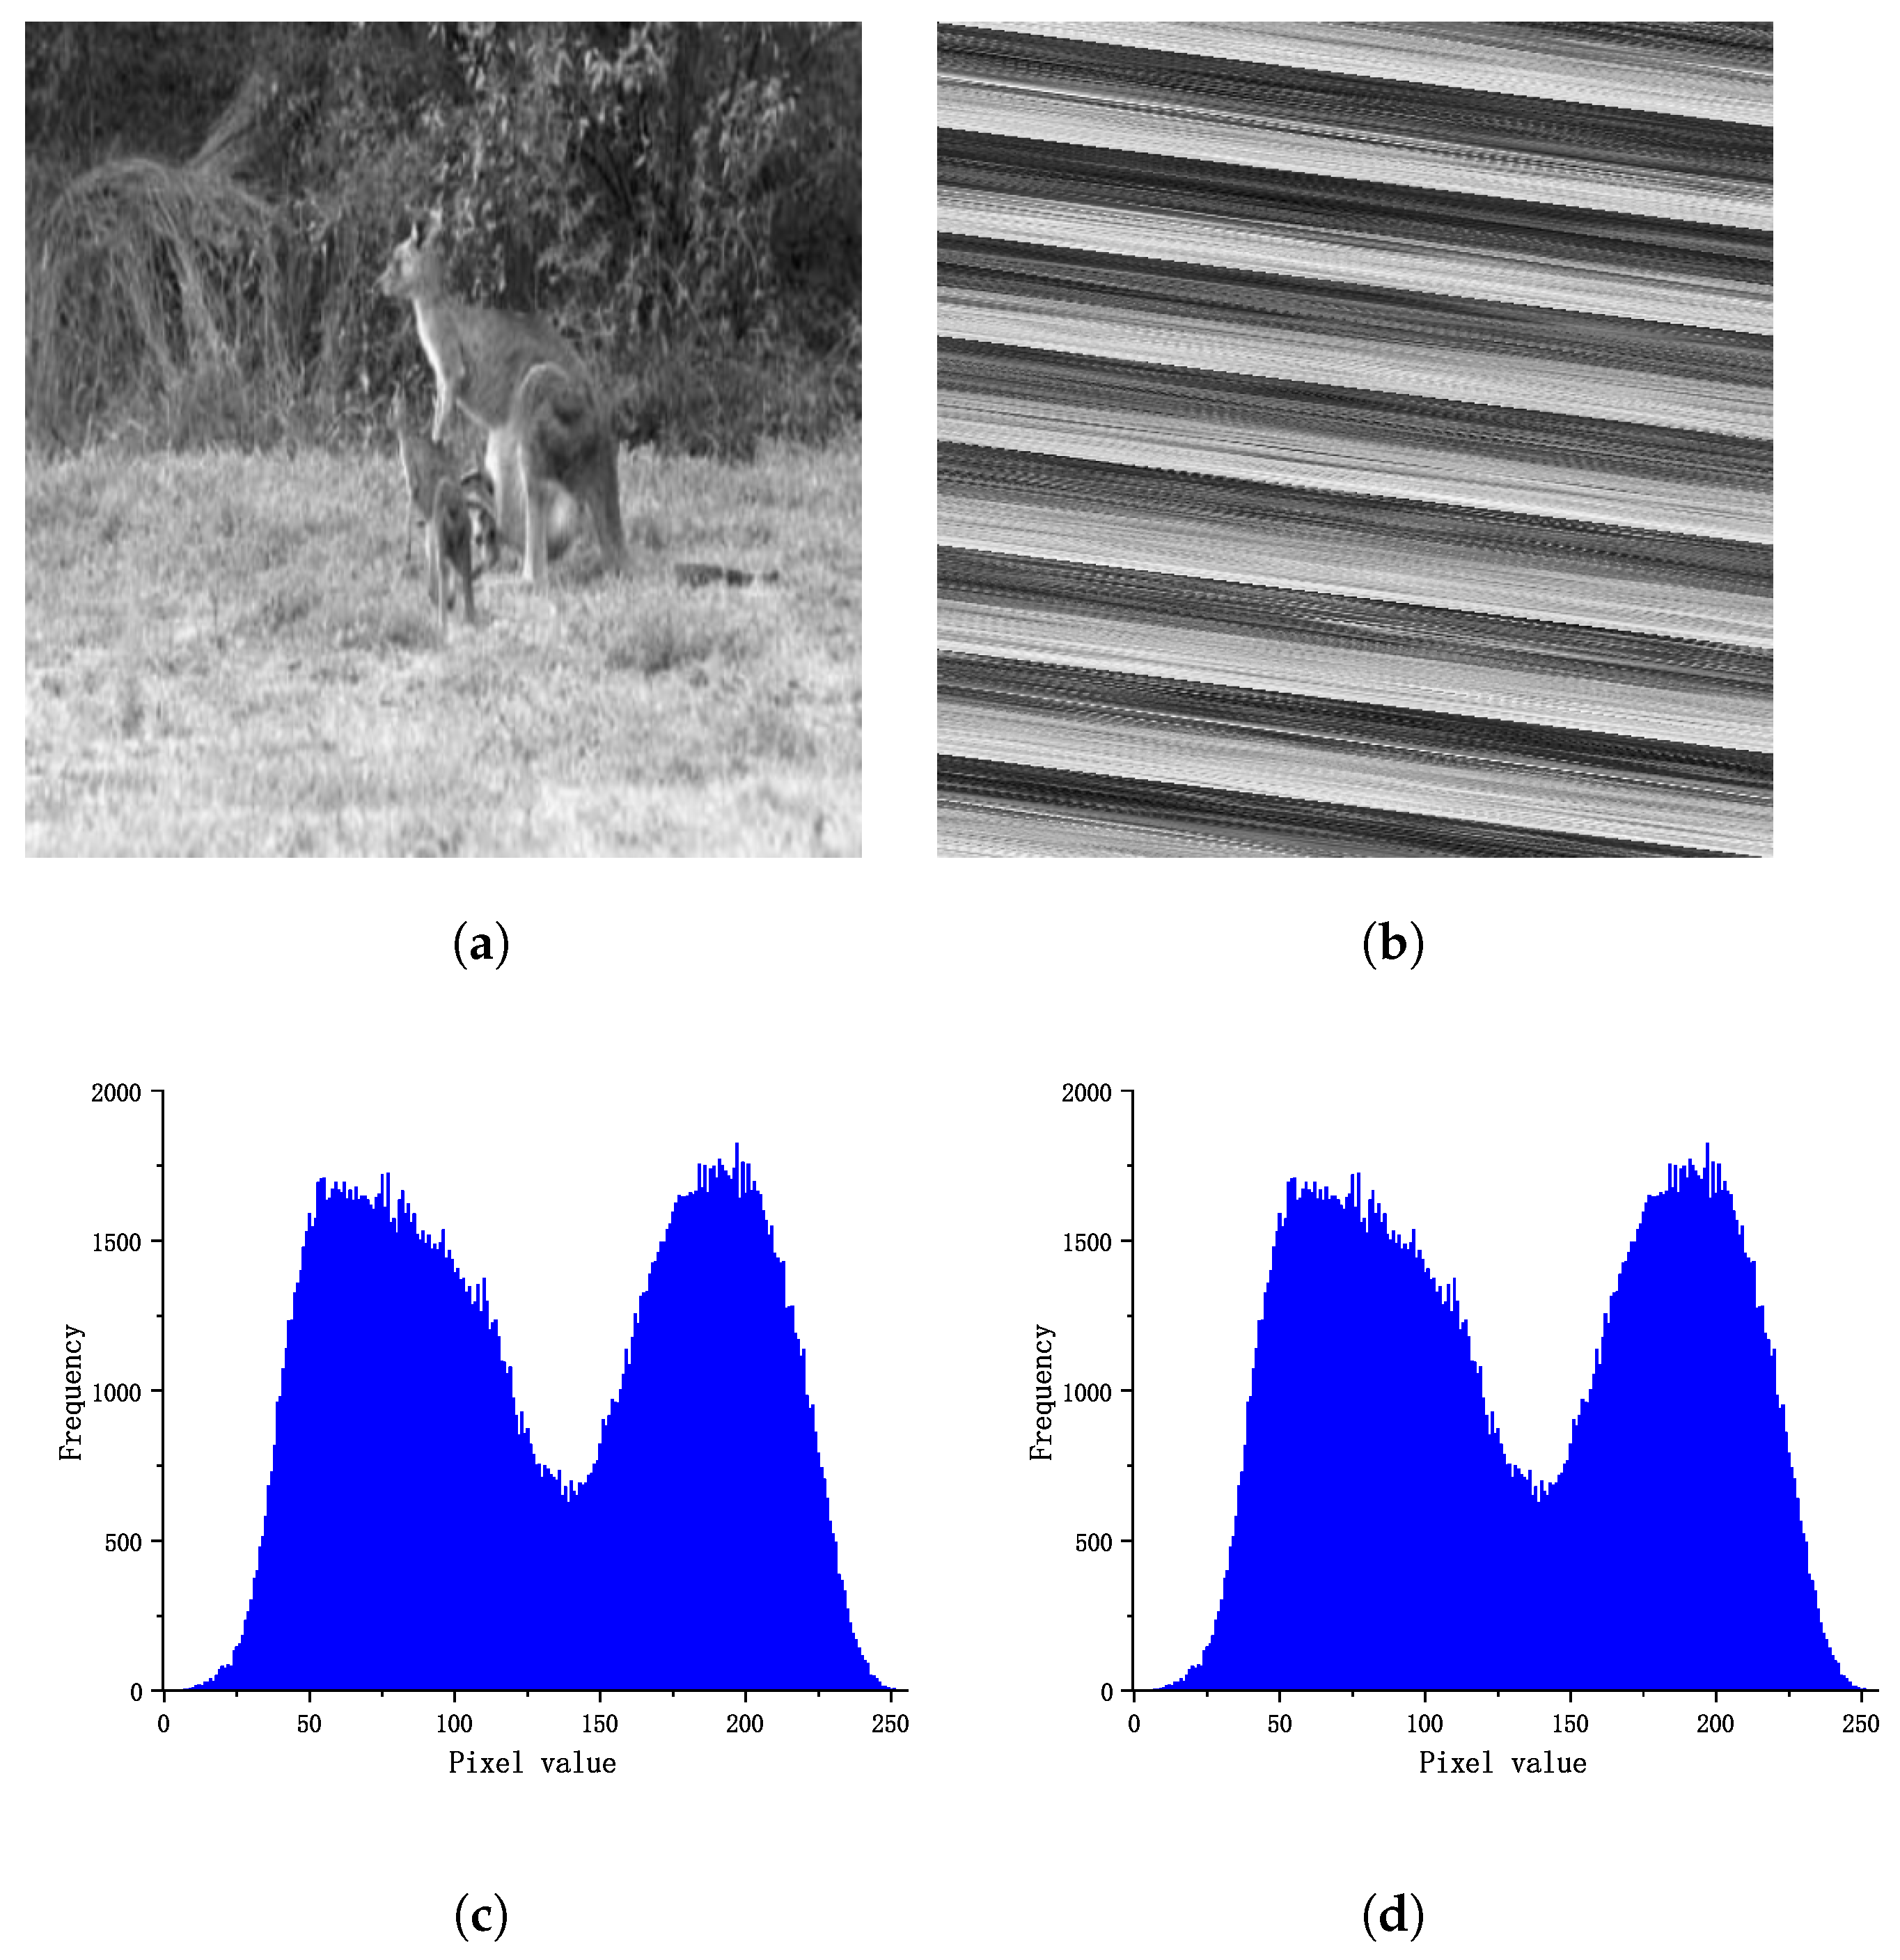
The frequency distribution of pixels within an image can be captured by the histogram, which has been shown to be effective in resisting a range of geometric attacks when utilized for image hashing [3,16,18,24,25,26]. Nevertheless, the histogram solely represents the probability of occurrence for each gray value pixel within the image, and loses the information about the location of pixels. This means the histogram cannot distinguish location-based attacks. There is an extreme example shown in Figure 2. Figure 2b is obtained by Arnold scrambling [36] from Figure 2a. Arnold scrambling is a transformation that alters the pixel’s location while maintaining its original value. As depicted in Figure 2, a significant visual dissimilarity exists between Figure 2a and b. However, upon inspecting the histograms of the two figures, they are found to be identical. To address this issue, a histogram reconstruction method is proposed through the relationship between pixels and surrounding pixels. This relationship of reconstruction can be described as the number of surrounding pixels belonging to different bins with a pixel at the center.
Consider an image I with dimensions M × M , where each pixel has a neighborhood of size N × N that is odd. The relationship R e ( x , y ) for a given point ( x , y ) can be computed using Formula (7). To express this in a more formal and technical manner, one could say that for a discrete image with dimensions M × M , each pixel is linked to an odd-sized neighborhood of N × N . The relationship between the pixel at point ( x , y ) and its neighborhood can be determined using a mathematical formula denoted as R e ( x , y ) , which is computed according to Formula (7).
R e ( x , y ) = i = n n j = n n G ( x , y , i , j ) ,
where n = N / 2 and G ( x , y , i , j ) is defined as expression (8).
G ( x , y , i , j ) = 1 i f B i n ( x , y ) B i n ( x + i , y + j ) 0 o t h e r w i s e ,
where B i n ( x , y ) indicates the bin which the pixel p ( x , y ) belongs to and B i n ( x , y ) can be calculated as Formula (9).
B i n ( x , y ) = p ( x , y ) W .
This expression uses the notation p ( x , y ) to denote the pixel located at the ( x , y ) coordinates, while W refers to the width measurement of each bin. The formula provides a mathematical expression for computing the bin of a given pixel in a precise and rigorous manner.
During the process of histogram reconstruction, we need to iterate over each pixel, denoted as p ( x , y ) . Then, based on Equation (9), we calculate the index i corresponding to the bin to which the current element belongs. We denote the bin to which the current pixel belongs as h w ( i ) . Next, using Equation (7), we calculate the relationship R e ( x , y ) between the current pixel and its surrounding pixels. Finally, we add R e ( x , y ) to h w ( i ) . All the h w ( i ) are then concatenated to form the final reconstructed histogram. The reconstructed histogram of an image can be described as follows:
H W = [ h W ( 1 ) , h W ( 2 ) , , h W ( K ) ] .
Next, the reconstructed histogram H W is randomly permuted by a key. We use the random generator where the seed is a key to generate K pseudorandom numbers. These pseudorandom numbers are arranged in ascending order and then we store the original positions in the array Z. Thus, we can generate permuted elements through the following formula:
h W k e y ( i ) = h W ( Z [ i ] ) ( 1 i K ) .
The final reconstructed histogram can be represented as follows:
H W k e y = [ h W k e y ( 1 ) , h W k e y ( 2 ) , , h W k e y ( K ) ] .

3.3. Pixel Selecting

In digital image processing, it is known that after a rotational transformation, the pixels within the inscribed circle of an image stay within the circle. Based on this observation, our approach involves using only the pixels within the inscribed circle of the image to reconstruct its histogram. This ensures that the histogram is more accurate and reliable, especially when the image undergoes a rotational transformation. By focusing on the pixels within the circle, we can reduce errors or artifacts that may occur when considering the entire image. This technique is useful in scenarios where rotational invariance is important in image analysis or processing. The set P of eligible pixels is described as follows:
P = { p ( x , y ) | d x , y r } .
In the given context, the symbol p ( x , y ) refers to the value assigned to the pixel situated at the coordinates ( x , y ) within the image. Additionally, the distance between the pixel at ( x , y ) and the image’s center ( x c , y c ) can be represented as d x , y , which is computed utilizing the Euclidean distance [8] formula.
d x , y = ( x x c ) 2 + ( y y c ) 2 .
The calculation of the radius of the inscribed circle, which is represented by the symbol r,
r = M 2 ,
where M the width of the image. In addition, some redundant pixels are filled around the image after rotation operation. The populations of some bins are changed by the operation. In some bins, the population is zeros or a few [16]. In our scheme, we need to filter out these bins. Taking into account this situation, we reconstruct the histogram in a selected gray scale range, which is determined by the mean of the pixels. The gray range B can be selected as follows:
B = [ ( 1 α ) E ¯ , ( 1 + α ) E ¯ ] ,
where α is a positive number and E ¯ is the mean of pixel values. The number of bins, K, is determined by the following formula.
K = 2 α E ¯ W ,
in which W means the width of bins.

3.4. Hash Generation

The last step in our method is generating the hash vector with the reconstructed histogram H W k e y , which is calculated as Formula (12). Suppose a group including two different bins represented as { h W k e y ( i ) , h W k e y ( j ) }. For the group { h W k e y ( i ) , h W k e y ( j ) }, a binary vector can be generated according to the following formula.
b i t = 1 i f h W k e y ( i ) h W k e y ( j ) 0 o t h e r w i s e .
The number of group L is calculated as follows:
L = K × ( K 1 ) 2 .

3.5. Similarity Metric

In image hashing schemes, distance is a commonly employed metric for indicating the degree of similarity that exists between two given images. Here, the Hamming distance [18] d h a m is used as a similarity in our scheme. Hamming distance is calculated as follows:
d h a m = i = 1 L | H a s h 1 ( i ) H a s h 2 ( i ) | ,
where H a s h 1 and H a s h 2 represent the hash values of two images. L can be calculated according to Formula (19). Then, compare d h a m and threshold T, and judge whether the images are similar according to the results. This process can be described as follows.
R e s u l t = S i m i l a r i f d h a m T D i f f e r e n t o t h e r w i s e ,

4. Simulation Results

Within this section, we aim to carry out a range of experiments that will serve to verify the efficacy of our hashing approach. In the pre-processing stage, the initial step involves resizing the input image to a uniform size of 512 × 512 , as per the established standards. Following this, we implement a Gaussian filter to smooth noise. In the process of histogram reconstruction, the width of bins is set to 4. In addition, in Equation (16), the value of α is 0.6 and the value of E ¯ is 120. In Equation (11), the k e y is randomly generated. The robustness experiment is presented in Section 4.1. The aspect of discrimination is covered in Section 4.2, with the analysis of tamper detection in Section 4.3 and a discussion on the impact of neighborhood size in Section 4.4. Section 4.5 of our study involves a comparative analysis between our proposed scheme and four other advanced algorithms. In Section 4.6, we undertake a detailed examination of the key sensitivity aspects of our proposed scheme.

4.1. Perceptual Robustness

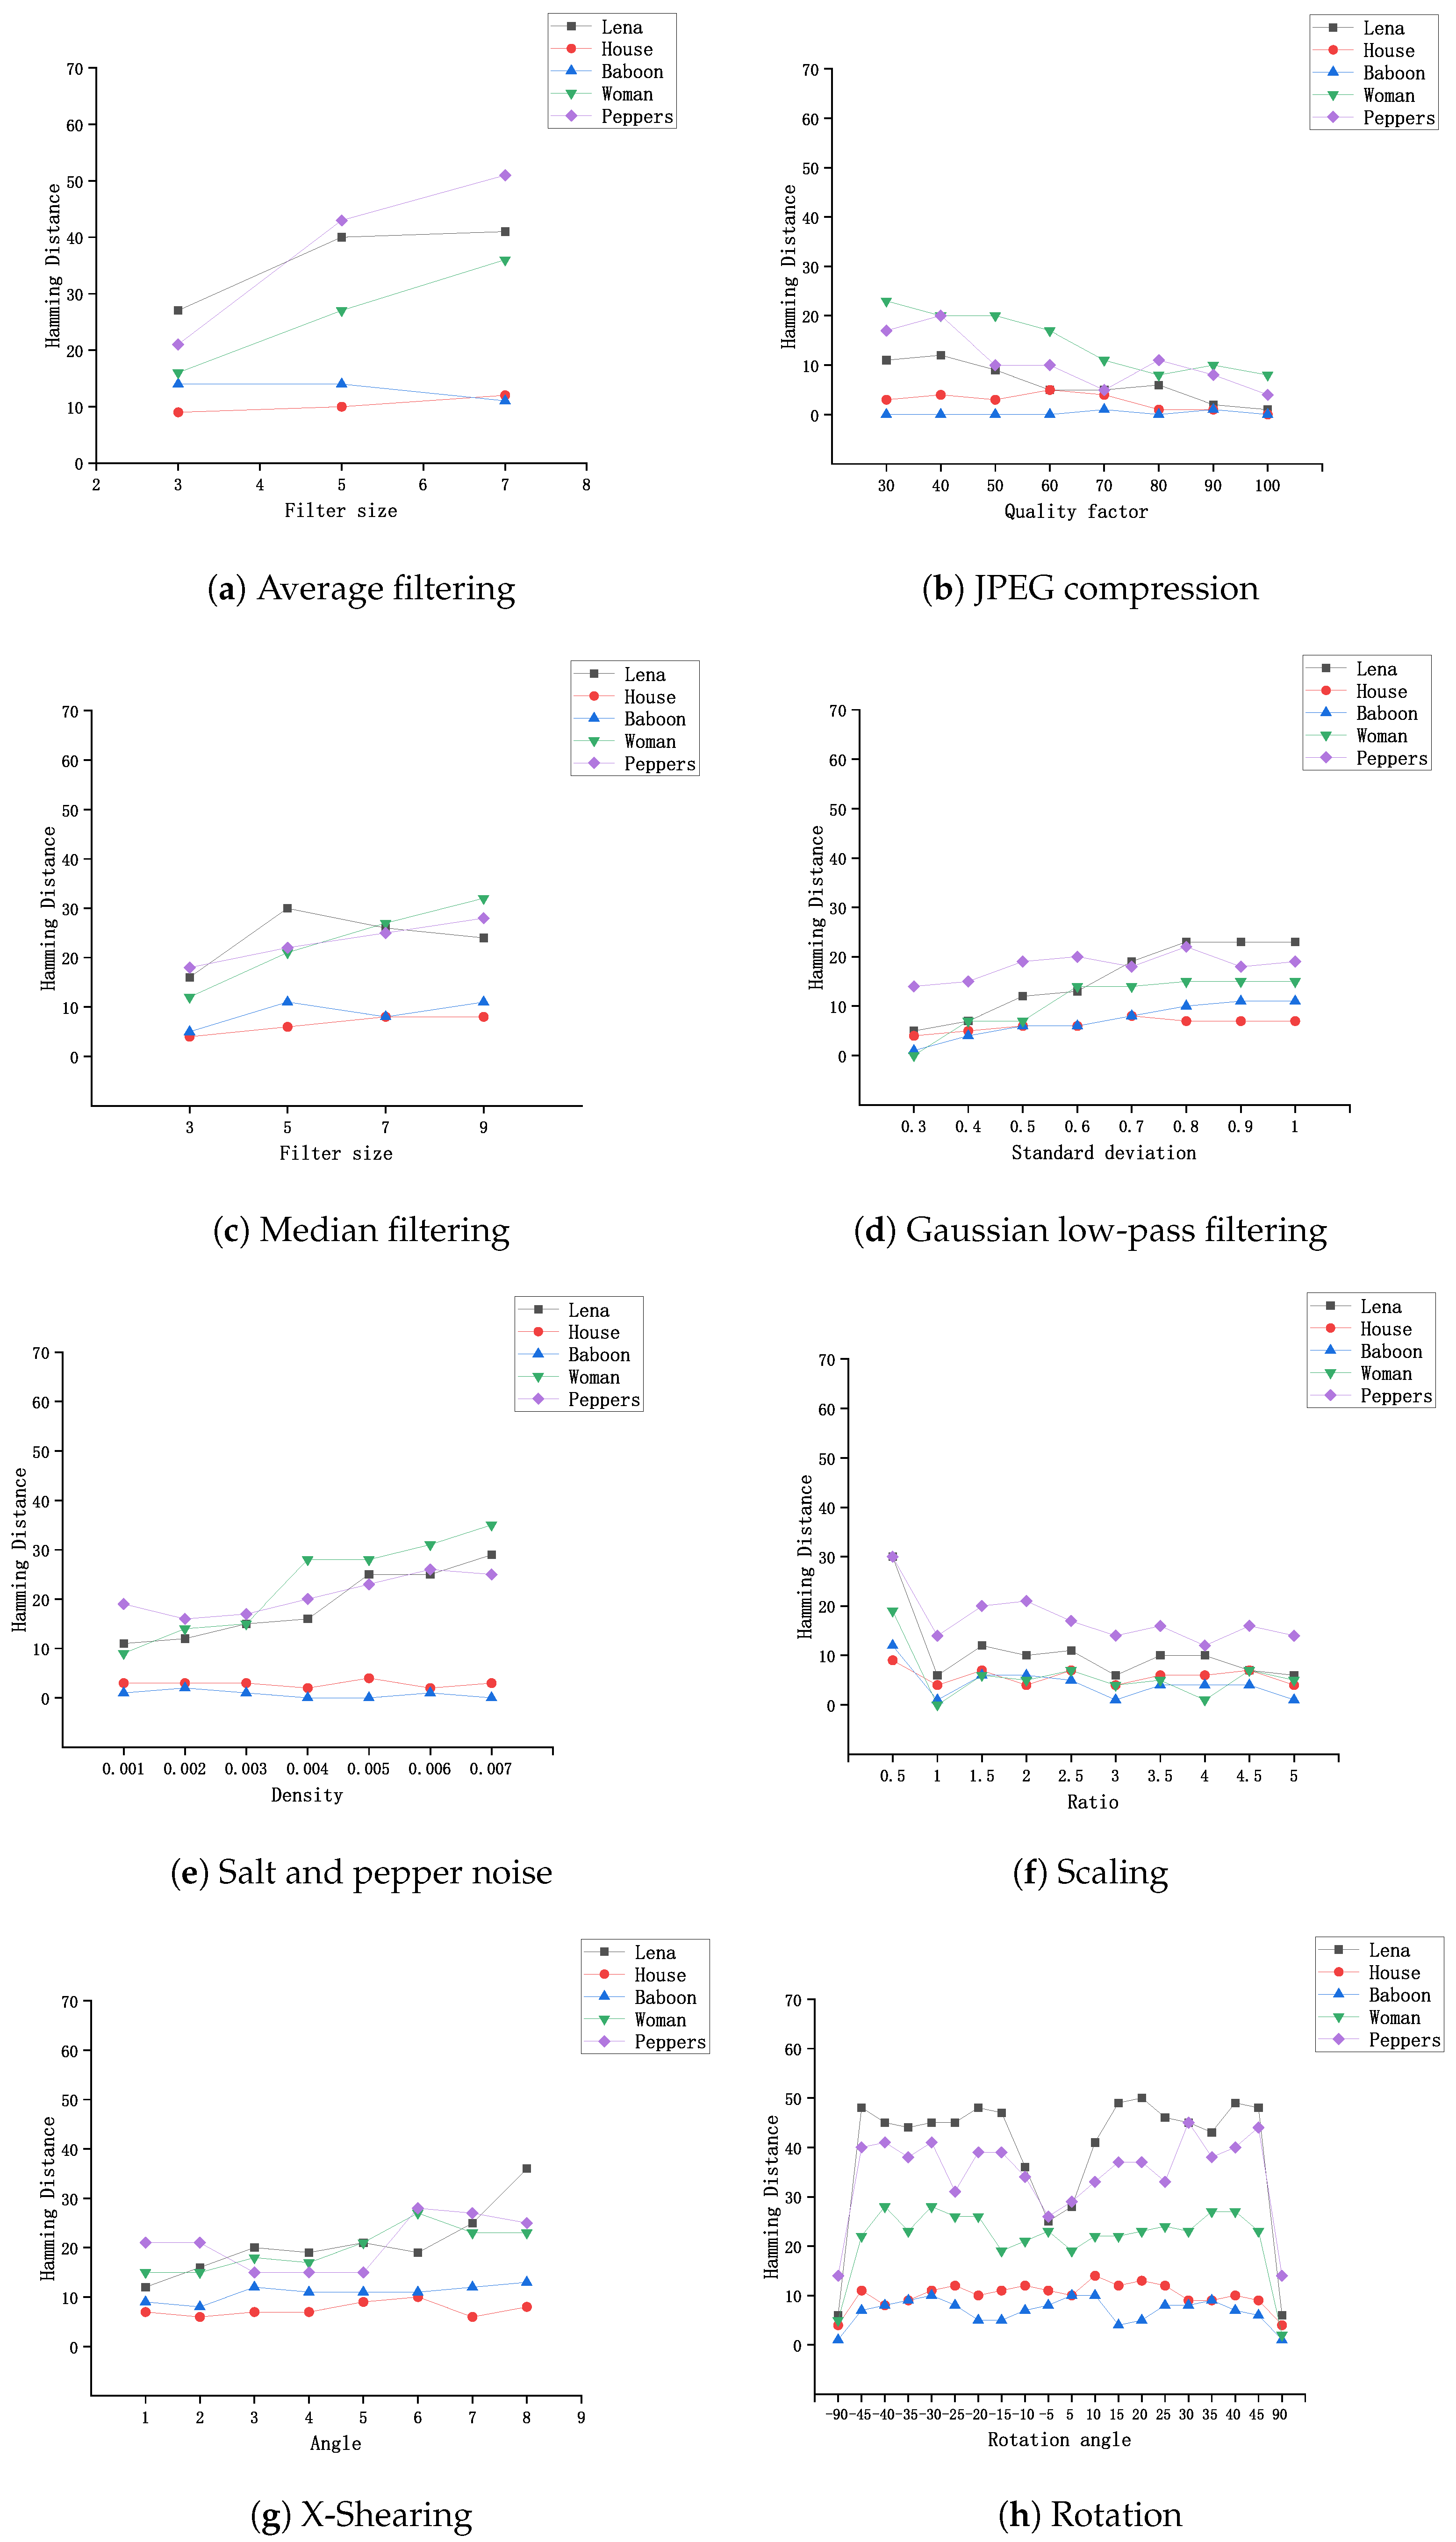
In this section, five images are selected to evaluate the ability to resist non-malicious attacks. They are “Woman”, “Baboon”, “House”, “Lena” and “Peppers”, and all of these images’ sizes are 512 × 512 . Each image is attacked by eight common content keeping manipulations. These manipulations include filtering, JPEG compression, salt and pepper noise, scaling, X-Shearing, and rotation. Every manipulation includes several parameters and 67 different attacks are used in total. A detailed introduction is shown in Table 1. These parameters indicate the number of operations to be performed on the attacked images. It follows that as the parameter value increases, the intensity of the attack also increases, consequently resulting in a poorer quality of the image, with the exception of rotation and JPEG compression. For JPEG compression, as the parameter becomes smaller, the quality of the image becomes worse. For rotation, the parameter indicates the angle of rotation. For example, −5 means the image is rotated five degrees clockwise and 5 means the image is rotated five degrees counterclockwise. Therefore, the number of duplicate images is 5 × 67 = 335 . To assess the similarity between each pair of visually similar images, the corresponding Hamming distance is computed by using Formula (20). The analysis of the findings is illustrated through Figure 3, which depicts a graphical representation of the results. The x-axis of the graph indicates the operations performed, while the corresponding Hamming distance is displayed on the y-axis. Our observations from the graphical representation of Figure 3 demonstrate a direct correlation between the increase in attack intensity and the corresponding increase in Hamming distance. As shown in Figure 3b,d, the maximum Hamming distance is more than 20, but not more than 30. The Gaussian filtering and JPEG compression reduce qualities of the attacked images with different parameters. However, the shape of the reconstructed histogram changes little with less qualities, and the Hamming distance changes little. In average filtering and median filtering, Hamming distance increases with the growth of parameters as shown in Figure 3a,c. The higher filter sizes lead to the large reconstructed histogram being changed. In a scaling attack, the Hamming distance is basically unchanged with the increase in parameters as shown in Figure 3f, because the resizing operation is adopted in the pre-process and an appropriate width of a histogram can resist the influence of interpolation. In a salt and pepper noise attack, with increasing the density, the shape of the reconstructed histogram has been changed, which leads to a higher Hamming distance as shown in Figure 3e. Although noise takes new information into the image, the reconstructed histogram can handle such impacts. As shown in Figure 3g, the Hamming distance changed little with the angle becomes larger, which means X-Shearing has little influence on the reconstructed histogram. For rotation attack, when the rotation angle changes, the Hamming distance fluctuates within a certain range. This may be because the rotation operation creates many padding data. Additionally, the maximum distance is 50, as we can see in Figure 3h.
To determine the threshold for distinguishing images with different contents in the proposed method, a dataset with 63 different color images is constructed. All images are attacked with the same operations as 5 images and 67 × 63 = 4221 images with similar content are generated. We extract hash vectors of all images and calculate each pair of hash vectors’ Hamming distance. The statistical result is illustrated in Table 2. As we can see from Table 2, the minimum distance is 0 and the maximum distance is 63. The mean is less than 40. If the threshold T equals 40, 3.13 % similar images are falsely detected. When T = 50 , the error rate will be reduced to 0.83 % . If T = 63 , the error rate is 0. This means all similar images are correctly detected. It is clear that, as the threshold becomes larger, the robust performance becomes better.

4.2. Discrimination

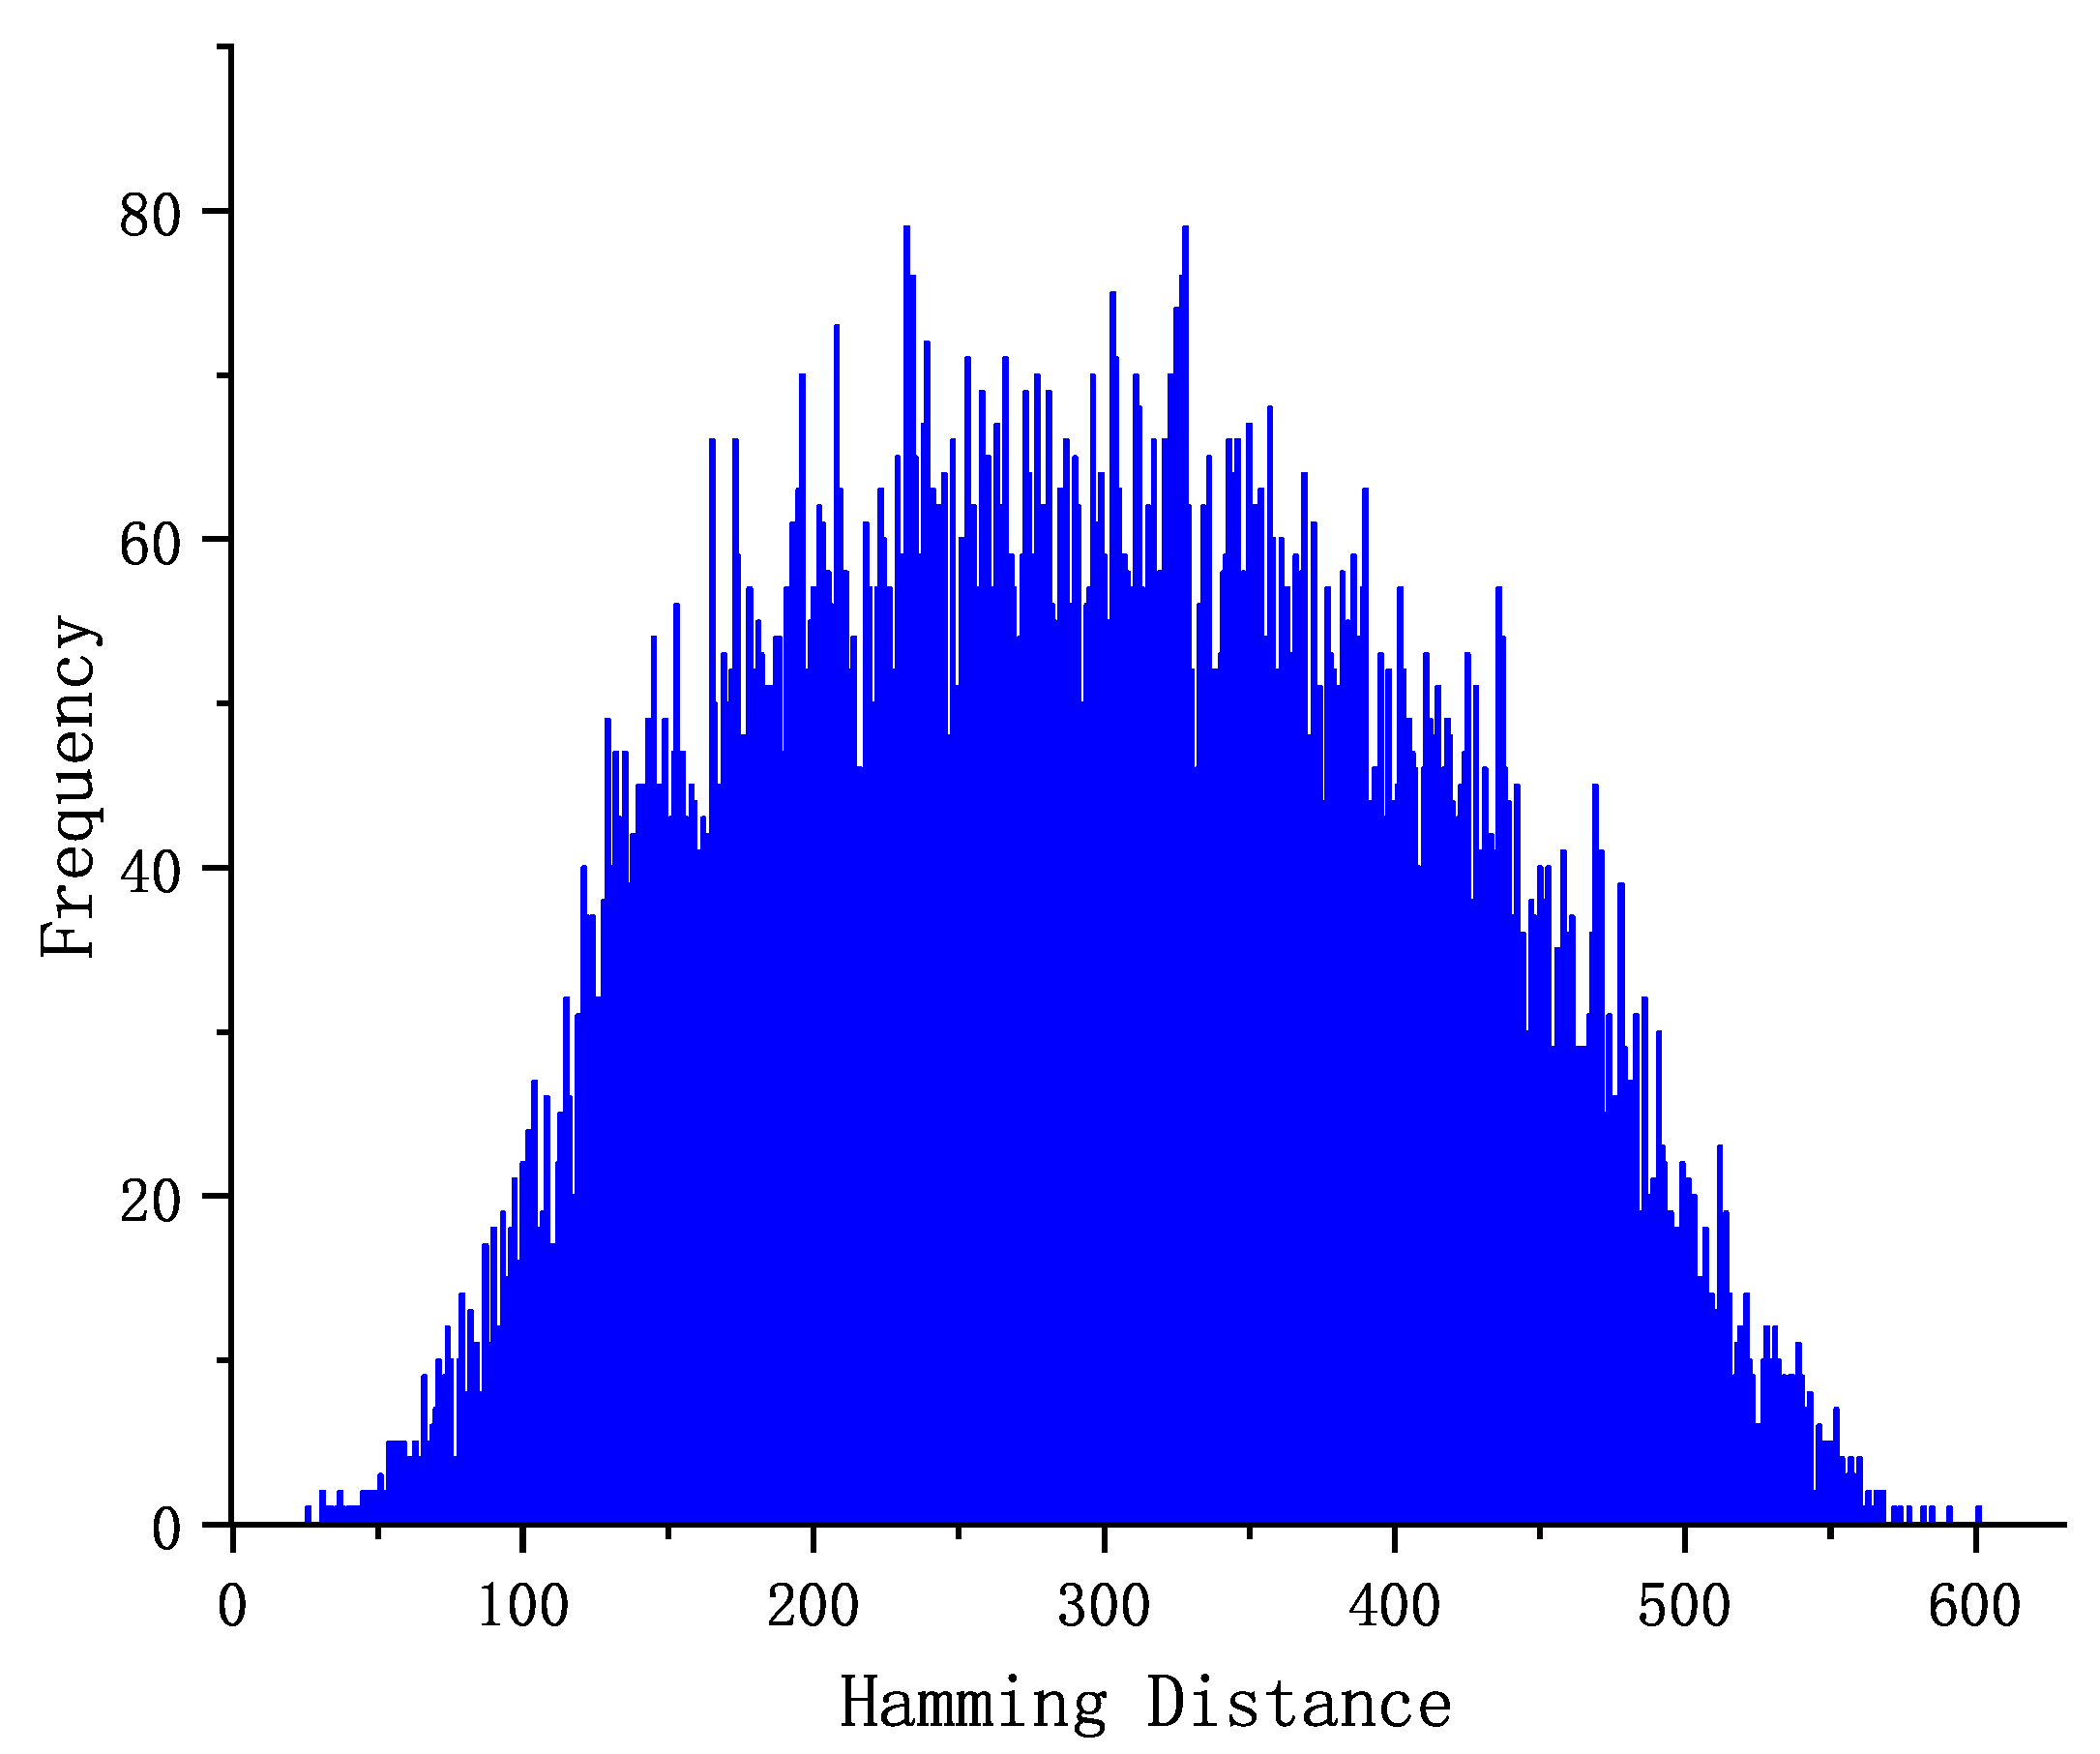
In the present section, a total of 200 images were gathered to evaluate the discriminative performance of our algorithm. We began by extracting the hashes of these 200 color images, followed by calculating the Hamming distance between each image and the rest of the images. So, there are 200 × ( 200 1 ) / 2 = 19,900 Hamming distances in total. This distribution of the Hamming distances is depicted in Figure 4. From the graphical representation, it has been determined that the Hamming distance between the given data points is at least 26, the maximum distance is 601, the mean distance is 296.05, and the standard deviation is 110.89. In particular, the mean value significantly exceeds the defined threshold of T = 63. This indicates that our scheme has a good discrimination performance. The collision probability under different thresholds is calculated and the results are illustrated in Table 3. The analysis demonstrates a positive correlation between the threshold value and collision probability, signifying that lower thresholds result in a decreased rate of misclassification, but at the cost of reduced robustness in the system.

4.3. Tamper Detection Test

If the content of the image is partially falsified, the image is considered to be a different image from the original [1,2,17,37,38]. Content-keeping manipulations are considered non-malicious, while tampering operations are considered malicious. Identifying tampered images is a key capability of image hashing. To test the algorithm’s ability to detect tampered images, six images are selected from CASIA [39], which are shown in Figure 5. The Hamming distance is computed, and subsequently compared against a predetermined threshold value of T. The outcomes of the experiment are presented in Table 4. Based on the outcomes obtained, it can be observed that the measured distances surpass the value of 63. This indicates that our approach possesses the capacity to identify manipulated images, provided that the threshold T is established at 63.

4.4. Influence of Neighborhood Size on Hash Performances

This section presents an analysis of the impact of neighborhood size on the performance of our methodology, as evaluated through the receiver operating characteristic (ROC) graph [40]. The ROC curve plots the False Positive Rate (FPR) against the True Positive Rate (TPR), with FPR displayed on the x-axis and TPR on the y-axis. The values for FPR and TPR are obtained by using Formulas (22) and (23), respectively.
P F P R = n 1 N 1 ,
P T P R = n 2 N 2 ,
where the dataset contains N 1 images with diverse visual content, among which n 1 images are misclassified as being similar. The number of images with identical or nearly identical visual content is represented by N 2 , and the algorithm accurately categorizes n 2 images as being visually identical. When considering two ROC curves, the proximity of a curve to the upper left corner is indicative of the level of comprehensiveness of its performance. Specifically, a closer proximity to the upper left corner is suggestive of better performance.
To calculate the TPR and FPR, 20 images are selected and generate the similar images according to the operations illustrated in the Table 1. This dataset includes 1340 images. In the experiments, we normalize all images to 512 × 512 . Three neighborhood sizes were used, i.e., 3 × 3 , 5 × 5 and 7 × 7 . For each neighborhood size, we firstly extract hashes, then calculate their hamming distance and compute the TPRs and FPRs by exploiting different thresholds finally. The results are shown in the Figure 6. The curve 5 × 5 is closest to the upper left corner among the three curves. This shows that the neighborhood size 5 × 5 has better performance than others. It can be explained that a smaller size utilizes few features, which will weaken discrimination. On the contrary, a bigger size utilizes more features, which will weaken robustness. The neighborhood size 5 × 5 is a great balance between discrimination and robustness.

4.5. Performance Comparison

In order to authenticate the superior efficacy of our algorithms, we conducted a comparative analysis of our image hashing technique with four prevalent algorithms, including histogram-based [18], weighted DWT [8], Laplacian pyramids [41] and salient region-NMF [33].
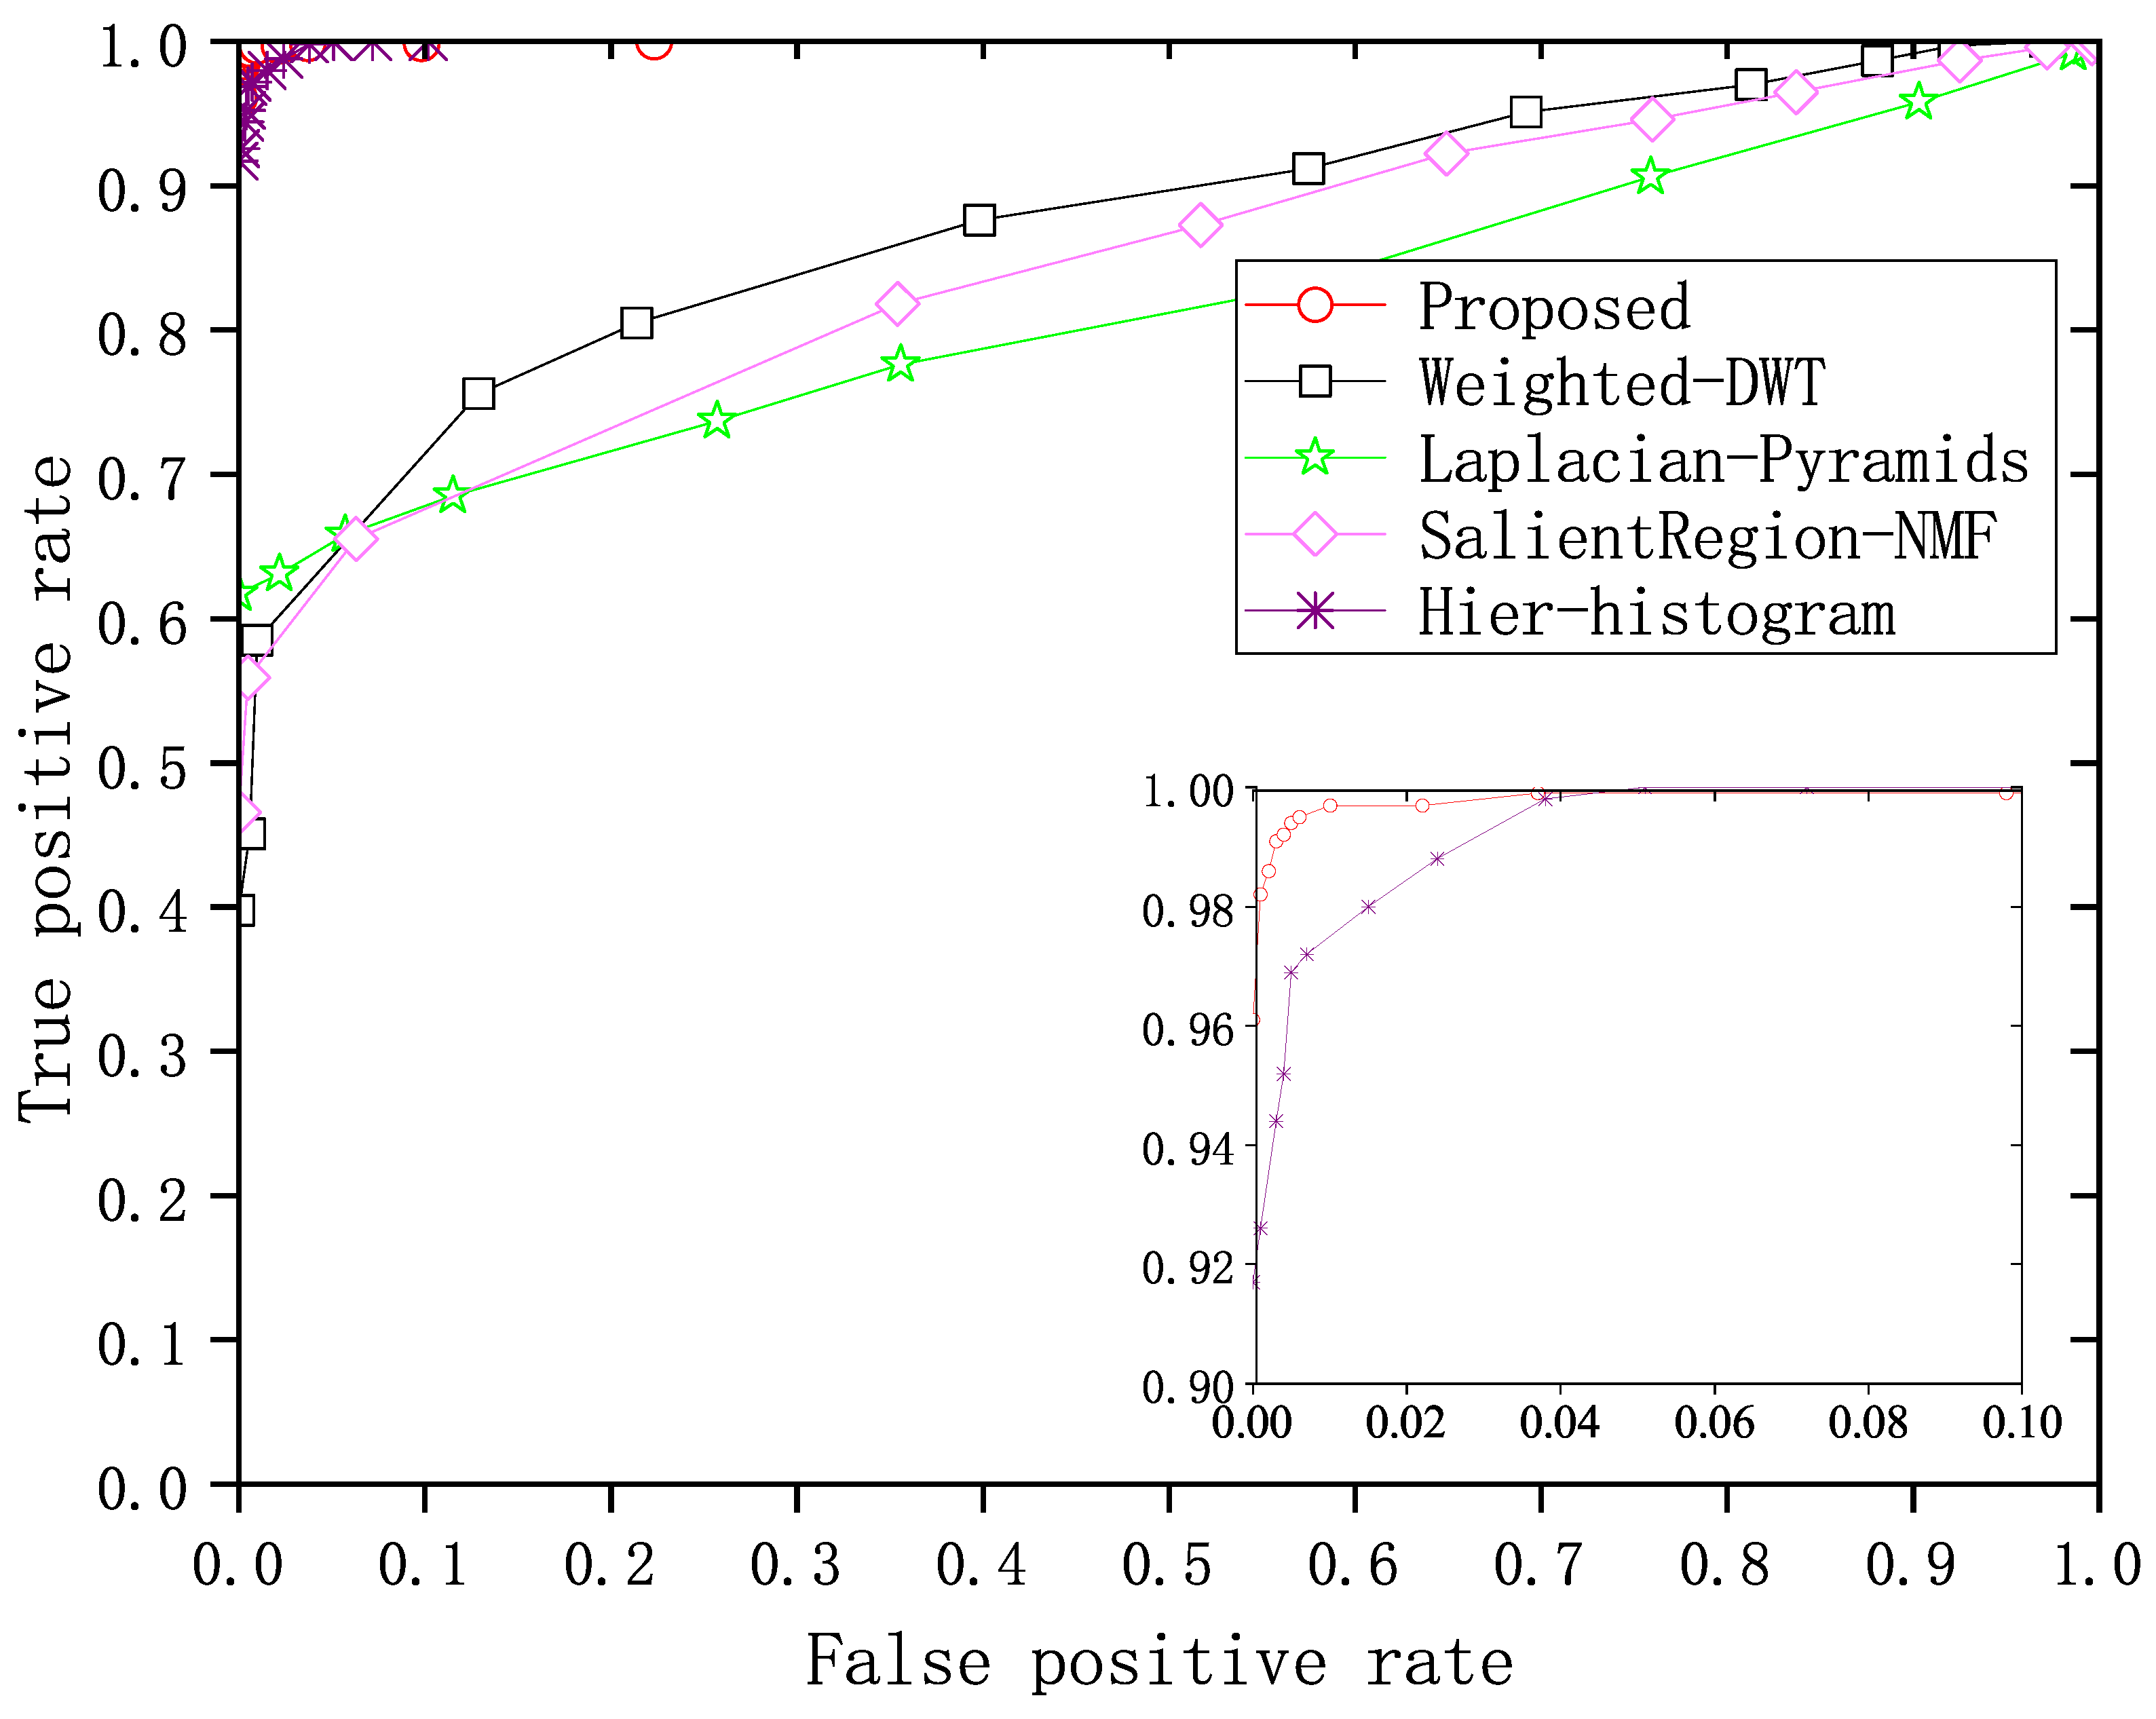
In [8,18,33], in the preprocessing phase, all input images are resized to 512 × 512 . In [41], the images are resized to 256 × 256 . In [18] the histogram is merged five times. In [8], the researchers divided the image into 64 sub-blocks in which the size is 64 × 64 . In [41], the level of the Laplacian pyramid is 4. In [33], all parameters are defined the same as in [33]. In this experiment, the same images used in Section 4.4 are also used. In order to compare as fairly as possible, the raw similarity measure of the comparison algorithm is also used. The comparison results are displayed in Figure 7. To show the results clearly, the lower right sub-graph shows the magnified upper left curve. According to the results, our method’s curve is closest to the upper left corner compared to the other four curves, indicating superior performance. To further analyze the results objectively, we calculate the area under the curve (AUC) for each curve. The algorithm exhibiting a larger AUC value is indicative of superior performance. The AUCs of weighted DWT, Laplacian pyramids, salient region-NMF and Hier-histogram are 0.8728, 0.8093, 0.8449 and 0.9987, respectively. According to our evaluation metrics, the AUC of our hashing algorithm is 0.9992, which is the highest among all the algorithms tested. This suggests that our hashing algorithm exhibits superior performance compared to the other algorithms in terms of its ability to accurately differentiate between classes and maintain its effectiveness under various conditions.

4.6. Key Sensitivity

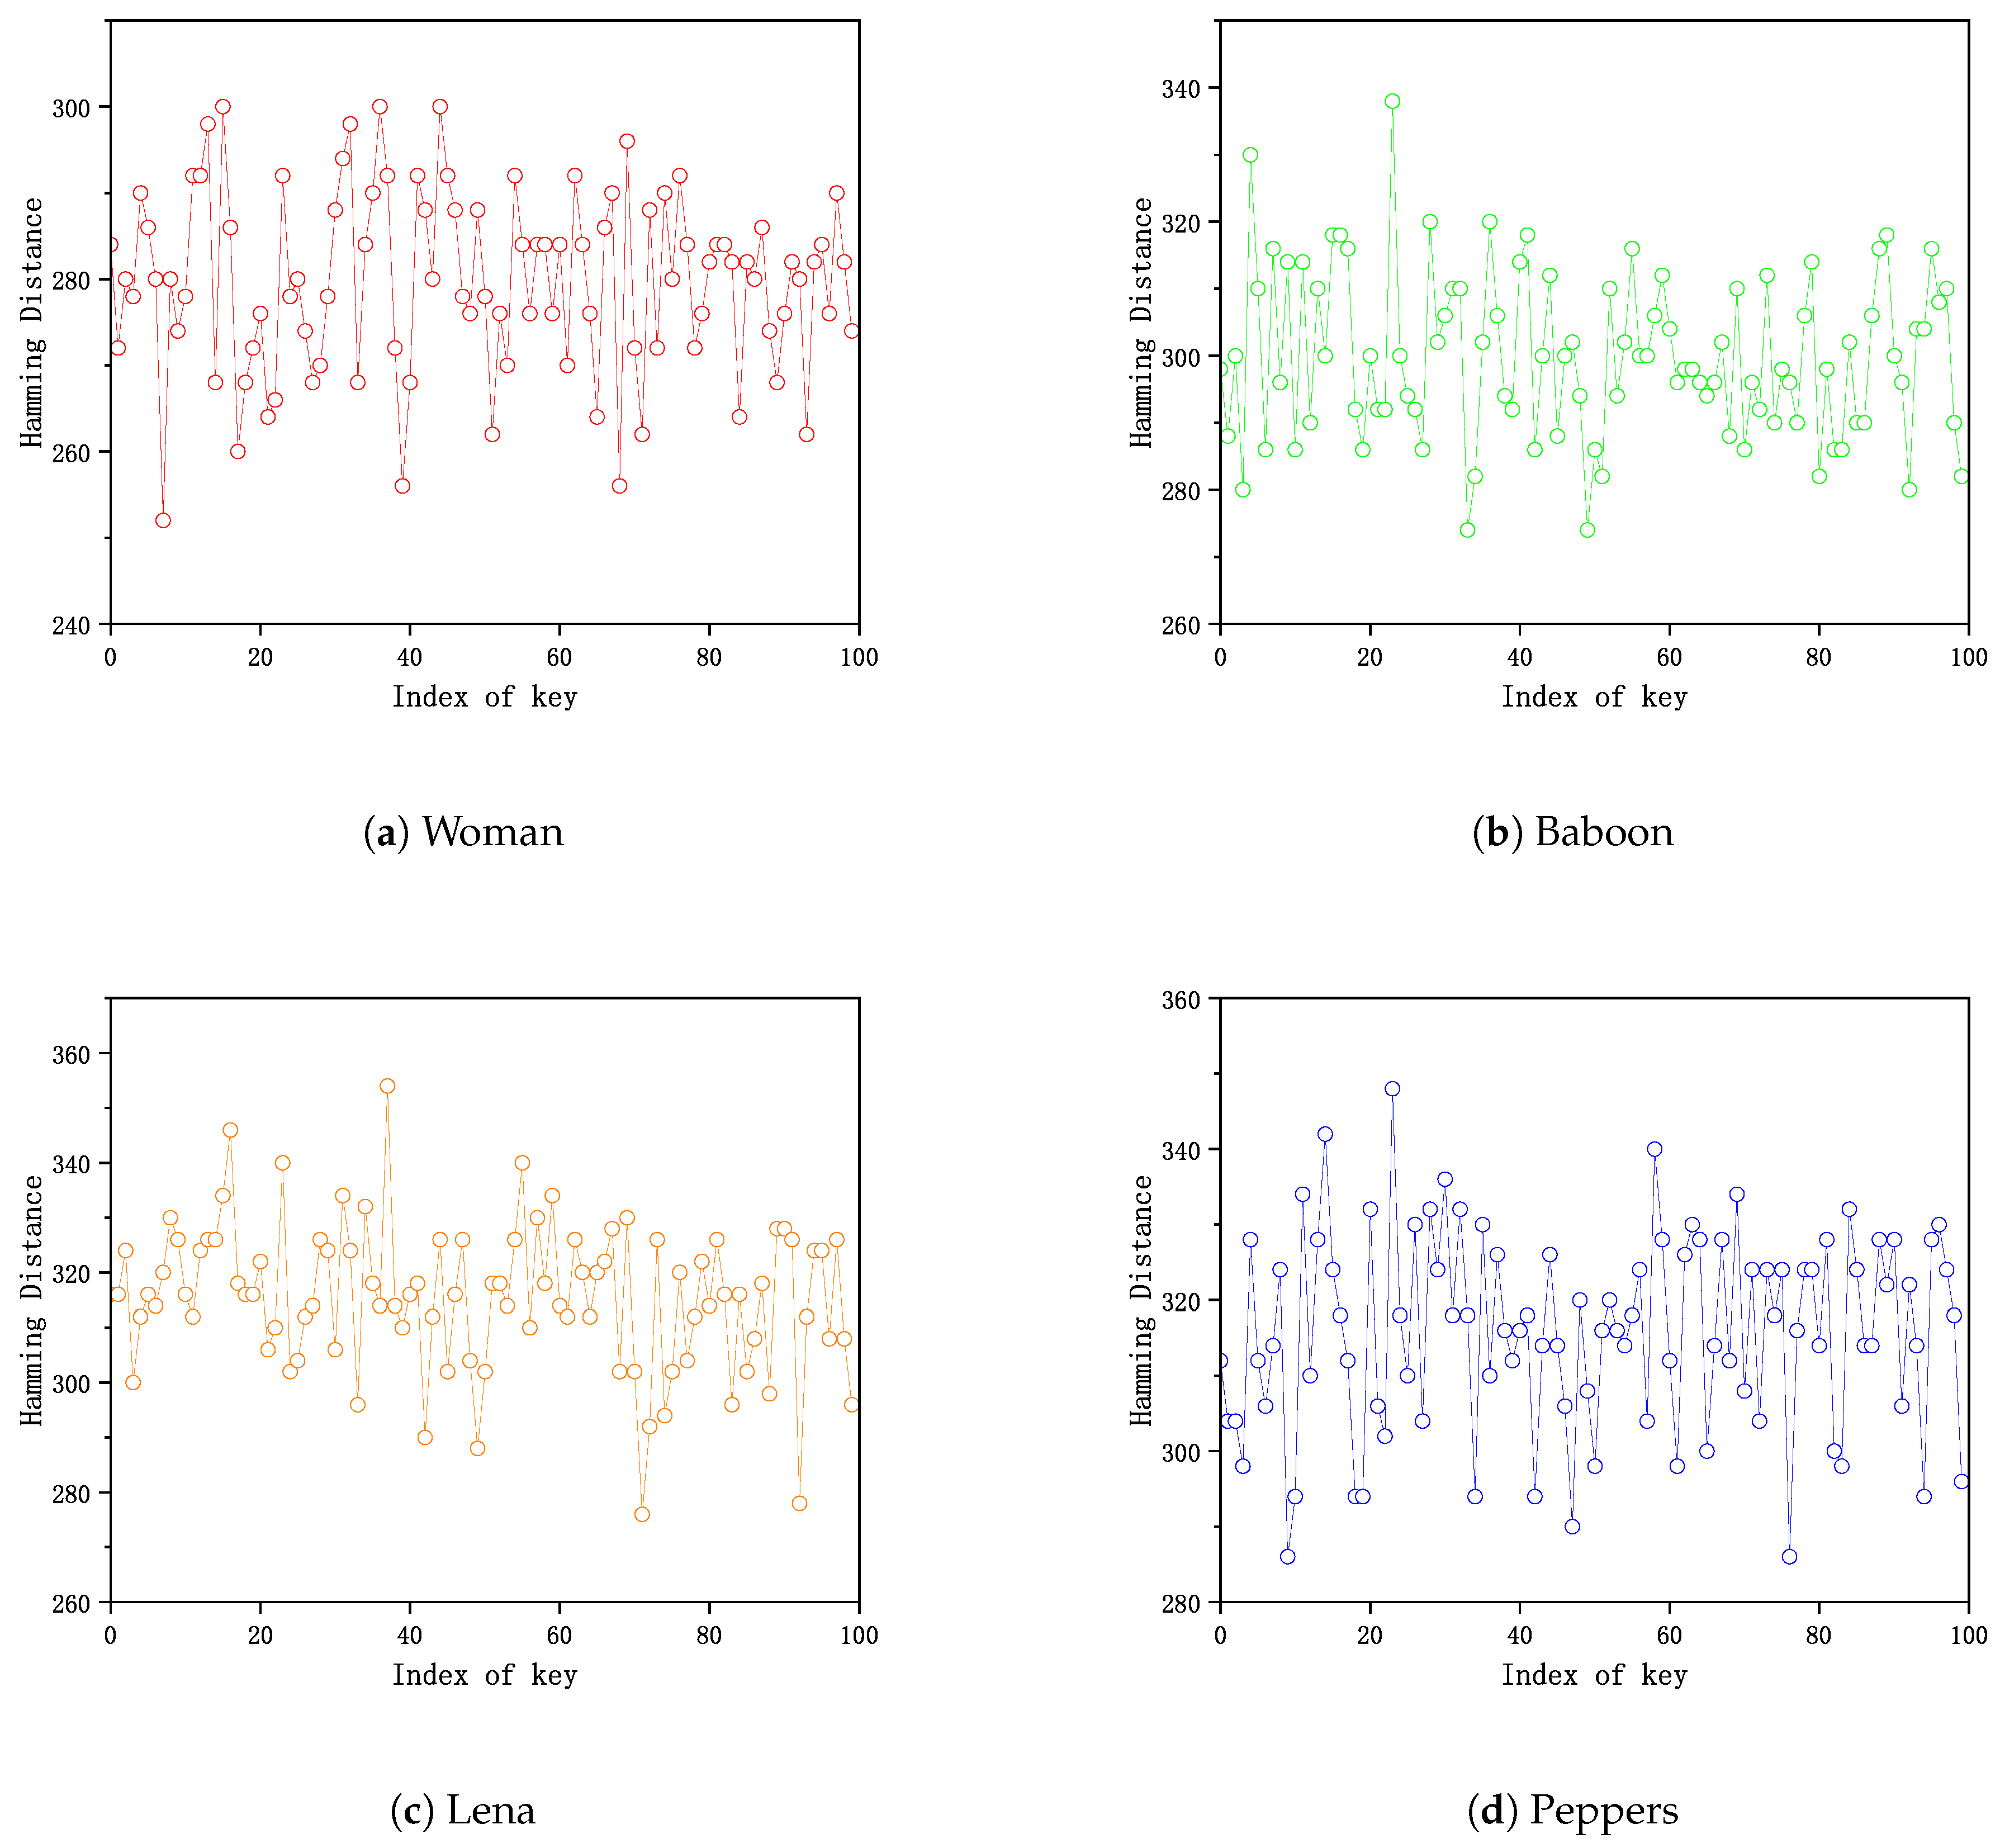
In order to validate the sensitivity of the secret key, 100 different keys were used on 4 images including “Woman”, “Baboon”, “Lena” and “Peppers”. To be more precise, we initially derive the image’s hash value with a unique key and establish it as the reference point. Subsequently, we generate distinct hashes using diverse keys and measure the Hamming distance between them. The depicted graphical representation in Figure 8 illustrates the computed distances. The horizontal axis represents the varied keys utilized, whereas the vertical axis indicates the Hamming distance values obtained. The statistical analysis of four images, “Woman”, “Baboon”, “Lena”, and “Peppers”, reveals the following information regarding the minimum, maximum, and mean distance values. The minimum distance for “Woman” is 252, the maximum distance is 300, and the mean distance is 279.7. Similarly, for “Baboon”, the minimum distance is 274, the maximum distance is 338, and the mean distance value is 299.8. “Lena” has a minimum distance of 276, a maximum distance of 354, and a mean distance of 315.7. Lastly, “Peppers” shows a minimum distance of 286, a maximum distance of 348, and a mean distance of 315.9.

5. Conclusions

The present study presents a novel image hashing method founded on histogram reconstruction. Our devised scheme exhibits strong resilience owing to its utilization of Gaussian low-pass filtering and preservation of histogram shape invariance. Based on empirical evidence, our scheme has demonstrated resilience to typical content-preserving operations, such as blurring and rotation, among others. Our scheme exhibits a particularly strong resistance against rotation attacks at any angle, and it is highly sensitive to changes in the keys. These characteristics indicate that our proposed scheme is secure. The ROC curve reveals that our scheme outperforms several well-known image hashing algorithms. Future investigations in the area of image hashing will prioritize augmenting the capacity to identify and pinpoint unauthorized alterations in images. Furthermore, we will consider the specific applications of image hashing in certain domains, such as the medical field. We will explore how to embed image hash values as watermarks into medical images to protect their copyright and privacy. Additionally, we will further utilize image hashing techniques for the classification and analysis of medical images, aiming to improve the efficiency and accuracy of healthcare practices.

Author Contributions

Conceptualization, Y.J. and C.C.; methodology, Y.J.; software, Y.J.; validation, Y.J.; formal analysis, Y.J.; investigation, Y.J.; resources, C.C.; data curation, Y.J.; writing—original draft preparation, Y.J.; writing—review and editing, C.C. and A.A.A.E.-L.; visualization, Y.J.; supervision, C.C.; project administration, C.C.; funding acquisition, C.C. All authors have read and agreed to the published version of the manuscript.

Funding

This research was funded by The Special Funds of Heilongjiang University of the Fundamental Research Funds for the Heilongjiang Province, grant number 2021-FYYWF-0015.

Institutional Review Board Statement

Not applicable.

Informed Consent Statement

Not applicable.

Data Availability Statement

The data presented in this study are openly available in CASIA at 10.1109/ChinaSIP.2013.6625374, reference [39].

Acknowledgments

We express our sincere appreciation to the anonymous reviewers for their invaluable evaluation and constructive feedback. These insights have provided us with critical guidance and direction for our work. Also, Ahmed A. Abd El-Latif would like to thank Prince Sultan University for their support.

Conflicts of Interest

The authors declare no conflict of interest.

References

  1. Ahmed, F.; Siyal, M.Y.; Abbas, V.U. A secure and robust hash-based scheme for image authentication. Signal Process. 2010, 90, 1456–1470. [Google Scholar] [CrossRef]
  2. Zhao, Y.; Wang, S.; Zhang, X.; Yao, H. Robust hashing for image authentication using Zernike moments and local features. IEEE Trans. Inf. Forensics Secur. 2012, 8, 55–63. [Google Scholar] [CrossRef]
  3. Vadlamudi, L.N.; Vaddella, R.P.V.; Devara, V. Robust hash generation technique for content-based image authentication using histogram. Multimed. Tools Appl. 2016, 75, 6585–6604. [Google Scholar] [CrossRef]
  4. Wang, C.; Wang, D.; Tu, Y.; Xu, G.; Wang, H. Understanding node capture attacks in user authentication schemes for wireless sensor networks. IEEE Trans. Dependable Secur. Comput. 2020, 19, 507–523. [Google Scholar] [CrossRef]
  5. Tagliasacchi, M.; Valenzise, G.; Tubaro, S. Hash-based identification of sparse image tampering. IEEE Trans. Image Process. 2009, 18, 2491–2504. [Google Scholar] [CrossRef]
  6. Lu, X.; Zheng, X.; Li, X. Latent semantic minimal hashing for image retrieval. IEEE Trans. Image Process. 2016, 26, 355–368. [Google Scholar] [CrossRef]
  7. Fonseca-Bustos, J.; Ramírez-Gutiérrez, K.A.; Feregrino-Uribe, C. Robust image hashing for content identification through contrastive self-supervised learning. Neural Netw. 2022, 156, 81–94. [Google Scholar] [CrossRef]
  8. Tang, Z.; Huang, Z.; Yao, H.; Zhang, X.; Chen, L.; Yu, C. Perceptual Image Hashing with Weighted DWT Features for Reduced-Reference Image Quality Assessment. Comput. J. 2018, 61, 1695–1709. [Google Scholar] [CrossRef]
  9. Lv, X.; Wang, Z.J. Reduced-reference image quality assessment based on perceptual image hashing. In Proceedings of the 2009 16th IEEE International Conference on Image Processing (ICIP), Cairo, Egypt, 7–10 November 2009; pp. 4361–4364. [Google Scholar]
  10. Tang, Z.; Zhang, X.; Zhang, S. Robust perceptual image hashing based on ring partition and NMF. IEEE Trans. Knowl. Data Eng. 2013, 26, 711–724. [Google Scholar] [CrossRef]
  11. Shaik, A.S.; Karsh, R.K.; Suresh, M.; Gunjan, V.K. LWT-DCT Based Image Hashing for Tampering Localization via Blind Geometric Correction. In ICDSMLA 2020, Proceedings of the 2nd International Conference on Data Science, Machine Learning and Applications, London, UK, 23–24 September 2020; Kumar, A., Senatore, S., Gunjan, V.K., Eds.; Springer: Singapore, 2022; pp. 1651–1663. [Google Scholar]
  12. Yan, C.P.; Pun, C.M.; Yuan, X.C. Multi-scale image hashing using adaptive local feature extraction for robust tampering detection. Signal Process. 2016, 121, 1–16. [Google Scholar] [CrossRef]
  13. Tang, Z.; Dai, Y.; Zhang, X. Perceptual hashing for color images using invariant moments. Appl. Math 2012, 6, 643S–650S. [Google Scholar]
  14. Lv, X.; Wang, Z.J. Perceptual image hashing based on shape contexts and local feature points. IEEE Trans. Inf. Forensics Secur. 2012, 7, 1081–1093. [Google Scholar] [CrossRef]
  15. Shaik, A.S.; Karsh, R.K.; Islam, M.; Laskar, R.H. A review of hashing based image authentication techniques. Multimed. Tools Appl. 2022, 81, 2489–2516. [Google Scholar] [CrossRef]
  16. Xiang, S.; Kim, H.J.; Huang, J. Histogram-based image hashing scheme robust against geometric deformations. In Proceedings of the 9th Workshop on Multimedia & Security, Dallas, TX, USA, 20–21 September 2007; pp. 121–128. [Google Scholar]
  17. Cui, C.; Niu, X.M. A robust DIBR 3D image watermarking algorithm based on histogram shape. Measurement 2016, 92, 130–143. [Google Scholar] [CrossRef]
  18. Yong, S.C.; Park, J.H. Image hash generation method using hierarchical histogram. Multimed. Tools Appl. 2012, 61, 181–194. [Google Scholar]
  19. Karsh, R.K.; Laskar, R.H. Robust image hashing through DWT-SVD and spectral residual method. Eurasip J. Image Video Process. 2017, 2017, 31. [Google Scholar] [CrossRef]
  20. Huang, W.J. Robust image hash in Radon transform domain for authentication. Signal Process. Image Commun. 2011, 26, 280–288. [Google Scholar]
  21. Ouyang, J.; Liu, Y.; Shu, H. Robust hashing for image authentication using SIFT feature and quaternion Zernike moments. Multimed. Tools Appl. 2017, 76, 2609–2626. [Google Scholar] [CrossRef]
  22. Abbas, S.Q.; Ahmed, F.; Chen, Y. Perceptual image hashing using transform domain noise resistant local binary pattern. Multimed. Tools Appl. 2021, 80, 9849–9875. [Google Scholar] [CrossRef]
  23. Xue, M.; Yuan, C.; Liu, Z.; Wang, J. SSL: A Novel Image Hashing Technique Using SIFT Keypoints with Saliency Detection and LBP Feature Extraction against Combinatorial Manipulations. Secur. Commun. Netw. 2019, 2019, 9795621. [Google Scholar] [CrossRef]
  24. Tang, Z.; Dai, Y.; Zhang, X.; Zhang, S. Perceptual Image Hashing with Histogram of Color Vector Angles; Springer: Berlin/Heidelberg, Germany, 2012. [Google Scholar]
  25. Gharde, N.D.; Thounaojam, D.M.; Soni, B.; Biswas, S.K. Robust perceptual image hashing using fuzzy color histogram. Multimed. Tools Appl. 2018, 77, 30815–30840. [Google Scholar] [CrossRef]
  26. Zong, T.; Xiang, Y.; Natgunanathan, I.; Guo, S.; Zhou, W.; Beliakov, G. Robust histogram shape-based method for image watermarking. IEEE Trans. Circuits Syst. Video Technol. 2014, 25, 717–729. [Google Scholar] [CrossRef]
  27. Hu, M.K. Visual pattern recognition by moment invariants. IRE Trans. Inf. Theory 1962, 8, 179–187. [Google Scholar]
  28. Tang, Z.; Zhang, H.; Pun, C.M.; Yu, M.; Yu, C.; Zhang, X. Robust image hashing with visual attention model and invariant moments. IET Image Process. 2020, 14, 901–908. [Google Scholar] [CrossRef]
  29. Zhao, Y.; Wei, W. Perceptual image hash for tampering detection using Zernike moments. In Proceedings of the 2010 IEEE International Conference on Progress in Informatics and Computing, Shanghai, China, 10–12 December 2010; Volume 2, pp. 738–742. [Google Scholar]
  30. Hosny, K.M.; Khedr, Y.M.; Khedr, W.I.; Mohamed, E.R. Robust image hashing using exact Gaussian–Hermite moments. IET Image Process. 2018, 12, 2178–2185. [Google Scholar] [CrossRef]
  31. Kozat, S.S.; Venkatesan, R.; Mihçak, M.K. Robust perceptual image hashing via matrix invariants. In Proceedings of the 2004 International Conference on Image Processing, 2004—ICIP’04, Singapore, 24–27 October 2004; Volume 5, pp. 3443–3446. [Google Scholar]
  32. Monga, V.; Mihçak, M.K. Robust and Secure Image Hashing via Non-Negative Matrix Factorizations. IEEE Trans. Inf. Forensics Secur. 2007, 2, 376–390. [Google Scholar] [CrossRef]
  33. Wu, X.; Cui, C.; Wang, S. Perceptual Hashing Based on Salient Region and NMF. In Advances in Intelligent Information Hiding and Multimedia Signal Processing; Springer: Berlin/Heidelberg, Germany, 2022; pp. 119–127. [Google Scholar]
  34. Davarzani, R.; Mozaffari, S.; Yaghmaie, K. Perceptual image hashing using center-symmetric local binary patterns. Multimed. Tools Appl. 2016, 75, 4639–4667. [Google Scholar] [CrossRef]
  35. Shang, Q.; Du, L.; Wang, X.; Zhao, X. Robust Image Hashing Based on Multi-view Feature Representation and Tensor Decomposition. J. Inf. Hiding Multimed. Signal Process. 2022, 13, 113–123. [Google Scholar]
  36. Delaigle, J.F.; De Vleeschouwer, C.; Macq, B. Watermarking algorithm based on a human visual model. Signal Process. 1998, 66, 319–335. [Google Scholar] [CrossRef]
  37. Tang, Z.; Wang, S.; Zhang, X.; Wei, W. Structural feature-based image hashing and similarity metric for tampering detection. Fundam. Inform. 2011, 106, 75–91. [Google Scholar] [CrossRef]
  38. Bashir, I.; Ahmed, F.; Ahmad, J.; Boulila, W.; Alharbi, N. A secure and robust image hashing scheme using Gaussian pyramids. Entropy 2019, 21, 1132. [Google Scholar] [CrossRef]
  39. Dong, J.; Wang, W.; Tan, T. CASIA Image Tampering Detection Evaluation Database. In Proceedings of the 2013 IEEE China Summit and International Conference on Signal and Information Processing, Beijing, China, 6–10 July 2013. [Google Scholar] [CrossRef]
  40. Fawcett, T. An introduction to ROC analysis. Pattern Recognit. Lett. 2006, 27, 861–874. [Google Scholar] [CrossRef]
  41. Hamid, H.; Ahmed, F.; Ahmad, J. Robust Image Hashing Scheme using Laplacian Pyramids. Comput. Electr. Eng. 2020, 84. [Google Scholar] [CrossRef]
Figure 1. Flow diagram of the proposed hashing.
Symmetry 15 01088 g001
Figure 2. Image and its corresponding histogram. (a) Kangaroo, (b) Kangaroo with Arnold Scrambling, (c) Histogram of kangaroo, and (d) Histogram of kangaroo with Arnold Scrambling.
Symmetry 15 01088 g002
Figure 3. Evaluation of robustness performance under various operations using five standard benchmark color images.
Symmetry 15 01088 g003
Figure 4. Distribution analysis of Hamming distance for discrimination.
Symmetry 15 01088 g004
Figure 5. Original and tampered images for tamper detection. The left column contains 6 original images (a,c,e,g,i,k), and the right column contains 6 corresponding tampered images (b,d,f,h,j,l).
Symmetry 15 01088 g005aSymmetry 15 01088 g005b
Figure 6. ROC analysis of the impact of neighborhood size on algorithm performance.
Symmetry 15 01088 g006
Figure 7. ROC curve for performance comparison.
Symmetry 15 01088 g007
Figure 8. The impact of different key indices on hash values in key sensitivity experiment.
Symmetry 15 01088 g008
Table 1. Digital operations and parameters.
Non-Malicious AttacksDescriptionParameter ValueNumber
Average filteringFilter size3, 5, 73
Median filteringFilter size3, 5, 7, 94
3 × 3 Gaussian low-pass filteringStandard deviation0.3, 0.4, …, 1.08
JPEG compressionQuality factor30, 40, …, 1008
Salt and pepper noiseDensity0.001, 0.002, …, 0.0077
ScalingRatio0.5, 1.5, 2.0, …, 5.09
X-ShearingAngle1, 2, …, 88
RotationRotation angle±5, ±10, ±15, …, ±45, ±9020
Table 2. Statistical analysis of Hamming distance using 63 color images.
Non-Malicious AttackMinimumMaximumMeanStandard Deviation
Average filtering06316.7113.14
Median filtering06218.1212.82
Gaussian filtering0479.128.75
JPEG compression0336.665.76
Salt and pepper noise06210.3510.16
Scaling0494.726.36
X-Shearing14011.58.12
Rotation05717.1613.07
Table 3. Collision probabilities under different thresholds.
ThresholdCollision Probability
40 5.03 × 10 4
42 6.03 × 10 4
45 7.04 × 10 4
48 1.01 × 10 3
51 1.26 × 10 3
54 1.61 × 10 3
57 2.31 × 10 3
60 3.07 × 10 3
63 3.62 × 10 3
Table 4. Computation of Hamming distance for tampering detection.
ImagesHamming Distance
(a)–(b)107
(c)–(d)72
(e)–(f)153
(g)–(h)93
(i)–(j)199
(k)–(l)133
Disclaimer/Publisher’s Note: The statements, opinions and data contained in all publications are solely those of the individual author(s) and contributor(s) and not of MDPI and/or the editor(s). MDPI and/or the editor(s) disclaim responsibility for any injury to people or property resulting from any ideas, methods, instructions or products referred to in the content.