Abstract
The aluminum–matrix composites possess are very important for future applications because they have unique mechanical properties. Here, molecular dynamics is used to analyze the bonding of dissimilar metals on the interface of Al/Mg, Al/Ti, and Al/Cu interfaces during deformation treatment–compression combined with shear at room temperature. The terminal-mechanical treatment used in this simulation is a variant of the experimental technique applied to fabricate Al/Metal composites. It is found that there is a critical value of compressive and shear strain required to obtain the strong mixed Al/Metal interface. The diffusion depth of atoms of both components is dependent on the applied strain: (i) linear relationship for Al/Mg; (ii) logarithmic relationship for Al/Ti and Al/Cu. The mechanical behavior under tension and fracture analysis of the obtained interfaces are discussed in terms of atomic-level structural features which allow an understanding of the interconnection between the mechanical behavior and structure mixture near the interface. One of the important criteria for atomic mixing is the symmetry of the interface. After atomic mixing, Al/Ti composite has the highest ultimate tensile strength, Al/Cu—the average, and Al/Mg—the lowest between the considered interfaces, while the fracture strain of Al/Mg and Al/Ti composites are very close and higher than for Al/Cu. The obtained results are significant for the development of fabrication of Al/Metal interface by high-pressure torsion in practice.
1. Introduction
Composites based on the aluminum matrix reinforced with other metals are a special type of structure that can be successfully used in various industrial fields where light-weight, high strength, and controllable stiffness are required. Such composites are widely used in aeronautics and aerospace engineering because they have outstanding corrosion resistance, high strength, and low density [1,2,3,4]. The mixture of Al and other metal commonly demonstrate the advantages of both metals and can be used as the pure aluminum substitution for industry applications [5,6,7]. To date, numerous fabrication techniques are discussed, e.g., explosive welding, diffusion bonding, vacuum hot pressing, roll bonding, extrusion [8,9,10,11,12]. However, existing methods of material processing have their own advantages and disadvantages which incorporate the application of not very complicated and expensive methods, short time of surface treatment, and proficiency.
Recently, a new approach has been developed—a solid-phase connection of thin discs of Al and other metals by means of shear deformation on Brigman anvils [13,14,15,16,17,18]. The interafce region between two metals can be the special place of the formation of the intermetallic phases owing to diffusion, which is a result of such deformation treatment. The other effective way to facilitate diffusion is annealing [14,15,19,20,21]. To date, several different systems were studied under high-pressure torsion (HPT): Al/Cu [13,16,22,23], Al/Nb [14], Al/Mg [24,25] and Al/Ti [26,27,28]. In Figure 1, the example of the experiment conducted in [17] is presented: (a,b) set of discs before and after HPT and (c) the backscattered electron image of the composites in the as-processed state: Al-Cu, Al-Nb, Al-Mg, and Al-Ti are presented. The dark areas correspond to the Al-rich phase in Al-Cu, Al-Nb, and Al-Ti composites, while in Al-Mg composite Al-rich phase corresponds to the bright areas. However, the degree of mixing is different in different composites. Thus, the study of the mechanism of interface recombination is of key importance for the understanding of the mechanisms of phase formation during HPT and other fabrication techniques, for example, steer welding [29,30,31]. In experiments, the appearance of aluminum oxides is often observed, which can worsen or improve diffusion and affect the properties of composites [32,33,34].
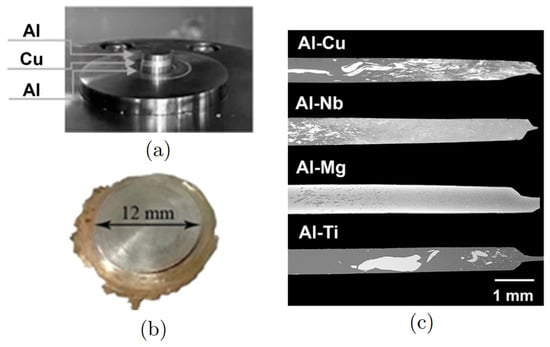
Figure 1.
(a) System of discs (Al-Cu-Al) before deformation treatment and (b) the resulting composite structure. (c) Back scattered electron image of the composites in the as-processed state. Reprinted with the permission from [17].
In the case of composites, defining the process of appearance of in situ structure with different intermetallic phases, and strengthening mechanisms in the experiment is quite a complicated task. The different processes, which took place during the composite fabrication, result in the formation of various phases near the interface. Factors such as the interdiffusion of different atoms, the type and shape of the interface, and the obtained intermetallic phases, to name a few, significantly influence the resulting strength of composites.
In recent years, various methods of computer and numerical simulation are being actively developed [35,36]. For example, molecular dynamics (MD) simulations have been used to analyze the solid–liquid or solid–solid boundaries in a binary system. A lot of work has been done to understand the structural transformations on the atomic level and deformation scenario according to previous molecular dynamics studies [37,38,39,40]. However, most of the MD studies were conducted at evaluated temperatures to allow diffusion between two metals, while composite fabrication by HPT processing is conducted at room temperature. During HPT, the main factor for atomic mixing is shear stress leading to the formation of intermetallic phases.
Here, the atomic mixing of Al and other Metal (Me) on Al/Me interface under compression with simultaneous shear deformation is studied by MD simulation. Three different interfaces are considered: Al/Ti, Al/Mg, and Al/Cu. The combination of compression and shear deformation is simulated to reproduce deformation treatment which was applied to fabricate in-situ Al/Me composites [17]. The strength and mechanical properties of the simulated Al/Me interface is analyzed from numerical tensile experiments.
2. Simulation Details
Three types of interfaces are considered: Al/Ti, Al/Mg, and Al/Cu, where Ti and Mg have HCP lattice, Cu and Al have FCC lattice. The bottom part of the crystal is always Al layer, while the top part of the crystal is another metal—Mg, Ti, or Cu (see the initial experimental structure in Figure 1 and simulated sample in Figure 2). The size of the initial structure is Å. It is chosen based on a literature review, for example, refs. [41,42], which allows further comparison of the obtained results with those previously studied. This size of the structure can be considered as big enough to analyze especially atomic mixing between two different metals. For the applied boundary conditions, the main point is that two interlayer boundaries will not affect each other, which is satisfied. The distance between two metal parts is equal to ( + )/2, which are = 3.6 Å, = 3.5 Å, = 3.8 Å. The composite precursor is obtained by the combination of two ideal crystals with the help of the homemade program. The periodic boundary conditions are used along the x-, y-, and z-axis. For the metals with HCP lattice, an arbitrary surface orientation is chosen; for the metals with FCC lattice, the widespread <100> plane is chosen [38,43]. Since the important reason for this work is to understand the underlying mechanisms for the bonding of dissimilar metals, at that stage of the study the surface orientation is neglected.
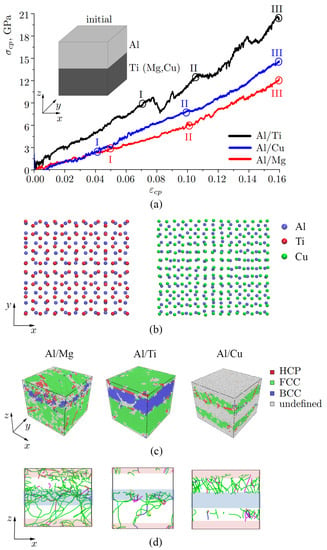
Figure 2.
(a) Stress–strain curves during uniaxial compression normal to the Al/Ti, Al/Cu, Al/Mg interface combined with shear deformation over plane. Schematic of the initial structure. (b) Snapshots of the interface region (two layers of Al (blue atoms) and two layers of Cu/Ti). Only part of the interface is shown. (c) Snapshots of the structure (point III, = 0.16). All atoms are colored in accordance with CNA. (d) Dislocation distribution at point III (the Stair-rod dislocation lines are colored purple, the Hirth dislocation lines are colored yellow, Frank dislocation lines are colored light blue, the Perfect dislocation lines are colored blue and the Shockley dislocation lines are colored green). The boundary interface where atomic mixing took place is shown by shaded zones.
In classical MD, to find the equations of motion, the second Newton’s law is solved [44]:
where F, m, and x are the force, mass, and coordinate of each atom at time t.
The integration algorithms are based on finite difference methods that discretize time into small but finite intervals with a step . The Verlet algorithm is one of the most popular in MD. It follows from the expansion of the radius vector for the particle at two time steps, and , into a Taylor series up to the third power in [44]:
where and a are radius vector and acceleration for the particle at time t, —local discretization error.
LAMMPS simulation package [45] is used to conduct molecular dynamics simulations. The temperature in the system is controlled by the Nose-Hoover thermostat. Verlet algorithm (1) to integrate the Newtonian Equation (2) of motion with an integration time-step of 2 fs is used. OVITO visualization tool [46] is used for the detailed analyses of the structure. Embedded atom method (EAM) interatomic potential for system Al/Ti [47], Al/Cu [48], and Al/Mg [49] is used. The potential parameters are chosen to satisfy the various properties of the Al/Ti, Al/Cu, and Al/Mg systems obtained in experiments and ab-initio simulations. Thus, potentials used in this work can perfectly describe the fundamental properties, for example, defect energies, lattice properties, and thermal expansion [50,51,52,53,54,55,56,57,58].
The simulation process consists of three steps. At first, the simulation cell is equilibrated at 300 K. Dislocation analysis showed that dislocations appeared on the interface right after initial relaxation which means that a coherent interface is obtained with the mismatch. Further, to study the process of fabrication of Al/Ti, Al/Cu, and Al/Mg composites and atomic mixing near the interface, strain along z-axis (normal to the interface between two metals) combined with shear strain in -plane is applied. To apply the shear strain to the simulated sample with the given strain rate, the intrinsic LAMMPS commands are used. The cell of the composite precursor is affected by the given tilt factor linearly changing in time without any changes in the volume. To estimate the shear strain, the displacement value along the shear direction (here, for shear) is divided by the length of the simulation cell normal to the shear direction (here, for shear).
Compression is combined with shear to reproduce HPT experimental technique. Strain rates are = 6.2 ps and = 6.2 ps. For simplicity, the compressive strain along will be denoted as and all the values will be considered as the function of . The parameters for all metals important to analyzing the atomic mixing under compression are presented in Table 1. Numerical experiments are carried out at 300 K, at which HPT processing is usually conducted.

Table 1.
The main parameters for Al and three other metals.
In the third step, tensile loading is applied to the system after compression to the strain indicated by points I, II, and III in Figure 2a. Thus, the composites obtained after compression to points I, II, and III are considered as initial for tensile tests without additional relaxation or changes. Ultimate tensile strength () and Young’s modulus (E) for all composites are normalized relative to ultimate tensile strength () and Young’s modulus () of the initial undeformed sample.
3. Results and Discussion
3.1. Composites under Compression
Figure 2a shows the stress–strain curves after compression along with the schematic of the initial structure and the snapshots of the three different composites Al/Me obtained after compression (point III, = 0.16). Snapshots of the interface region are shown in Figure 2c: two layers of Al (blue atoms) and two layers of Cu (green atoms) or Ti (red atoms). Only part of the interface is shown to check the symmetry of the interface. The initial structure is obtained in such a way as to make three different bi-metallic samples of the same size and to satisfy the periodic repetition of the simulation cell. From this point of view, the symmetry or coherency of the interface is not considered. For FCC metal (100) plane is chosen, while for HCP metal (0001) plane is chosen. As can be seen, two (100) FCC planes are not the best combination, since atoms from the lower interface are repelled by atoms from the upper interface and the symmetry of the crystal lattice is broken. For FCC/HPC interface we also have quite low symmetry. This will further lead to the dislocation nucleation near the interface region.
The structures in Figure 2c are visualized by common-neighbor analysis (CNA): green atoms are defined as FCC lattice, blue atoms—as BCC lattice, red atoms—as HPC lattice, and gray atoms are those which have undefined coordination number. The structures in Figure 2d are visualized by the OVITO dislocation extraction algorithm (DXA) and presented as the projection to . The Stair-rod dislocation lines are colored purple, the Hirth dislocation lines are colored yellow, Frank dislocation lines are colored light blue, the Perfect dislocation lines are colored blue and the Shockley dislocation lines are colored green.
From the stress-strain curves in Figure 2a it can be seen that there are several drops connected with different structural changes and accompanied by energy changes. Stress-strain curves are divided into three regimes selected according to the main changes during deformation. Before point I elastic deformation took place for Al/Ti and Al/Cu, while for Al/Mg, an elastic regime is observed up to point II. But the point I ( = 0.04) is also set for Al/Mg for further comparison, since at this stage stress-strain curves for Al/Mg and Al/Cu almost coincide. Both curves for Al/Mg and Al/Cu interfaces have linear character, with the slope change at point II for Al/Mg and at points I and II for Al/Cu.
The Al/Ti compression process is much more complex with several stress drops that appeared due to changes in dislocation structure and phase transformations. Each drop in the curve (for example, after the point I) is associated with the formation of the BCC phase under compression. It was previously found, that at a pressure range 2 to 12 GPa, which value is defined by the experimental method and the pressure conditions, phase transformation took place in Ti [52,62,63]. Several phases with different lattices can be observed in Ti at high pressures (, , , [63]), however, they cannot be defined by OVITO precisely. Consequently, these phases are represented as BCC lattice, although it is characteristic especially for phase. Thus, phase transformations in this model cannot be described in detail, and further just HCP to BCC transformation will be discussed.
In accordance with CNA, at the final stage of compression (at = 0.16) Al part of the sample preserves FCC lattice for all three composites, while Mg and Ti lattices transform from HCP to BCC lattice (Figure 2c). It is important to note that the area with mixed metal atoms (where intermetallic compounds suppose to appear) is also defined as green (FCC) with red (HCP) regions. In accordance with [64], Al/Mg phases can have FCC (, ) as well as HCP phases (). For Al/Ti phase diagram again, there are both FCC (TiAl, TiAl) and HCP (TiAl) [65]. Due to periodic boundary conditions, the upper and lower parts of the samples also represent the interlayer boundary. The boundary interface where atomic mixing took place is shown by shaded zones. For Al/Cu composite the OVITO could not determine the type of crystal lattice of the interlayer boundary.
For Mg, the phase transformation from HCP to BCC also took place at high pressure [66]. In the case of Al/Mg interface, small regions of BCC structure start to appear right after compression starts but disappear from time to time due to the effect of shear deformation. Mutual effect of shear and compression results in a combination of BCC phase (due to compression) and HCP phase (due to shear).
3.2. Atomic Mixing near the Interface
As it can be seen from Figure 2d, the most developed dislocation structure is observed for the Al/Mg sample. A wide dislocation network is found at the interface region (shown by shaded zones), but also in Mg part and even in Al part. For Al/Mg and Al/Ti interfaces, dislocations can be seen at the interface from the early stages of compression. Dislocations that appeared in the interface can facilitate the atomic movements which have already started at the beginning of the deformation [67]. For Al/Ti interface, dislocations at the beginning nucleate near the interface region and move inside Ti part. For Al/Cu interface, the majority of dislocations are observed in Al part. It should be noted, that, since OVITO cannot define the crystal structure in the interface region for Al/Cu, it also cannot define the dislocation structure in the boundary region.
In Figure 3, the distribution of the stress on each atom ( component) is presented for three deformation stages shown in Figure 2a. During compression, the distribution of the atomic stress remains practically unchanged up = 0.04 for Al/Cu and Al/Mg and up to = 0.08 for Al/Ti. Most of the excited atoms (blue color) are concentrated at the interface of the dissimilar metals. As the compression strain increases, the number of blue atoms (i.e., atoms with negative stresses) increases. Up to = 0.1 for Al/Cu composite, such atoms are mainly concentrated at the interface between metals; with further compression, negative stress values prevail over the entire structure. For the Al/Mg composite up to = 0.1, blue atoms are mainly concentrated at the interface between metals; however, an increase in the number of such atoms is observed in the Mg part of the sample. Compression is accumulated more on the HCP part (Mg or Ti) of the sample (which is also seen at point III for Al/Mg and Al/Ti). For comparison, in the Al/Cu composite, the Al part of the sample is more compressed. The distribution of the shear stress on each atom ( component) is not shown because the shear stresses are much less and cannot be shown in the same value range.
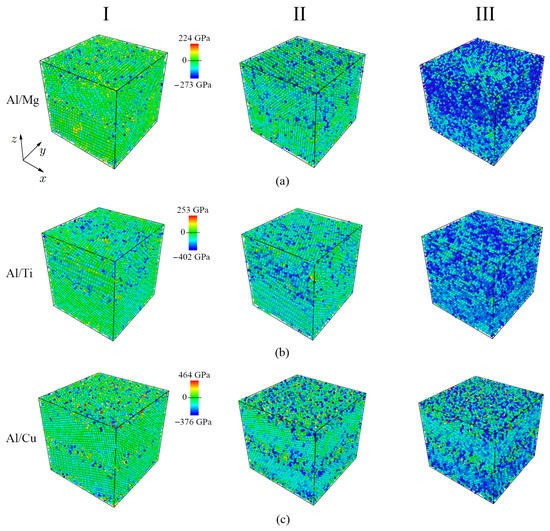
Figure 3.
Distribution of the stress on each atom () for three deformation stages (points I, II, III from Figure 2a). Three bimetallic systems are presented: (a) Al/Mg, (b) Al/Ti, (c) Al/Cu. Atoms are colored in accordance with the color bar for each system.
The main role in atomic mixing in this case plays the value of deformation. In a real experiment, atoms can move through the interface only if the temperature is big enough [19,37,41,68], while during HPT temperature is equal to 300 K. Thus, applied stress became the most important factor. As it was previously shown, to fabricate a composite structure more than simple compression should be used and the main role is given to shear strain [69].
During deformation, most of the mixing processes for Al and Mg (Ti, Cu) atoms took place through the interface of dissimilar metals. In Figure 4, Figure 5 and Figure 6, the atomic positions through Al/Mg, Al/Ti and Al/Cu interface changed during deformation 0.00 ⩽
⩽ 0.16 are presented, respectively. Blocks of Mg, Ti, and Cu in the figure are shifted to the right by about 100 Å for better understanding. Just part of the simulation cell along z-axis near the interface is presented. Atomic positions at different strains are presented by different colors.
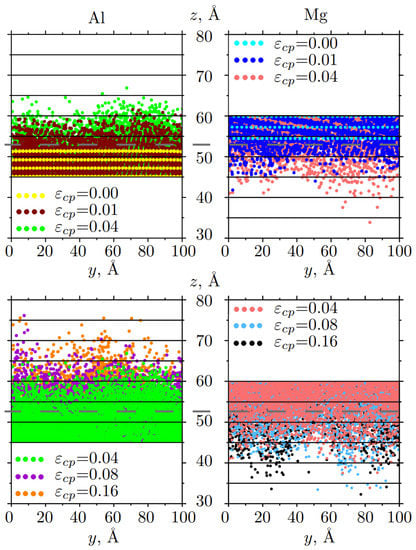
Figure 4.
Snapshots of the mutual diffusion of Al and Mg atoms at different strains: for 0.00 ⩽⩽ 0.04 (up) and 0.04 ⩽⩽ 0.16 (down). Atoms are colored in accordance with strain. Only part of the sample along z-axis is presented. The initial boundary interface is shown by the gray dotted line.
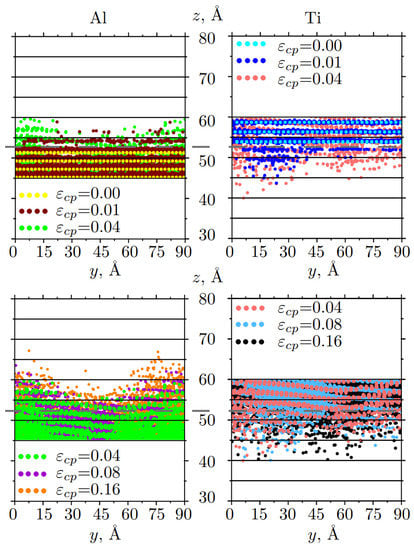
Figure 5.
Snapshots of the mutual diffusion of Al and Ti atoms at different strains: for 0.00 ⩽⩽ 0.04 (up) and for 0.04 ⩽⩽ 0.16 (down). Atoms are colored in accordance with strain. Only part of the sample along z-axis is presented. The initial boundary interface is shown by the gray dotted line.
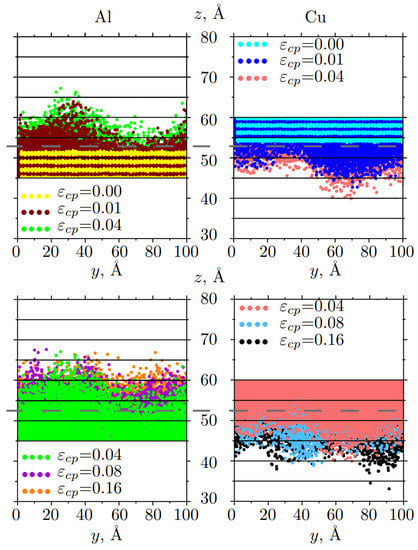
Figure 6.
Snapshots of the mutual diffusion of Al and Cu atoms at different strains: for 0.00 ⩽⩽ 0.04 (up) and for 0.04 ⩽⩽ 0.16 (down). Atoms are colored in accordance with strain. Only part of the sample along z-axis is presented. The initial boundary interface is shown in the gray dotted line.
As it is found, the number of atoms moving through the interface of dissimilar metals and diffusion depth is considerably dependent, especially on the applied shear strain. However, fast atomic mixing took place during the first deformation stages for 0.04. The atomic positions on the interfacial region are significantly changing during diffusion bonding, which is close to results from the literature, for example for Al/Cu [41].
The average and maximum distances of the displacement of the atoms over the interface (compared to the position of the boundary at initial state) are presented in Figure 7a–c. The value of (diffusion depth) is defined as the difference between z coordinate and the initial interface position. The value of is defined as the average for all z coordinates divided by the number of atoms moved through the interface. The relationships of diffusion depth on the applied strain are fitted by solid curves.
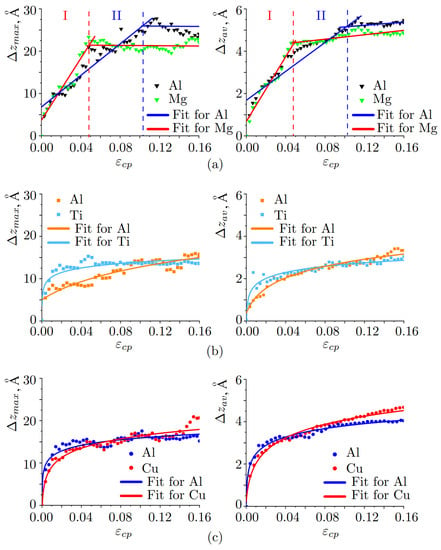
Figure 7.
Changes of the atomic positions as the function of compressive strain: (a) Al/Mg, (b) Al/Ti, (c) Al/Cu.
One of the important characteristics of such bimetallic systems of dissimilar metals is adhesive strength and atomic bonding, which can be experimentally obtained [10,70,71]. It was shown that the adhesion and bonding between Mg and Al atoms are considerably dependent on external factors. In [71], it is shown that MgAl phase quickly appeared at the Al/Mg interface in course of solid-state mixing, and due to its low toughness, this bonding is weak. Adhesive strength and atomic bonding for Al/Cu were experimentally obtained in [10,34,72,73]. It is found that for different intermetallic phases, the bonding energy between Al and Cu atoms can be very different. For example, if AlCu phase is considered, the interconnection is stronger than that of pure Al and Cu and shows better thermal stability at finite temperatures.
Al/Mg Interface
Atoms near the Al/Me interface actively move from one metal block to another. After = 0.04, atomic positions at different strains are almost the same with just several atoms moved far from the interface.
Diffusion depth for Al/Mg (Figure 7a) have two regions which can be linearly fitted: region I 0.49, 0.102 and region II 0.49 0.16, 0.102 0.16. As can be seen, after = 0.49, the motion of Mg atoms slows down and the penetration rate practically does not change. In contrast, Al atoms move deeper and longer in time until = 0.102.
Linear relationship = is used to analyze diffusion depth as the function of strain, where k is the diffusion rate and can be obtained from the slope of the fitting curve. For Mg, at I regime = 0.19 Å/ps and at II regime = 0. For Al, = 0.11 Å/ps and at II regime = 0. Thus, the diffusion rate at 0.49 for Mg is almost two times bigger than for Al, while diffusion of Al atoms extended two times longer. Here, applied strain defines kinetic energy for atomic diffusion.
3.3. Al/Ti Interface
As can be seen, Ti atoms move faster in the central part of the sample (Figure 5 (up), right side, blue and light red dots), while Al atoms move faster at the edges (Figure 5 (up), left side, brown and green dots). During compression up to the strain =0.04, Ti atoms penetrate more actively near the mixing interface than aluminum atoms and pass into the Al part for about 14 Å. After = 0.04, Ti atoms practically do not change their positions, while Al atoms continue to slowly move inside Ti part. However, at = 0.16, the number of Al atoms diffusing into the Ti block is almost the same as the number of Ti atoms moving into the Al block. During compression, the greater number of atoms are involved in the diffusion process, and the width of the diffusion zone increased with strain increase.
It can be seen from Figure 7b that, diffusion depth for Al/Ti increases logarithmically with increasing pressure (time) , where b shows the steepness of the curve. It is clearly seen, that Ti atoms move actively and go deeper before 0.04 (coefficient = 1.5 Å/ps), while Al atoms continuously move towards Ti part during all the deformation process (curve is flat with = 0.9 Å/ps). However, the curves for Al/Ti practically coincide, which means that on average, Al and Ti atoms mixed symmetrically. It can be noted, that Ti has a bigger atomic radius and much bigger atomic mass than Al atoms. Thus, in the first stage, Ti atoms can penetrate the Al block easier, while small Al atoms move slower during all compression stages. In total, diffusion is quite symmetric which is related to the material parameters of Al and Ti [60,74].
Strain value can provide enough atomic mixing near the interface of dissimilar metals. However, after = 0.16, atomic mixing is almost stopped because the structure near the interface is considerably compressed.
3.4. Al/Cu Interface
From Figure 6 it can be seen, that at the beginning of the deformation, Al atoms move faster in the left part of the sample (brown and green dots), while Cu atoms move faster in the right part (blue and light red dots). The front of atomic movement is wave-like in comparison with the other interfaces.
Diffusion depth for Al/Cu increases logarithmically with increasing pressure (time) , where b shows the steepness of the curve (see Figure 7c). It can be seen that the most active mixing of atoms occurs before 0.04. In this case, Al atoms move a bit faster, than Cu atoms ( = 1.9 Å/ps, = 3.2 Å/ps). After = 0.04, curves almost coincide, which means that Al and Cu atoms can mix mutually due to the similarities of crystal lattices. However, close to the final steps of deformation, Cu atoms start to move deeper.
The average distance of diffusion depth is higher for Cu. Copper atoms that have atomic radius 1.27 Åcan more easily diffuse into the Al part with atomic radius 1.43 Å, which is also in agreement with previous research [41,43]. After = 0.16 compression can stop atomic mixing near the interface. Moreover, the melting of Cu took place at a temperature almost two times higher than for Al, which means the bonds in Cu are stronger than that of Al. Vacancies can easier appear more in Al, which allows better diffusion of Cu atoms into the Al lattice.
3.5. Tensile Tests
In Figure 8a–c, stress–strain curves with different structural states in course of tension normal to the Al/Mg, Al/Ti, and Al/Cu interface are presented. Three stages of compression are considered to reveal the effect of the value of compressive strain applied to the initial sample on the mechanical strength. Stress–strain curves are presented for the tension after compression at stages I (red curve), II (green curve), and III (black curve) for all the considered structures (see Figure 2). Note that for Al/Mg, stages I and II correspond to compressive strains = 0.05, = 0.102, respectively; for Al/Ti stages I and II correspond to compressive strains = 0.068, = 0.107, respectively; for Al/Cu, stages I and II correspond to compressive strains = 0.042, = 0.1, respectively; for all structures stage III correspond to compressive strain = 0.16.
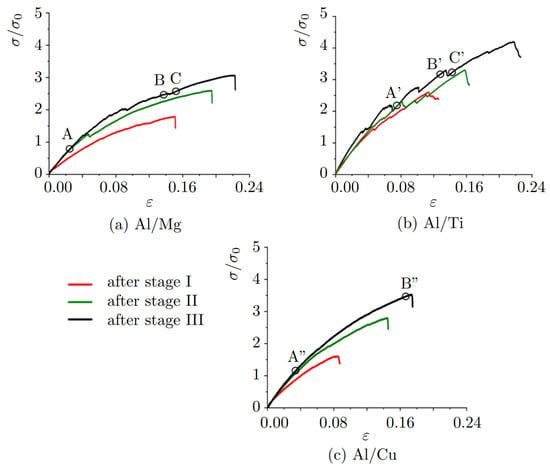
Figure 8.
Stress–strain curves during tension normal to the interface for (a) Al/Mg, (b) Al/Ti, and (c) Al/Cu. For each composite, three stress–strain curves are presented: tension after compression at stages I (red curve), II (green curve), and III (black curve). For Al/Mg, stage I is = 0.05, stage II is = 0.102; for Al/Ti, stage I is = 0.068, stage II is = 0.107; for Al/Cu stage I is = 0.042, stage II is = 0.10; for all structures stage III is = 0.16. Letters A–C, A’–C’, A”–B” show important points on the stress-strain curves at which structure analysis will be conducted.
Changes in the stresses for all of the stress–strain curves are explained by the changes in the strain energy during the deformation which is connected with the defect activities. From the stress–strain curve for Al/Ti (Figure 8b) it can be seen that active structural changes occur during tension.
After compression to = 0.16, for Al/Ti and Al/Cu composites, fracture took place in the Al part, while for Al/Mg—in the Mg part. Thus, the interface area after compression where the atomic mixing took place is stronger than the parts of pure metal. In [17], for Al/(Cu,Nb,Mg) fracture took place in the Al phase. However, a direct comparison of Young modulus or strain values obtained in the present work and in [17] is not possible since only a small part of the interface is simulated. In the experiment, grain boundaries play a very important role, while in the present work, two monocrystals are considered which also affects the results. An increase in the ultimate tensile strength of the composites is observed with the increase in the value of initial compression. The elastic regions for three structures are: for Al/Mg is 0.02, for Al/Ti and Al/Cu is 0.03.
Values of ultimate tensile strength , fracture strain and Young’s modulus are presented in Table 2. As it can be seen after compression to = 0.16, Al/Ti composite has the highest ultimate tensile strength, Al/Cu—average, and Al/Mg—the lowest. The fracture strength of Al/Mg and Al/Ti composites is very close. In [17], Al/Cu composite has the highest strength and Al/Mg—average. Results for Al/Ti cannot be compared since the composite was not obtained.

Table 2.
Fracture strain (), ultimate tensile strength () and Young’s modulus () after tension normal to the interface after different initial compressive strain. For Al/Mg, stages I ( = 0.05) and II ( = 0.102); for Al/Ti, stages I ( = 0.068) and II ( = 0.107); for Al/Cu, stages I ( = 0.042) and II ( = 0.1); for all structures stage III ( = 0.16).
For Al/Mg (Figure 8a), the stress–strain curves during the tension of the composite compressed to stages II (green color) and III (black color) practically coincide in the linear region (before = 0.02). The ultimate tensile strength and Young’s modulus for these stages are also very close (Table 2). Fracture took place in the magnesium part of the composite near the interface. After compression to stage I (red color), fracture took place right at the interface, which means that applied compression is not enough for the proper atomic mixing.
For Al/Ti (Figure 8b), the stress–strain curves after compression at stages I-III coincide well. However, the fracture strain and ultimate tensile strength are much lower after compression to I and II stages. Fracture took place in the aluminum part of the composite far from the interface. It should be noted, that in [17] the lowest mixing occurred in Al/Ti composite even after 30 revolutions of anvils. Thus, it was concluded that more pressure is required to obtain composite. In the present work, pressure is high enough to allow the mixing of atoms near the interface.
The curves for Al/Cu (Figure 8c) during tension after compression to stages II (green color) and III (black color) coincide well in the elastic region (before = 0.03). Fracture took place for compression to stages II and III in the aluminum part of the composite far from the interface; however, for stage I, again the fracture is observed at the interface.
To understand the deformation process and evaluate the composite strength, CNA and dislocation analysis during tension are conducted for composites compressed to stage III. Structures at strain with respect to the characteristic points shown in the stress–strain black curves in Figure 8 are presented in Figure 9, Figure 10 and Figure 11. CNA and dislocation structure at = 0.16 are presented previously in Figure 2c,d.
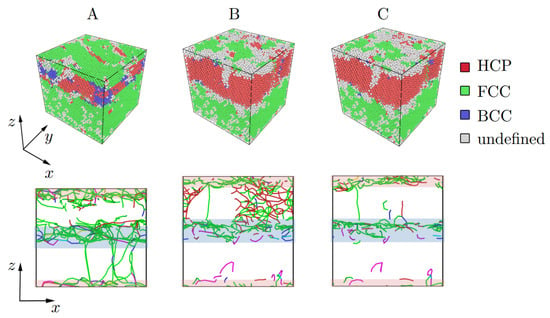
Figure 9.
Structure representation of the Al/Mg composite based on CNA and dislocation analysis under tension. Values of strain (points A, B, C) are chosen with respect to the stress-strain curves shown in Figure 8a (points A, B, C). The Stair-rod dislocation lines are colored purple, the Hirth dislocation lines are colored yellow, Frank dislocation lines are colored light blue, the Perfect dislocation lines are colored blue and the Shockley dislocation lines are colored green. The boundary interface where atomic mixing took place is shown by shaded rectangles.
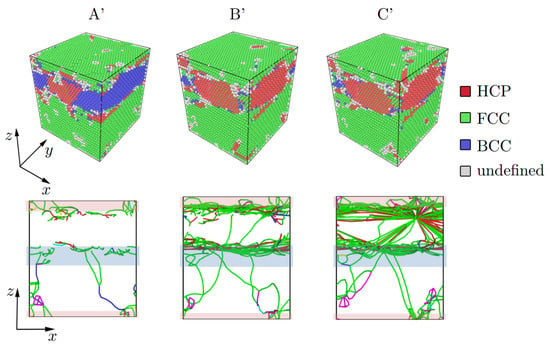
Figure 10.
Structure representation of the Al/Ti composite based on CNA and dislocation analysis under tension. Values of strain (points A’, B’, C’) are chosen in accordance with stress–strain curves shown in Figure 8b (points A’, B’, C’). The Stair-rod dislocation lines are colored purple, the Hirth dislocation lines are colored yellow, Frank dislocation lines are colored light blue, the Perfect dislocation lines are colored blue and the Shockley dislocation lines are colored green. The boundary interface where atomic mixing took place is shown by shaded rectangles.
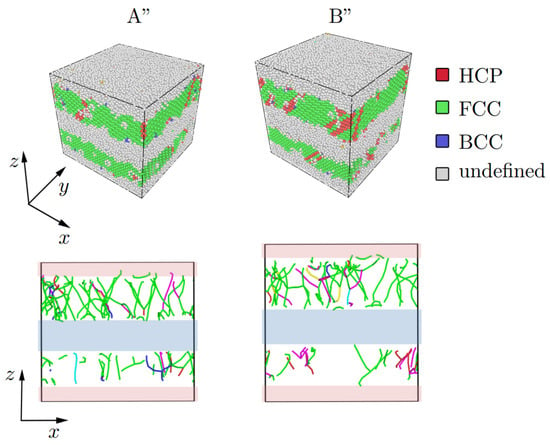
Figure 11.
Structure representation of the Al/Cu composite based on CNA and dislocation analysis under tension at A” = 0.035, B” = 0.165. Values of strain (points A” and B”) are chosen in accordance with stress–strain curves shown in Figure 8c (points A” and B”). The Stair-rod dislocation lines are colored purple, the Hirth dislocation lines are colored yellow, Frank dislocation lines are colored light blue, the Perfect dislocation lines are colored blue and the Shockley dislocation lines are colored green. The boundary interface where atomic mixing took place is shown by shaded rectangles.
After compression to = 0.16, mostly the BCC phase can be seen in the Mg part of the composite, while the interface area, where Al and Mg atoms are mixed, is defined as FCC lattice. Most dislocations nucleated near the interface between Al and Mg (shown by shaded zones). In the elastic regime ( 0.045), reverse phase transformation took place from BCC to HCP phase. An FCC atom layer also can be seen from CNA which corresponds to the presence of the stacking faults and twins in Mg. As it was shown, twinning is one of the effective mechanisms of deformation in Mg [75,76].
At = 0.03, new dislocation junctions appeared in the Mg part, while dislocation distribution in Al remains almost the same from = 0.03 to = 0.14. After = 0.14, the net of dislocation can be seen better in Mg part until point C. Fracture took place at = 0.22 in the Mg part of the composite. Near the strength limit, almost no dislocations can be found in the composite.
After compression to = 0.16, BCC phase (blue atoms) is dominant in Ti, dislocation structure is undeveloped (Figure 2c), dislocations are mainly located near the interface and in the aluminum part of the composite. Again, the interface region is defined as FCC lattice. During tension, the HPC Ti lattice begins to recover (point A’). At point B’, many more dislocations appeared on the interface region. At point C’, dislocation junctions are observed in Ti, which disappears after = 0.135. At = 0.19, the number of dislocations in Al is more prominent than in Ti part. Fracture took place at = 0.217 in the Al part of the composite.
It was previously confirmed [51,52,77] that MD simulation can effectively reproduce the phase transformation in Al/Ti system and allows even the definition of different intermetallic phases. At the same time, here, the basic idea is to analyze interatomic mixing under compression combined with shear, and phases are not exactly defined, just by the lattice type.
The differences in stress–strain curves for Al/Mg and Al/Ti (both are the combination of FCC and HCP lattice) can be explained based on the difference in lattice parameters: for Mg > 1.63 and for Ti < 1.63. In the former case, one type of twinning plane operates, while for Ti the number of effective twinning planes and directions is bigger [17]. It can also be seen from Figure 10 and Figure 11, that the dislocation structure is more developed in Ti. The formation of dislocations near the HCP/FCC interfaces was also shown previously in Al/Ti alloy [51].
After compression to = 0.16, most of the dislocations appeared in the Cu part of the composite (Figure 2d). For Al/Cu (Figure 11), only two strain values are shown, since no special changes in the structure are observed. For this case, OVITO could not determine the type of crystal lattice in the interface as well as dislocation distribution.
4. Conclusions
Atomic mixing on the Al/Mg, Al/Ti, and Al/Cu interfaces under high pressure along with shear deformation is studied by molecular dynamics simulation. The applied deformation technique is based on the experiments shown in [13,14,15,16,17] for Al-matrix composites obtained by HPT. It is confirmed by MD simulation, that compression combined with shear is able to promote solid-state mixing with the formation of a strong intermetallic layer for the Al/Me interface. During the compression of different metals, several key factors are revealed: type of lattice, deformation mechanisms, characteristics of different metals, and defect structures, to name a few. Thus, it is not an easy task to directly compare such different metals. However, this work can shed the light on the understanding of the process of atomic mixing.
Considerable mixing of Al and Me atoms took place before compression strain = 0.04 altogether with shear strain = 0.4. However, at this stage, the mixed Al/Mg and Al/Cu regions are weaker and fracture took place in the boundary regions. Thus, there is a critical value of compressive and shear strain required to obtain the composite interface: for all the composites, compression to = 0.1 is enough to obtain the interface with high strength. The diffusion depth of Al atoms and atoms of the other Me (Mg, Ti, Cu) is dependent on the applied strain rather than temperature [15,17,69]. The linear relationship between the diffusion depth for Al/Mg on the applied strain is observed, while for Al/Ti and Al/Cu this relation is logarithmic.
Tensile mechanical testing shows that after some value of compression is achieved, no significant strengthening of the interface layer is observed. However, the higher the value shear strain, the higher the composite strength. After compression to = 0.16, Al/Ti composite has the highest ultimate tensile strength, Al/Cu—the average, and Al/Mg—the lowest. The fracture strain of Al/Mg and Al/Ti composites are very close.
Author Contributions
Conceptualization, J.A.B. and R.R.M.; methodology, P.V.P.; formal analysis, P.V.P.; resources, R.R.M.; investigation, P.V.P.; writing—original draft preparation, P.V.P., J.A.B. and R.R.M. All authors have read and agreed to the published version of the manuscript.
Funding
Work is supported by the State Assignment of IMSP RAS.
Data Availability Statement
Not applicable.
Conflicts of Interest
The authors declare no conflict of interest.
Nomenclature
| Symbol | Meaning | Units |
| a, c | Lattice parameters | Å |
| r | Atomic radius | g/mol |
| Compressive strain | ||
| Compressive stress | GPa | |
| , , | Size of structure | Å |
| Ultimate tensile strength | GPa | |
| E | Young’s modulus | GPa |
| Ultimate tensile strength of the initial noncompressive sample | GPa | |
| Young’s modulus of the initial noncompressive sample | GPa | |
| Average distances of an atomic displacement (Average diffusion depth) | Å | |
| Maximum distances of an atomic displacement (Maximum diffusion depth) | Å | |
| k, b | Diffusion rate | Å/ps |
| Fracture strain | ||
| Strain during uniaxial tension along |
References
- Zhang, J.; Song, B.; Wei, Q.; Bourell, D.; Shi, Y. A review of selective laser melting of aluminum alloys: Processing, microstructure, property and developing trends. J. Mater. Sci. Technol. 2019, 35, 270–284. [Google Scholar] [CrossRef]
- Imran, M.; Khan, A.A. Characterization of Al-7075 metal matrix composites: A review. J. Mater. Res. Technol. 2019, 8, 3347–3356. [Google Scholar] [CrossRef]
- Xu, T.; Yang, Y.; Peng, X.; Song, J.; Pan, F. Overview of advancement and development trend on magnesium alloy. J. Magnes. Alloy. 2019, 7, 536–544. [Google Scholar] [CrossRef]
- Hirsch, J.; Al-Samman, T. Superior light metals by texture engineering: Optimized aluminum and magnesium alloys for automotive applications. Acta Mater. 2013, 61, 818–843. [Google Scholar] [CrossRef]
- Lacaze, J.; Tierce, S.; Lafont, M.C.; Thebault, Y.; Pébère, N.; Mankowski, G.; Blanc, C.; Robidou, H.; Vaumousse, D.; Daloz, D. Study of the microstructure resulting from brazed aluminium materials used in heat exchangers. Mater. Sci. Eng. A 2005, 413–414, 317–321. [Google Scholar] [CrossRef]
- Kala, H.; Mer, K.; Kumar, S. A Review on Mechanical and Tribological Behaviors of Stir Cast Aluminum Matrix Composites. Procedia Mater. Sci. 2014, 6, 1951–1960. [Google Scholar] [CrossRef]
- Mishra, R.; Mahoney, M.; McFadden, S.; Mara, N.; Mukherjee, A. High strain rate superplasticity in a friction stir processed 7075 Al alloy. Scr. Mater. 1999, 42, 163–168. [Google Scholar] [CrossRef]
- Wei, X.; Zhou, Q.; Xu, K.; Huang, P.; Wang, F.; Lu, T. Enhanced hardness via interface alloying in nanoscale Cu/Al multilayers. Mater. Sci. Eng. A 2018, 726, 274–281. [Google Scholar] [CrossRef]
- Fronczek, D.; Chulist, R.; Litynska-Dobrzynska, L.; Kac, S.; Schell, N.; Kania, Z.; Szulc, Z.; Wojewoda-Budka, J. Microstructure and kinetics of intermetallic phase growth of three-layered A1050/AZ31/A1050 clads prepared by explosive welding combined with subsequent annealing. Mater. Des. 2017, 130, 120–130. [Google Scholar] [CrossRef]
- Rahmatabadi, D.; Tayyebi, M.; Hashemi, R.; Faraji, G. Microstructure and mechanical properties of Al/Cu/Mg laminated composite sheets produced by the ARB proces. Int. J. Miner. Metall. Mater. 2018, 25, 564–572. [Google Scholar] [CrossRef]
- Shayanpoor, A.; Ashtiani, H.R. Microstructural and mechanical investigations of powder reinforced interface layer of hot extruded Al/Cu bimetallic composite rods. J. Manuf. Process. 2022, 77, 313–328. [Google Scholar] [CrossRef]
- Rodak, K.; Rzychoń, T.; Mikuszewski, T.; Chmiela, B.; Sozańska, M.; Boczkal, S. Ultrafine-Grained Microstructures of Al–Cu Alloys with Hypoeutectic and Hypereutectic Composition Produced by Extrusion Combined with Reversible Torsion. Microsc. Microanal. 2022, 28, 953–960. [Google Scholar] [CrossRef]
- Mulyukov, R.R.; Korznikova, G.F.; Nazarov, K.S.; Khisamov, R.K.; Sergeev, S.N.; Shayachmetov, R.U.; Khalikova, G.R.; Korznikova, E.A. Annealing-induced phase transformations and hardness evolution in Al–Cu–Al composites obtained by high-pressure torsion. Acta Mech. 2021, 232, 1815–1828. [Google Scholar] [CrossRef]
- Korznikova, G.; Korznikova, E.; Nazarov, K.; Shayakhmetov, R.; Khisamov, R.; Khalikova, G.; Mulyukov, R. Structure and Mechanical Behavior of Al–Nb Hybrids Obtained by High-Pressure-Torsion-Induced Diffusion Bonding and Subsequent Annealing. Adv. Eng. Mater. 2020, 23, 2000757. [Google Scholar] [CrossRef]
- Korznikova, G.; Kabirov, R.; Nazarov, K.; Khisamov, R.; Shayakhmetov, R.; Korznikova, E.; Khalikova, G.; Mulyukov, R. Influence of Constrained High-Pressure Torsion on Microstructure and Mechanical Properties of an Aluminum-Based Metal Matrix Composite. JOM 2020, 72, 2898–2911. [Google Scholar] [CrossRef]
- Korznikova, G.; Nazarov, K.; Khisamov, R.; Sergeev, S.; Shayachmetov, R.; Khalikova, G.; Baimova, J.; Glezer, A.; Mulyukov, R. Intermetallic growth kinetics and microstructure evolution in Al-Cu-Al metal-matrix composite processed by high pressure torsion. Mater. Lett. 2019, 253, 412–415. [Google Scholar] [CrossRef]
- Korznikova, G.; Korznikova, E.; Khalikova, G.; Nazarov, K.; Khisamov, R.; Sergeev, S.; Shayakhmetov, R.; Mulyukov, R. Al based layered in situ metal-matrix composites fabricated by constrained high pressure torsion. Lett. Mater. 2021, 11, 533–543. [Google Scholar] [CrossRef]
- Rogachev, S.; Khatkevich, V.; Sundeev, R. High strength in layered metal composites obtained by high-pressure torsion. Mater. Lett. 2021, 303, 130567. [Google Scholar] [CrossRef]
- Funamizu, Y.; Watanabe, K. Interdiffusion in the AlCu System. Trans. Jpn. Inst. Met. 1971, 12, 147–152. [Google Scholar] [CrossRef]
- Tanaka, Y.; Kajihara, M.; Watanabe, Y. Growth behavior of compound layers during reactive diffusion between solid Cu and liquid Al. Mater. Sci. Eng. A 2007, 445–446, 355–363. [Google Scholar] [CrossRef]
- Chen, D.; Zhang, H.; Zhao, D.; Liu, Y.; Jiang, Z. Effects of annealing temperature on interface microstructure and element diffusion of ultra-thin Cu/Al composite sheets. Mater. Lett. 2022, 322, 132491. [Google Scholar] [CrossRef]
- Han, J.K.; Han, D.K.; Liang, G.Y.; Jang, J.I.; Langdon, T.G.; Kawasaki, M. Direct Bonding of Aluminum–Copper Metals through High-Pressure Torsion Processing. Adv. Eng. Mater. 2018, 20, 1800642. [Google Scholar] [CrossRef]
- Kulagin, R.; Beygelzimer, Y.; Ivanisenko, Y.; Mazilkin, A.; Straumal, B.; Hahn, H. Instabilities of interfaces between dissimilar metals induced by high pressure torsion. Mater. Lett. 2018, 222, 172–175. [Google Scholar] [CrossRef]
- Kawasaki, M.; Han, J.K.; Lee, D.H.; Jang, J.I.; Langdon, T.G. Fabrication of nanocomposites through diffusion bonding under high-pressure torsion. J. Mater. Res. 2018, 33, 2700–2710. [Google Scholar] [CrossRef]
- Kawasaki, M.; Jang, J.I. Micro-Mechanical Response of an Al-Mg Hybrid System Synthesized by High-Pressure Torsion. Materials 2017, 10, 596. [Google Scholar] [CrossRef]
- Cao, M.; Wang, C.J.; Deng, K.K.; Nie, K.B.; Liang, W.; Wu, Y.C. Effect of interface on mechanical properties and formability of Ti/Al/Ti laminated composites. J. Mater. Res. Technol. 2021, 14, 1655–1669. [Google Scholar] [CrossRef]
- Bartkowska, A.; Bazarnik, P.; Huang, Y.; Lewandowska, M.; Langdon, T.G. Using high-pressure torsion to fabricate an Al–Ti hybrid system with exceptional mechanical properties. Mater. Sci. Eng. A 2021, 799, 140114. [Google Scholar] [CrossRef]
- Bazarnik, P.; Bartkowska, A.; Huang, Y.; Szlkazak, K.; Adamczyk-Cieslak, B.; Sort, J.; Lewandowska, M.; Langdon, T.G. Fabrication of hybrid nanocrystalline Al–Ti alloys by mechanical bonding through high-pressure torsion. Mater. Sci. Eng. A 2022, 833, 142549. [Google Scholar] [CrossRef]
- Elangovan, K.; Balasubramanian, V. Influences of pin profile and rotational speed of the tool on the formation of friction stir processing zone in AA2219 aluminium alloy. Mater. Sci. Eng. A 2007, 459, 7–18. [Google Scholar] [CrossRef]
- Karthikeyan, L.; Senthilkumar, V.; Padmanabhan, K. On the role of process variables in the friction stir processing of cast aluminum A319 alloy. Mater. Des. 2010, 31, 761–771. [Google Scholar] [CrossRef]
- Kim, D.; Kim, K.; Kwon, H. Interdiffusion and Intermetallic Compounds at Al/Cu Interfaces in Al-50vol.%Cu Composite Prepared by Solid-State Sintering. Materials 2021, 14, 4307. [Google Scholar] [CrossRef]
- Agureev, L.E.; Kostikov, V.I.; Yeremeyeva, Z.V.; Barmin, A.A.; Rizakhanov, R.N.; Ivanov, B.S.; Ashmarin, A.A.; Laptev, I.N.; Rudshteyn, R.I. Powder aluminum composites of Al–Cu system with micro-additions of oxide nanoparticles. Inorg. Mater. Appl. Res. 2016, 7, 687–690. [Google Scholar] [CrossRef]
- Simsek, D.; Simsek, I.; Ozyurek, D. Relationship between Al2O3 Content and Wear Behavior of Al+2% Graphite Matrix Composites. Sci. Eng. Compos. Mater. 2020, 27, 177–185. [Google Scholar] [CrossRef]
- Mehr, V.Y.; Toroghinejad, M.R.; Rezaeian, A. The effects of oxide film and annealing treatment on the bond strength of Al–Cu strips in cold roll bonding process. Mater. Des. 2014, 53, 174–181. [Google Scholar] [CrossRef]
- Akgöz, B.; Civalek, Ö. Buckling Analysis of Functionally Graded Tapered Microbeams via Rayleigh–Ritz Method. Mathematics 2022, 10, 4429. [Google Scholar] [CrossRef]
- Cao, N.; Xi, M.; Li, X.; Zheng, J.; Qian, L.; Dai, Y.; Song, X.; Hu, S. Recent Developments in Heterogeneous Photocatalysts with Near-Infrared Response. Symmetry 2022, 14, 2107. [Google Scholar] [CrossRef]
- Mao, A.; Zhang, J.; Yao, S.; Wang, A.; Wang, W.; Li, Y.; Qiao, C.; Xie, J.; Jia, Y. The diffusion behaviors at the Cu-Al solid-liquid interface: A molecular dynamics study. Results Phys. 2020, 16, 102998. [Google Scholar] [CrossRef]
- Chen, S.Y.; Wu, Z.W.; Liu, K.X.; Li, X.J.; Luo, N.; Lu, G.X. Atomic diffusion behavior in Cu-Al explosive welding process. J. Appl. Phys. 2013, 113, 044901. [Google Scholar] [CrossRef]
- Levchenko, E.V.; Evteev, A.V.; Lorscheider, T.; Belova, I.V.; Murch, G.E. Molecular dynamics simulation of alloying in an Al-coated Ti nanoparticle. Comput. Mater. Sci. 2013, 79, 316–325. [Google Scholar] [CrossRef]
- Palafox-Hernandez, J.P.; Laird, B.B.; Asta, M. Atomistic characterization of the Cu–Pb solid–liquid interface. Acta Mater. 2011, 59, 3137–3144. [Google Scholar] [CrossRef]
- Li, C.; Li, D.; Tao, X.; Chen, H.; Ouyang, Y. Molecular dynamics simulation of diffusion bonding of Al–Cu interface. Model. Simul. Mater. Sci. Eng. 2014, 22, 065013. [Google Scholar] [CrossRef]
- Abdulrehman, M.A.; Hussein, M.A.M.; Marhoon, I.I. Temperature-dependent mechanical properties of Al/Cu nanocomposites under tensile loading via molecular dynamics method. Curved Layer. Struct. 2022, 9, 96–104. [Google Scholar] [CrossRef]
- Chen, S.; Ke, F.; Zhou, M.; Bai, Y. Atomistic investigation of the effects of temperature and surface roughness on diffusion bonding between Cu and Al. Acta Mater. 2007, 55, 3169–3175. [Google Scholar] [CrossRef]
- Jensen, J.H. Molecular Modeling Basics; CRC Press: Boca Raton, FL, USA, 2010. [Google Scholar] [CrossRef]
- Available online: https://www.lammps.org/ (accessed on 1 December 2022).
- Available online: https://www.ovito.org/ (accessed on 1 December 2022).
- Zope, R.R.; Mishin, Y. Interatomic potentials for atomistic simulations of the Ti-Al system. Phys. Rev. B 2003, 68, 024102. [Google Scholar] [CrossRef]
- Cai, J.; Ye, Y.Y. Simple analytical embedded-atom-potential model including a long-range force for fcc metals and their alloys. Phys. Rev. B 1996, 54, 8398–8410. [Google Scholar] [CrossRef]
- Liu, X.Y.; Ohotnicky, P.; Adams, J.; Rohrer, C.; Hyland, R. Anisotropic surface segregation in AlMg alloys. Surf. Sci. 1997, 373, 357–370. [Google Scholar] [CrossRef]
- Fu, R.; Rui, Z.; Feng, R.; Dong, Y.; Lv, X. Effects of lamellar interfaces on translamellar crack propagation in TiAl alloys. J. Alloys Compd. 2022, 918, 165616. [Google Scholar] [CrossRef]
- Zhang, H.; Wei, B.; Ou, X.; Ni, S.; Zhou, K.; Song, M. Dislocation induced FCC twinning at the HCP/FCC interfaces in a deformed Ti-5atAl alloy: Experiments and simulations. J. Phys. Chem. Solids 2022, 169, 110835. [Google Scholar] [CrossRef]
- Wen, D.; Kong, B.; Wang, S.; Liu, L.; Song, Q.; Yin, Z. Mechanism of stress- and thermal-induced fct → hcp → fcc crystal structure change in a TiAl-based alloy compressed at elevated temperature. Mater. Sci. Eng. A 2022, 840, 143011. [Google Scholar] [CrossRef]
- Samiri, A.; Khmich, A.; Hassani, A.; Hasnaoui, A. Elastic and structural properties of Mg25Al75 binary metallic glass under different cooling conditions. J. Alloys Compd. 2022, 891, 161979. [Google Scholar] [CrossRef]
- Kazemi, A.; Yang, S. Effects of magnesium dopants on grain boundary migration in aluminum-magnesium alloys. Comput. Mater. Sci. 2021, 188, 110130. [Google Scholar] [CrossRef]
- Zhang, J.; Mao, A.; Wang, J.; Liu, C.; Xie, J.; Jia, Y. Grain boundary heredity from Cu/Al solid–liquid interface via diffusion during the solidification processes. Chem. Phys. 2022, 552, 111369. [Google Scholar] [CrossRef]
- Zhang, Q.; Li, J.; Tang, S.; Wang, Z.; Wang, J. Atomistic Mechanism Underlying Nucleation in Al–Cu Alloys with Different Compositions and Cooling Rates. J. Phys. Chem. C 2021, 125, 3480–3494. [Google Scholar] [CrossRef]
- Polyakova, P.V.; Pukhacheva, J.A.; Shcherbinin, S.A.; Baimova, J.A.; Mulyukov, R.R. Fabrication of Magnesium-Aluminum Composites under High-Pressure Torsion: Atomistic Simulation. Appl. Sci. 2021, 11, 6801. [Google Scholar] [CrossRef]
- Polyakova, P.; Shcherbinin, S.; Baimova, J. Molecular dynamics investigation of atomic mixing and mechanical properties of Al/Ti interface. Lett. Mater. 2021, 11, 561–565. [Google Scholar] [CrossRef]
- Pearson, W. Tabulated Lattice Spacings and Data of Intermediate Phases in Alloy Systems. In A Handbook of Lattice Spacings and Structures of Metals and Alloys; Elsevier: Amsterdam, The Netherlands, 1958; pp. 131–217. [Google Scholar] [CrossRef]
- Chen, J.; Chen, W.; Wang, C. Modeling and investigation for atomic diffusion and mechanical properties of TiAl/Ti3Al interface: Temperature effect. Appl. Phys. A 2020, 126, 493. [Google Scholar] [CrossRef]
- Yücel, Y.; Beleli, B. The role of high Mg level as a dopant on the PbS nanostructures grown by the CBD method. Mater. Res. Express 2018, 5, 056408. [Google Scholar] [CrossRef]
- Vohra, Y.K.; Spencer, P.T. Novel Phase of Titanium Metal at Megabar Pressures. Phys. Rev. Lett. 2001, 86, 3068–3071. [Google Scholar] [CrossRef]
- Velisavljevic, N.; MacLeod, S.; Cy, H. Titanium Alloys at Extreme Pressure Conditions. In Titanium Alloys—Towards Achieving Enhanced Properties for Diversified Applications; InTech: London, UK, 2012. [Google Scholar] [CrossRef]
- Mezbahul-Islam, M.; Mostafa, A.O.; Medraj, M. Essential Magnesium Alloys Binary Phase Diagrams and Their Thermochemical Data. J. Mater. 2014, 2014, 704283. [Google Scholar] [CrossRef]
- Xie, Y.; Peng, H.; Liu, X.; Peng, K. Atomic states, potential energies, volumes, stability and brittleness of ordered FCC Ti3Al-type alloys. Phys. B Condens. Matter 2005, 362, 1–17. [Google Scholar] [CrossRef]
- Jona, F.; Marcus, P.M. Magnesium under pressure: Structure and phase transition. J. Phys. Condens. Matter 2003, 15, 7727–7734. [Google Scholar] [CrossRef]
- Chlouk, Z.E.; Kassem, W.; Shehadeh, M.; Hamade, R.F. On the mechanical response and intermetallic compound formation in Al/Fe interface: Molecular dynamics analyses. Philos. Mag. 2020, 100, 3041–3060. [Google Scholar] [CrossRef]
- Geysermans, P.; Gorse, D.; Pontikis, V. Molecular dynamics study of the solid–liquid interface. J. Chem. Phys. 2000, 113, 6382–6389. [Google Scholar] [CrossRef]
- Polyakova, P.V.; Nazarov, K.S.; Khisamov, R.K.; Baimova, J.A. Molecular dynamics simulation of structural transformations in Cu-Al system under pressure. J. Phys. Conf. Ser. 2020, 1435, 012065. [Google Scholar] [CrossRef]
- Varmazyar, J.; Khodaei, M. Diffusion bonding of aluminum-magnesium using cold rolled copper interlayer. J. Alloys Compd. 2019, 773, 838–843. [Google Scholar] [CrossRef]
- Wang, Y.; Prangnell, P.B. The significance of intermetallic compounds formed during interdiffusion in aluminum and magnesium dissimilar welds. Mater. Charact. 2017, 134, 84–95. [Google Scholar] [CrossRef]
- Dai, W.; Zhang, C.; Zhao, L.; Li, C. Effects of Cu content in Al-Cu alloys on microstructure, adhesive strength, and corrosion resistance of thick micro-arc oxidation coatings. Mater. Today Commun. 2022, 33, 104195. [Google Scholar] [CrossRef]
- Gao, Y.; Mo, Q.; Luo, Z.; Zhang, L.; Huang, C. Atomic bonding and properties of Al-Cu alloy with (Al2Cu). J. Electron. Mater. 2006, 35, 1801–1805. [Google Scholar] [CrossRef]
- Li, P.; Wang, L.; Wang, B.; Yan, S.; Meng, M.; Ji, X.; Xue, K. Diffusion and mechanical properties of Ti2AlNb and TA15 interface: From experiments to molecular dynamics. Vacuum 2022, 195, 110637. [Google Scholar] [CrossRef]
- Li, B.; Ma, E. Zonal dislocations mediating winning in magnesium. Acta Mater. 2009, 57, 1734–1743. [Google Scholar] [CrossRef]
- Serra, A.; Pond, R.; Bacon, D. Computer simulation of the structure and mobility of twinning disclocations in H.C.P. Metals. Acta Metall. Mater. 1991, 39, 1469–1480. [Google Scholar] [CrossRef]
- Kiselev, S.; Zhirov, E. Molecular-dynamics simulation of the synthesis of intermetallic Ti–Al. Intermetallics 2014, 49, 106–114. [Google Scholar] [CrossRef]
Disclaimer/Publisher’s Note: The statements, opinions and data contained in all publications are solely those of the individual author(s) and contributor(s) and not of MDPI and/or the editor(s). MDPI and/or the editor(s) disclaim responsibility for any injury to people or property resulting from any ideas, methods, instructions or products referred to in the content. |
© 2023 by the authors. Licensee MDPI, Basel, Switzerland. This article is an open access article distributed under the terms and conditions of the Creative Commons Attribution (CC BY) license (https://creativecommons.org/licenses/by/4.0/).