1. Introduction
Human actions directly influence the behavior of Earth’s ecosystems. For that reason, since the industrial revolution, Earth’s average temperature has gradually increased. Burning fossil fuels releases carbon dioxide, methane, and other gases into the atmosphere. These gases are the main cause of climate change and the greenhouse effect [
1]. It is undeniable that the increase in the Earth’s average temperature is changing the planet [
2]. The widespread adoption of renewable energy sources is essential to fight global warming. This requires new policies to incentivize replacing nonrenewable sources with renewable ones. A positive aspect is that the consumption of renewable sources is gradually increasing, including solar, wind, hydroelectric, tidal, wave, biomass, geothermal, or nuclear energy. The use of renewable sources has a much lower impact on the environment. However, they suffer from high installation costs, setup, and the unpredictability of nature, making it challenging to maintain constant production [
2].
Hydrogen is an energy carrier with enormous potential for the necessary energy transition. It is a clean fuel because its combustion only produces water vapor and heat. Another advantage is that its higher heating value (HHV) per mass is three times higher than gasoline [
3,
4]. Fossil fuels are currently the primary source of hydrogen production, which is a major disadvantage. One of the solutions is to promote clean ways to produce hydrogen [
5].
Thermochemical and electrolysis processes are potential techniques for producing hydrogen. Natural gas reforming and solar thermochemical hydrogen are thermochemical processes [
6]. Water electrolysis is a symmetric process that simultaneously generates hydrogen and oxygen simply using water and electricity. This technology is commercially available and can produce hydrogen with 99.9% purity [
7]. Moreover, if powered by renewable energy sources, it leads to the so-called green hydrogen. This compatibility with renewable energy makes electrolysis a highly promising technique. Unfortunately, less than 4% of global hydrogen production comes from water electrolysis [
7].
The electrolyzer, the piece of equipment where electrolysis is carried out, must always contain an anode, a cathode, and an electrolyte. There are different types of water electrolyzers, including the alkaline water electrolyzer, the proton-exchange membrane electrolyzer, and the solid oxide electrolysis cell. The former is the most mature technology, with the electrode processes described by Equations (1) and (2). KOH and NaOH are the most common electrolytes, with the former being preferred because of the higher ionic conductivity of their solutions [
7].
Electrolytic processes can also be applied to other systems, such as producing renewable synthetic fuels from liquefied biomass. Gonçalves et al. [
8] introduced gas mixtures from typical water electrolysis into a reactor containing liquefied biomass to obtain syngas, which can be further used to synthesize second-generation biofuels (e.g., biomethane, biomethanol, bio-dimethyl ether, formic acid). The authors reported that the gas outlet contained a mixture of hydrogen, oxygen, carbon monoxide, carbon dioxide, and methane, the latter reaching a volumetric concentration of 35% [
8]. Another application of electrolysis is the direct production of hydrogen from industrial byproducts. In this way, the electrolysis of black liquor (BL), a byproduct of the pulp and paper industry, appears as an exciting technology because it can produce green fuel (i.e., hydrogen) and recover lignin, a product with high market value [
4,
9]. Hydrogen is generated at the cathode, following the same reaction as in alkaline water electrolyzers (Equation (1)). Remarkably, during BL electrolysis, there is no production of gases (e.g., O
2) at the anode, with lignin electrodeposition as the only occurring anodic process. This asymmetric feature allows the BL electrolyzer to obtain high-purity hydrogen without needing a separator [
3]. The high energy requirement is a major disadvantage of conventional water electrolysis, making the process unappealing from an economic perspective. Conversely, due to the lower potential for lignin oxidation, the electrolysis of BL requires a significantly lower quantity of energy, making the process more attractive [
9,
10]. This owes to the fact that lignin electrolysis can start from ca. 0.45 V, a significantly lower potential than that required for water electrolysis, thermodynamically favored from ca. 1.2 V [
5].
Lignin is one of nature’s most abundant organic molecules and a major component (15–25%) of biomass from wood [
11]. It has a structural function and gives a hydrophobic character, decreasing water loss [
12]. Nowadays, 50 million tons of lignin are produced annually as waste in the Kraft process. The lignin in BL is usually burned in a recovery boiler to generate energy [
5,
13]. The chemical composition of BL depends on the wood used for cooking. Generally, it is composed of a complex mixture of organic and inorganic compounds [
10]. Treating the BL is essential from the environmental and economic perspectives. In fact, Kraft pulp mills release several malodorous gases (e.g., hydrogen sulfide, methyl mercaptan, dimethyl sulfide) with noticeable environmental impacts, which could be easily minimized by a moderate investment of pulp mills in proper abatement techniques [
14]. Additionally, lignin recovery from BL can have a significant economic impact. Lignin finds many applications as a substitute for phenol in phenolic resins, biodegradable plastic additive, as an adjunct crosslinker in reactions to produce epoxy resins, and it can be used as a sustainable carbon bio source. It can also be applied in fertilizers, food, and cosmetic and health applications [
4,
13,
15].
Santos et al. [
7] reviewed water electrolysis technologies for hydrogen production, including the fundamentals of alkaline water electrolysis, its advantages, and constraints. Alkaline water electrolysis is generally seen as a simpler technology; however, improving efficiency by minimizing the system resistances is necessary.
Sanchez et al. [
16] proposed a model to evaluate and optimize the performance of an alkaline water electrolysis plant. The model was based on semi-empirical equations describing the cell voltage, Faraday efficiency, and gas purity as a function of the current. Experimental data and calculated values showed excellent correlation, demonstrating the model’s accuracy. Increasing the temperature and reducing the pressure improved the system’s overall performance. The results indicated that pressure’s influence was small compared with temperature. Optimal operating conditions of 5 bar and 80 °C were determined. Other models were developed, for instance, by Ulleberg [
17], combining similar approaches to high degrees of fidelity to experimental data and prediction of equipment behavior in transient states.
Caravaca et al. [
5] proposed a new technology for hydrogen production through BL electrolysis. The production of hydrogen via electrolysis of lignin solutions was made, for the first time, in continuous operation in a Polymer Electrolyte Membrane (PEM) reactor. It was demonstrated that lignin electrolysis in PEM reactors could produce hydrogen at a much lower voltage than water electrolysis. Caravaca et al. used linear scan voltammetry to follow the current with the applied cell potential. They observed that the minimum thermodynamic cell voltage for water electrolysis was approximately 1.2 V, but when lignin solution was fed to the anode, the current changed linearly with the potential from cell potentials of ca. 0.45 V [
5]. Working at high temperatures (<90 °C) yielded better electrolysis performance due to the improved kinetics and conductivity of the polymeric membrane. Cyclic voltammetry studies also demonstrated that lignin oxidation occurred at a potential much lower than oxygen evolution. The voltammograms presented an anodic peak at approximately 0.75 V for the electrooxidation of lignin, followed by a second anodic peak at ca. 0.95 V. The latter is assumed to be related to the formation of an oxide film on the surface of the metallic anode electrocatalyst, considering that oxygen evolution is thermodynamically unfavorable at this potential [
5].
Several authors presented simulation and modeling techniques to improve the efficiency of electrolyzers [
18,
19,
20]. Jang et al. [
18] introduced a water electrolysis model that considers parameters such as the charge transfer coefficient, resistances, and electrical conductivity. The aim was to investigate the pressure effect on the performance of the alkaline water electrolysis stack and the balance of plant (BOP) power consumption. Another objective was to find the optimal operating pressure to reach the maximum system efficiency. They concluded that an increase in operating pressure increased the reversible cell voltage. However, activation and ohmic overvoltage decreased due to improved bubble kinetics. Moreover, the BOP power consumption rapidly decreased with increasing pressure in the low-pressure range (<10 bar). Increasing pressure would increase hydrogen purity; however, the increase of purity was not significant at approximately >20 bar. Lee et al. [
19] proposed a multidimensional and transient model for water electrolysis where the electrochemical reactions and key transport processes were rigorously considered. The model was validated through data obtained experimentally under different conditions. The multidimensional distributions of species concentration, temperature, and current density were also analyzed. Herdem et al. [
20] developed a novel thermodynamic model for producing hydrogen from coal gasification and alkaline water electrolysis in parallel and evaluated it through exergy efficiency. The power required was entirely generated in the system; thus, connecting to the electric grid was not needed. The CO
2 produced was captured, making the system environmentally friendly. Dolle et al. [
21] and Li et al. [
22] focused on decreasing the cell voltage during electrolysis. Having that in mind, Dolle et al. [
21] studied the replacement of water electrolysis with biomass electrolysis. This is an attractive solution to decrease the hydrogen production costs and valorize wastes from agriculture/forestry and biofuel industries. Li et al. [
22] followed a more focused approach, where lignin solutions replaced water, and studied the key operating parameters of the lignin-assisted water electrolysis (LAWE), such as temperature and lignin concentration. An anion-exchange membrane H-type electrolysis cell was built to compare the LAWE with conventional alkaline water electrolysis. Adding lignin was shown to inhibit the oxygen evolution reaction. Moreover, by replacing the latter reaction with the oxidation of lignin, the H-type electrolytic cell could produce hydrogen at a lower cell voltage. Additionally, hydrogen production could be effectively increased by increasing the temperature and lignin concentration. However, the temperature increase also had negative effects, leading to the deactivation of the Ti/PbO
2 electrode [
22].
This work presented a model for BL electrolysis in the Aspen Custom Modeler suite, which was afterward integrated into the Aspen Plus® process simulator. This model considers several aspects of BL electrolysis, including polarization curves obtained experimentally from industrial BL samples provided by a Portuguese pulp mill and then modeled. To the best of the authors’ knowledge, there are no other works where the modeling of BL electrolysis for hydrogen production is reported.
3. Results and Discussion
3.1. Electrochemical Studies
BL samples were physicochemically characterized, and the determined parameters are shown in
Table 1.
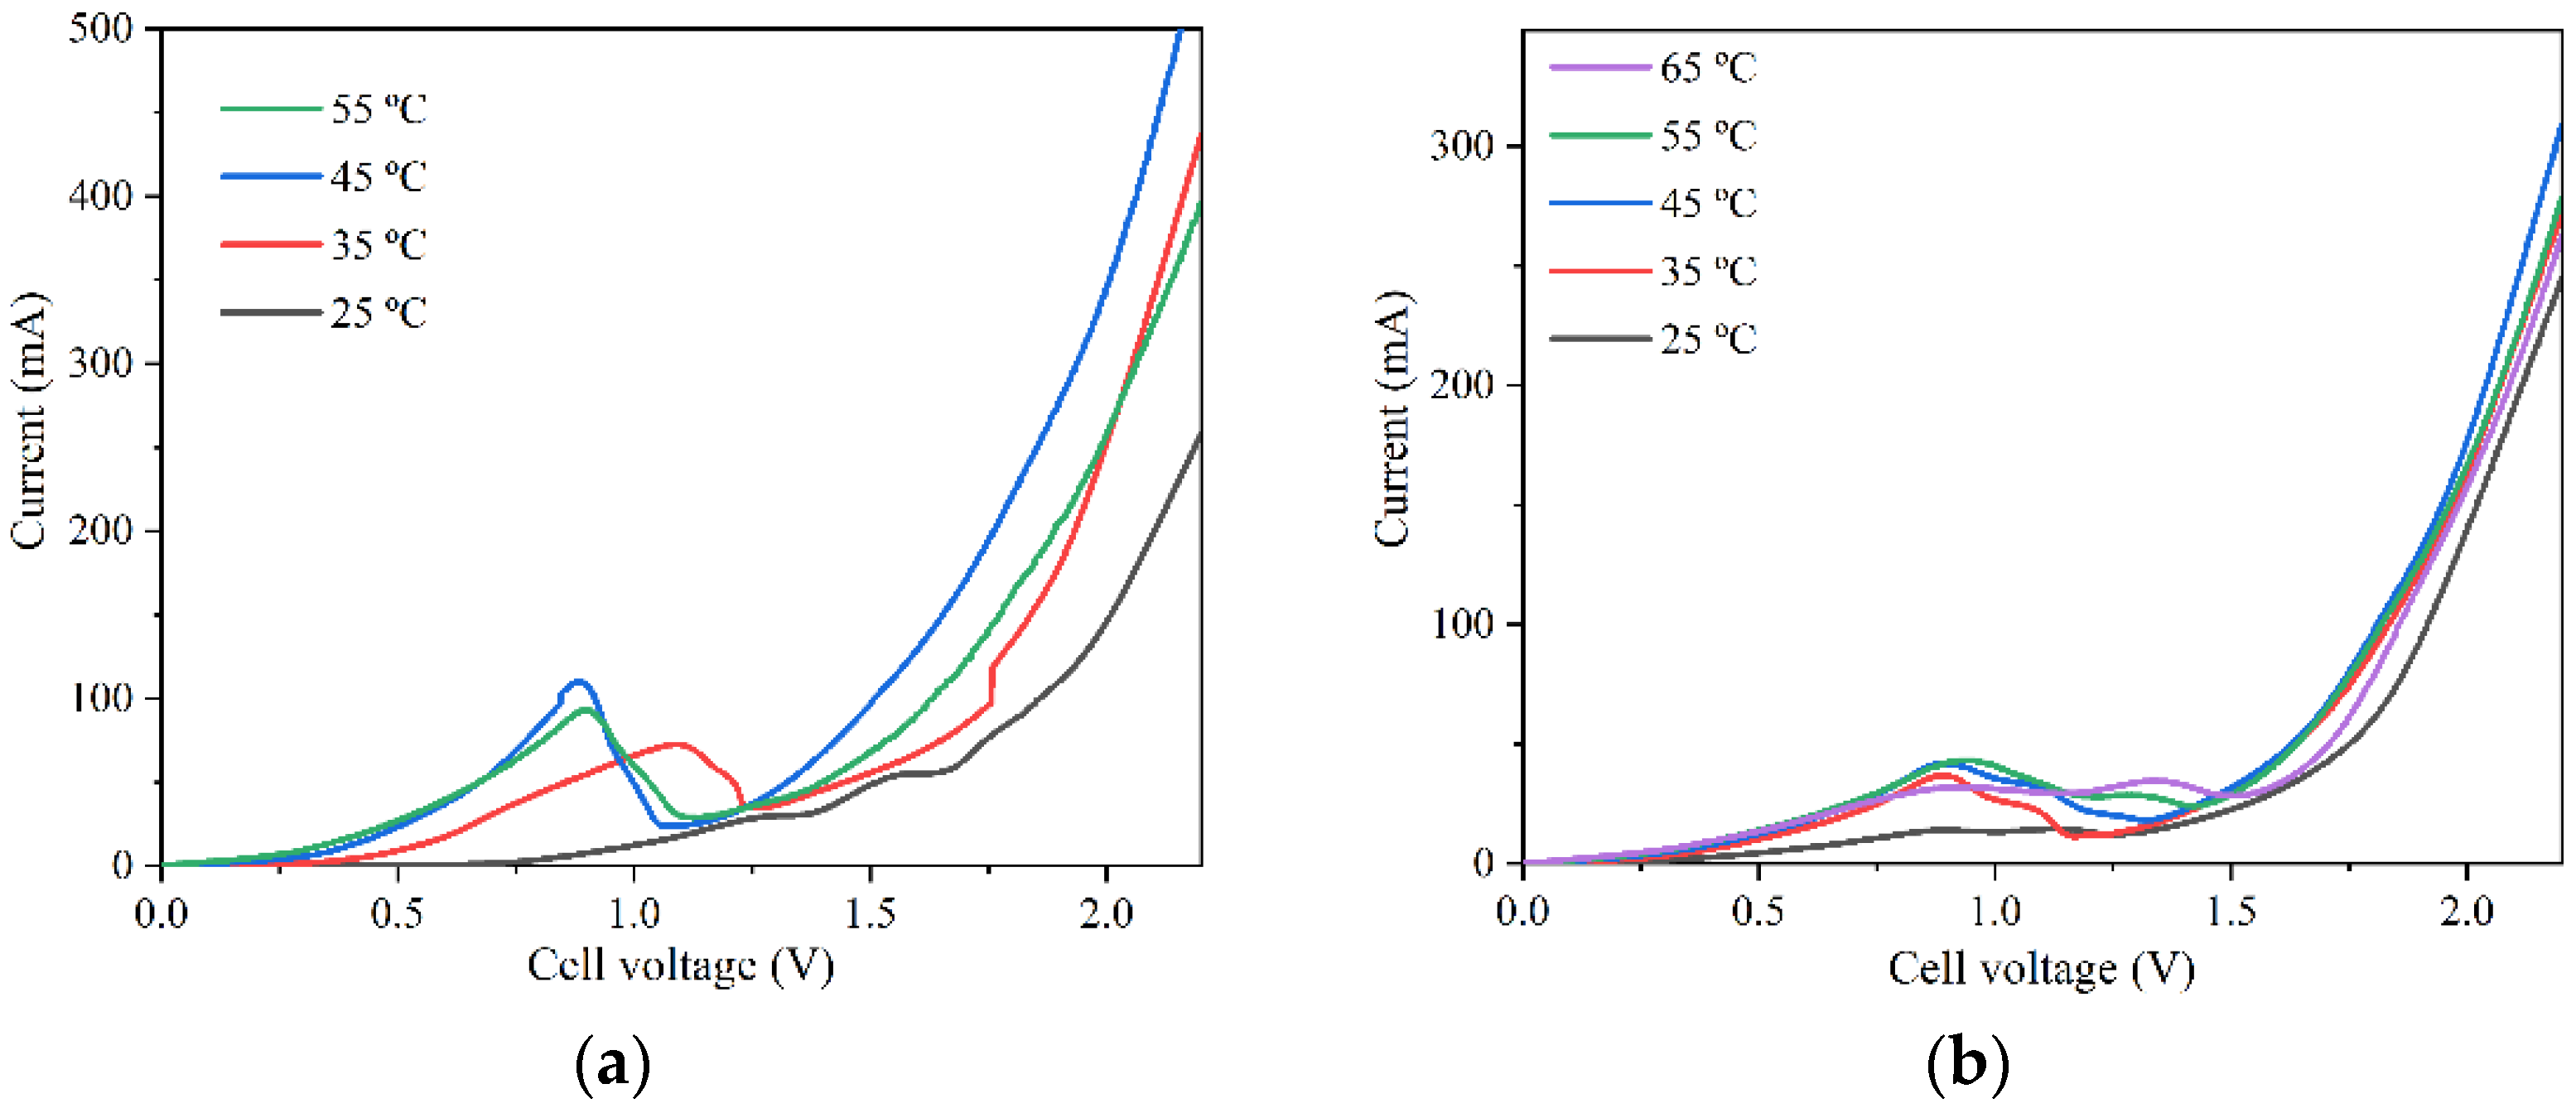
Then, LSV was used to obtain the cell polarization curves related to BL electrolysis. Two approaches were considered to simulate batch (
Figure 2a) and continuous (
Figure 2b) BL electrolyzer operation. In the first case, the polarization curves were run with nickel electrodes that had been previously cleaned, simulating batch operation. To simulate continuous operation (where an automatic scraper would be required), the nickel electrodes started the experiment with a thin lignin layer, thus presenting a lower available surface area.
The polarization curves showed that up to 45 °C, the current increases because the reaction rate increases for higher temperatures. However, after 45 °C, the activity was too high, suggesting significant lignin is deposited in the anode, decreasing the available surface area and reducing the recorded currents.
Overall,
Figure 2a shows significantly higher currents compared with the data shown in
Figure 2b. This happens because the initial presence of lignin in the electrodes used in the continuous simulation (
Figure 2b) led to a lower available surface area, in opposition to the cleaner electrodes used to obtain the data shown in
Figure 2a. In continuous BL electrolyzer operation, there is constant removal of lignin, although total removal is impossible, and a thin layer of lignin remains on the anode surface. Therefore, the results from
Figure 2b were used to simulate the continuous BL electrolyzer containing a lignin surface layer at the beginning of each experiment/temperature. The results shown in
Figure 2a, at 25 °C and 35 °C, were used to simulate the batch electrolyzer. At 25 °C, the experiment started with clean electrodes, and at 35 °C the deposited lignin was negligible. During batch operation, the current will change over time. However, for simulating the batch process, the electrolyzer is considered to work with a current value, which is the weighted current average throughout the entire study.
3.2. BL Electrolysis Simulation
The mathematical description of the model follows Equations (10)–(12), as described in
Section 2.3. These equations were used in the Aspen Custom Modeler software to create the mass, charge, and energy balances to be subsequently included in the Aspen Plus
® suite.
To obtain the simulated polarization curve, Equation (10) was adjusted to the experimental data between 1.5 V and 2.0 V from
Figure 2a,b. A value of 1.5 V for V
rev of BL electrolysis was considered [
26]. Below 1.5 V, there is no significant formation of products, and above 2.0 V, Ni anode corrosion may occur. After mathematical treatment, the coefficients (c.f. Equation (10)) obtained for batch and continuous operation are shown in
Table 2.
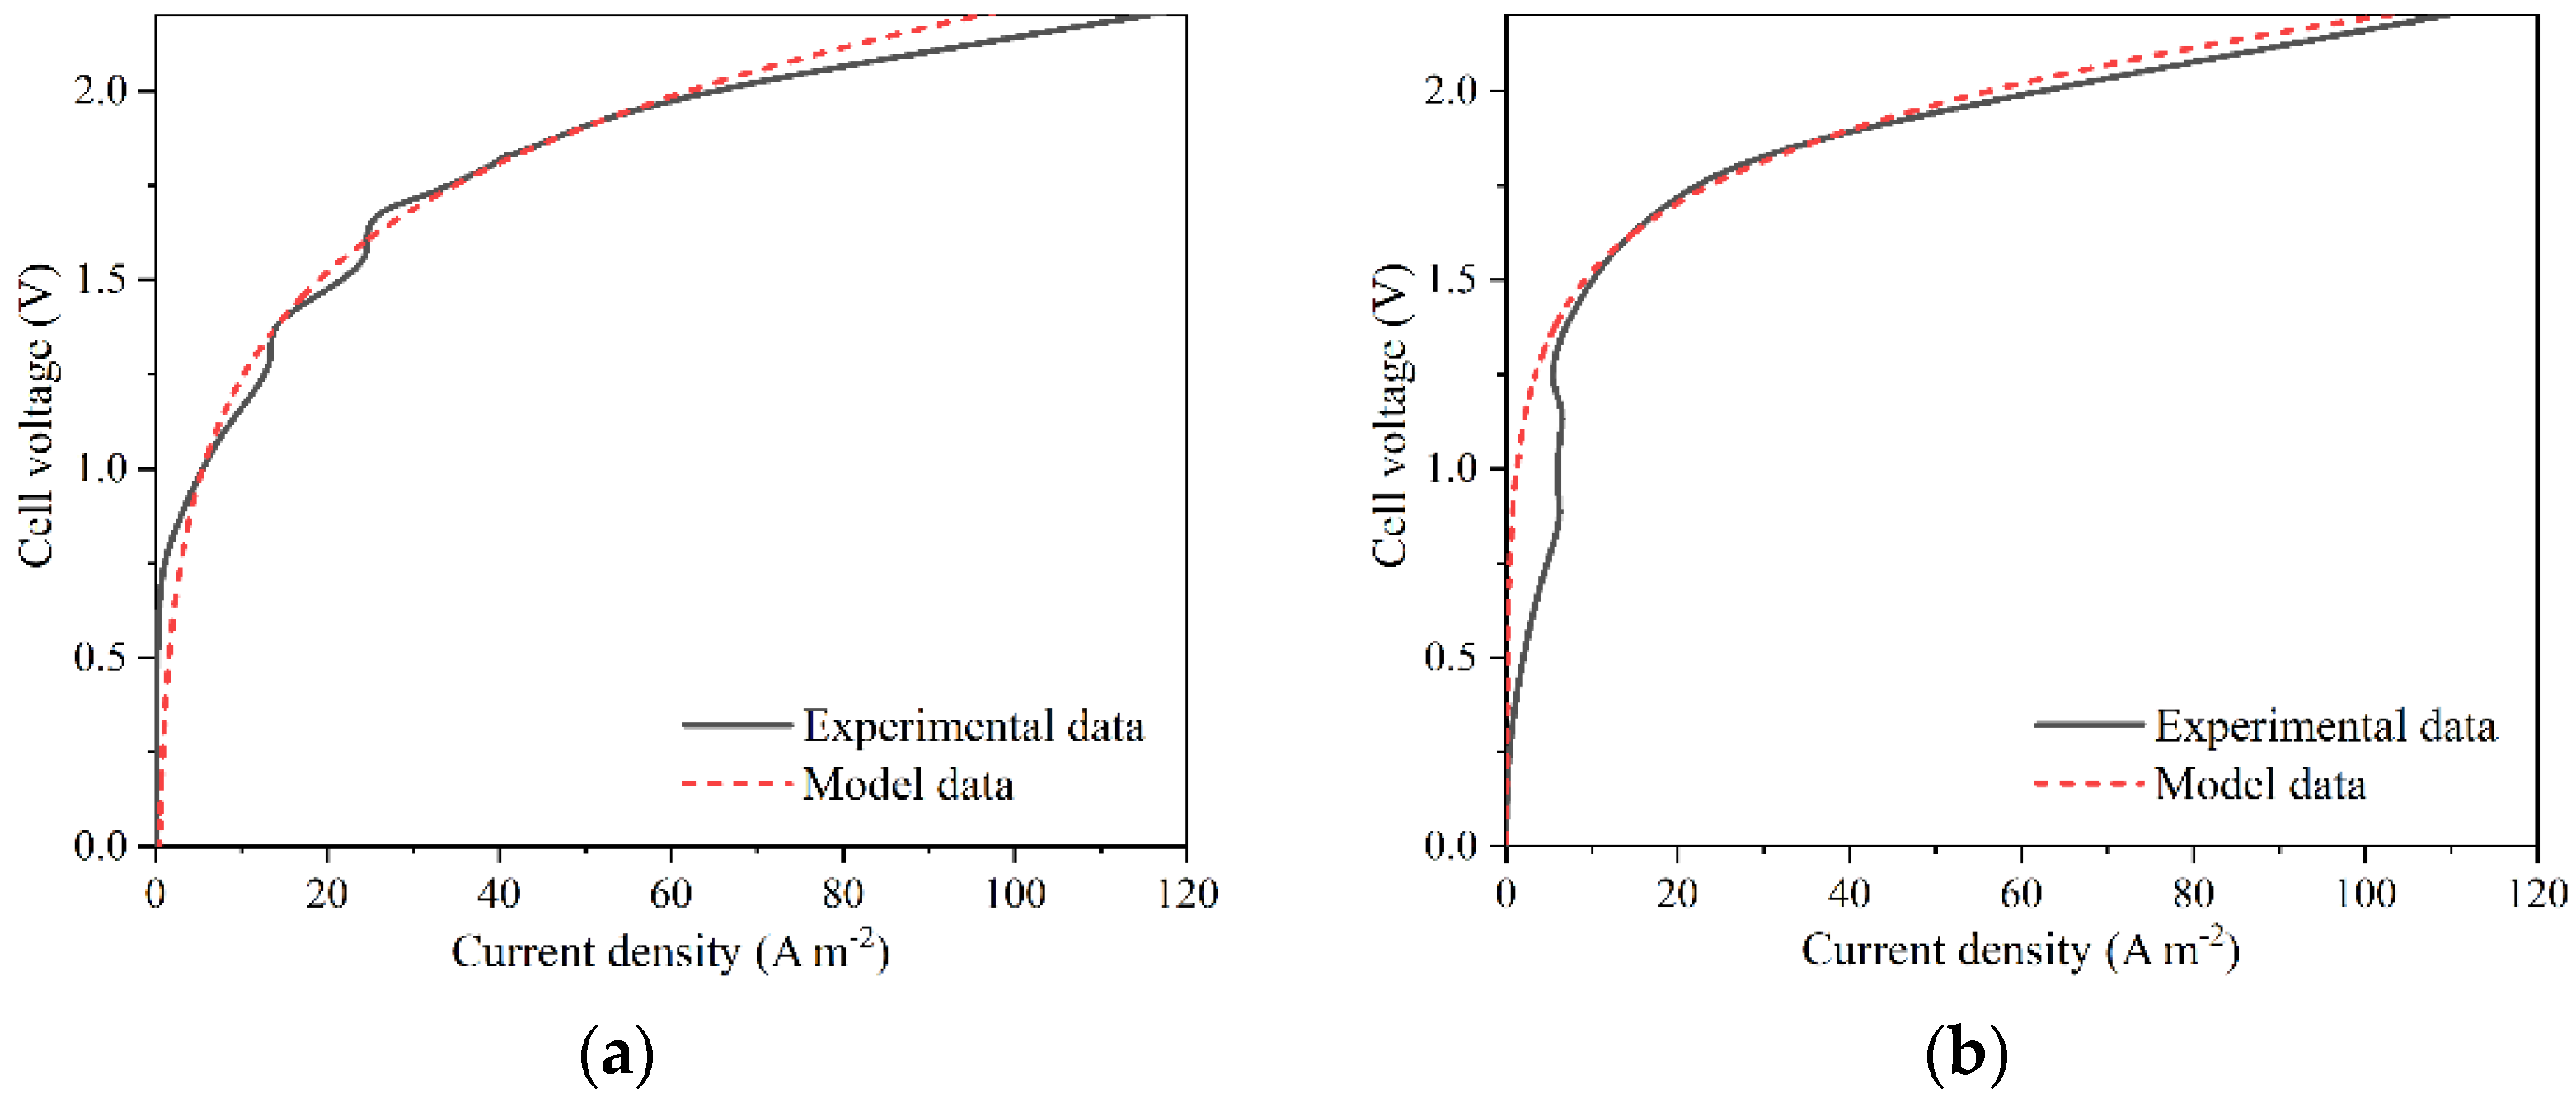
Figure 3a,b compare the model and the experimental data recorded at 25 °C for batch and continuous operation, respectively.
Figure 3 shows a good fitting between 1.5 V and 2.0 V. Above 2.0 V, an adequate fitting is also observed. However, there is a discrepancy for values below 1.5 V, meaning the model cannot be extrapolated for lower voltages. Similar model data for higher temperatures yielded similar results, which can be found in the
Supplementary Information (Figures S1 and S2). The value of R
2 for the batch model is 0.932, showing a good correlation between the model and the experimental data. For the continuous simulation, R
2 had a value of 0.662. This low value of R
2 is related to the discrepancy below 1.5 V. However, only values above 1.5 V were considered for the electrolyzer operation, where the R
2 was 0.995 and 0.989 for the batch and continuous models, respectively, which in turn validates the model for the selected potential range.
Before simulating in Aspen Plus
® it is necessary to extract information from the calculated mass balance. The mass balance was obtained in batch operation, and the average current density was estimated to be 13.6 mA cm
−2 (0.305 A). It was also possible to obtain a value of 87% for the Faraday efficiency and the stoichiometric factors between reagents and products (
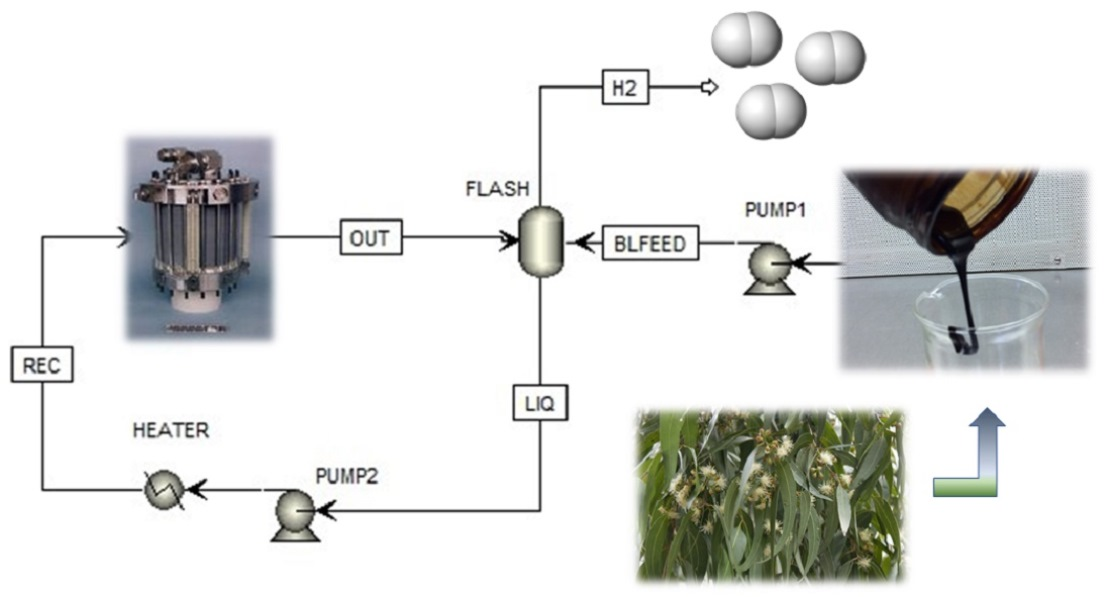
Table S3). The simulated system is represented in
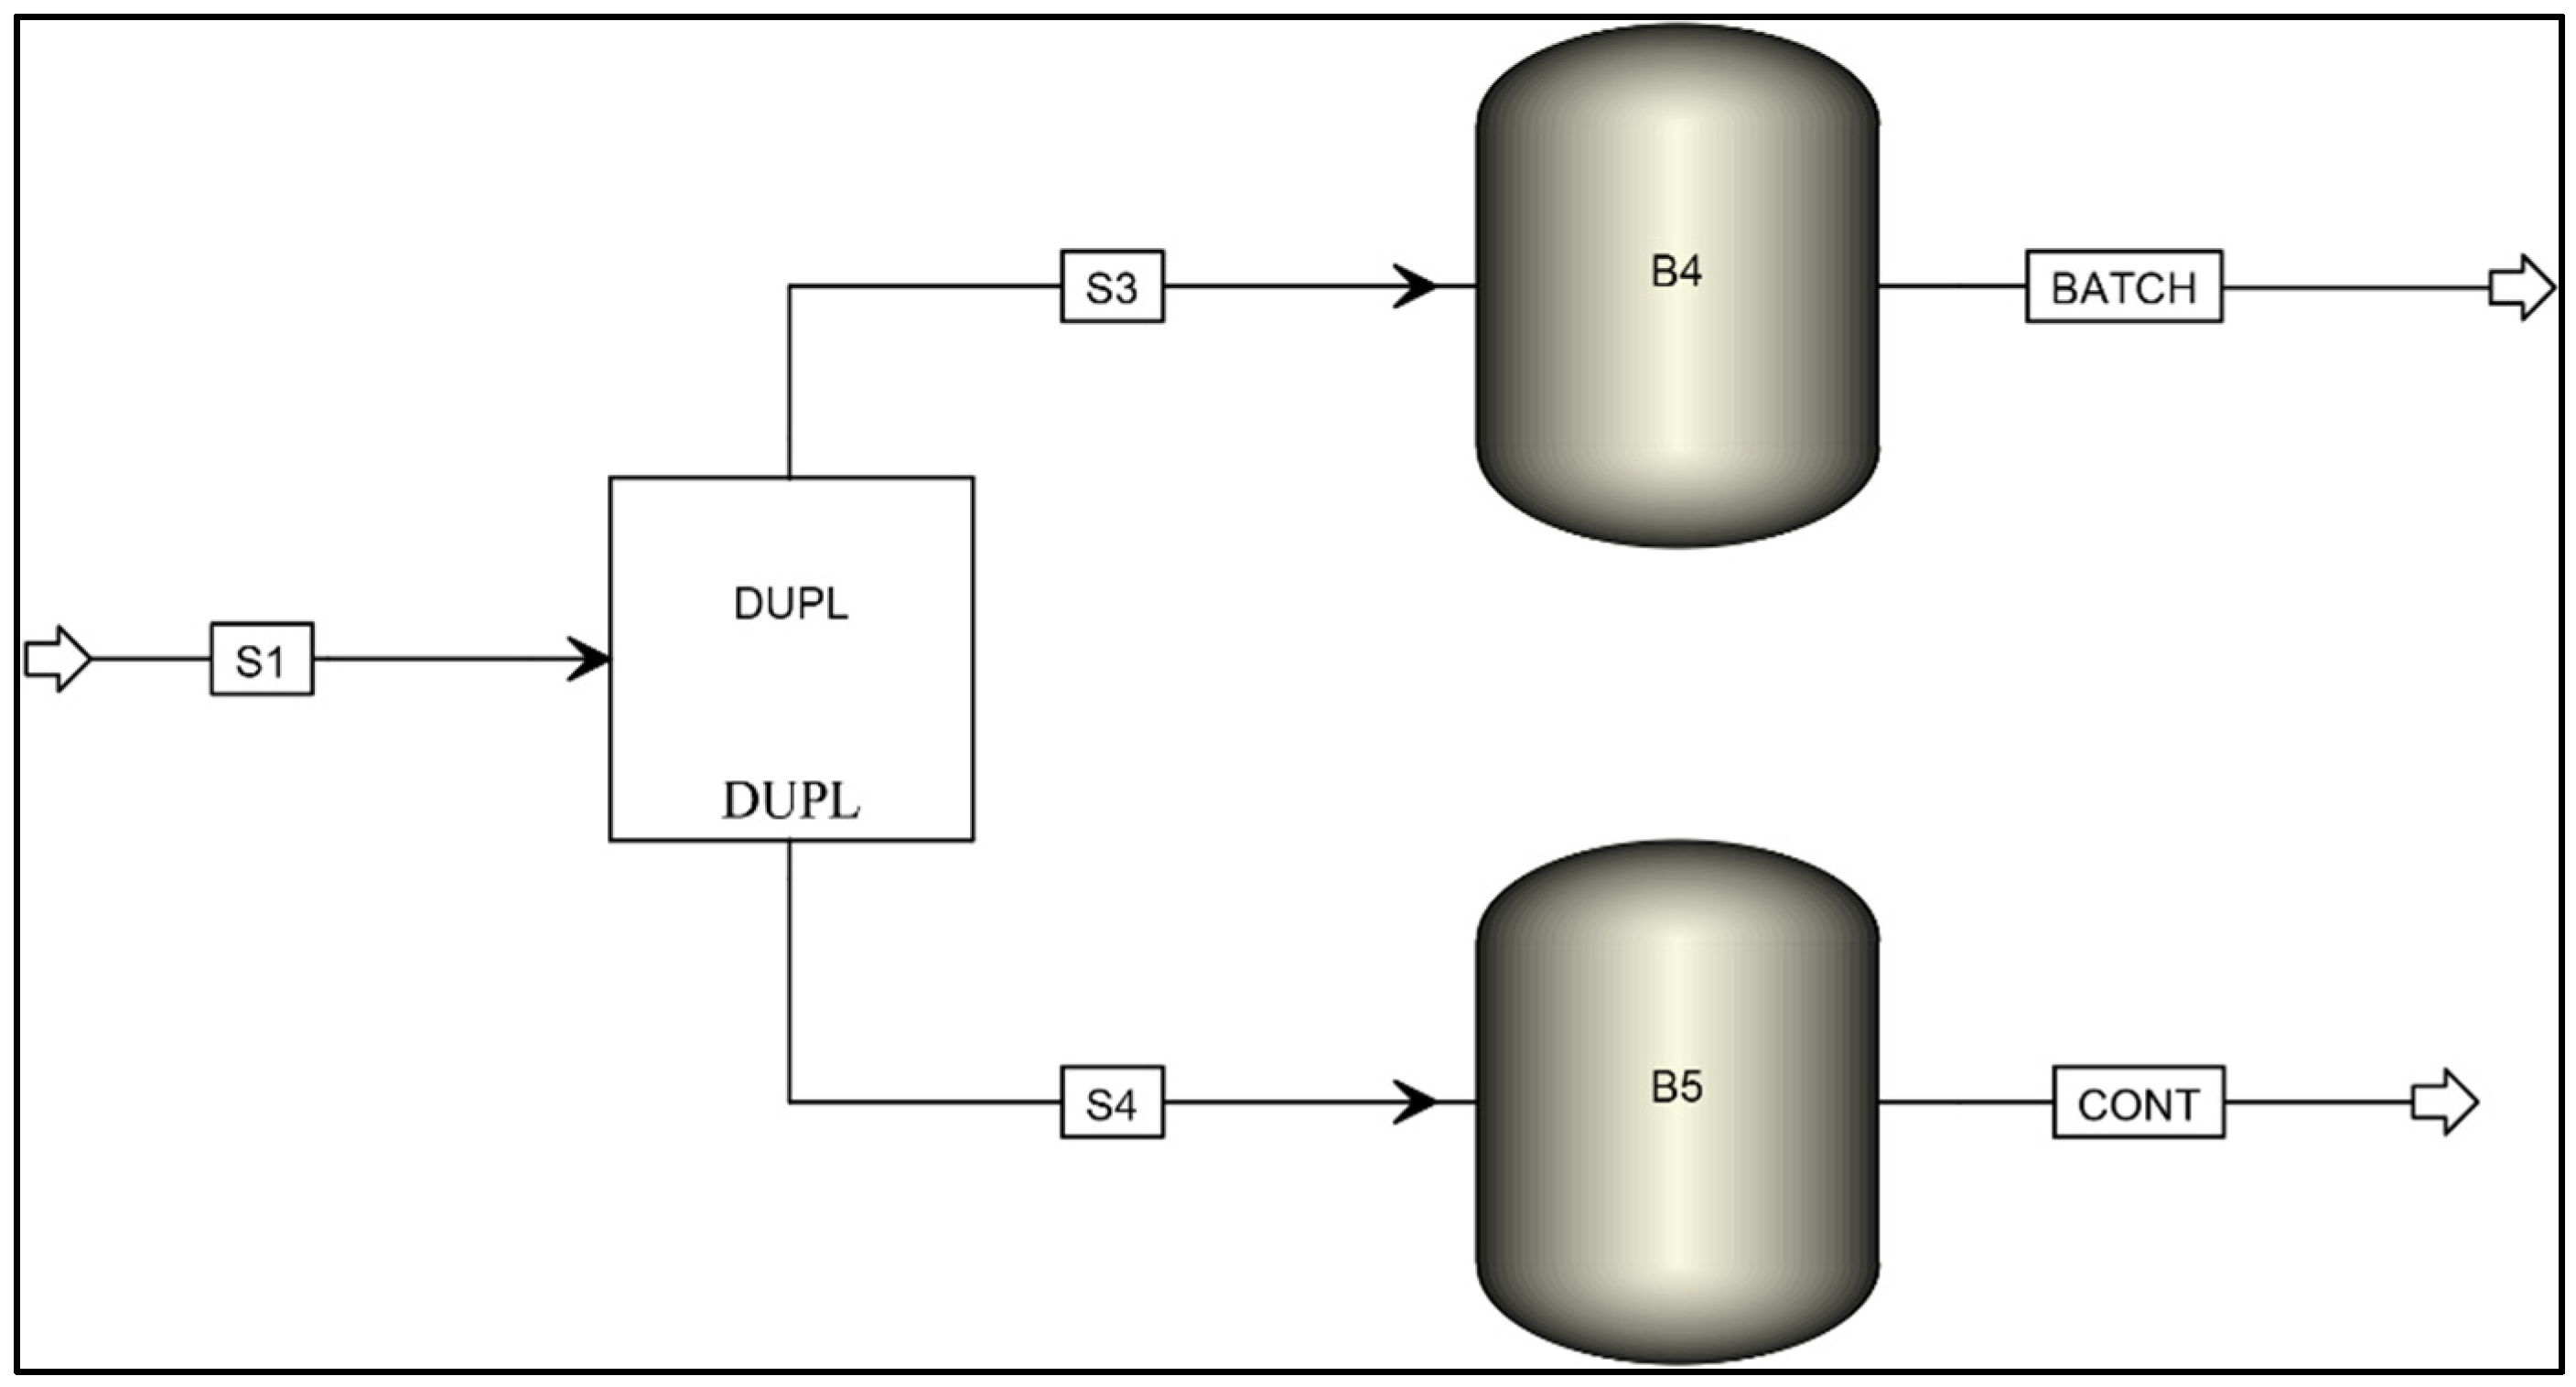
Figure 4. The system allows for the simulation of batch and continuous operations simultaneously.
The model described in
Figure 4 is composed of several material streams (S1, S3, S4, BATCH, and CONT) and three different operation blocks (DUPL, B4, and B5). The properties of the BL sample were defined according to the data present in
Table S1 (in Supplementary Information), with the simplifications described in
Section 2.3. The BL sample was fed to the system via material stream S1 and then admitted into the block DUPL, which duplicates the inlet stream into two identical outlet streams. Each stream was then fed into block B4 or B5, representing the exported Aspen Custom Modeler model containing the equations needed to calculate the electrolysis products. The resulting products were then transported by material streams BATCH for the batch process model and CONT, for the continuous process model. Additional operation blocks can be included in further modeling using readily available tools from Aspen Plus
®.
The simulation led to a negligible deviation in the mass balance and a 60% deviation in the charge balance. Significant deviations in the charge balance were already expected due to the necessary assumptions made regarding the components.
Table S2 compares the molar flow of anions and cations, showing a deviation of 60.2%, equal to the value obtained by Aspen Plus
® (60%).
The results from Aspen Plus
® were compared to those of the experimentally obtained mass balance to validate the model. The specifications of the electrolysis cell were N = 1, A
cell = 22.4 cm
2, and T = 25 °C. The absolute values are presented in
Table 3 and the respective deviations in
Table 4.
Table 3 and
Table 4 reveal that the most significant differences between the experimental data and model predictions were in the electric power (W
stack) and cell voltage (V
cell), with differences of 21% for the batch model and 23% for the continuous model. This deviation occurred due to the validation range of the model. The experimental run used to compare the results considered a V
cell of 3.0 V, which resulted in significant corrosion. This corrosion can result in a change in the cell area A
cell, significantly altering the results. The model does not consider cell corrosion, and W
stack and V
cell parameters were tuned to obtain a similar production of H
2, which results in the deviations presented in
Table 4.
Additionally, the ideal interelectrode distance was assumed to be 2 cm. For higher distances, the current drops due to the increase of resistance to ionic transportation, and for lower distances, it can induce electric sparks, posing an explosion hazard [
7]. While a reasonable assumption, any possible deviation from this value can also help explain the observed differences.
Further developments to the model may be performed to mitigate this difference, such as accounting for anode corrosion at high voltages. The advantage of tuning the cell voltage and electric power to obtain similar H2 production through the models offers the advantage of retaining model accuracy from a production point of view while simultaneously providing a framework to identify the parameters that affect the relevant outputs, which can be studied and refined in future works.
It is also possible to conclude that observed batch operation deviations are lower than those observed in continuous operation. This was expected because the experimental data used to develop the model were obtained from batch experimental runs.
3.3. Batch Operation vs. Continuous Operation
One of the objectives of this work involved understanding the differences between batch and continuous operations. Current BL electrolysis studies are typically performed in batch operation, meaning that electrolysis occurs during a set amount of time, and afterward the equipment is opened for cleaning and maintenance. Conversely, the advantages of continuous operation are evident, as the electrolyzer operates continuously with no need for intervention, thus minimizing stoppages and maximizing hydrogen production, cost savings, and potential earnings. However, the main challenge for continuous operation is the lignin deposition at the anode, which deteriorates electrolyzer performance and forces the operators to stop the equipment for cleaning. As such, it is imperative to optimize the cell design by incorporating continuous removal of the deposited lignin and, to do that, it is important to develop mathematical models to study this behavior.
Table 3,
Table 4 and
Table 5 show that the batch and continuous operation results are similar. This happens because the polarization curves at 25 °C are practically identical. However, operating temperature is expected to significantly affect results due to its influence on several key parameters. With the temperature increase, the deviation of mass balance between batch and continuous operations will be insignificant because the simulation will be made to adjust the n
H2. Still, the deviations in W
stack and V
cell will be higher. Due to the significant increase in resistance caused by the deposited lignin, these parameters will increase in continuous operation.
3.4. Sensitivity Analysis
To understand the system’s behavior, a sensitivity analysis was performed to study the influence of N, A
cell, Faraday efficiency, T, and W
stack on the output parameters of the model. The sensitivity analysis results for continuous operation are shown in the
Supplementary Information. The conclusions for batch operation are otherwise generally the same as those observed for continuous operation, with the relevant differences pointed out in this section.
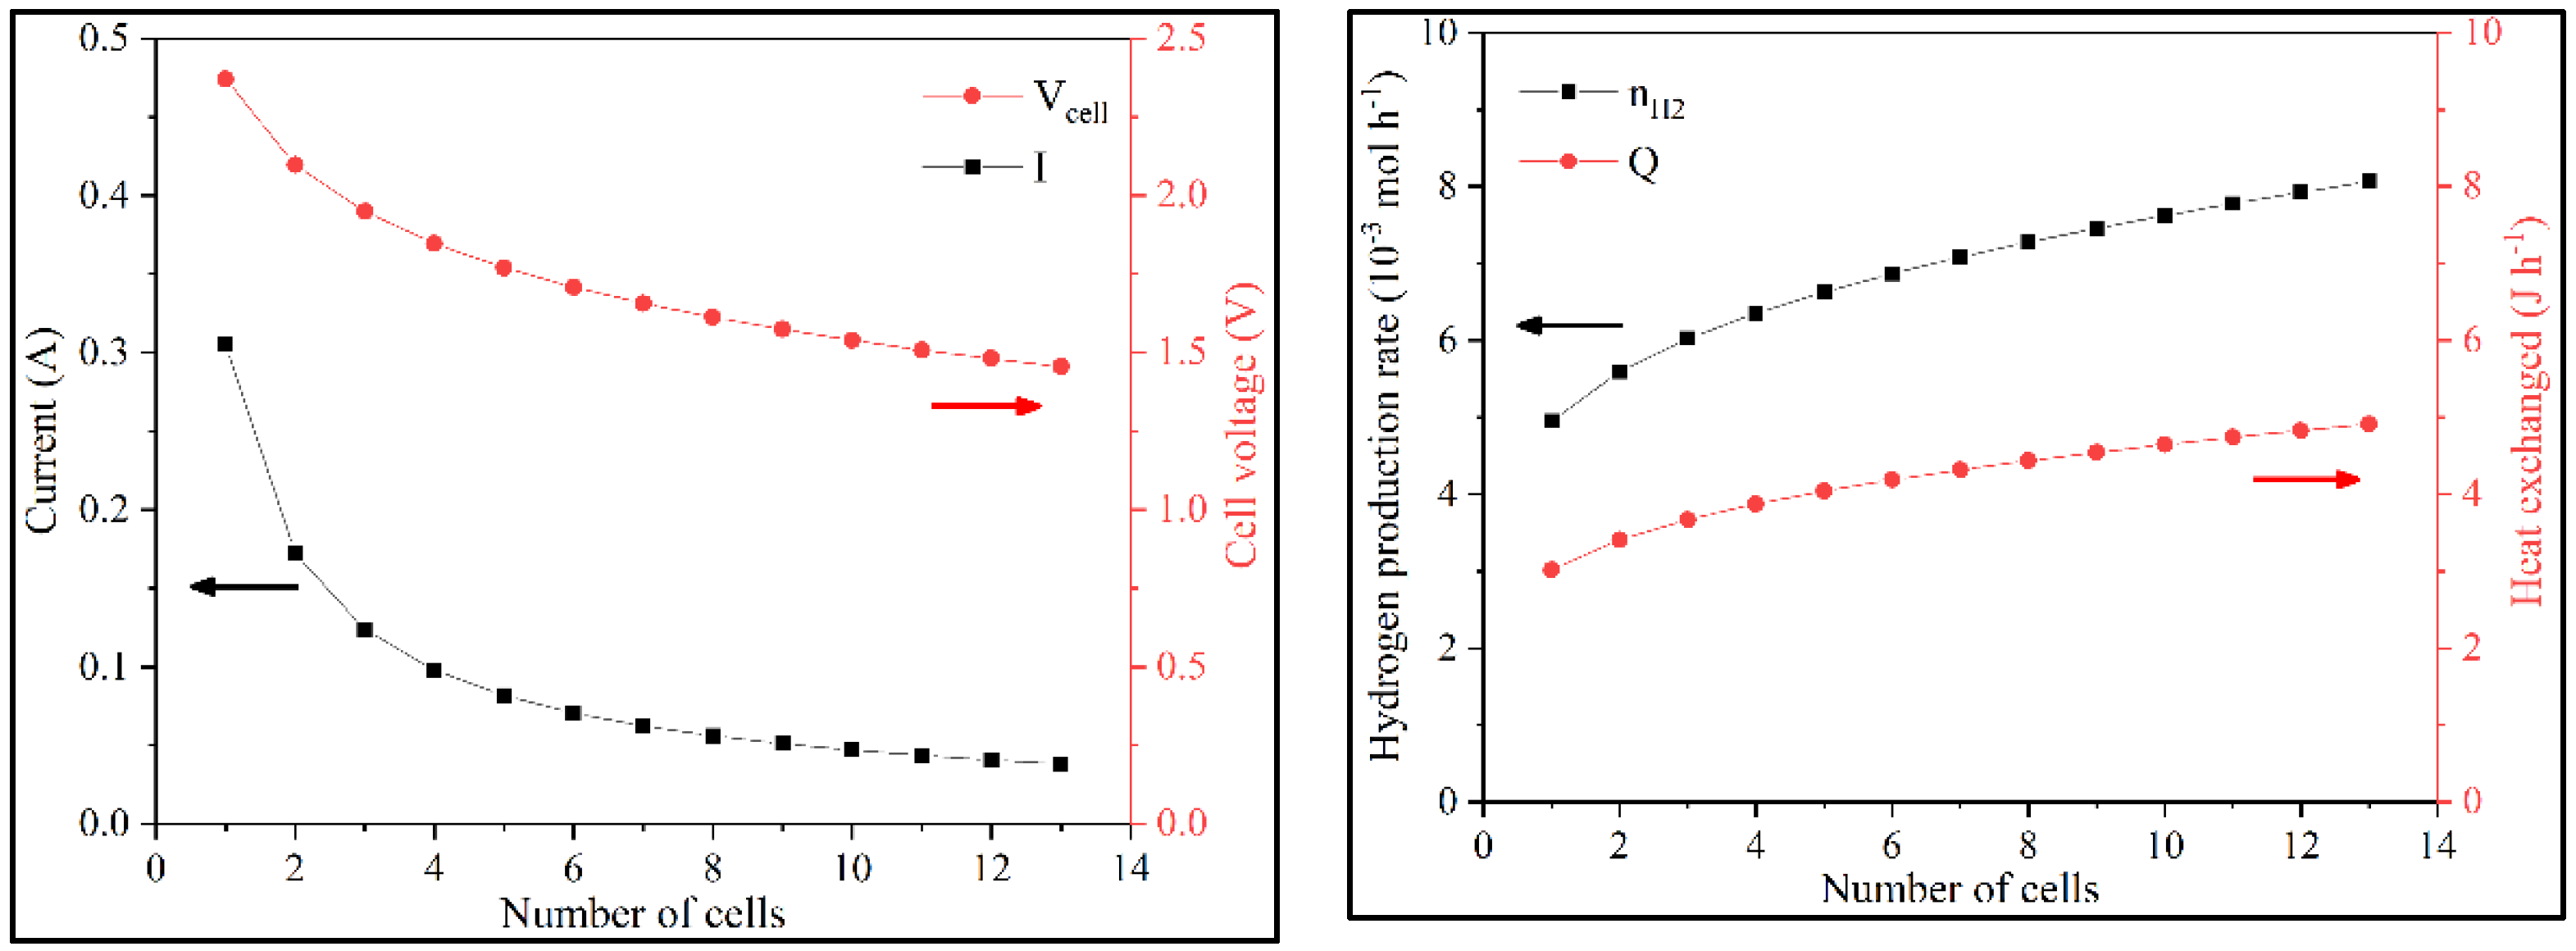
Firstly, a sensitivity analysis of the number of cells in the stack and its effect on current and hydrogen production was performed. The increase of N led to a decrease in i and V
cell. This happens because W
stack was constant, and with increasing N, the same power is be distributed by more cells, lowering V
cell. As A
cell was also constant, the current decreased, as observed in the polarization curve. Although V
cell decreased, V
stack increased because W
stack was constant and the current decreased. N also influenced the hydrogen production and total system heat (n
H2 and Q
T). With the increase of N, n
H2 increased because there were more cells to produce hydrogen. Consequently, the total heat flow (Q
T) needed to supply to the cell to maintain it at the desired temperature increased (
Figure 5 and
Figure S3).
A second sensitivity analysis focused on the effect of varying the active cell area. With the increase of A
cell, i increases and V
cell decreased. A higher active cell area provides additional available reaction sites and, consequently, more collisions between the reagent molecules and the electrodes, increasing the electron flux (i). As W
stack and N were constant and i increased, the cell presented a lower voltage. With the increase in current, hydrogen production increased, and therefore, the system heat also increased (
Figure 6 and
Figure S4).
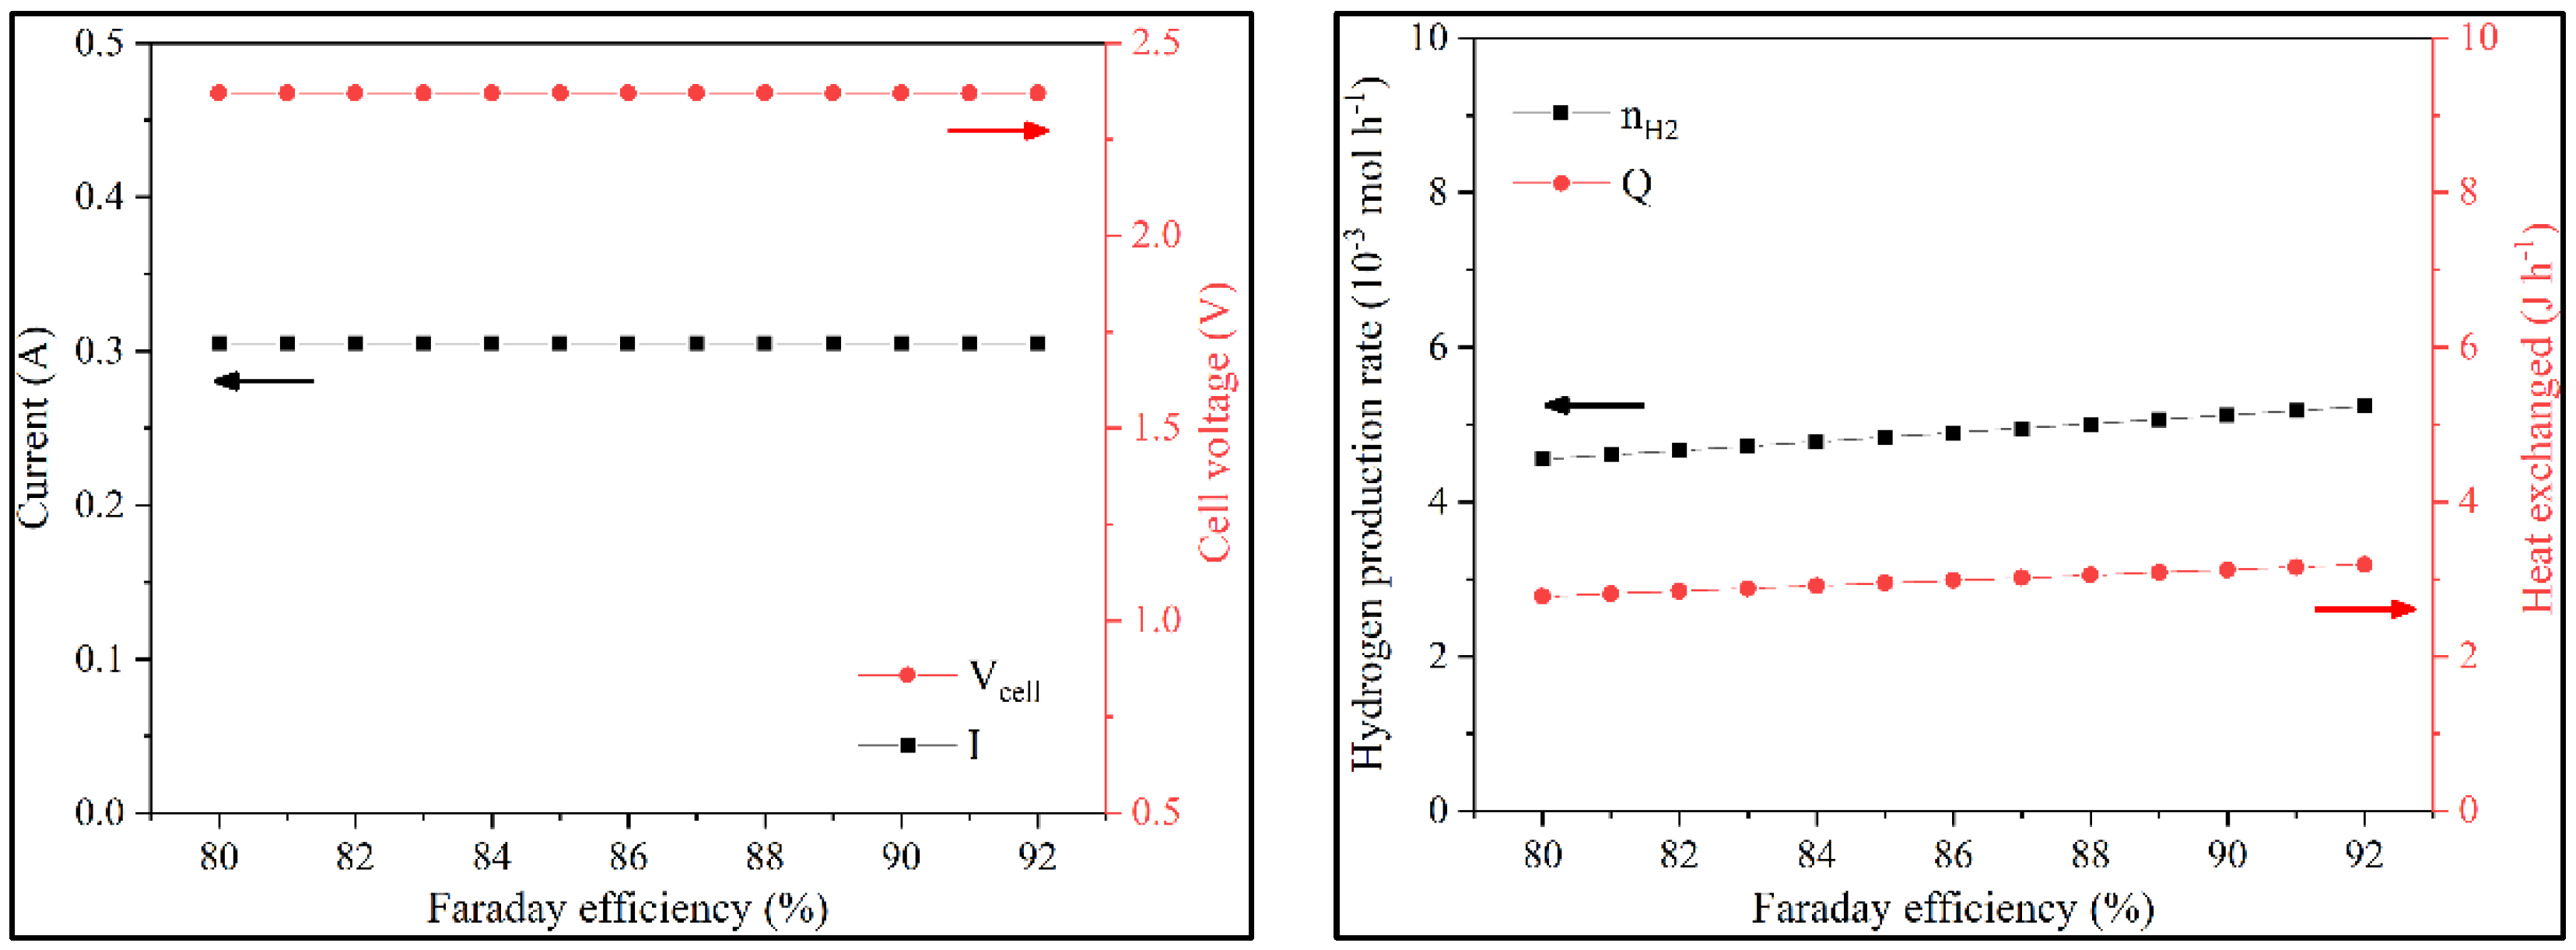
A sensitivity analysis on Faraday efficiency revealed the sole impact to be observed on the values of n
H2 and Q
T. Increasing Faraday efficiency would increase hydrogen production and total system heat (
Figure 7 and
Figure S5).
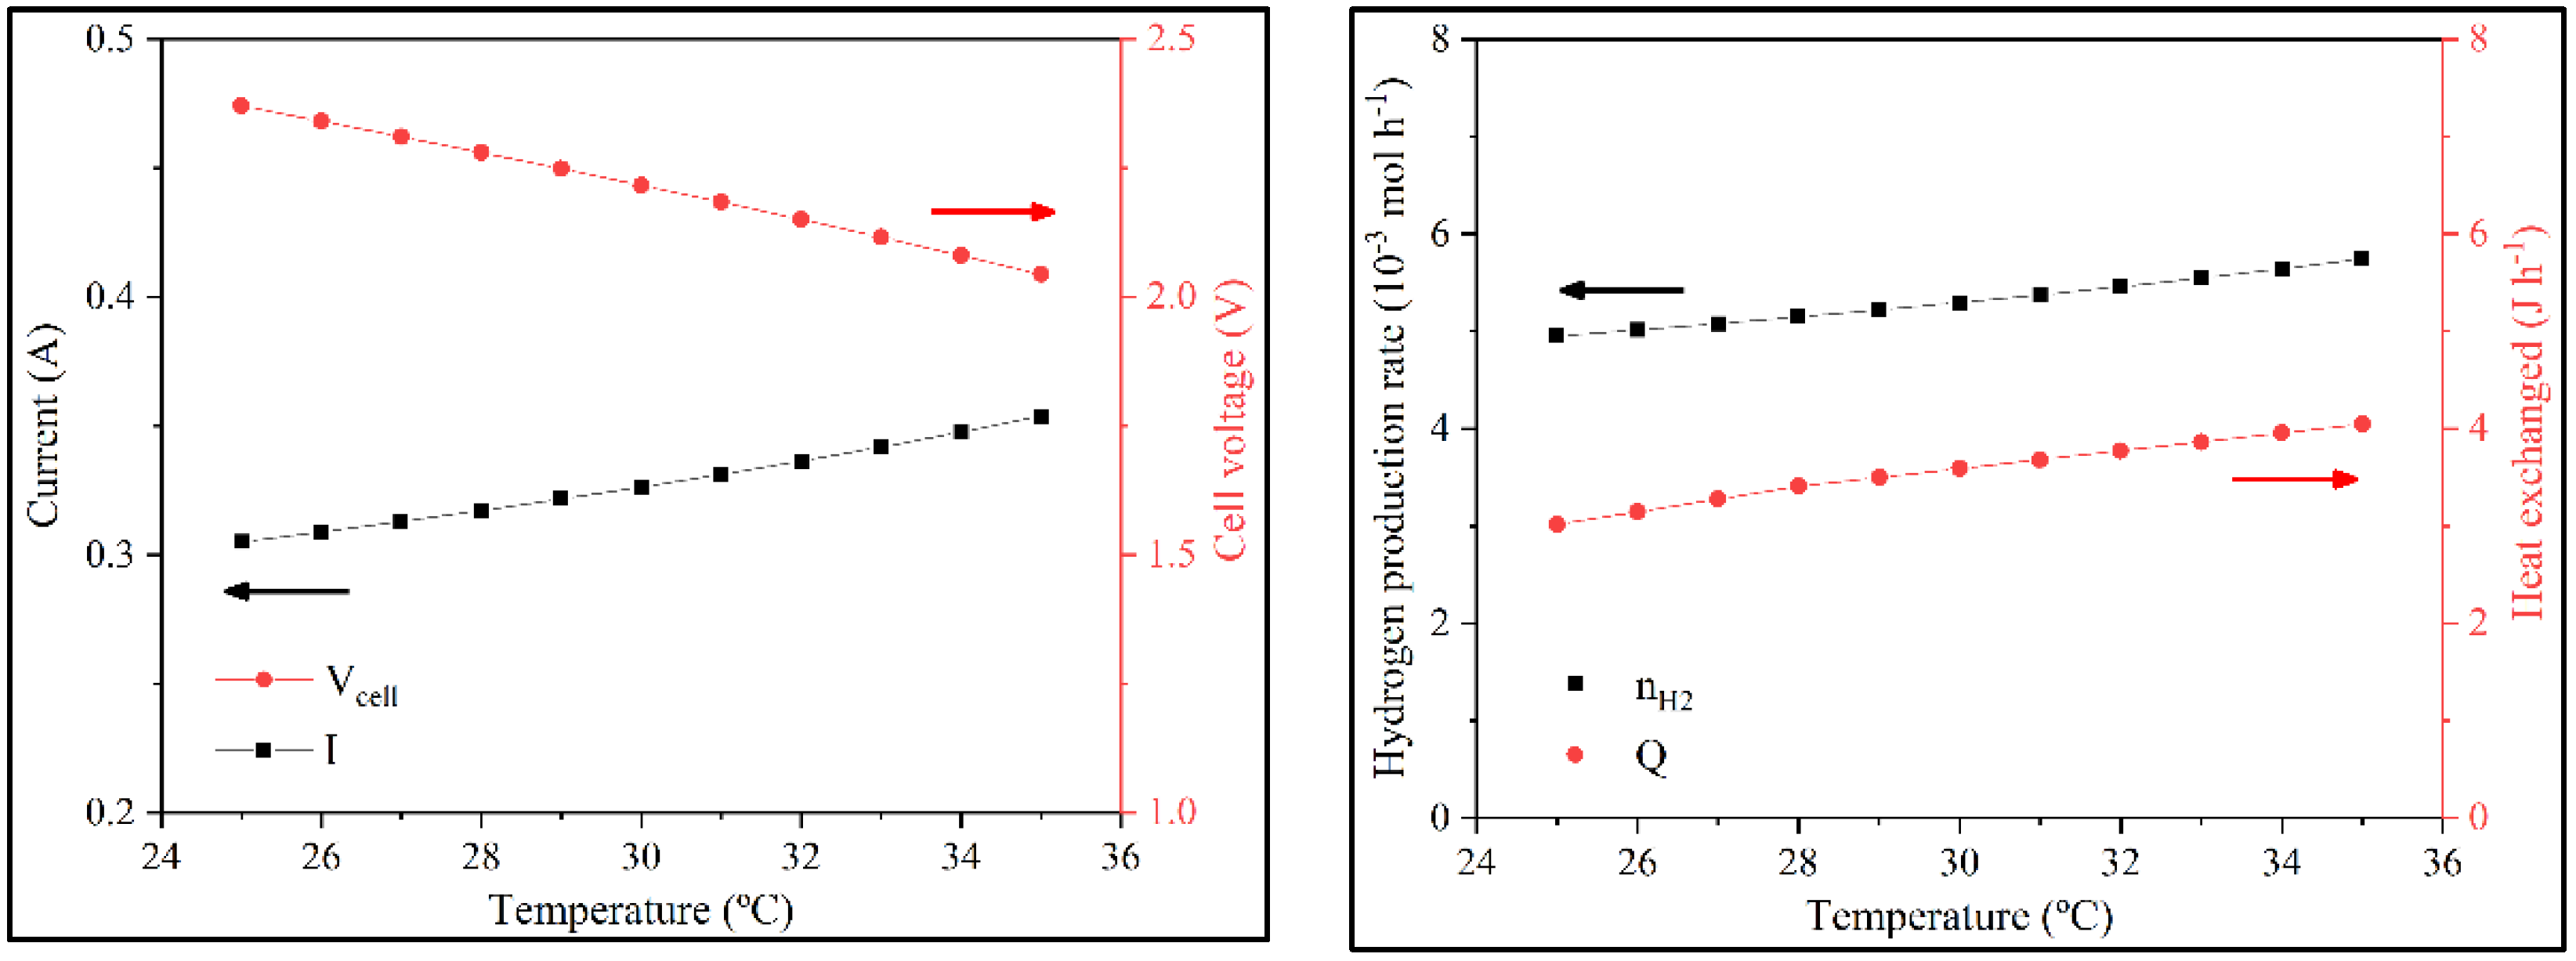
For the batch operation, the temperature was studied between 25 °C and 35 °C, and for continuous operation between 25 °C and 65 °C. In batch operation, with higher temperature, there was more activity and the current increased because W
stack and N were constant and V
cell decreased. With the rise of current, n
H2 would increase. Q
T increased as well, not just because of the flow increase but also because of the temperature increase (
Figure 8).
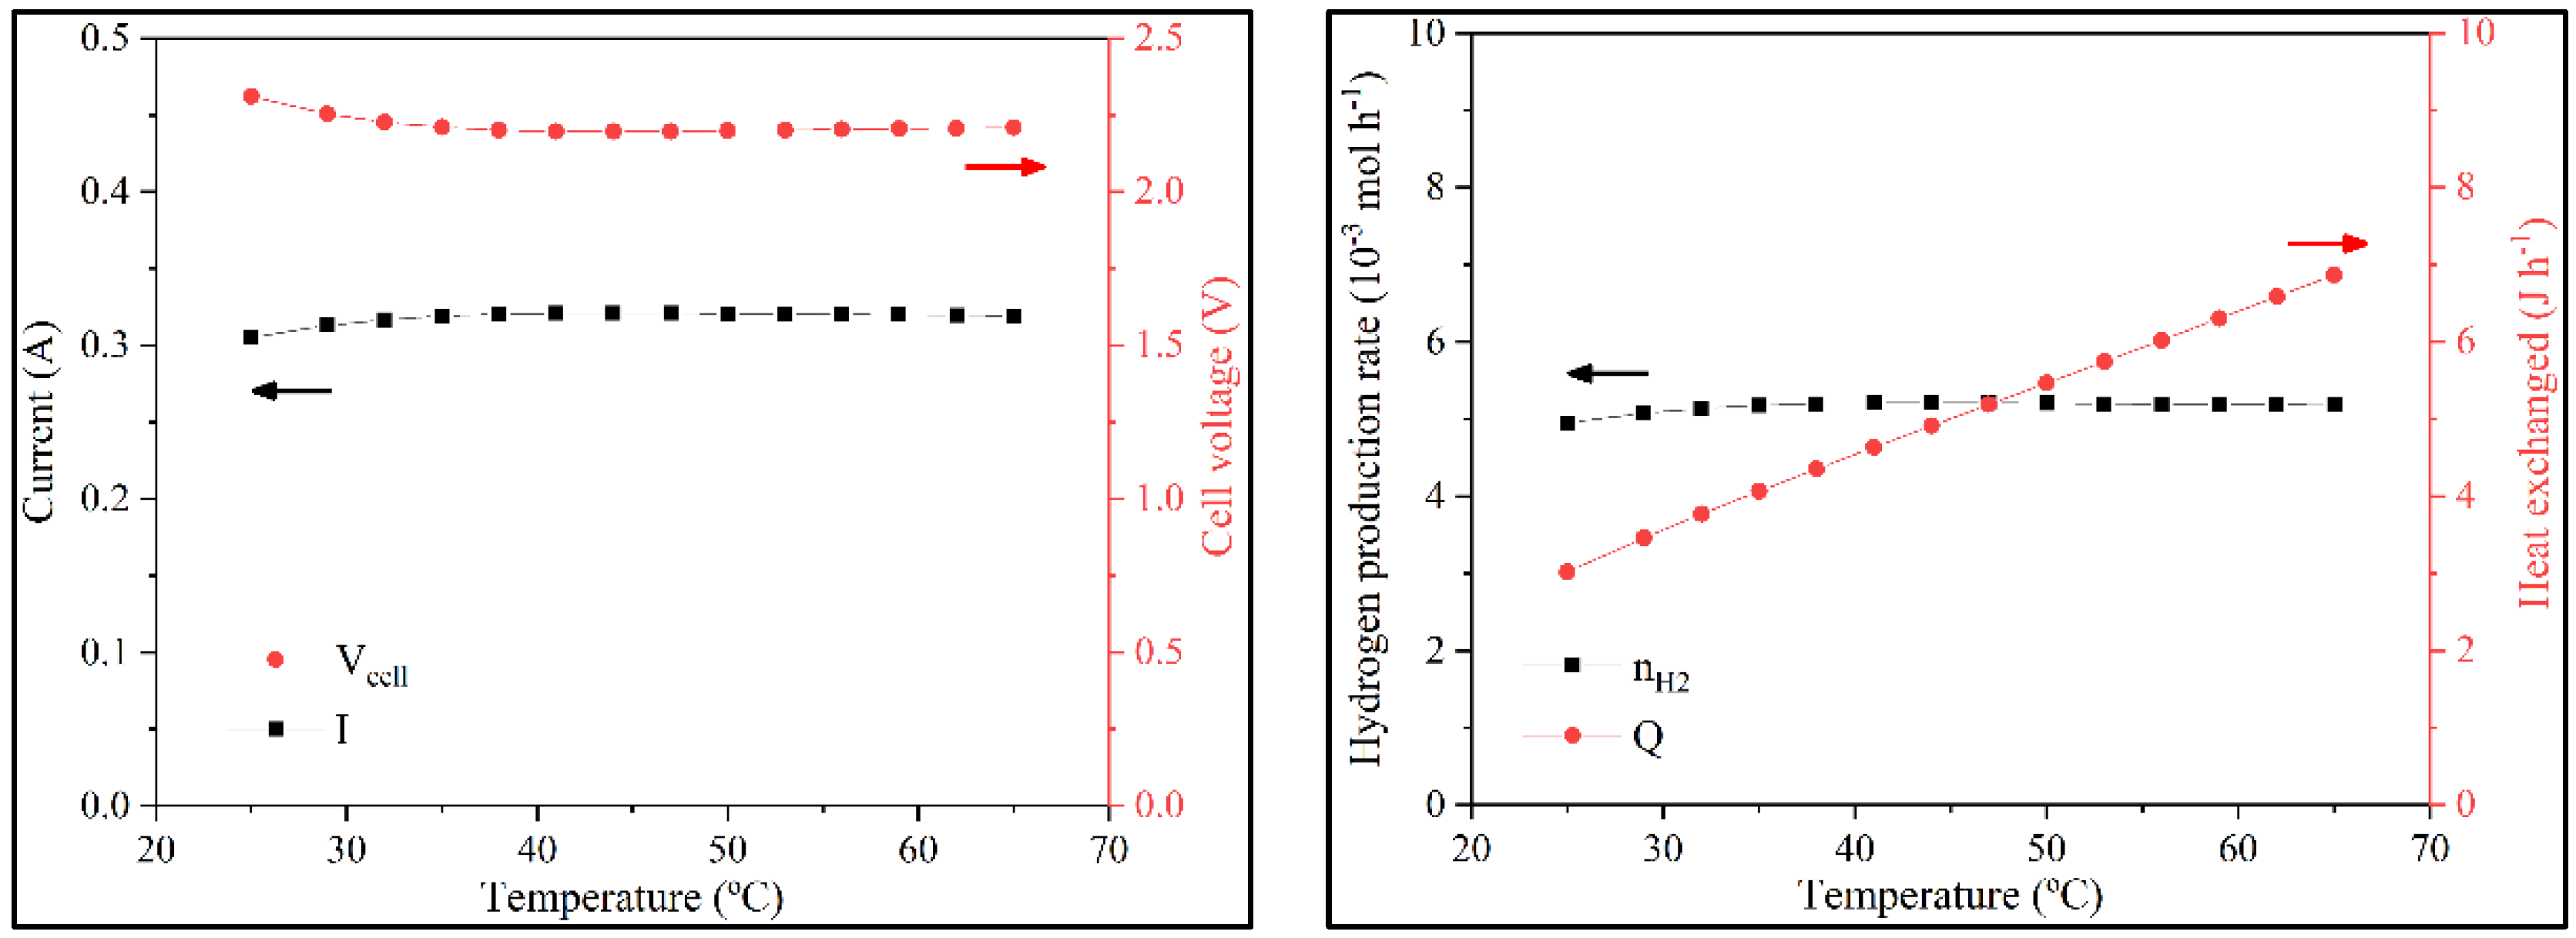
The following sensitivity analysis focused on the effect of temperature on system variables. In continuous operation until 45 °C, the behavior was identical to batch operation. Above 45 °C, the current and V
cell hit a plateau. This happens because of two opposing effects. On the one hand, the activity increased, leading to a higher reaction rate. However, this higher rate led to a significant amount of lignin depositing on the anode, thus decreasing the available area and the electron flux, which eventually balanced out. n
H2 also did not change; Q
T increased because the working temperature increased (
Figure 9).
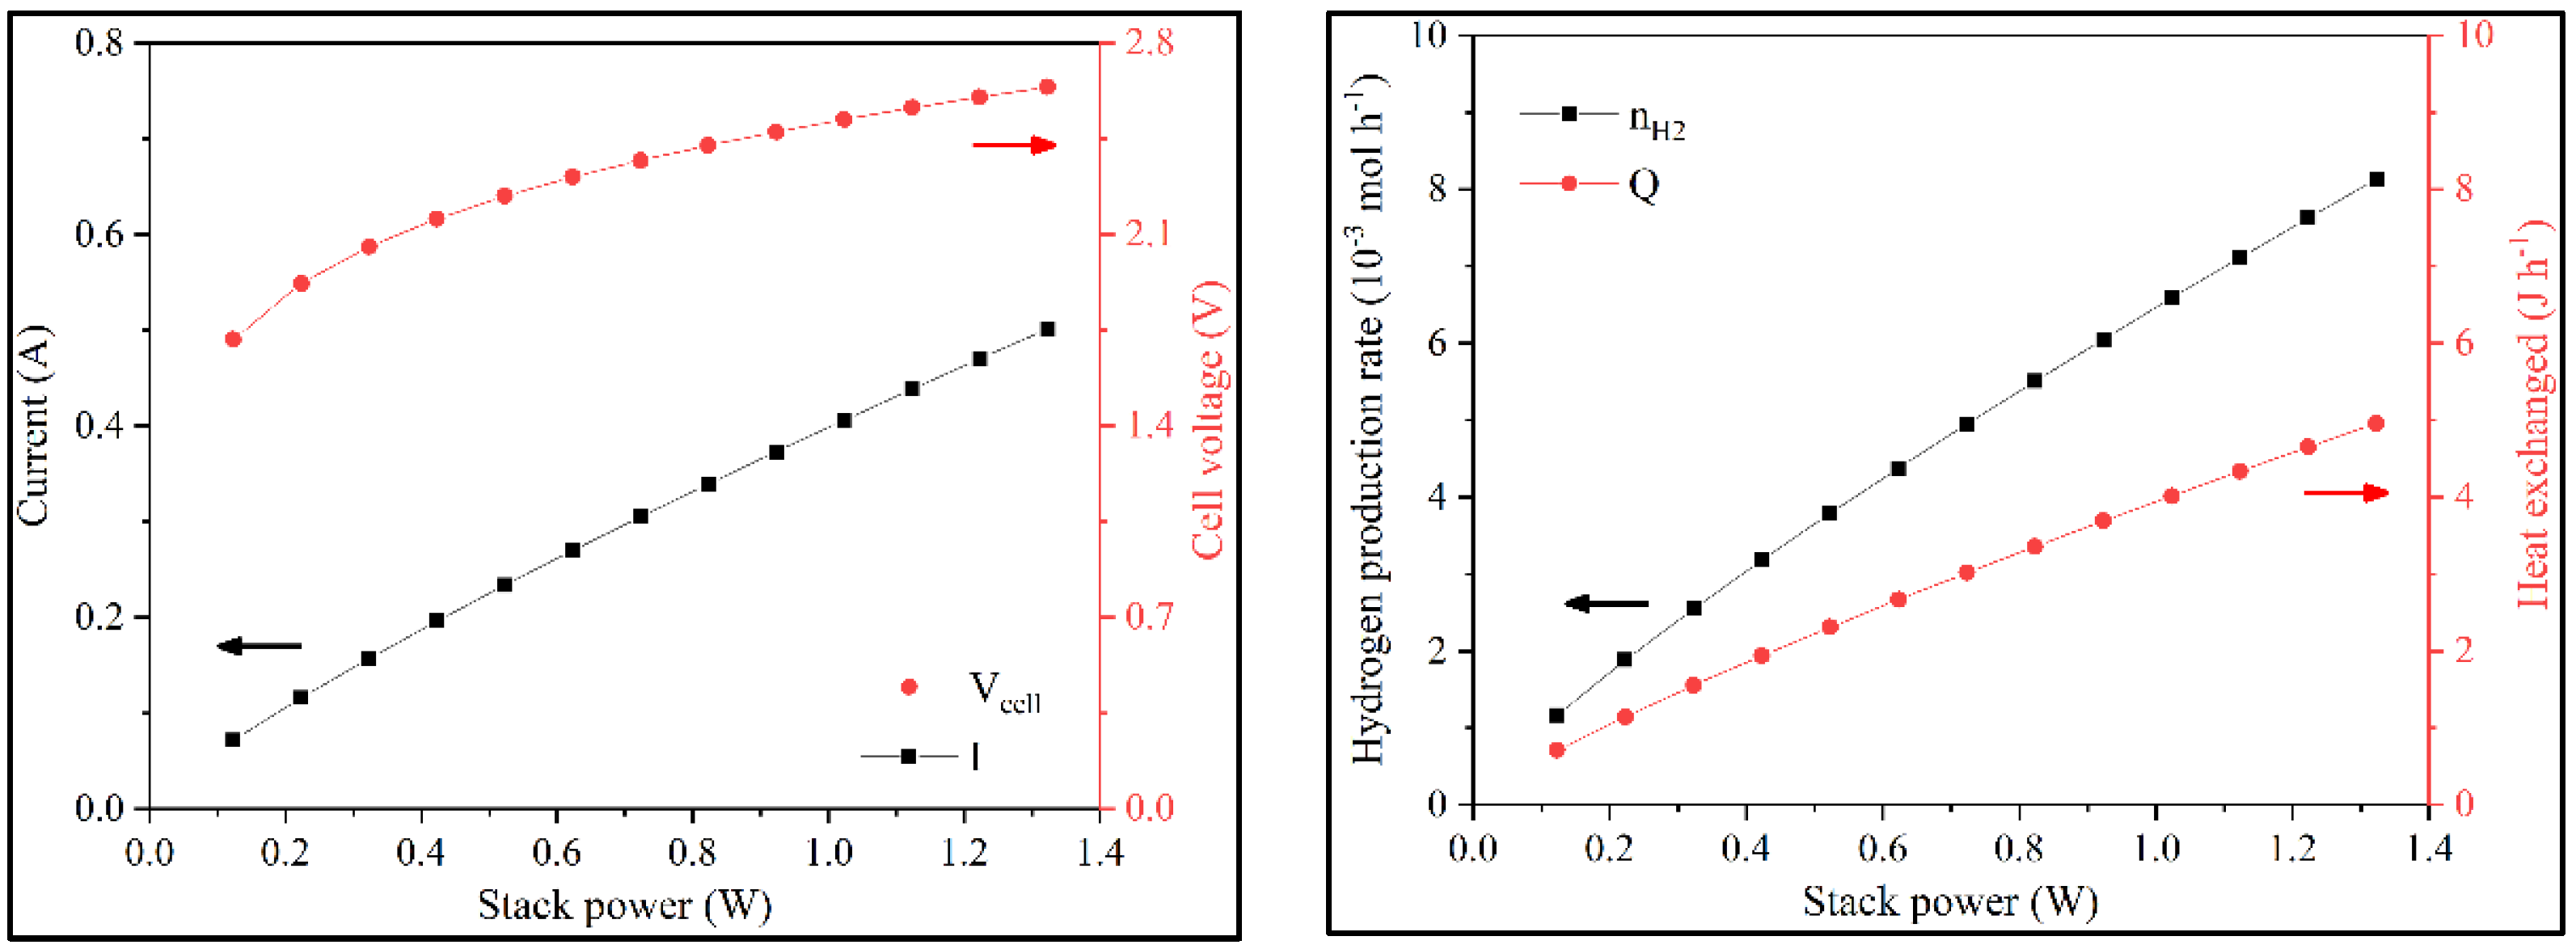
A final sensitivity analysis was performed on the stack’s electric power. With the increase of W
stack, the available energy also increased, allowing for higher V
cell. As A
cell and T were constants, the current increased, as noted in the polarization curve. This, in turn, increased hydrogen production and Q
T (
Figure 10 and
Figure S6).
This analysis provides a better understanding of the system behavior, allowing for a preliminary optimization of process conditions and equipment design. The optimal conditions for maximizing nH2 were found at 35 °C for batch operations and 45 °C for continuous operations. Wstack, Acell, and N are very dependent parameters, so it is necessary to know the typical value ranges when determining the optimal design.
To better understand the parameters that most strongly impact hydrogen production, it is relevant to look at the data regarding the sensitivity analysis in percentage form. This allows a more intuitive comparison between the imposed increment in the analyzed parameters and the resulting output response.
The data presented in
Table 6,
Table 7 and
Table 8 detail the changes in output variables, such as the hydrogen production estimated by the model, in response to an imposed variation of several input variables. The input variables in question are the number of cells (N) in
Table 6, the active area of the cell (A
cell) in
Table 7, and the electric power (W
stack) in
Table 8.
The sensitivity analysis results showed that hydrogen production was influenced mainly by electric power, as expected by observing Equations (11) and (12). Conversely, when studying the effect of electrolyzer design, parameters such as the cell area and the number of cells are also important to consider, as they influence the electric power. In this case, a change in cell number or cell area yielded a similar response regarding hydrogen production and discharged heat. However, it is relevant to point out that hydrogen production does not scale linearly with these design parameters, which makes them essential parameters to be optimized during the equipment design stages.
When comparing batch operation and continuous operation, it is interesting to observe that lower increments in cell number or cell area have a more significant impact on hydrogen production for continuous operation, which further highlights the merits of continuous operation versus batch operation, particularly in an industrial setting. However, the effect is reversed for higher values and likewise larger scales, favoring batch operation. Designing an electrolyzer places a significant onus on optimizing equipment scale and number to achieve peak hydrogen production with minimal costs.
Sensitivity analyses of the cell efficiency and process temperature were also carried out and are available in
Tables S4 and S5 in Supplementary Information. In both cases, hydrogen production scales linearly with both parameters.
3.5. Economic Analysis
Economic analysis calculated RGP for 2021 based on the mass balance. Therefore, it was necessary to update the lignin price, which was found to vary in the range of 0.70–1.08 €/kg. The mass balance was obtained through an experimental run of batch operation. We considered 3 h of production per batch and 1 h for cleaning and preparing each new batch. The annual production is based on 219 days of work. Considering the small-scale lab BL electrolysis cell, the yearly hydrogen production would be 39.2 g, and the annual output of lignin would be 263 g. An RGP of 0.28 € for the worst scenario and 0.50 € for the best were obtained from those values. An industrial electricity cost of 0.15 €/kWh was assumed. For an electric power of 0.915 W, the electricity cost would be 0.54 €. Examining the values of RGP and the electricity cost, the immediate conclusion is that the production of hydrogen and lignin does not compensate for the electricity cost. However, this cell does not work in optimal conditions, and further improvements can make the system economically viable.
Following the preliminary analysis, a more refined analysis was performed considering a typical pilot or industrial electrolyzer with the following specifications: 2 kW, 80 cells, A
cell of 0.3 m
2, and T = 35 °C. For the batch operations, the model has a deviation of 21% in electric power, which was used to determine the electricity cost. The continuous operation electrolyzer works with 2 kW, 80 cells, A
cell of 0.3 m
2, and T = 45 °C. The deviation in electric power is 23%, and the yearly operation time was assumed to be 335 days (
Table 9).
Analyzing the worst scenarios in
Table 9, the product does not compensate for the power cost, but there is profit to be found in the best scenarios. This demonstrates that product and utility market costs are essential to guarantee commercial feasibility. The value of RGP by electric power for the continuous operation is about double than that for the batch operation. Thus, for the same quantity of electric power, the RGP for continuous operation will be much higher than for batch operation.
4. Conclusions
The work aimed to develop a novel custom mathematical model to describe the black liquor (BL) electrolysis process, which can be readily imported and used within the widely used Aspen Plus® chemical process simulation suite.
The simulation of BL electrolysis was based on previously developed water electrolysis models, with relevant parameters obtained from experimental data. Aspen Plus® was used for the simulation, but the modeling of the electrolyzer was made using Aspen Custom Modeler. The experimentally obtained data were modeled to determine the equation of the polarization curves. The simulation of BL electrolysis was also based on a mass balance obtained from experimental runs, involving several assumptions due to the lack of literature data.
Validation of the model was successful by comparing the model and experimental data. The main difference was found to be the cell voltage and power stack, which can be improved in subsequent models.
The difference between batch and continuous operation was also evaluated. At 25 °C, the models behaved similarly. However, deviations were observed for higher temperatures. For the continuous operation to have the same nH2 as a batch operation, the required electric power is higher.
A sensitivity analysis helped to understand the electrolyzer’s behavior. Variations in inputs were made to see the influence on outputs. The analysis demonstrated that to maximize nH2, the optimal temperature is 35 °C for batch operation and 45 °C for continuous operation. Wstack, Acell, and N are very dependent on each other, and it is necessary to know the typical value when designing. The parameters that most impact hydrogen production were the stack’s electric power, the number of electrolytic cells, and the cell’s active area. As such, optimized equipment design cannot be understated when considering BL electrolysis as a process. Additionally, a comparison between batch and continuous operation revealed a need for careful equipment design according to the desired scale, which may influence the choice of the system.
The economic viability for hydrogen production by BL electrolysis was estimated. RGP for the electrolyzer’s worst and best scenario was calculated with typical dimensions and optimized temperature (2 kW, 80 cells, and an active electrode area of 0.3 m2). It was observed that with estimated values, economic feasibility is dependent on the balance between product market prices and operational costs.
In summary, the model presented adequately describes hydrogen production via BL electrolysis and provides a solid framework for further developments, not only in the context of evaluating the fundamental process and its industrial application but also in developing a tool for optimizing BL electrolyzer design and operation.


 ,
, 


