
AI-Based Automatic Detection and Classification of Diabetic Retinopathy Using U-Net and Deep Learning


Abstract
1. Introduction
- Proposed two-stage novel classification system for diabetic retinopathy.
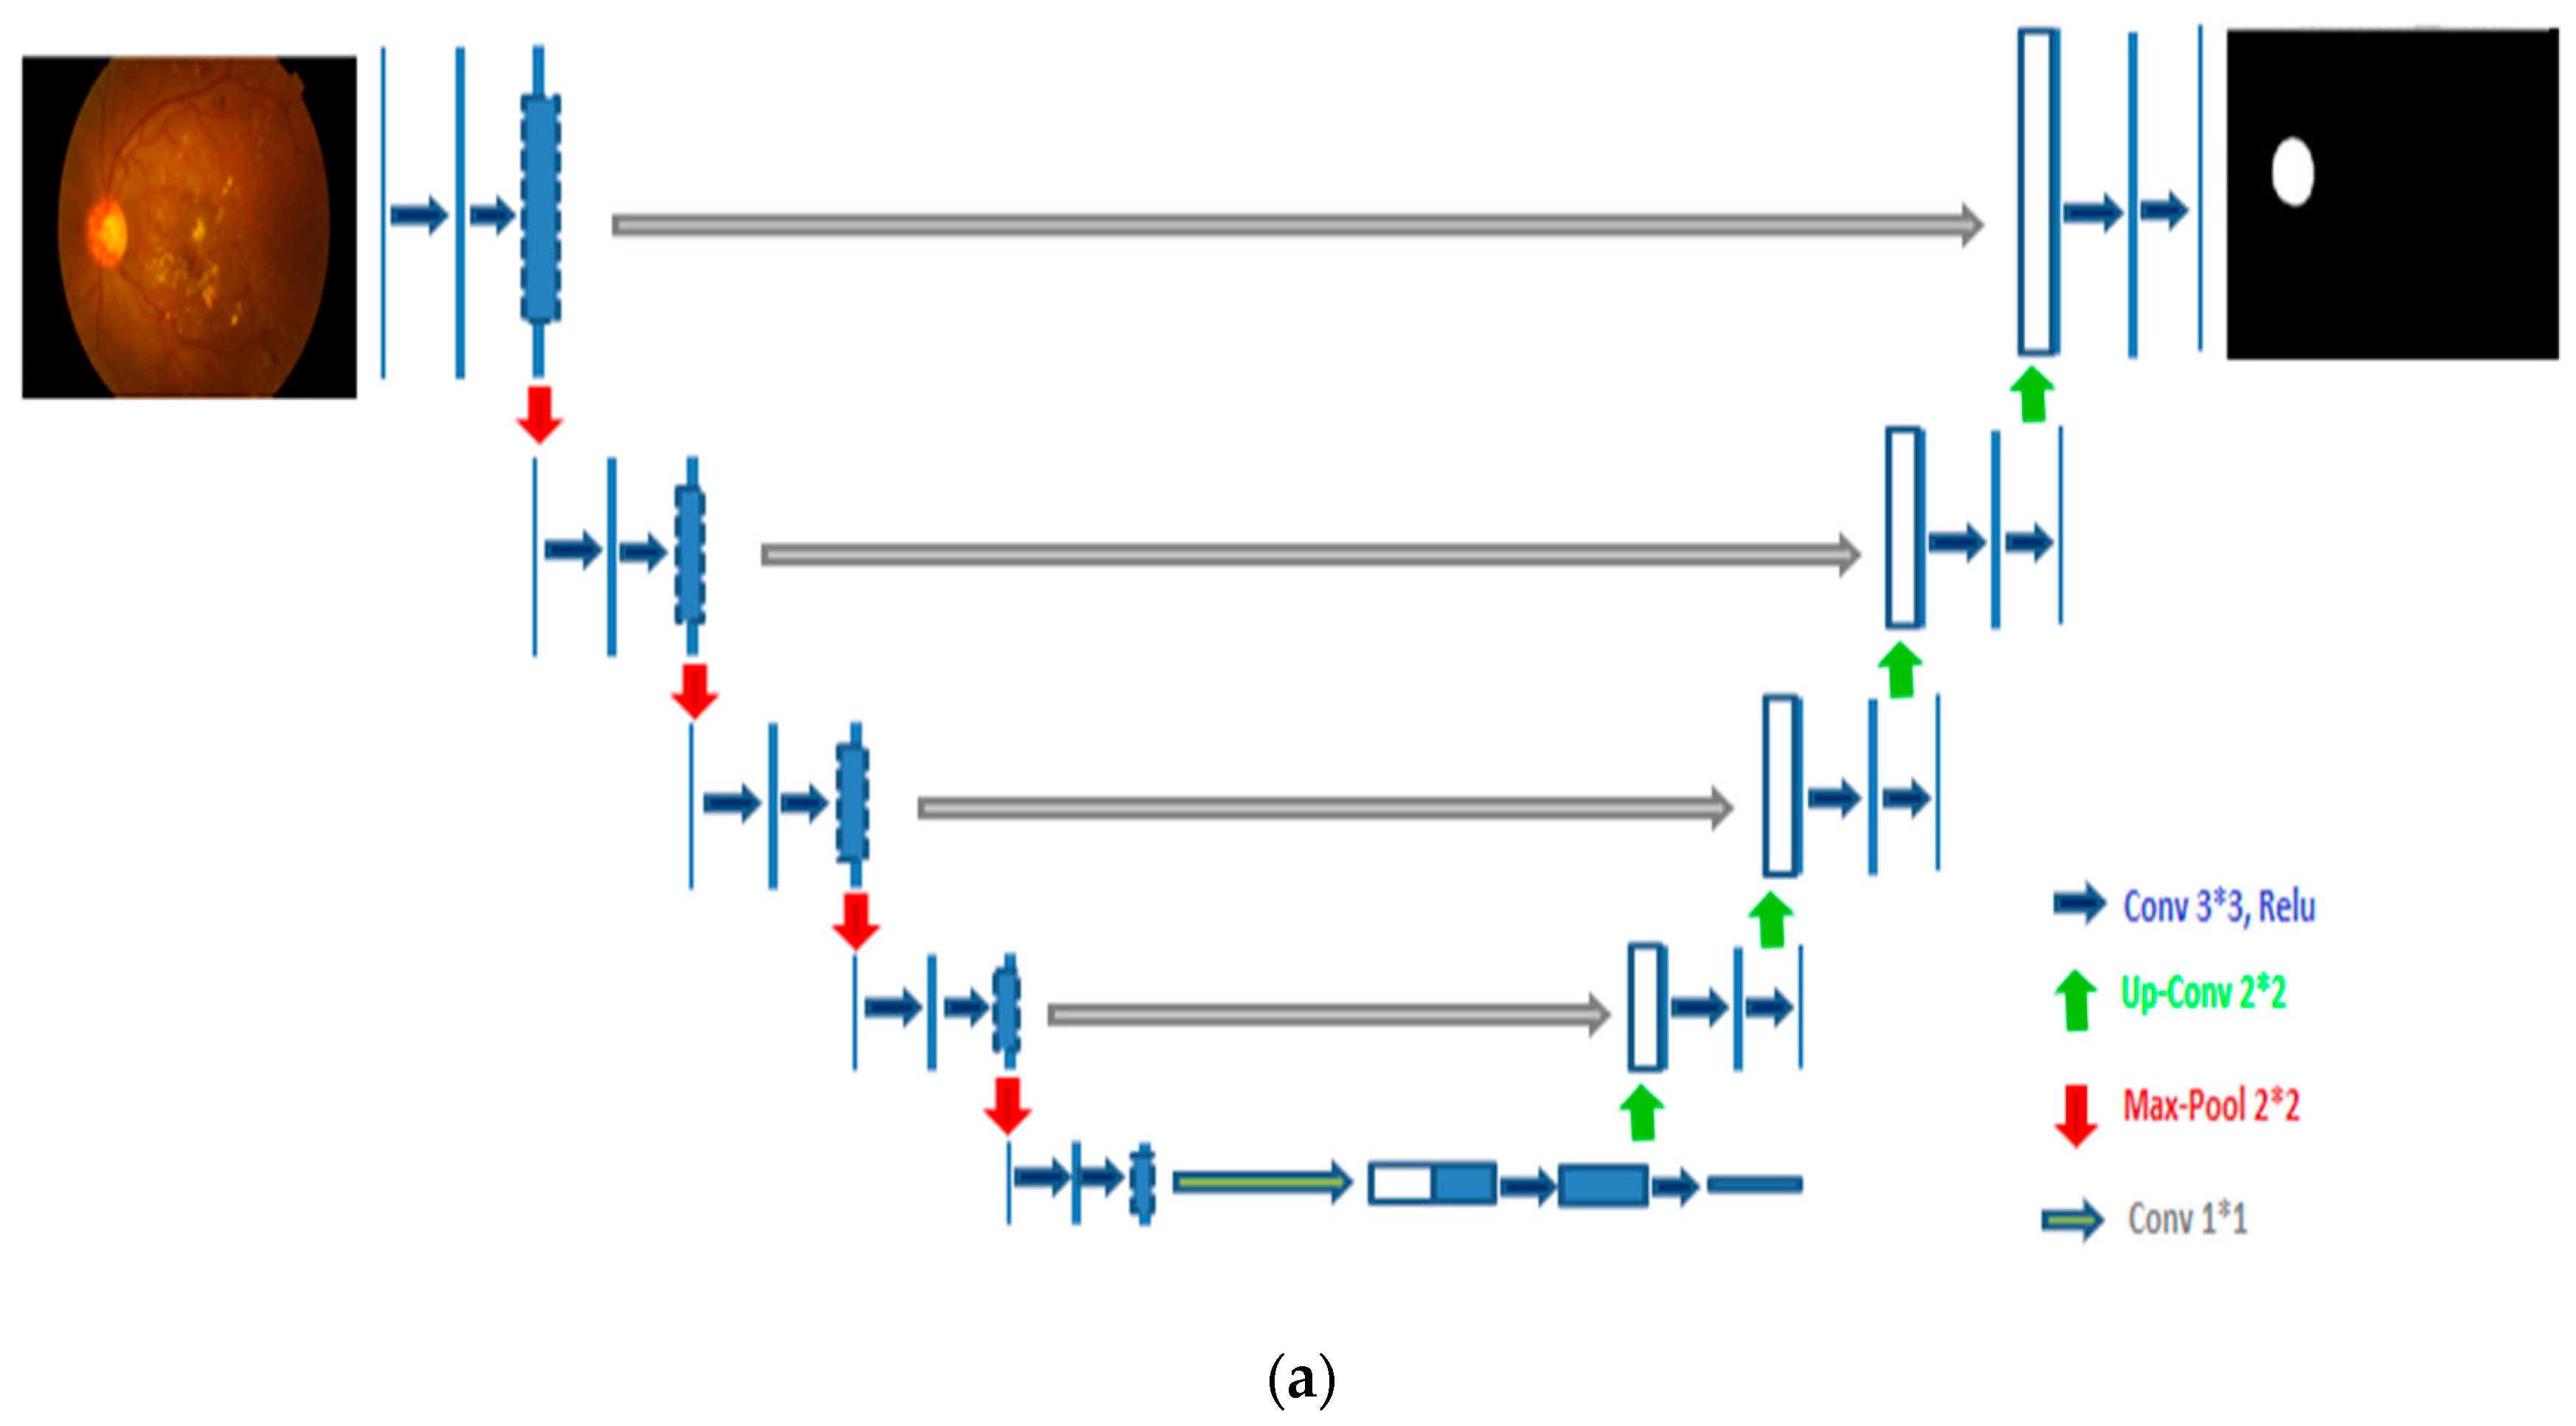
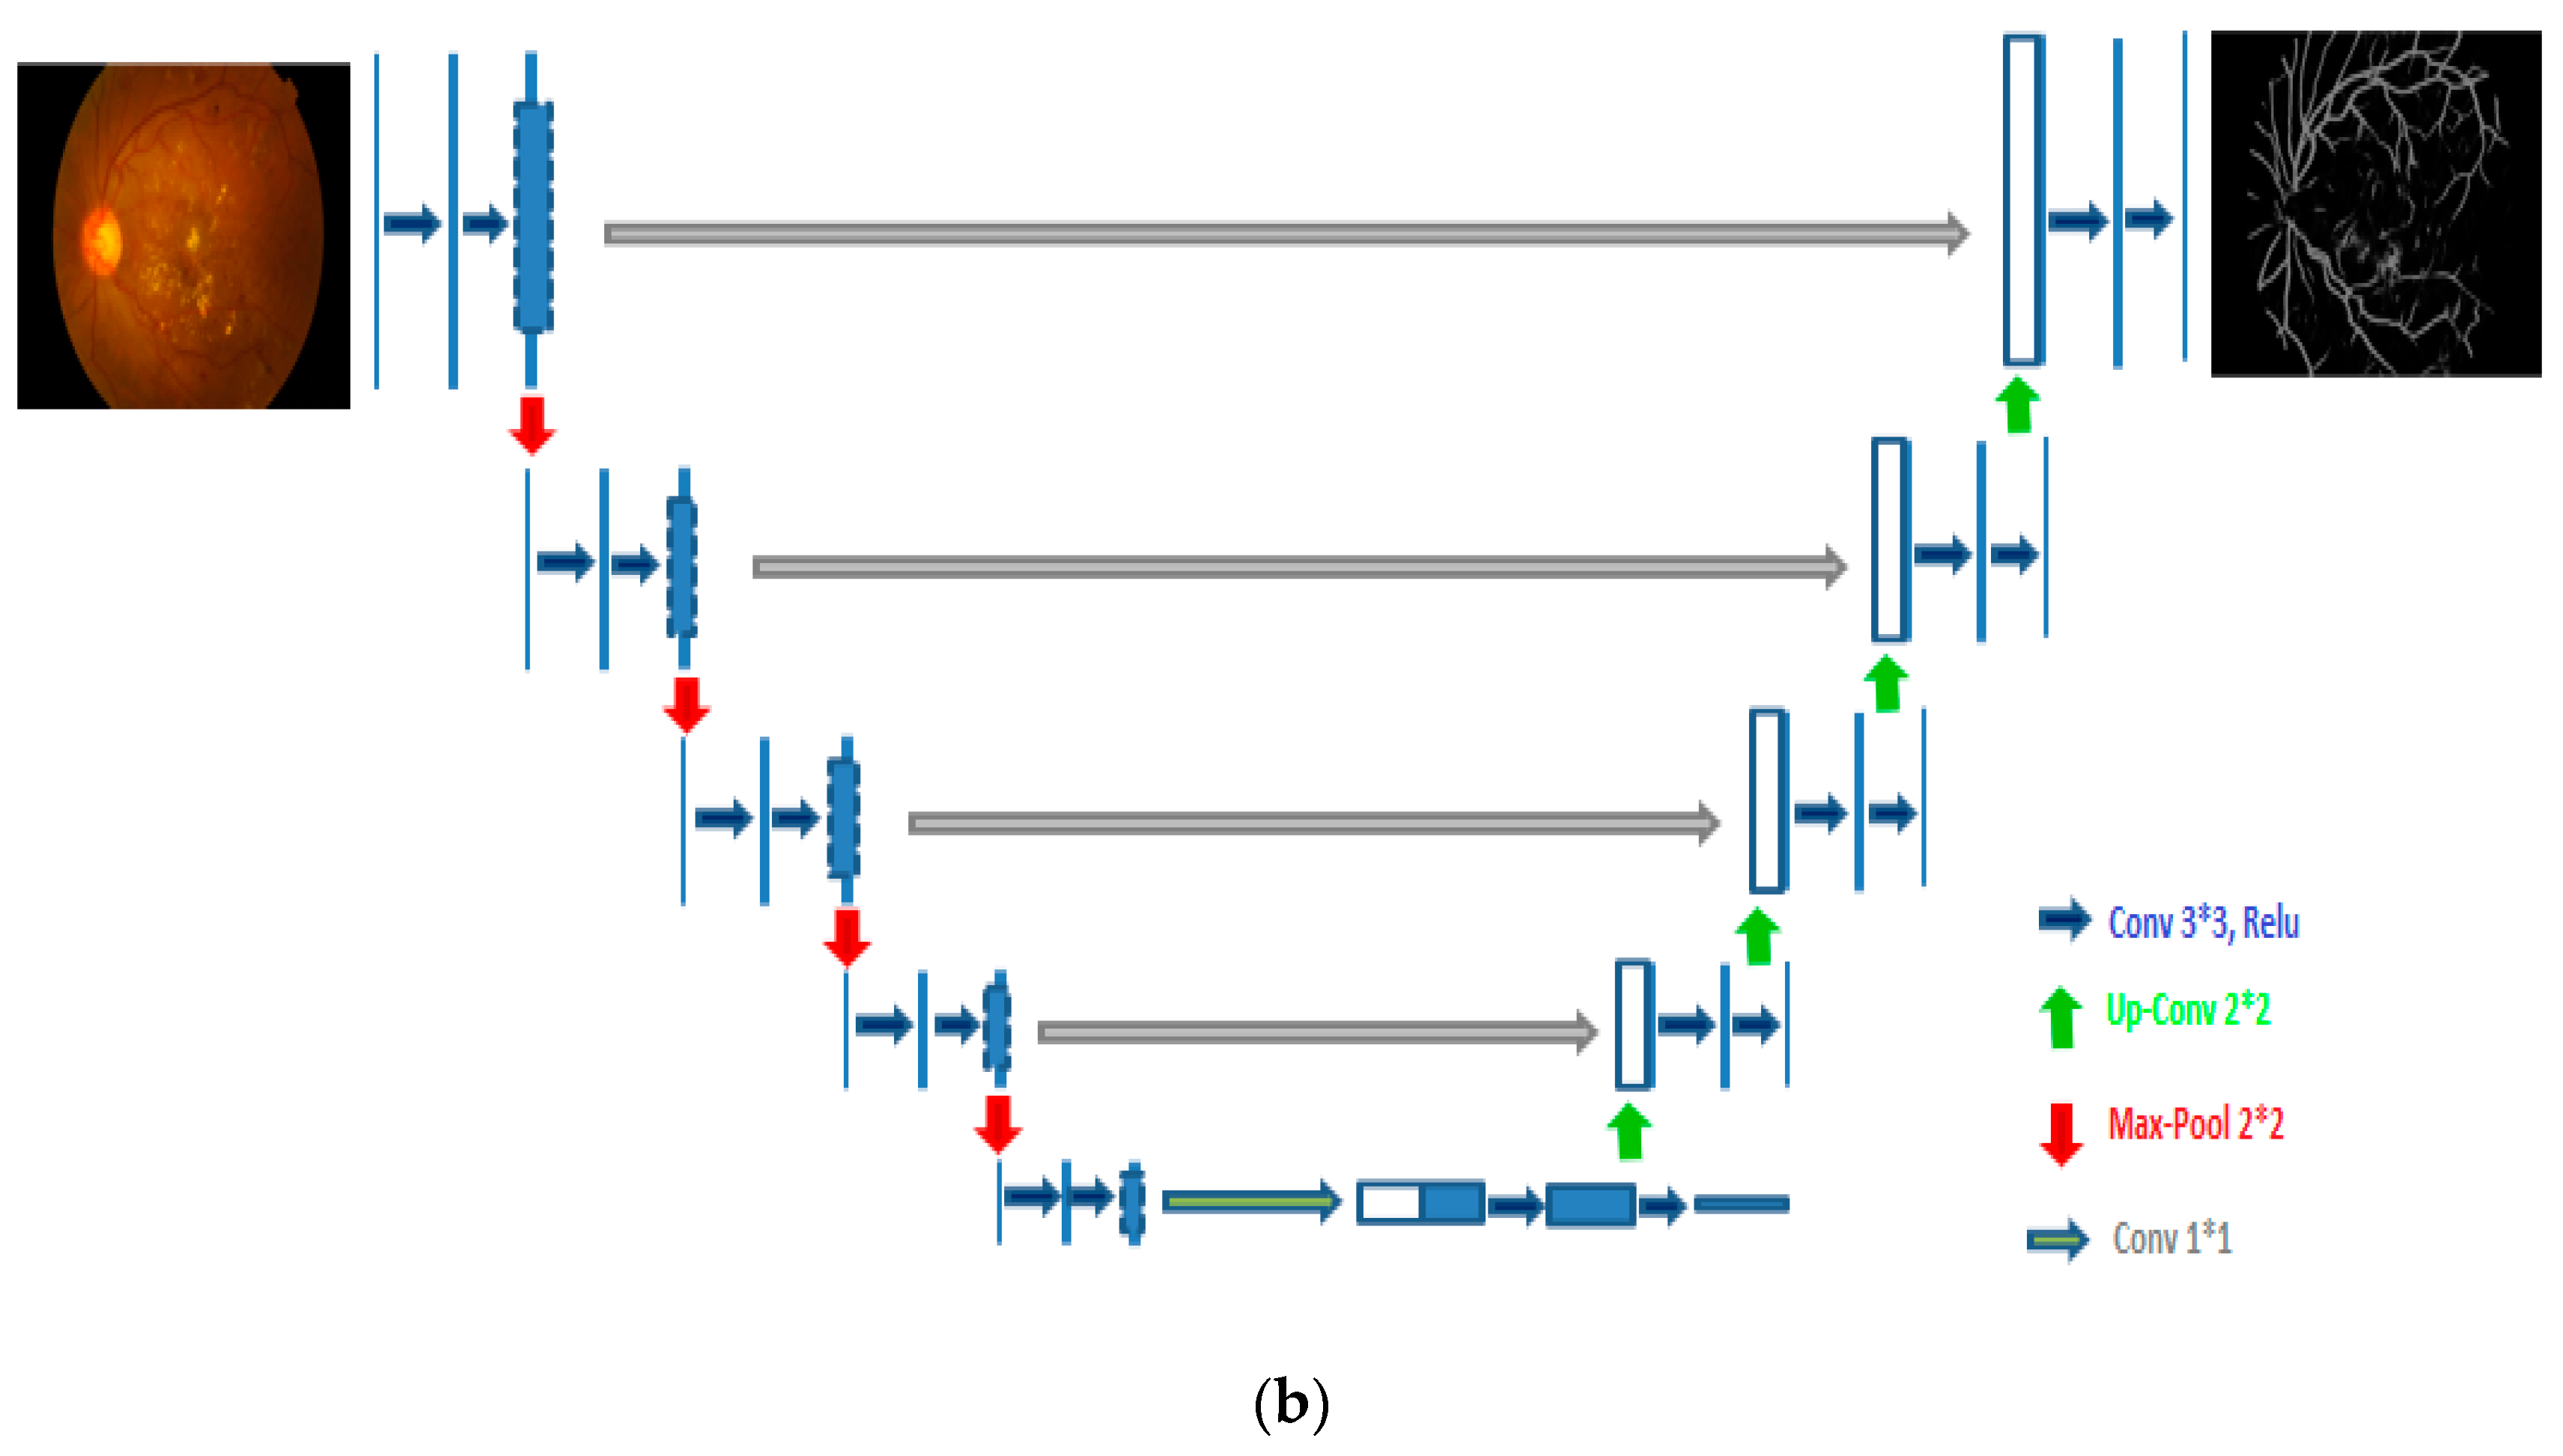
- After preprocessing and data augmentation, we used two independent U-Net models to segment the optic disc and blood vessels.
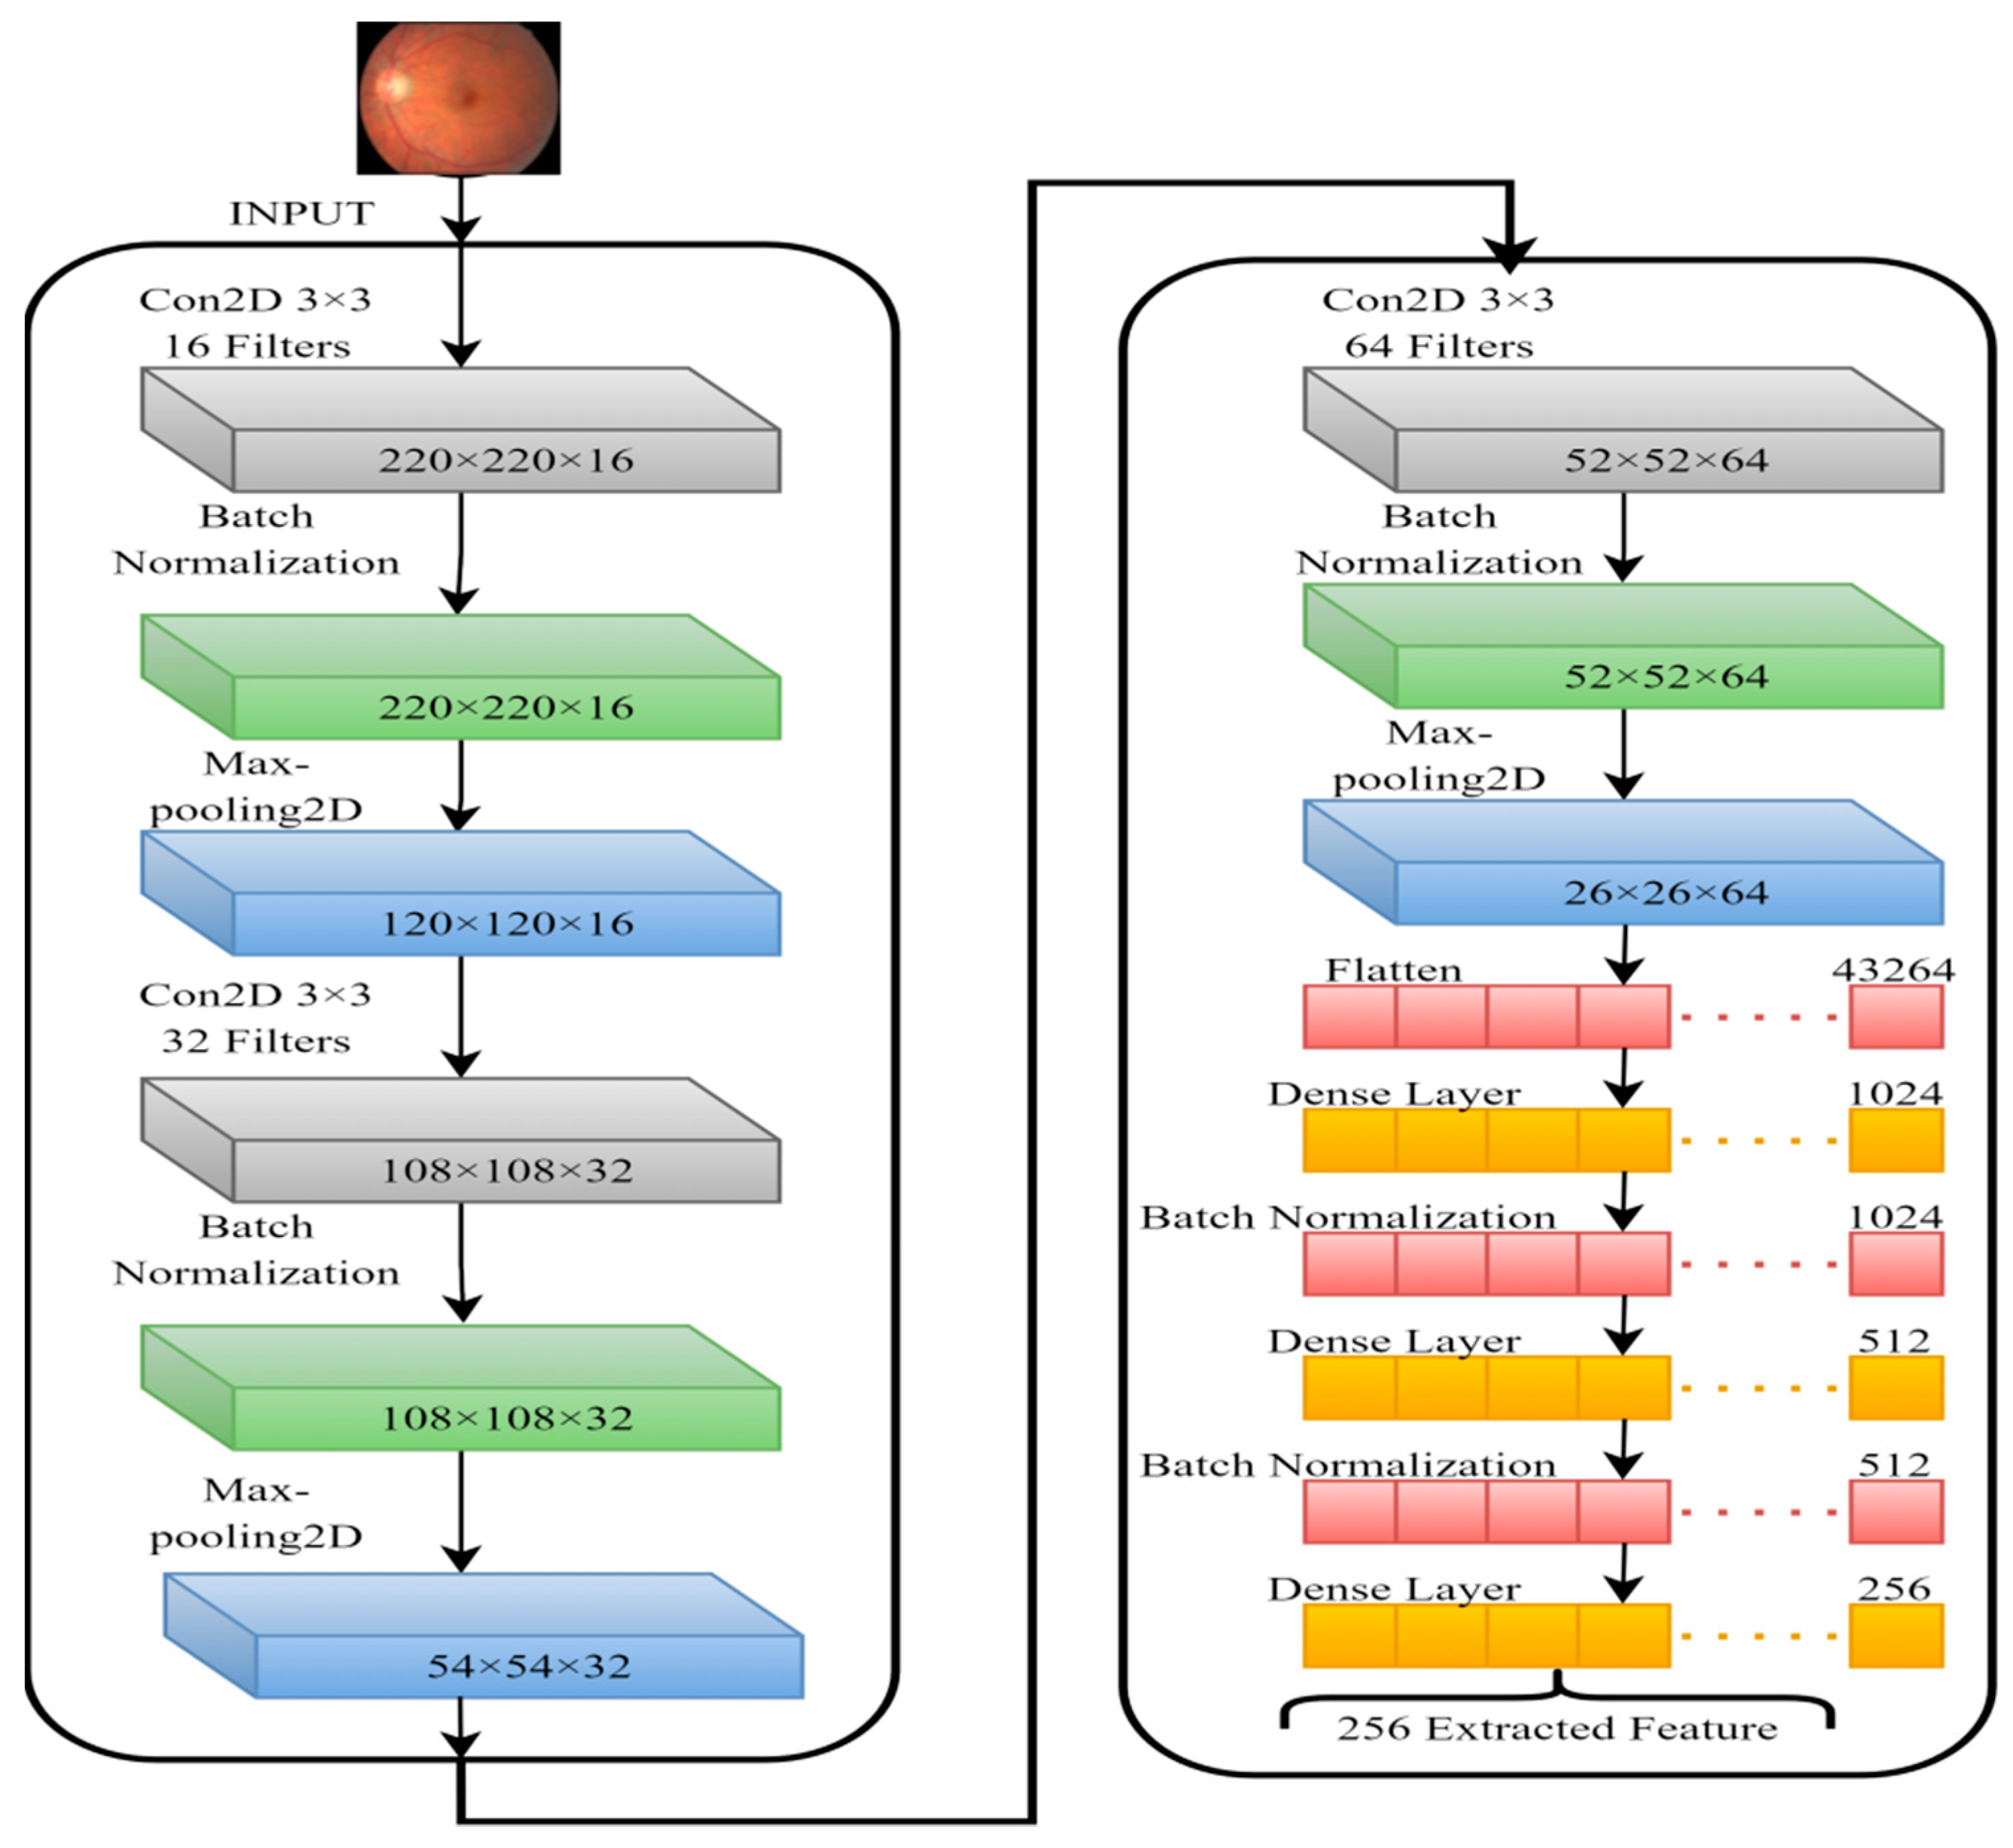
- The features from the fundus images were extracted using a novel hybrid CNN-SVD created in this study. In total, 256 features were extracted from processed FIs using CNN. Then, by selecting the most significant characteristics, SVD reduces these features to 100, reducing the model complexity and enhancing model performance.
- The transfer learning (TL)-based Inception-V3 model is used to classify fundus images.
- A comprehensive DR categorization system is created that is accurate, dependable, and intuitive.
- Three large public datasets were used to test the model’s performance: Messidor-2, EyePACS-1, and DIARETDB0.
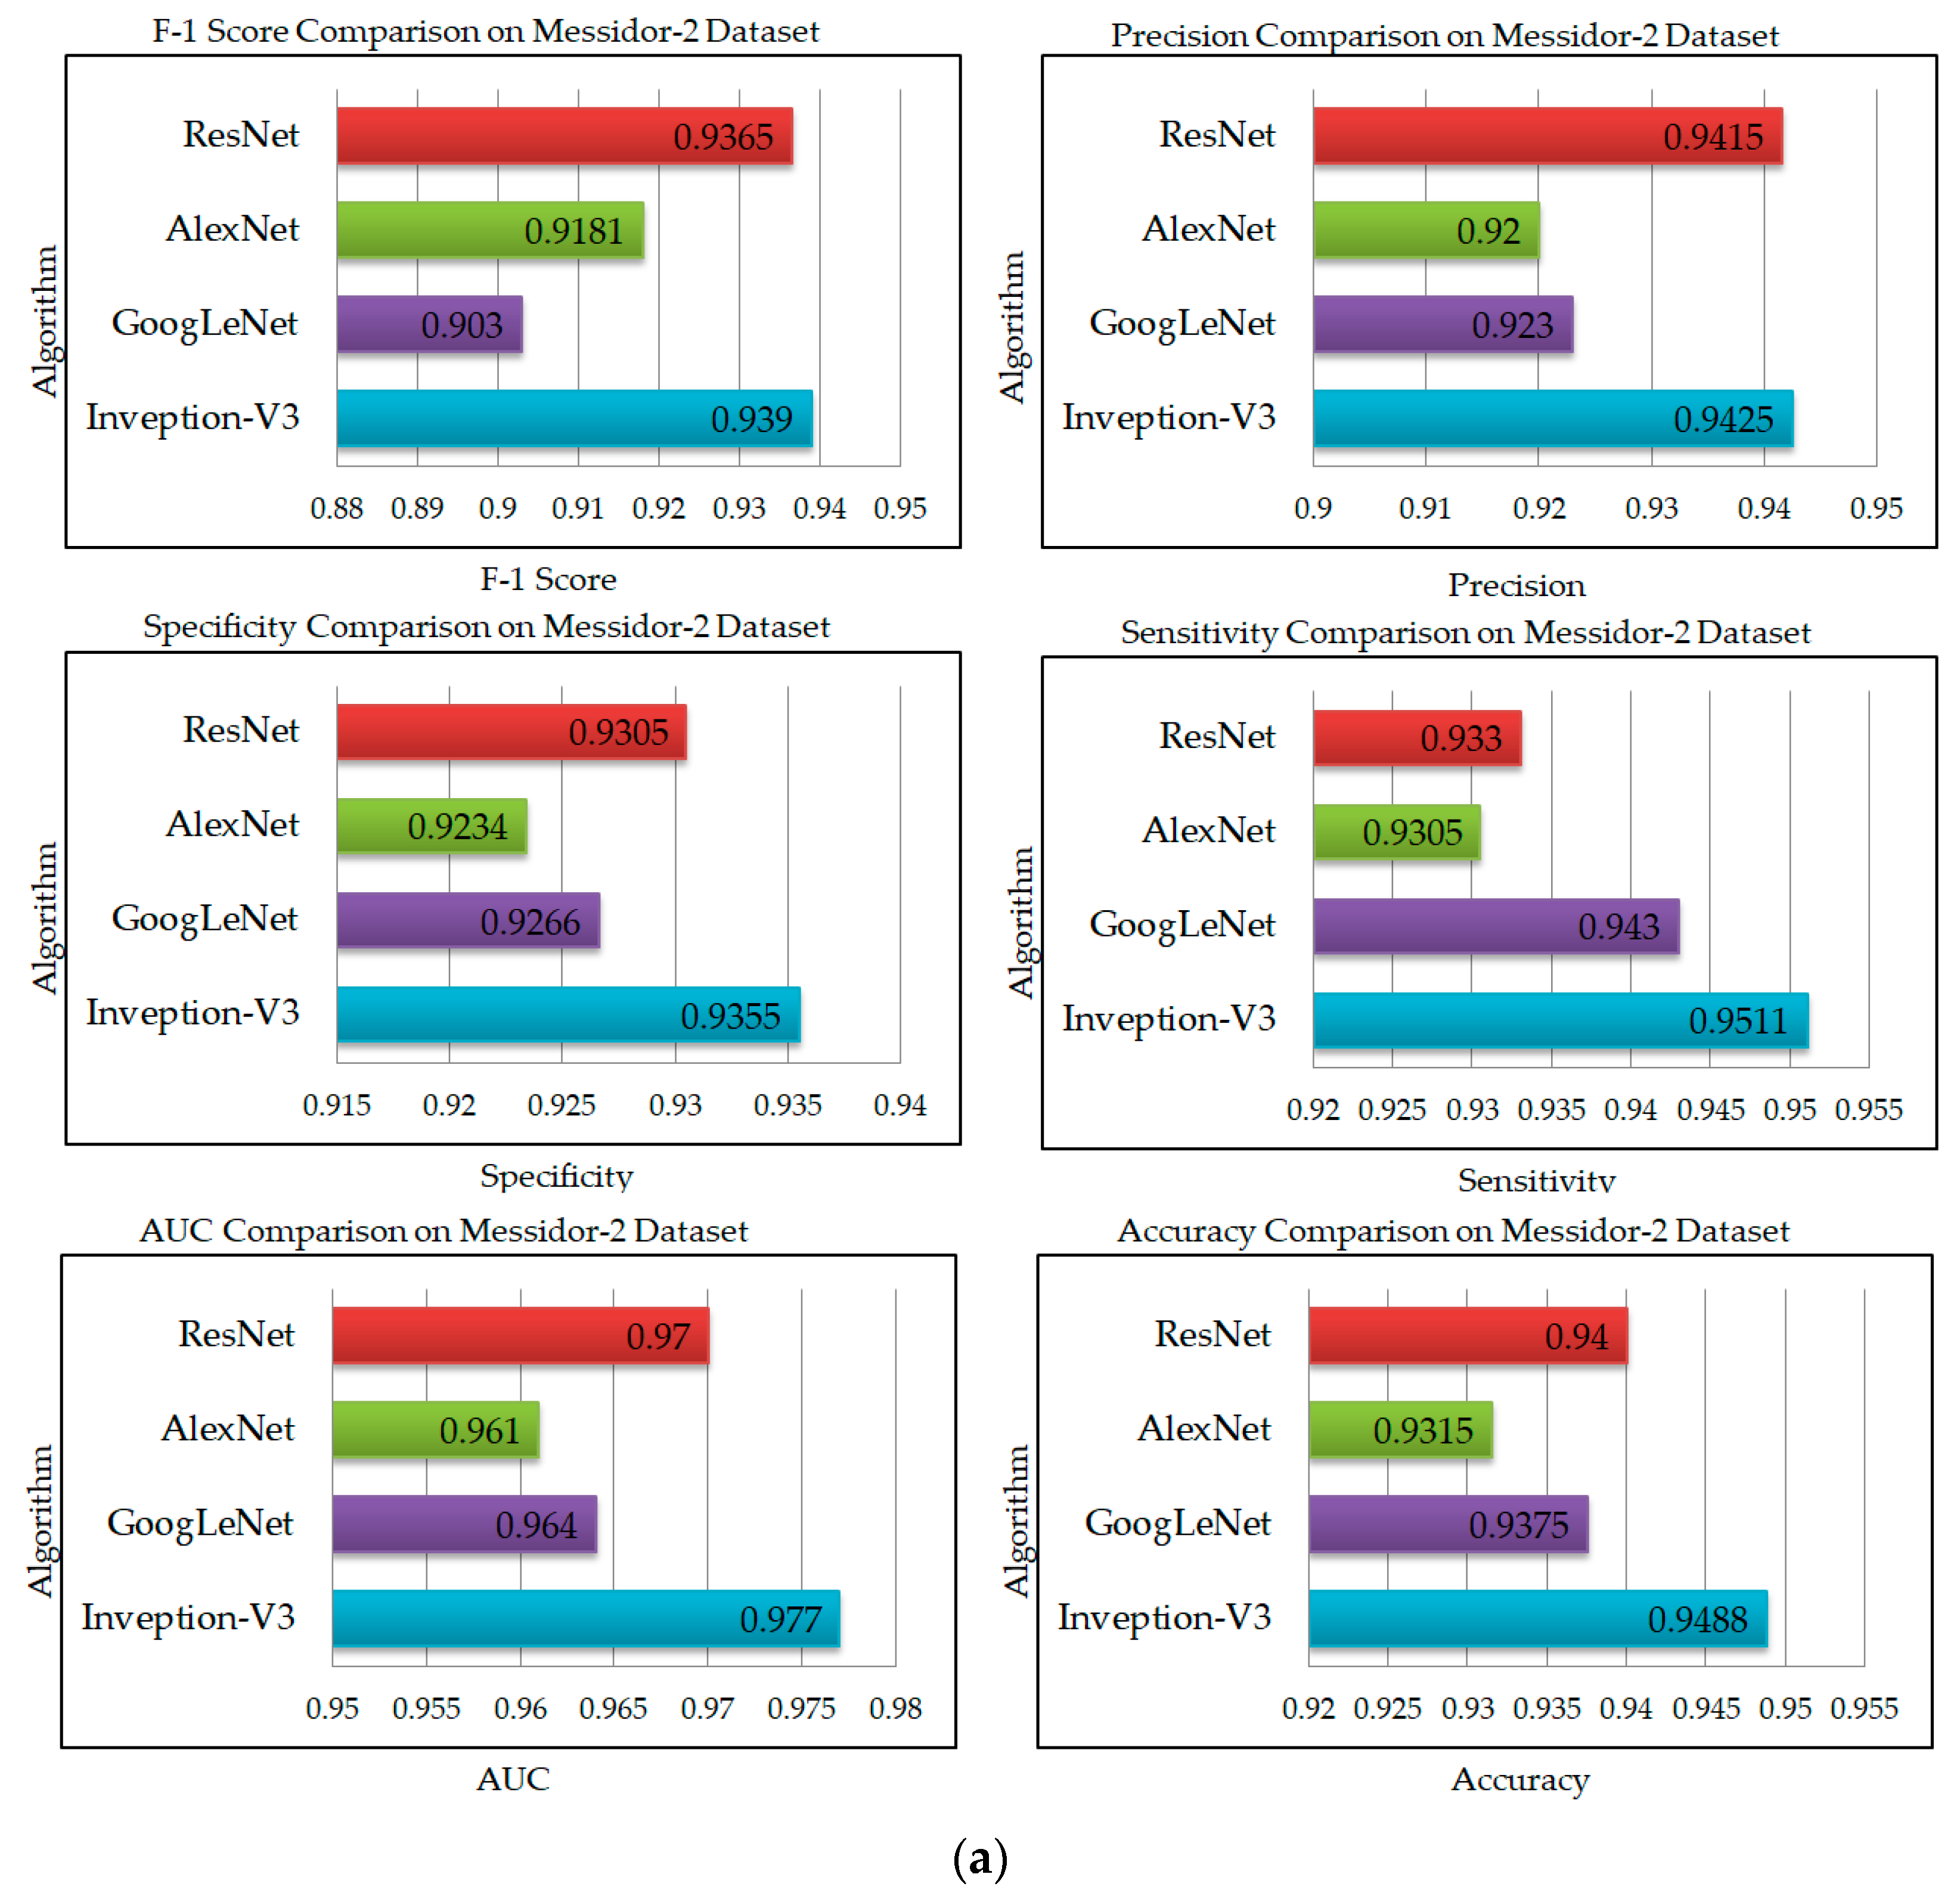
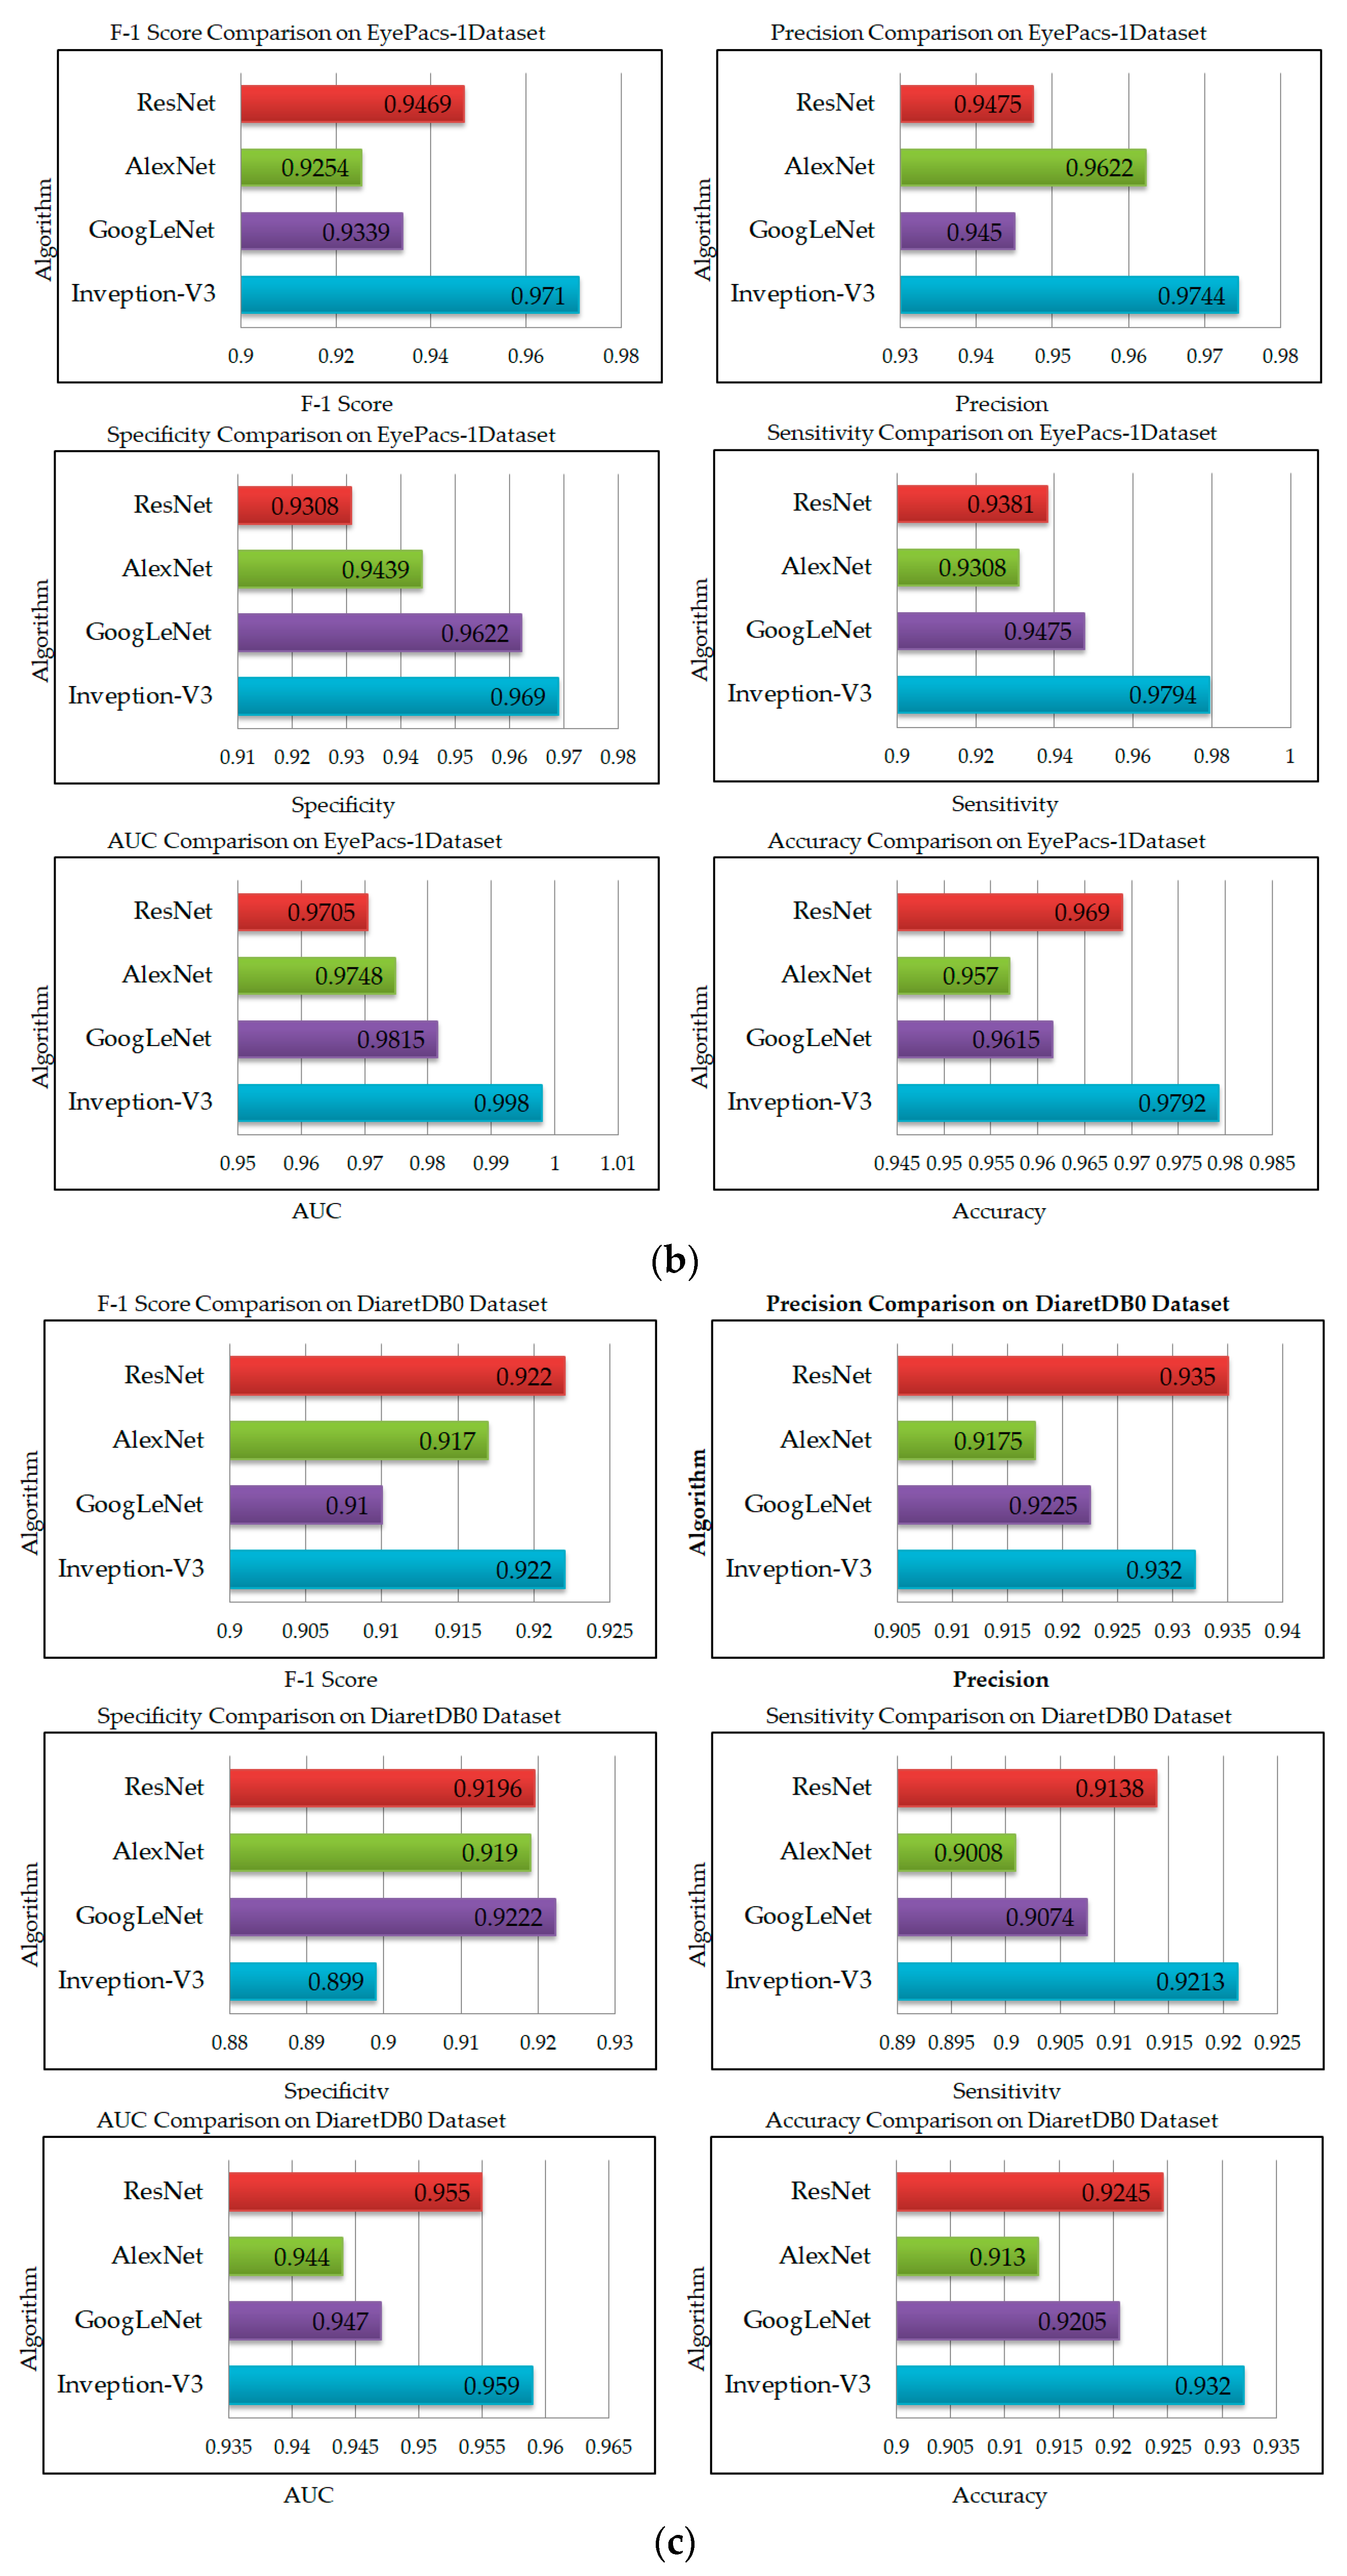
- The diagnostic capabilities of the proposed model are verified using several performance metrics, such as precision, F1-score, sensitivity, accuracy, specificity, as well as AUC.
2. Current Research Status
2.1. DR Detection Based on Classical Machine Learning
2.2. DR Detection Based on Deep Learning
3. Materials
3.1. Datasets
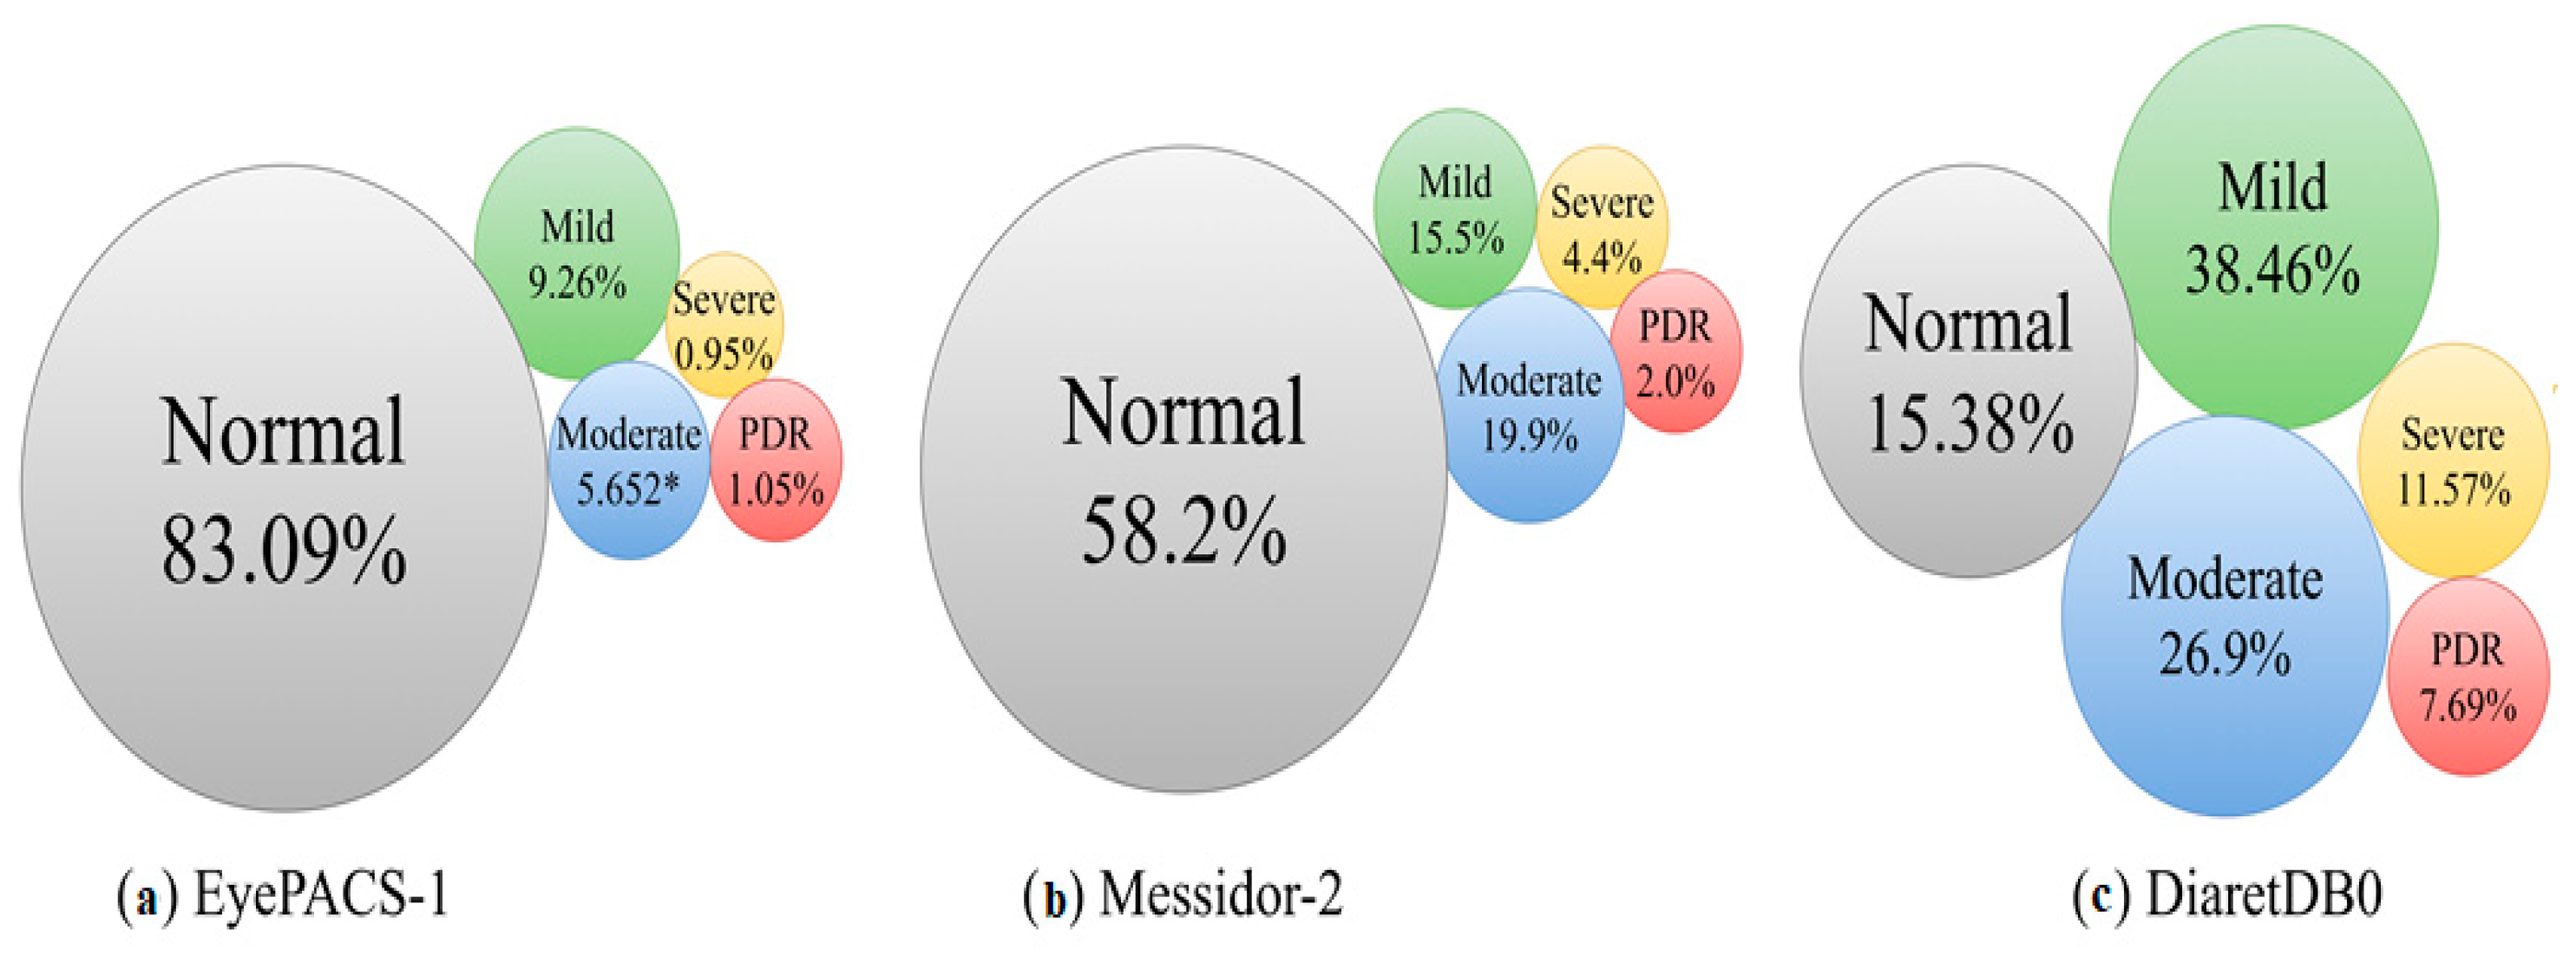
3.1.1. EyePACS-1
3.1.2. Messidor-2
3.1.3. DiaretDB0
4. Methodology
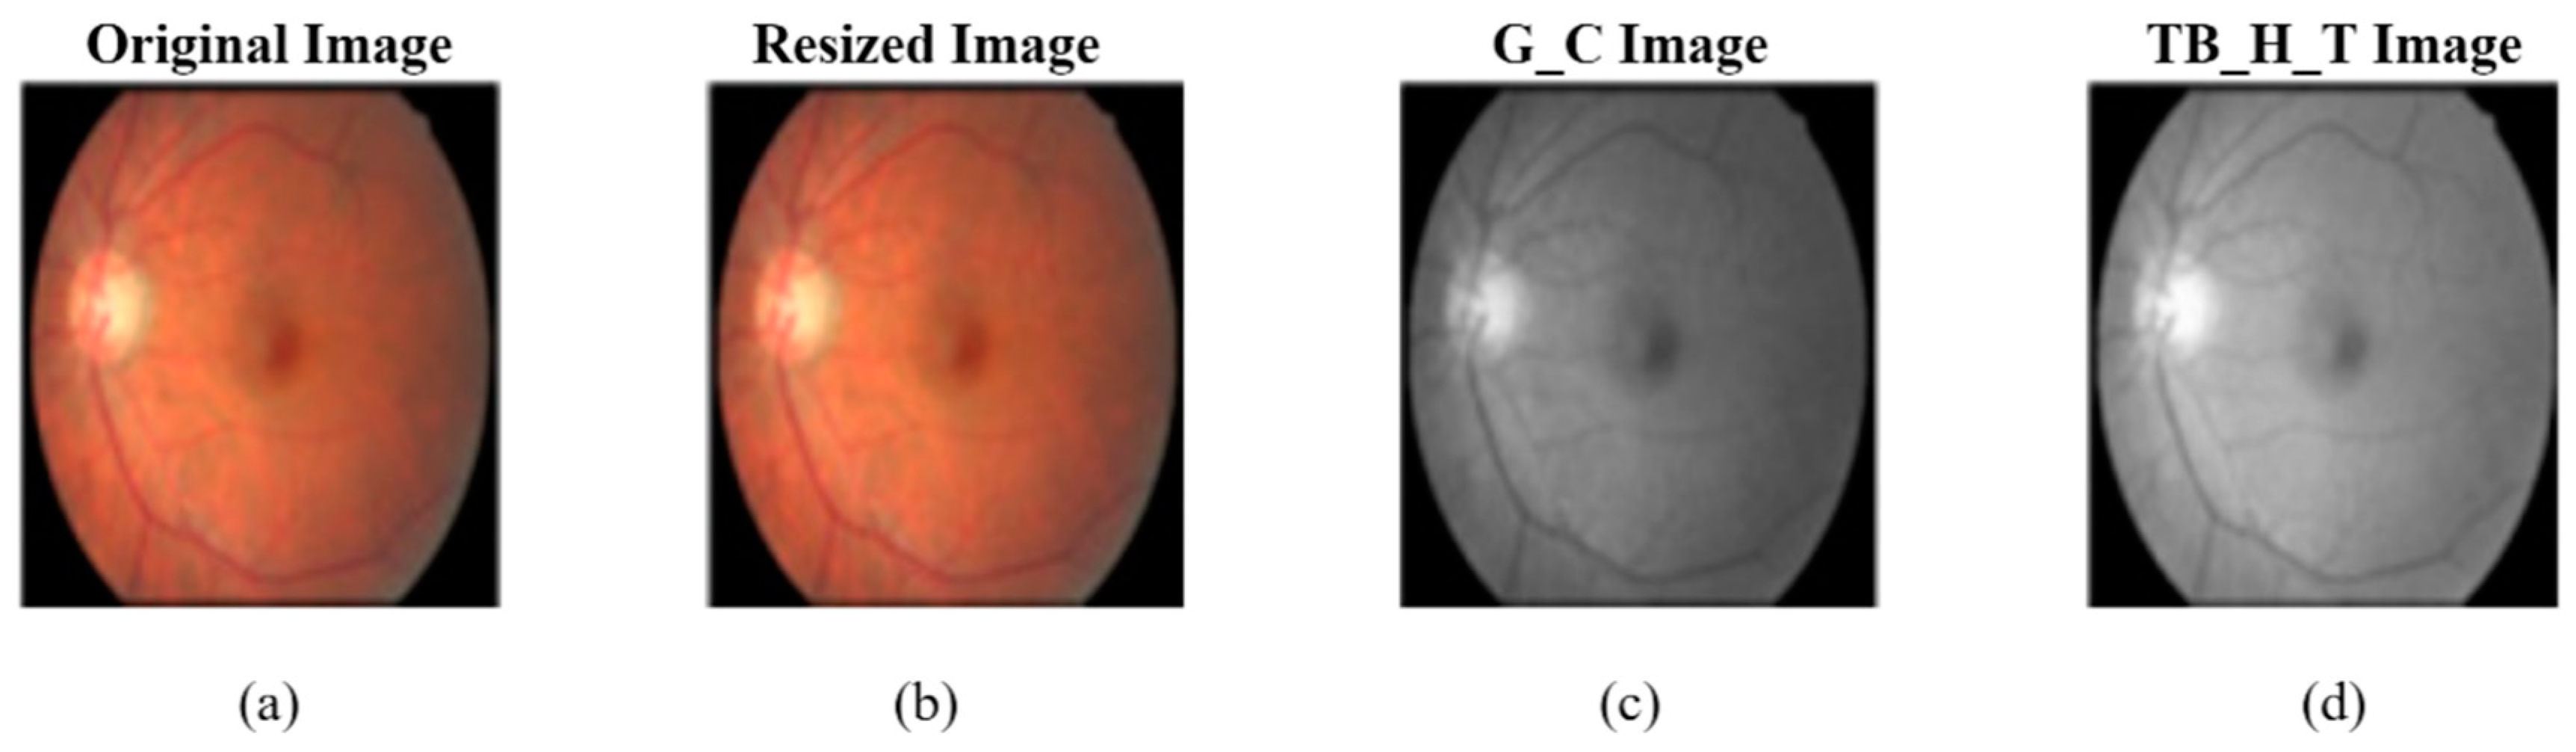
4.1. Preprocessing and Data Augmentation
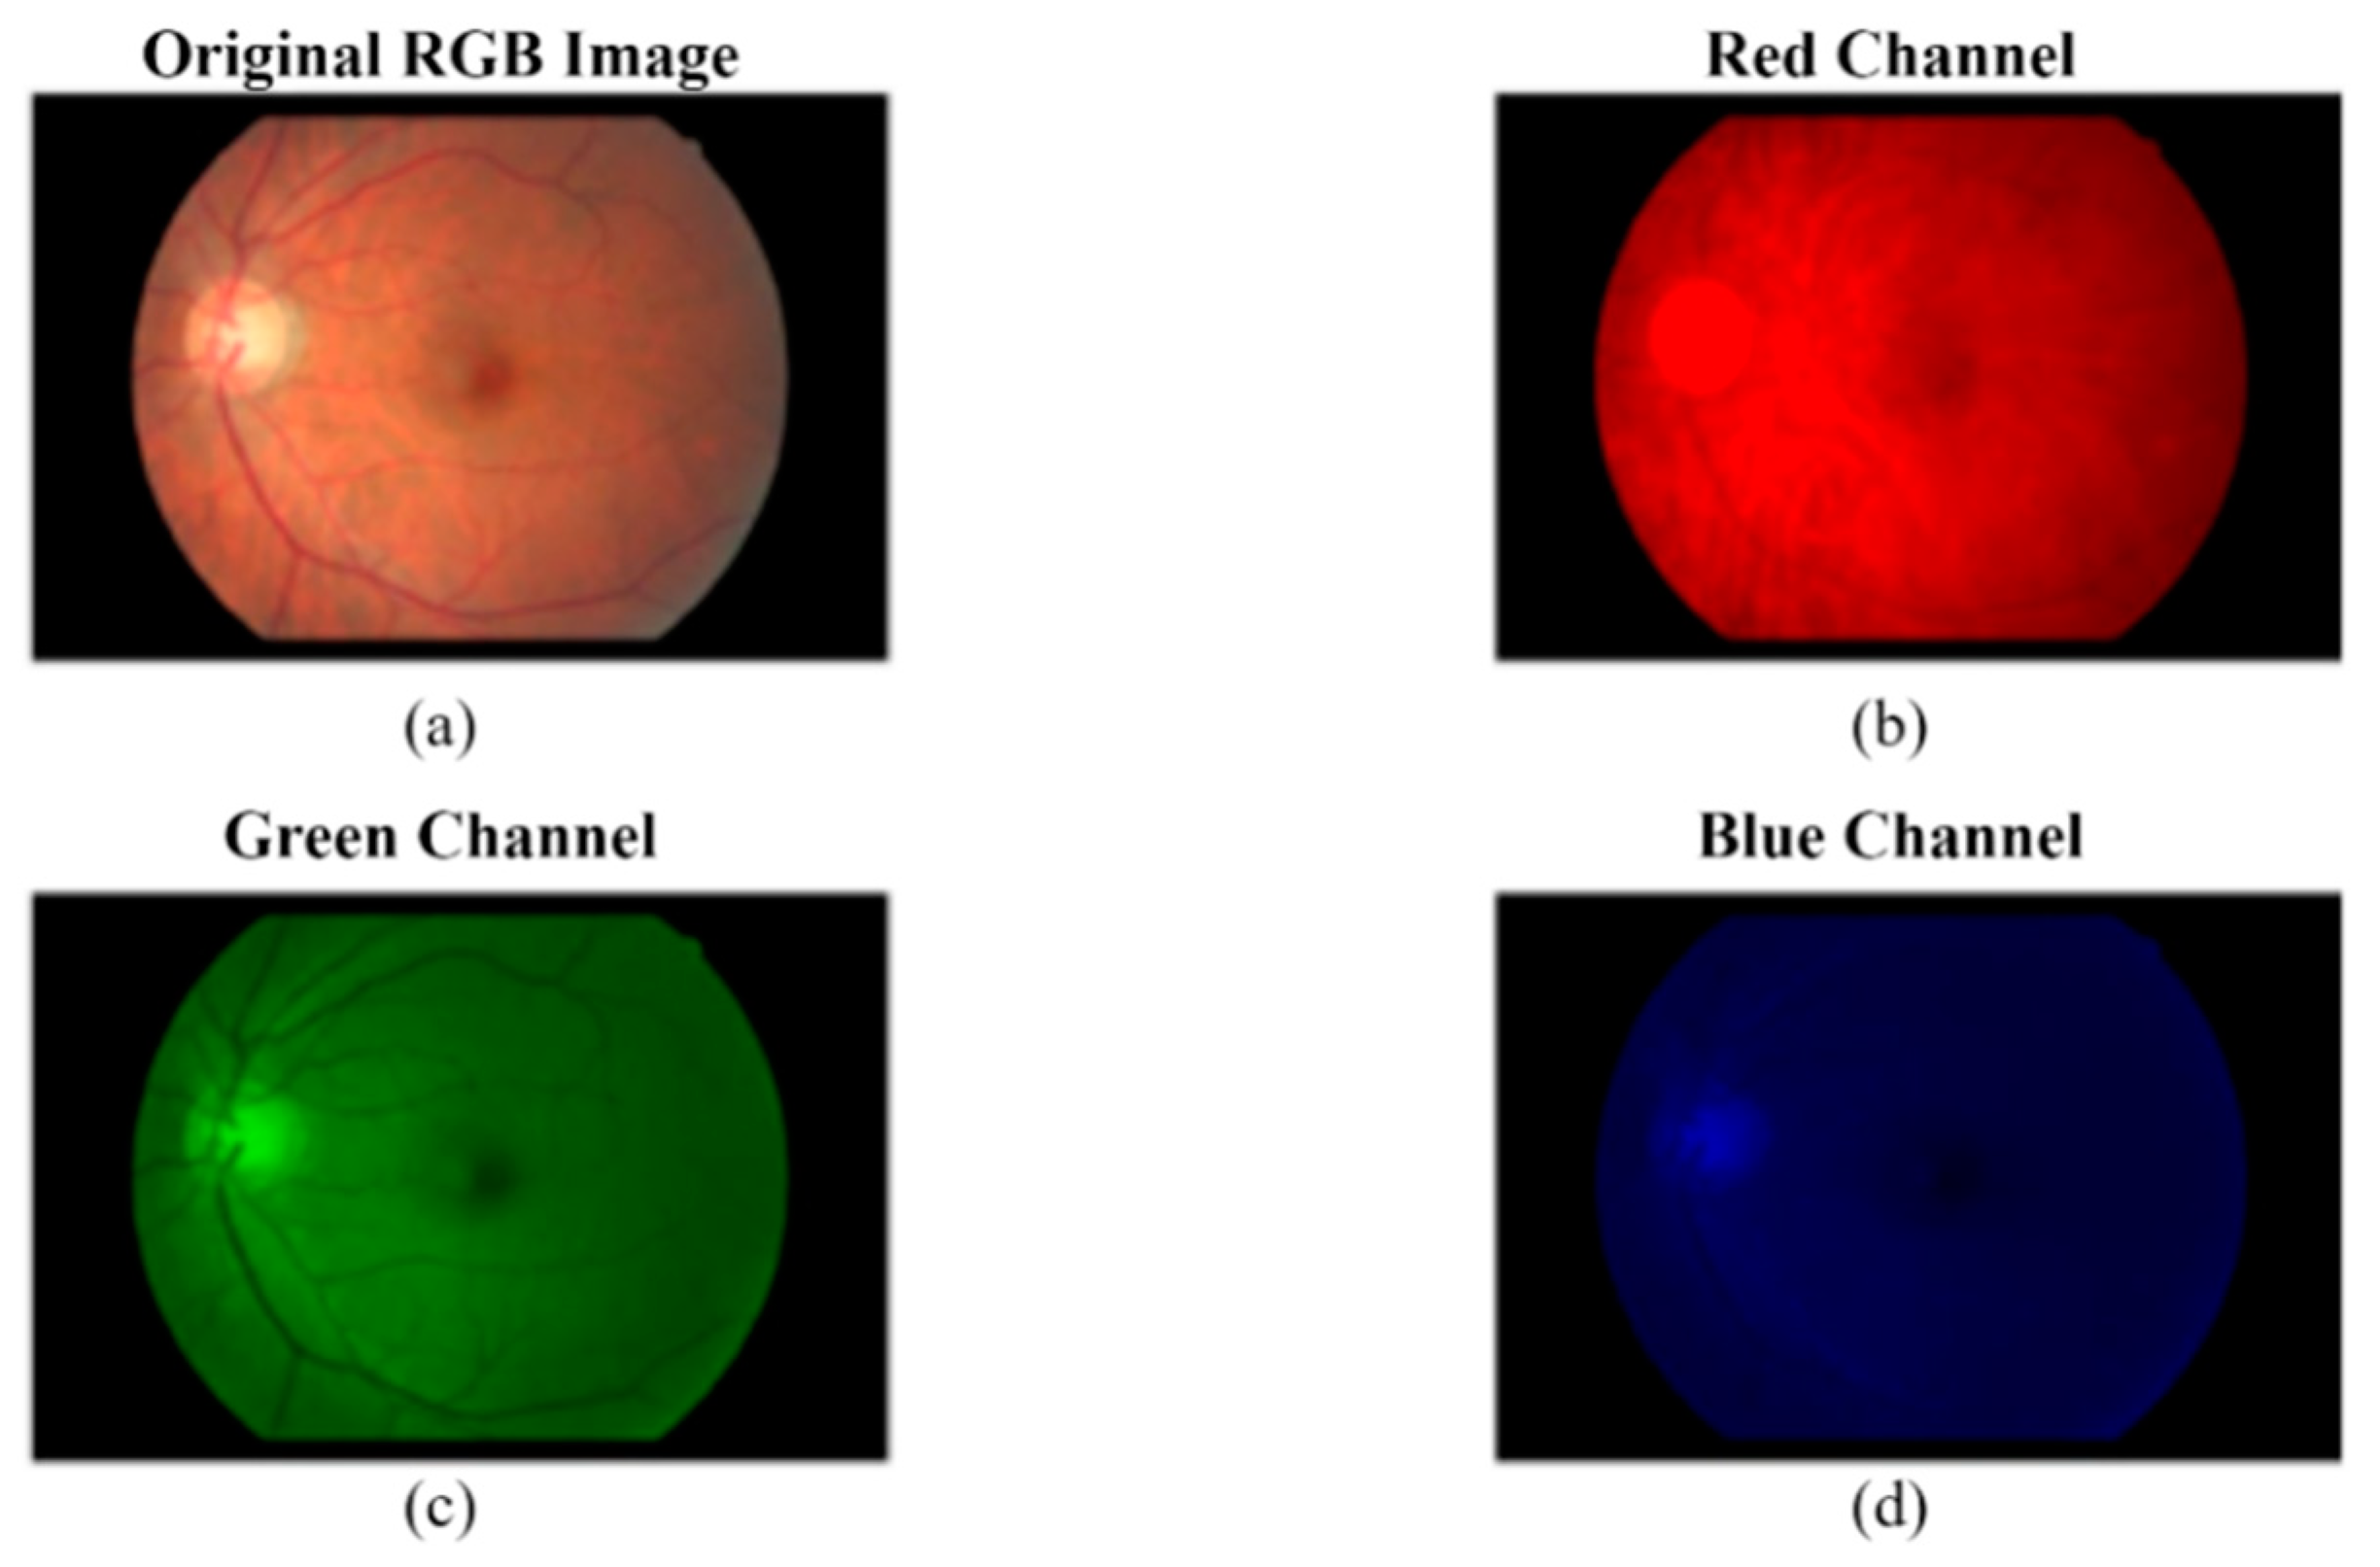
4.1.1. Preprocessing
4.1.2. Data Augmentation
- Rotation: Images were rotated from 0 to 360 degrees at random.
- Shearing: Sheared at a random angle ranging from 20 to 200 degrees.
- Image flipping: Images were flipped horizontally and vertically.
- Zoom: Images were randomly stretched in the (1/1.3, 1.3) range.
- Cropping: At random, images were shrunk to 85–95% of their original length.
- Image translation: Images were randomly moved between −25 and 25 pixels.
4.2. Optic Disc (OD) and Blood Vessel (BV) Segmentation
4.3. Dimensionality Reduction Using CNN-SVD
4.3.1. Feature Extraction by CNN from FIs
4.3.2. Features Reduction by SVD
4.4. Transfer Learning Models
4.4.1. Standard Classifiers
4.4.2. Experimental Configuration
4.5. Performance Evaluation Metrics
5. Results and Discussion
6. Conclusions
Author Contributions
Funding
Institutional Review Board Statement
Informed Consent Statement
Data Availability Statement
Conflicts of Interest
References
- Kauppi, T.; Kalesnykiene, V.; Kamarainen, J.K.; Lensu, L.; Sorri, I.; Raninen, A.; Voutilainen, R.; Pietilä, J.; Kälviäinen, H.; Uusitalo, H. The DIARETDB1 diabetic retinopathy database and evaluation protocol. In Proceedings of the British Machine Vision Conference, Coventry, UK, 10–13 September 2007. [Google Scholar] [CrossRef]
- Kayal, D.; Banerjee, S. A new dynamic thresholding based technique for detection of hard exudates in digital retinal fundus image. In Proceedings of the 2014 International Conference on Signal Processing and Integrated Networks (SPIN), Noida, India, 20–21 February 2014. [Google Scholar] [CrossRef]
- Shaban, M.; Mahmoud, A.H.; Shalaby, A.; Ghazal, M.; Sandhu, H.; El-Baz, A. Low-complexity computer-aided diagnosis for diabetic retinopathy. In Diabetes and Retinopathy; Elsevier: Amsterdam, The Netherlands, 2020. [Google Scholar] [CrossRef]
- Kanimozhi, J.; Vasuki, P.; Roomi, S.M.M. Fundus image lesion detection algorithm for diabetic retinopathy screening. J. Ambient. Intell. Humaniz. Comput. 2020, 12, 7407–7416. [Google Scholar] [CrossRef]
- Manjaramkar, A.; Kokare, M. Automated Red Lesion Detection: An Overview. In Advances in Intelligent Systems and Computing; Springer: Singapore, 2020; Volume 1089. [Google Scholar] [CrossRef]
- Rawat, W.; Wang, Z. Deep convolutional neural networks for image classification: A comprehensive review. Neural Comput. 2017, 29, 2352–2449. [Google Scholar] [CrossRef] [PubMed]
- Saleh, M.D.; Eswaran, C. An automated decision-support system for non-proliferative diabetic retinopathy disease based on MAs and HAs detection. Comput. Methods Programs Biomed. 2012, 108, 186–196. [Google Scholar] [CrossRef]
- Lachure, J.; Deorankar, A.; Lachure, S.; Gupta, S.; Jadhav, R. Diabetic Retinopathy using morphological operations and machine learning. In Proceedings of the 2015 IEEE International Advance Computing Conference (IACC), Banglore, India, 12–13 June 2015. [Google Scholar] [CrossRef]
- Wang, L.; Liu, H.; Lu, Y.; Chen, H.; Zhang, J.; Pu, J. A coarse-to-fine deep learning framework for optic disc segmentation in fundus images. Biomed. Signal Process. Control 2019, 51, 82–89. [Google Scholar] [CrossRef] [PubMed]
- Kwasigroch, A.; Jarzembinski, B.; Grochowski, M. Deep CNN based decision support system for detection and assessing the stage of diabetic retinopathy. In Proceedings of the 2018 International Interdisciplinary PhD Workshop (IIPhDW), Swinoujscie, Poland, 9–12 May 2018. [Google Scholar] [CrossRef]
- Dehghani, A.; Moin, M.-S.; Saghafi, M. Localization of the optic disc center in retinal images based on the Harris corner detector. Biomed. Eng. Lett. 2012, 2, 198–206. [Google Scholar] [CrossRef]
- Zhang, W.; Wu, Y.; Yang, B.; Hu, S.; Wu, L.; Dhelim, S. Overview of multi-modal brain tumor mr image segmentation. Healthcare 2021, 9, 1051. [Google Scholar] [CrossRef]
- Qomariah, D.; Nopember, I.T.S.; Tjandrasa, H.; Fatichah, C. Segmentation of Microaneurysms for Early Detection of Diabetic Retinopathy using MResUNet. Int. J. Intell. Eng. Syst. 2021, 14, 359–373. [Google Scholar] [CrossRef]
- Walter, T.; Klein, J.-C.; Massin, P.; Erginay, A. A contribution of image processing to the diagnosis of diabetic retinopathy—Detection of exudates in color fundus images of the human retina. IEEE Trans. Med. Imaging 2002, 21, 1236–1243. [Google Scholar] [CrossRef]
- Zhou, W.; Yi, Y.; Gao, Y.; Dai, J. Optic Disc and Cup Segmentation in Retinal Images for Glaucoma Diagnosis by Locally Statistical Active Contour Model with Structure Prior. Comput. Math. Methods Med. 2019, 2019, 1–16. [Google Scholar] [CrossRef]
- Bilal, A.; Sun, G.; Mazhar, S. Survey on recent developments in automatic detection of diabetic retinopathy. J. Fr. Ophtalmol. 2021, 44, 420–440. [Google Scholar] [CrossRef]
- Sopharak, A.; Uyyanonvara, B.; Barman, S. Automatic microaneurysm detection from non-dilated diabetic retinopathy retinal images using mathematical morphology methods. IAENG Int. J. Comput. Sci. 2011, 38, 295–301. [Google Scholar]
- Lam, C.; Yu, C.; Huang, L.; Rubin, D. Retinal lesion detection with deep learning using image patches. Investig. Ophthalmol. Vis. Sci. 2018, 59, 590–596. [Google Scholar] [CrossRef] [PubMed]
- Jaya, T.; Dheeba, J.; Singh, N.A. Detection of Hard Exudates in Colour Fundus Images Using Fuzzy Support Vector Machine-Based Expert System. J. Digit. Imaging 2015, 28, 761–768. [Google Scholar] [CrossRef] [PubMed]
- Liu, Q.; Zou, B.; Chen, J.; Ke, W.; Yue, K.; Chen, Z.; Zhao, G. A location-to-segmentation strategy for automatic exudate segmentation in colour retinal fundus images. Comput. Med. Imaging Graph. 2017, 55, 78–86. [Google Scholar] [CrossRef] [PubMed]
- Zhang, X.; Thibault, G.; Decencière, E.; Marcotegui, B.; Laӱ, B.; Danno, R.; Cazuguel, G.; Quellec, G.; Lamard, M.; Massin, P.; et al. Exudate detection in color retinal images for mass screening of diabetic retinopathy. Med. Image Anal. 2014, 18, 1026–1043. [Google Scholar] [CrossRef]
- Fraz, M.M.; Jahangir, W.; Zahid, S.; Hamayun, M.M.; Barman, S.A. Multiscale segmentation of exudates in retinal images using contextual cues and ensemble classification. Biomed. Signal Process. Control 2017, 35, 50–62. [Google Scholar] [CrossRef]
- Srivastava, R.; Wong, D.W.; Duan, L.; Liu, J.; Wong, T.Y. Red lesion detection in retinal fundus images using Frangi-based filters. In Proceedings of the Annual International Conference of the IEEE Engineering in Medicine and Biology Society (EMBS 2015), Milan, Italy, 25–29 August 2015. [Google Scholar] [CrossRef]
- Bilal, A.; Sun, G.; Li, Y.; Mazhar, S.; Khan, A.Q. Diabetic Retinopathy Detection and Classification Using Mixed Models for a Disease Grading Database. IEEE Access 2021, 9, 23544–23553. [Google Scholar] [CrossRef]
- Krishna, N.V.; Reddy, N.V.; Ramana, M.V.; Kumar, E.P. The communal system for early detection microaneurysm and diabetic retinopathy grading through color fundus images. Int. J. Sci. Eng. Technol. 2013, 2, 228–232. [Google Scholar]
- Khojasteh, P.; Júnior, L.A.P.; Carvalho, T.; Rezende, E.; Aliahmad, B.; Papa, J.P.; Kumar, D.K. Exudate detection in fundus images using deeply-learnable features. Comput. Biol. Med. 2019, 104, 62–69. [Google Scholar] [CrossRef]
- Seth, S.; Agarwal, B. A hybrid deep learning model for detecting diabetic retinopathy. J. Stat. Manag. Syst. 2018, 21, 569–574. [Google Scholar] [CrossRef]
- Li, Y.H.; Yeh, N.N.; Chen, S.J.; Chung, Y.C. Assisted diagnosis for diabetic retinopathy based on fundus images using deep convolutional neural network. Mob. Inf. Syst. 2019, 2019, 6142839. [Google Scholar] [CrossRef]
- Prentasic, P.; Loncaric, S. Detection of exudates in fundus photographs using convolutional neural networks. In Proceedings of the 2015 9th International Symposium on Image and Signal Processing and Analysis (ISPA), Zagreb, Croatia, 7–9 September 2015. [Google Scholar] [CrossRef]
- Harangi, B.; Lazar, I.; Hajdu, A. Automatic exudate detection using active contour model and regionwise classification. In Proceedings of the 2012 Annual International Conference of the IEEE Engineering in Medicine and Biology Society, San Diego, CA, USA, 28 August–1 September 2012. [Google Scholar] [CrossRef]
- Bilal, A.; Sun, G.; Mazhar, S.; Imran, A.; Latif, J. A Transfer Learning and U-Net-based automatic detection of diabetic retinopathy from fundus images. Comput. Methods Biomech. Biomed. Eng. Imaging Vis. 2022, 1–12. [Google Scholar] [CrossRef]
- Mahapatra, D.; Roy, P.K.; Sedai, S.; Garnavi, R. Retinal image quality classification using saliency maps and CNNs. In Lecture Notes in Computer Science (Including Subseries Lecture Notes in Artificial Intelligence and Lecture Notes in Bioinformatics); Springer: Cham, Switzerland, 2016; Volume 10019. [Google Scholar] [CrossRef]
- Chen, W.; Yang, B.; Li, J.; Wang, J. An approach to detecting diabetic retinopathy based on integrated shallow convolutional neural networks. IEEE Access 2020, 8, 178552–178562. [Google Scholar] [CrossRef]
- Bilal, A.; Sun, G.; Mazhar, S. Diabetic Retinopathy detection using Weighted Filters and Classification using CNN. In Proceedings of the 2021 International Conference on Intelligent Technologies (CONIT), Hubli, India, 25–27 June 2021. [Google Scholar] [CrossRef]
- Bilal, A.; Sun, G.; Mazhar, S.; Imran, A. Improved Grey Wolf Optimization-Based Feature Selection and Classification Using CNN for Diabetic Retinopathy Detection. In Evolutionary Computing and Mobile Sustainable Networks; Lecture Notes on Data Engineering and Communications Technologies; Springer: Singapore, 2022; Volume 116, pp. 1–14. [Google Scholar] [CrossRef]
- Liu, Y.-P.; Li, Z.; Xu, C.; Li, J.; Liang, R. Referable diabetic retinopathy identification from eye fundus images with weighted path for convolutional neural network. Artif. Intell. Med. 2019, 99, 101694. [Google Scholar] [CrossRef] [PubMed]
- EyePACS-1. The World of Eyepacs. 2015. Available online: http://www.eyepacs.com (accessed on 10 February 2022).
- Decencière, E.; Zhang, X.; Cazuguel, G.; Lay, B.; Cochener, B.; Trone, C.; Gain, P.; Ordóñez-Varela, J.-R.; Massin, P.; Erginay, A.; et al. Feedback on a publicly distributed image database: The Messidor database. Image Anal. Stereol. 2014, 33, 231–234. [Google Scholar] [CrossRef]
- Kauppi, T.; Kalesnykiene, V.; Kamarainen, J.K.; Lensu, L.; Sorri, I.; Uusitalo, H.; Kälviäinen, H.; Pietilä, J. DIARETDB0: Evaluation Database and Methodology for Diabetic Retinopathy Algorithms; Lappeenranta University of Technology: Lappeenranta, Finland, 2006. [Google Scholar]
- Dunnhofer, M.; Antico, M.; Sasazawa, F.; Takeda, Y.; Camps, S.; Martinel, N.; Micheloni, C.; Carneiro, G.; Fontanarosa, D. Siam-U-Net: Encoder-decoder siamese network for knee cartilage tracking in ultrasound images. Med. Image Anal. 2020, 60, 101631. [Google Scholar] [CrossRef]
- Karimi, D.; Zeng, Q.; Mathur, P.; Avinash, A.; Mahdavi, S.; Spadinger, I.; Abolmaesumi, P.; Salcudean, S.E. Accurate and robust deep learning-based segmentation of the prostate clinical target volume in ultrasound images. Med. Image Anal. 2019, 57, 186–196. [Google Scholar] [CrossRef]
- Ioffe, S.; Szegedy, C. Batch normalization: Accelerating deep network training by reducing internal covariate shift. In Proceedings of the 32nd International Conference on Machine Learning, ICML 2015, Lille, France, 6–11 July 2015; Volume 1. [Google Scholar]
- Mittal, S. A survey of FPGA-based accelerators for convolutional neural networks. Neural Comput. Appl. 2020, 32, 1109–1139. [Google Scholar] [CrossRef]
- Ciregan, D.; Meier, U.; Schmidhuber, J. Multi-column deep neural networks for image classification. In Proceedings of the 2012 IEEE Conference on Computer Vision and Pattern Recognition, Providence, RI, USA, 16–21 June 2012. [Google Scholar] [CrossRef]
- Karoly, P.; Ruehlman, L.S. Psychological ‘resilience’ and its correlates in chronic pain: Findings from a national community sample. Pain 2006, 123, 90–97. [Google Scholar] [CrossRef]
- Gómez-Valverde, J.J.; Antón, A.; Fatti, G.; Liefers, B.; Herranz, A.; Santos, A.; Sánchez, C.I.; Ledesma-Carbayo, M.J. Automatic glaucoma classification using color fundus images based on convolutional neural networks and transfer learning. Biomed. Opt. Express 2019, 10, 892–913. [Google Scholar] [CrossRef]
- Szegedy, C.; Vanhoucke, V.; Ioffe, S.; Shlens, J.; Wojna, Z. Rethinking the Inception Architecture for Computer Vision. In Proceedings of the IEEE Computer Society Conference on Computer Vision and Pattern Recognition, Las Vegas, NV, USA, 27–30 June 2016. [Google Scholar] [CrossRef]
- Szegedy, C.; Liu, W.; Jia, Y.; Sermanet, P.; Reed, S.; Anguelov, D.; Erhan, D.; Vanhoucke, V.; Rabinovich, A. Going deeper with convolutions. In Proceedings of the IEEE Computer Society Conference on Computer Vision and Pattern Recognition, Boston, MA, USA, 7–12 June 2015. [Google Scholar] [CrossRef]
- Krizhevsky, A.; Sutskever, I.; Hinton, G.E. ImageNet classification with deep convolutional neural networks. Commun. ACM 2017, 60, 84–90. [Google Scholar] [CrossRef]
- He, K.; Zhang, X.; Ren, S.; Sun, J. Deep residual learning for image recognition. In Proceedings of the IEEE Computer Society Conference on Computer Vision and Pattern Recognition, Las Vegas, NV, USA, 27–30 June 2016. [Google Scholar] [CrossRef]
- Deng, J.; Dong, W.; Socher, R.; Li, L.-J.; Li, K.; Li, F.-F. ImageNet: A large-scale hierarchical image database. In Proceedings of the 2009 IEEE Conference on Computer Vision and Pattern Recognition, Miami, FL, USA, 20–25 June 2010. [Google Scholar] [CrossRef]
- Imran, A.; Li, J.; Pei, Y.; Akhtar, F.; Yang, J.-J.; Dang, Y. Automated identification of cataract severity using retinal fundus images. Comput. Methods Biomech. Biomed. Eng. Imaging Vis. 2020, 8, 691–698. [Google Scholar] [CrossRef]
- Shayma’a, A.H.; Sayed, M.S.; Abdalla, M.I.; Rashwan, M.A. Breast cancer masses classification using deep convolutional neural networks and transfer learning. Multimed. Tools Appl. 2020, 79, 30735–30768. [Google Scholar] [CrossRef]
- Hemelings, R.; Elen, B.; Barbosa-Breda, J.; Lemmens, S.; Meire, M.; Pourjavan, S.; Vandewalle, E.; Van De Veire, S.; Blaschko, M.B.; De Boever, P.; et al. Accurate prediction of glaucoma from colour fundus images with a convolutional neural network that relies on active and transfer learning. Acta Ophthalmol. 2020, 98, e94–e100. [Google Scholar] [CrossRef]
- Grubbs, F.E. Errors of Measurement, Precision, Accuracy and the Statistical Comparison of Measuring Instruments. Technometrics 1973, 15, 53–66. [Google Scholar] [CrossRef]
- Sharma, M.; Sharma, S.; Singh, G. Performance analysis of statistical and supervised learning techniques in stock data mining. Data 2018, 3, 54. [Google Scholar] [CrossRef]


| Class | Severity Grade | Messidor-2 | EyePACS-1 | DIARETDB0 |
|---|---|---|---|---|
| 0 | Normal | 1017 | 7552 | 20 |
| 1 | Mild | 270 | 842 | 50 |
| 2 | Moderate | 347 | 545 | 35 |
| 3 | Severe | 75 | 54 | 15 |
| 4 | PDR | 35 | 95 | 10 |
| M | 0.90 |
| B.S | 64 |
| L.R | 0.001 |
| W.D | 0.005 |
| OPT | ADAM |
| L.F | Categorical Cross-Entropy |
| DO | 0.5 |
| C.W | [−1,1] |
| E | 100 |
| Model | Accuracy | Sensitivity | Precision | Specificity | F1-Score | AUC |
|---|---|---|---|---|---|---|
| Inception-V3 | 0.9792 | 0.9694 | 0.9744 | 0.969 | 0.9710 | 0.9798 |
| GoogLeNet | 0.9615 | 0.9475 | 0.945 | 0.9622 | 0.9339 | 0.9815 |
| AlexNet | 0.9570 | 0.9308 | 0.9375 | 0.9439 | 0.9254 | 0.9748 |
| ResNet | 0.969 | 0.9381 | 0.9595 | 0.9615 | 0.9469 | 0.9705 |
| Model | Accuracy | Sensitivity | Precision | Specificity | F1-Score | AUC |
|---|---|---|---|---|---|---|
| Inception-V3 | 0.9459 | 0.9481 | 0.9512 | 0.9435 | 0.9299 | 0.969 |
| GoogLeNet | 0.9375 | 0.943 | 0.923 | 0.9266 | 0.903 | 0.964 |
| AlexNet | 0.9315 | 0.9305 | 0.92 | 0.9234 | 0.9181 | 0.961 |
| ResNet | 0.94 | 0.933 | 0.9415 | 0.937 | 0.9365 | 0.97 |
| Model | Accuracy | Sensitivity | Precision | Specificity | F1-Score | AUC |
|---|---|---|---|---|---|---|
| Inception-V3 | 0.9352 | 0.9312 | 0.9232 | 0.9099 | 0.9122 | 0.949 |
| GoogLeNet | 0.9205 | 0.9074 | 0.9225 | 0.9222 | 0.917 | 0.947 |
| AlexNet | 0.913 | 0.9008 | 0.9175 | 0.919 | 0.91 | 0.944 |
| ResNet | 0.9245 | 0.9138 | 0.935 | 0.9196 | 0.922 | 0.955 |
| Model | Accuracy | Precision | F-1 Score | Number of Images |
|---|---|---|---|---|
| CNN + SVM [27] | - | 0.93 | - | 35,126 |
| Shallow CNN [28] | 0.805 | - | 0.85 | 5000 |
| ShallowNet + MI/VI/PI [33] | 0.87 | - | - | 35,000 |
| 0.9 | ||||
| 0.92 | ||||
| VGG16 without FV [33] | 0.93 | 0.83 | 35,000 | |
| LCNN [33] | 0.89 | - | - | 35,000 |
| LC-CNN [3] | 0.884 | - | - | 1748 |
| Am-InveptionV3[37] | 0.944 | 0.989 | 0.94 | 3662 |
| Proposed Method (CNN + SVD + Inception-V3) | 0.9792 | 0.9744 | 0.9710 | 10,966 |
Publisher’s Note: MDPI stays neutral with regard to jurisdictional claims in published maps and institutional affiliations. |
© 2022 by the authors. Licensee MDPI, Basel, Switzerland. This article is an open access article distributed under the terms and conditions of the Creative Commons Attribution (CC BY) license (https://creativecommons.org/licenses/by/4.0/).
Share and Cite
Bilal, A.; Zhu, L.; Deng, A.; Lu, H.; Wu, N. AI-Based Automatic Detection and Classification of Diabetic Retinopathy Using U-Net and Deep Learning. Symmetry 2022, 14, 1427. https://doi.org/10.3390/sym14071427
Bilal A, Zhu L, Deng A, Lu H, Wu N. AI-Based Automatic Detection and Classification of Diabetic Retinopathy Using U-Net and Deep Learning. Symmetry. 2022; 14(7):1427. https://doi.org/10.3390/sym14071427
Chicago/Turabian StyleBilal, Anas, Liucun Zhu, Anan Deng, Huihui Lu, and Ning Wu. 2022. "AI-Based Automatic Detection and Classification of Diabetic Retinopathy Using U-Net and Deep Learning" Symmetry 14, no. 7: 1427. https://doi.org/10.3390/sym14071427
APA StyleBilal, A., Zhu, L., Deng, A., Lu, H., & Wu, N. (2022). AI-Based Automatic Detection and Classification of Diabetic Retinopathy Using U-Net and Deep Learning. Symmetry, 14(7), 1427. https://doi.org/10.3390/sym14071427