Abstract
Intracranial aneurysms represent a potentially life-threatening condition and occur in 3–5% of the population. They are increasingly diagnosed due to the broad application of cranial magnetic resonance imaging and computed tomography in the context of headaches, vertigo, and other unspecific symptoms. For each affected individual, it is utterly important to estimate the rupture risk of the respective aneurysm. However, clinically applied decision tools, such as the PHASES score, remain insufficient. Therefore, a machine learning approach assessing the rupture risk of intracranial aneurysms is proposed in our study. For training and evaluation of the algorithm, data from a single neurovascular center was used, comprising 446 aneurysms (221 ruptured, 225 unruptured). The machine learning model was then compared with the PHASES score and proved superior in accuracy (0.7825), F1-score (0.7975), sensitivity (0.8643), specificity (0.7022), positive predictive value (0.7403), negative predictive value (0.8404), and area under the curve (0.8639). The frequency distributions of the predicted rupture probabilities and the PHASES score were analyzed. A symmetry can be observed between the rupture probabilities, with a symmetry axis at 0.5. A feature importance analysis reveals that the body mass index, consumption of anticoagulants, and harboring vessel are regarded as the most important features when assessing the rupture risk. On the other hand, the size of the aneurysm, which is weighted most in the PHASES score, is regarded as less important. Based on our findings we discuss the potential role of the model for clinical practice in geographically confined aneurysm patients.
1. Introduction
Unruptured intracranial aneurysms (UIAs) occur in approximately 3% of the population [1] and represent one of the most common unexpected findings in brain imaging studies of healthy subjects [2]. Related to the increased availability of cranial magnetic resonance imaging (cMRI) for the workup of relatively unspecific but common central nervous system (CNS) symptoms, such as vertigo, headaches, and impaired memory, UIAs have been diagnosed much more frequently in recent years. They may remain clinically silent for years to decades, they can manifest with focal neurological deficits due to their space-occupying effects, or they might rupture and cause subarachnoid hemorrhage (SAH). Although only a minority of UIAs will eventually rupture, the consequences are grave—12.4% of all SAH patients will succumb to the hemorrhage prior to reaching a hospital [3] and only 55% recover in a way that functional independence is regained [4]. Therefore, UIAs represent a potentially life-threatening condition and the risk of the individual UIA must be weighted against the risk of preventive treatment, which is associated with significant morbidity or mortality in approximately 4% and, hence, is non-negligible [5].
As a consequence, estimating the risk of rupture of an UIA is crucial for the decision as to whether to perform preventive treatment or to watch and wait. A number of studies have therefore investigated factors that are linked to rupture [6]. Among others, the size of the aneurysm, the presence of daughter aneurysms, or irregular outpouches, the specific location in the cerebral vessels, active smoking, elevated blood pressure, and the patients age have been identified as most significant [7]. Nevertheless, there is ongoing controversy regarding the suitability of each of those factors for risk prediction [8]. Based on those factors, a number of clinical scoring systems, such as the PHASES and UIATS score [9,10], have been developed with the aim to aid optimal decision making in neurovascular procedures. However, exemplarily related to the ethnic and biological differences between the patients treated in a local neurovascular center and the patients included in trans-continental multi-center studies, the appropriateness of those scores for the counseling of individual patients has been recently questioned [11,12].
Artificial intelligence (AI) is increasingly implemented into the clinical routine as an adjunct for physicians in order to increase diagnostic accuracy and reduce workload [13]. The performance of AI technologies, in particular machine learning (ML) in context of rupture risk stratification, is also promising [14], but clinical evidence is scarce and studies in this context are wanted. Our study therefore aims to investigate the potential and performance of a machine learning approach for the prediction of the UIA rupture risk based on a cohort of 421 aneurysm patients treated in a single neurovascular center.
2. Materials and Methods
2.1. Data Acquisition
In four complete consecutive years (2014 to 2017), data were assessed from 221 patients who had suffered an aneurysmal SAH as well as 200 patients who presented to the outpatient clinic for UIA diagnosis. Taken together, this resulted in a data set of 446 aneurysms (221 ruptured and 225 unruptured, including 25 patients with 2 aneurysms).
Patient records were obtained during outpatient follow-up visits and from the intensive care unit database. The retrospective time frame spanned from 1997 to 2017, beginning with an UIA in January 1997 and an aneurysmal SAH in January 1998. The raw data in the form of patient histories and images were gathered retrospectively and exclusively at University Hospital Leipzig.
2.2. Clinical Features
The information documented for the above patient cohort includes clinical features. Some of these are general, patient-specific features, which are known to be accompanying risk factors: age, body mass index (BMI), sex, hypertension, diabetes mellitus, the consumption of anticoagulants, or nicotine. Furthermore, aneurysm-specific features were used: the length (and width) of the aneurysm manually measured as the diameter vertically to the harbouring vessel (resp. parallel to the harbouring vessel), the harbouring vessel itself, the shape of the aneurysm, the PHASES score, the number of intracranial aneurysms, and vascular anomalies. Cerebral vessel imaging was reviewed for concurrent vascular anomalies, such as atherosclerotic changes or dysplastic or aberrant vessel formations.
Aneurysm shapes were stratified into four groups, the berry-like “saccular” shape with a narrow neck, and the saccular shape with a broad neck “saccular broad-based”, defined as the diameter of the neck being larger than the diameter of the harbouring vessel. Third, the “irregular” shape comprised aneurysm domes with satellite aneurysms or blebs, as well as lobulated forms and wall indentations. Fourth, the fusiform “blister-like” shape. To put the aneurysm length and width into proportion, additionally the width divided by the length was added to the set of features. Missing entries regarding the above numerical features were substituted by the mean. For categorical features, one-hot encoding was performed with pandas and missing entries were ignored [15,16].
2.3. Gradient Boosting Machine
A gradient boosting machine (implementation taken from the library scikit-learn [17]) is a modern and popular machine learning algorithm for classification and regression. It creates multiple decision trees and combines their results for the final prediction. We applied it in this context to stratify aneurysms with a high and low risk of rupture. How the algorithm learns can be controlled via so-called hyperparameters. We combined hyperparameter tuning with a stratified five-fold cross validation and grid search to find the parameters with the highest accuracy on unseen data (Table 1). This best hyperparameter combination was subsequently used to train the final gradient boosting models (again with five-fold cross validation). These final models output a value for each aneurysm in the test data set (which has not been seen by the respective model during training). By varying the threshold and classifying the values as aneurysms with a high risk of rupture and the values as aneurysms with a low risk of rupture, a ROC curve can be obtained for each fold. Since the validation was conducted on data that had not been seen during training in each of the five-folds, the results of the folds could then be combined in a total ROC curve.
Table 1.
Used hyperparameters and their search space as a bounded domain of hyperparameter values. They refer to the scikit-learn implementation. The optimal hyperparameters for the prediction model were found using grid search.
2.4. Evaluation
To make the gradient boosting model comparable to the PHASES score, we determined a threshold such that the model had at least the sensitivity of the PHASES score (which is one of its strengths). This allows an easier comparison of all other statistical measures (accuracy, F1-score, specificity, positive predictive value (PPV), and negative predictive value (NPV)) between the model and the PHASES score. Bijlenga et al. [18] stated that patients with a PHASES score ≥ 4 were more likely to be treated, whereas a score < 4 was predictive for observation. This PHASES threshold was applied for rupture prediction on aneurysms where the PHASES score information was available (437 in total). We also compared the total ROC curve of the gradient boosting model and the PHASES score as well as the areas under the curve (AUC). The difference was tested for significance using the pROC R package and its bootstrapping method roc.test [19].
In order to estimate the influence of each feature on the model prediction result, the feature importances (based on the Gini criterion [20,21]) were computed. Roughly speaking, this measures how homogeneously a feature splits the data, summed over all splits in a decision tree and averaged over all decision trees.
3. Results
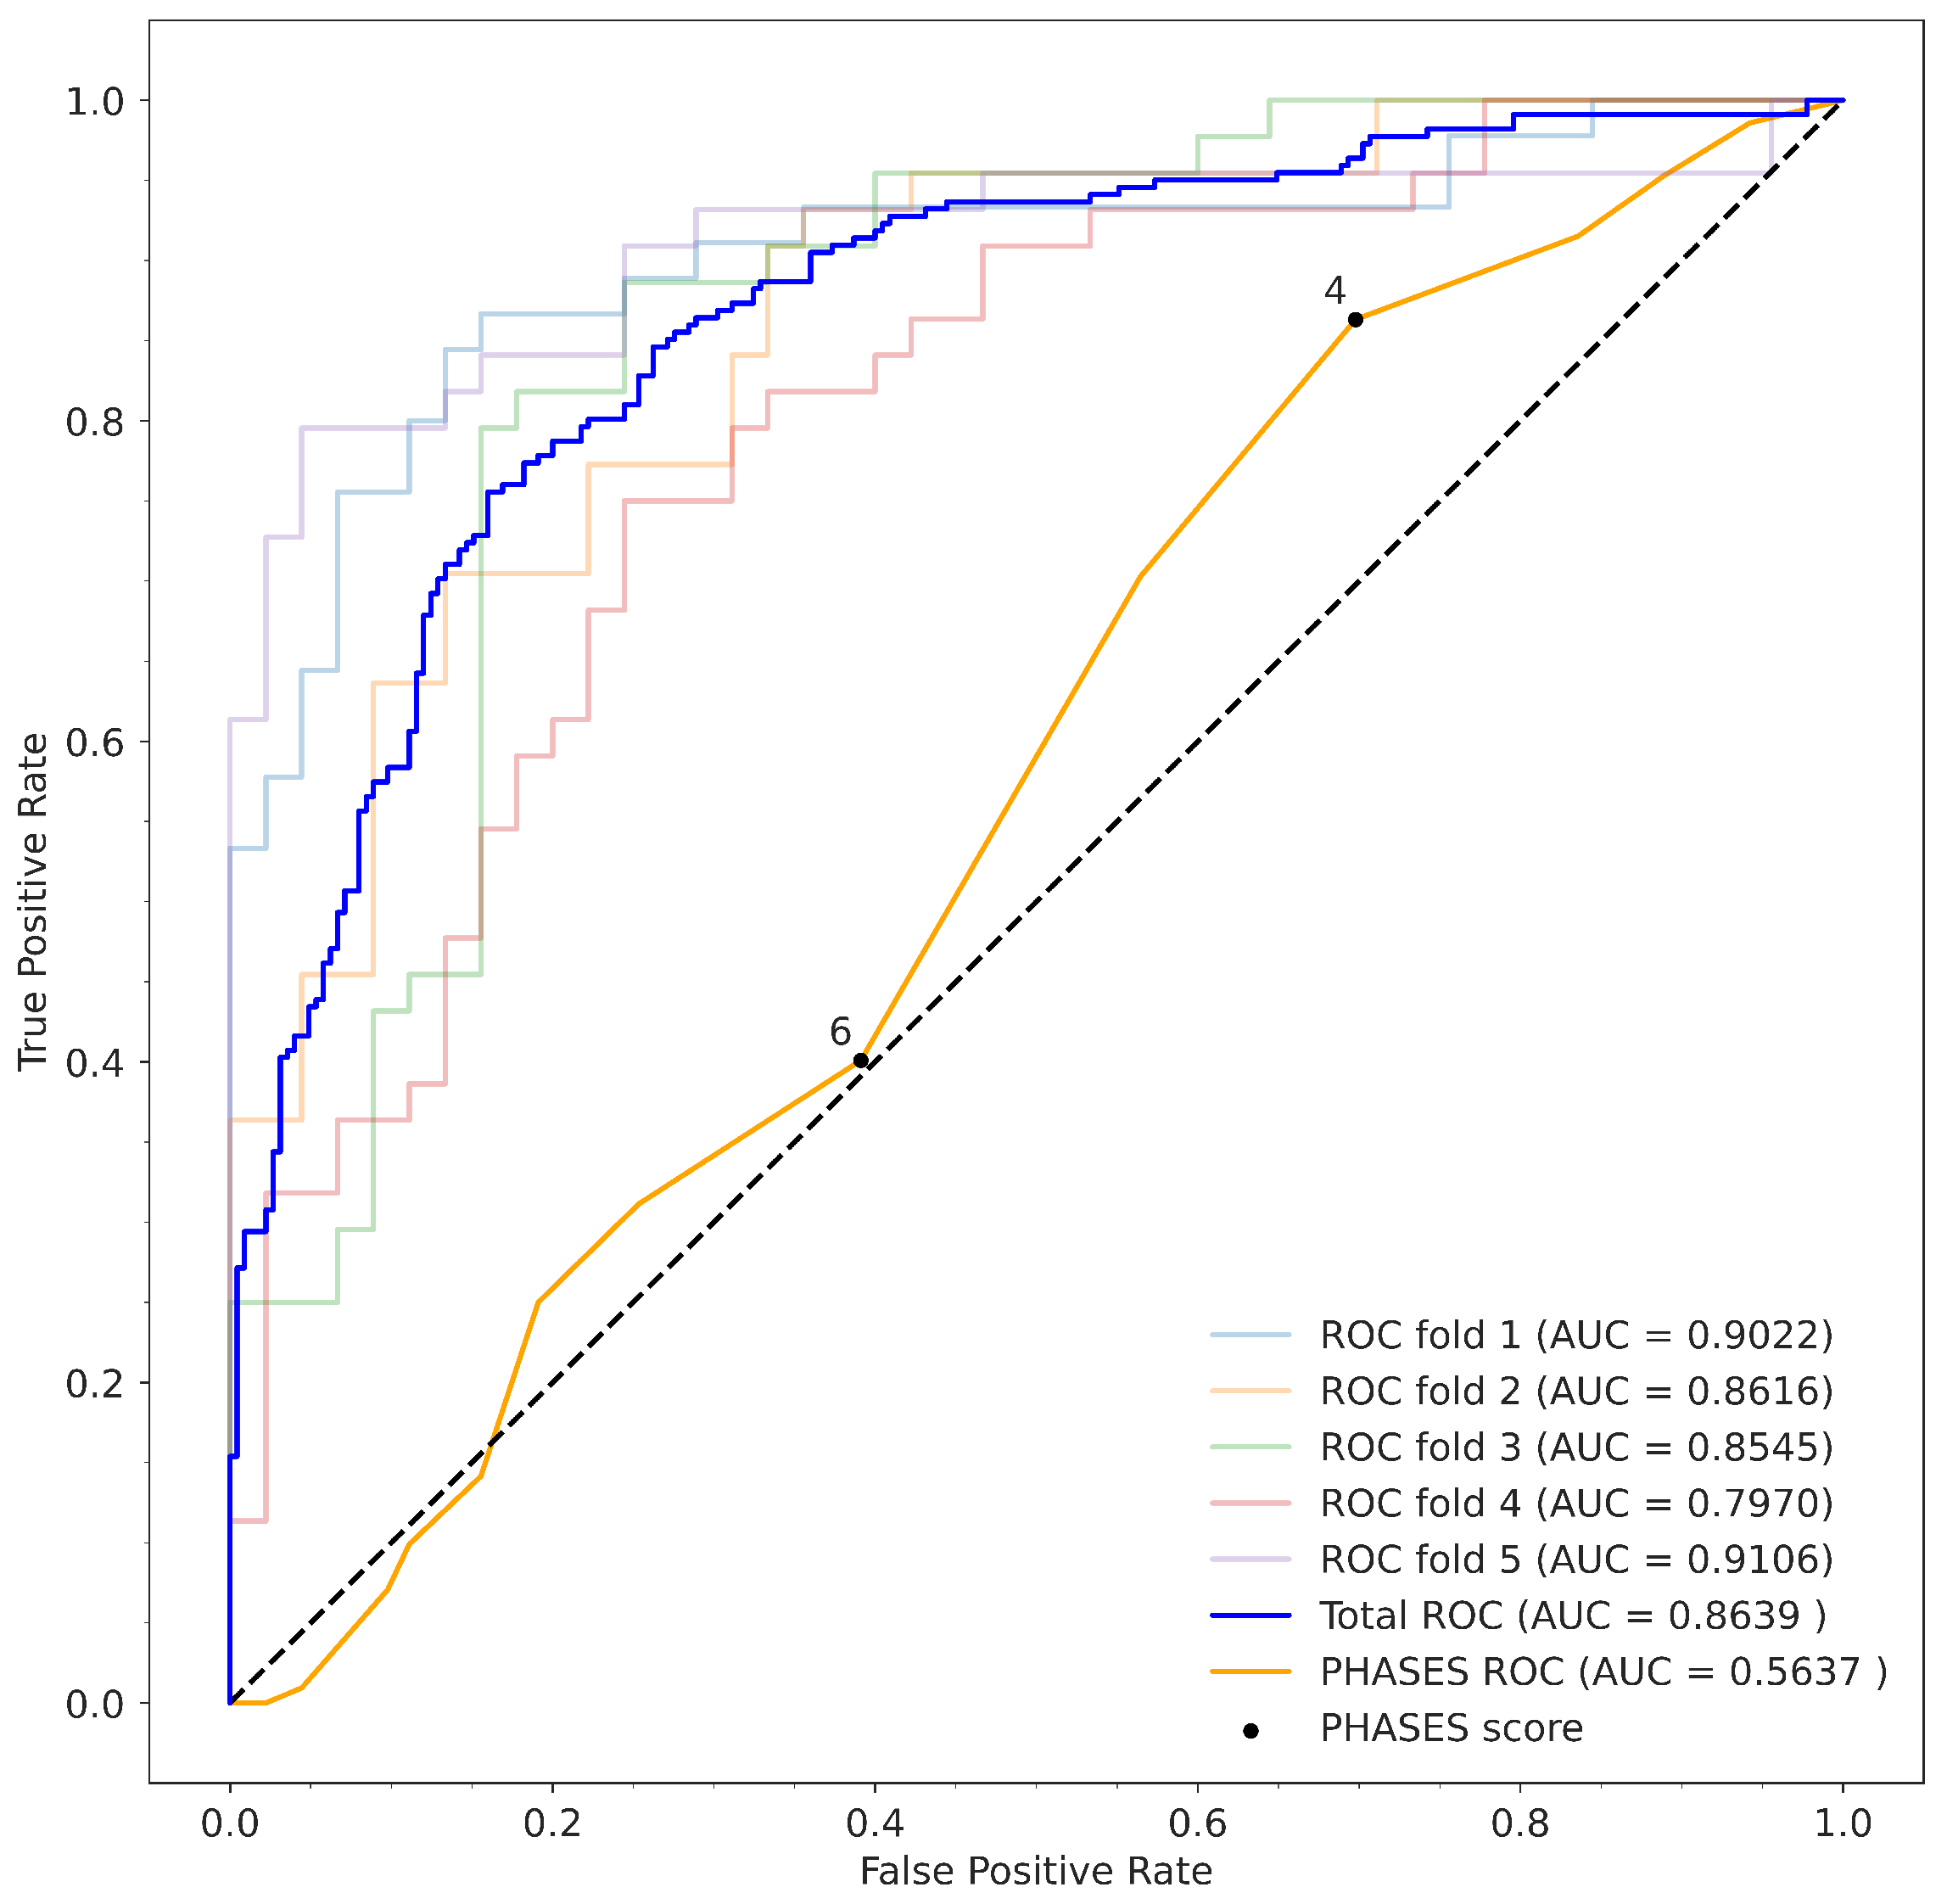
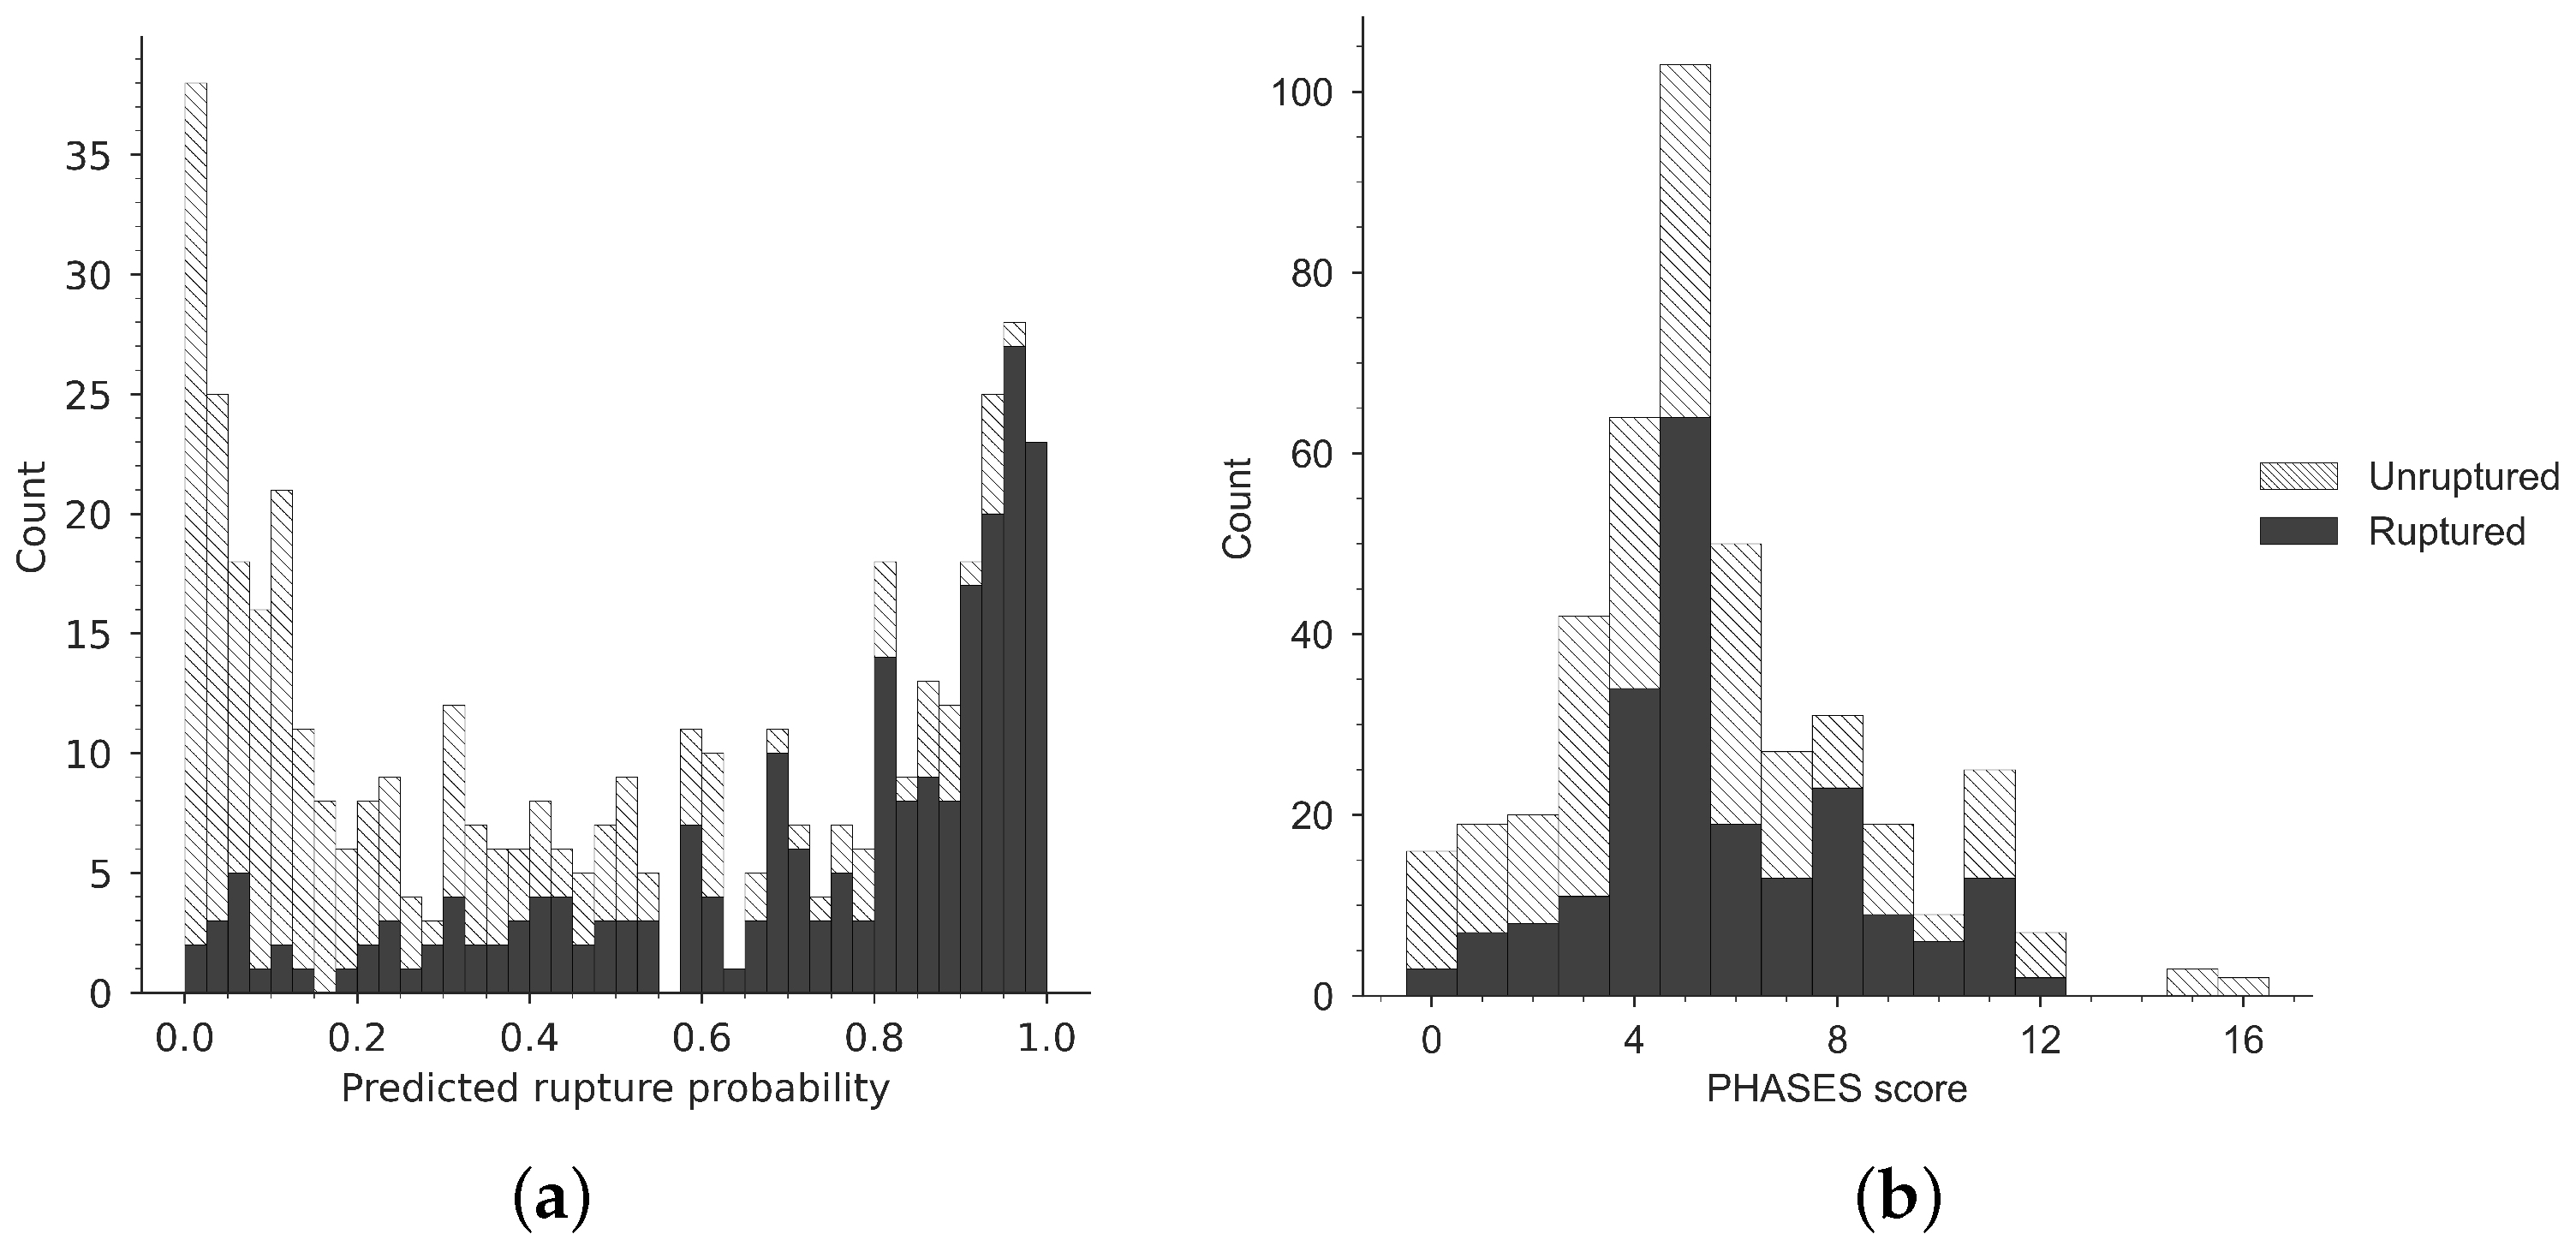
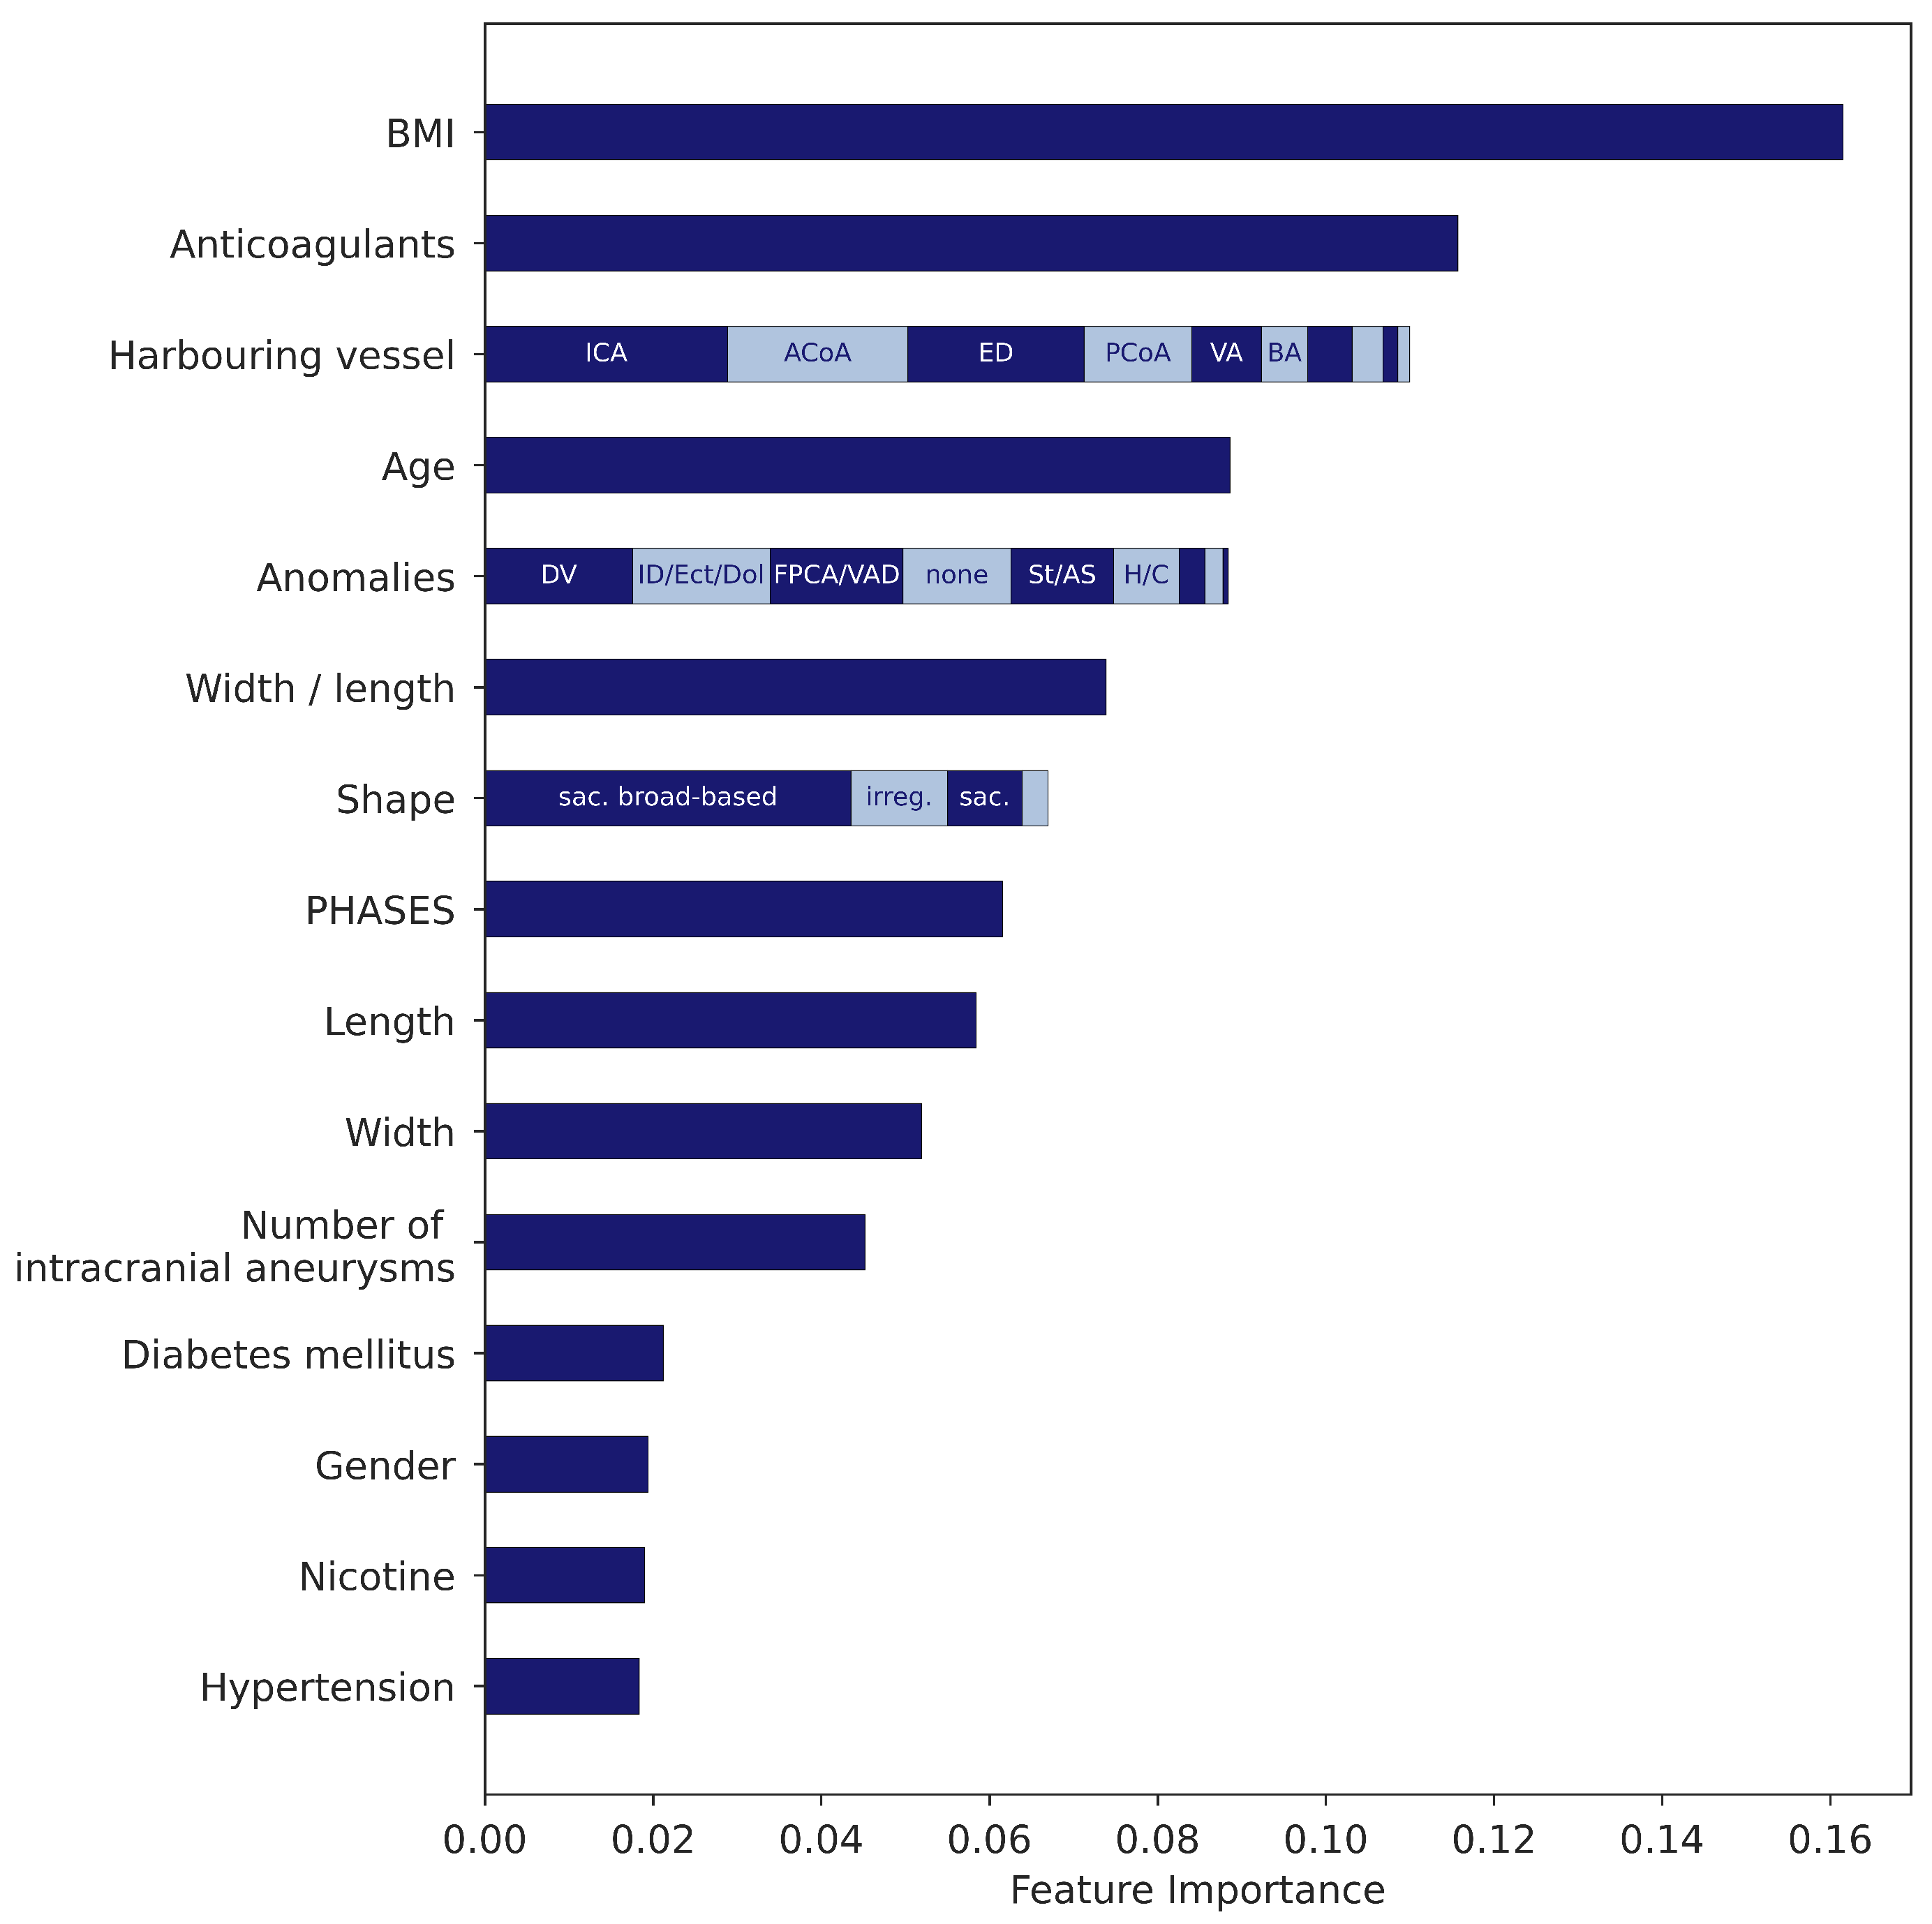
3.1. Gradient Boosting Model
Gradient boosting was applied with a five-fold cross-validation on the acquired data set consisting of 446 aneurysms. By varying the threshold , a ROC curve was computed for each fold. Taken together, they formed a total ROC with an AUC of 0.8639 (Figure 1). Repeating this experiment 100 times with random seeds resulted in a similar mean AUC (0.8492 ± 0.0085). By setting , the gradient boosting model had, at least, the sensitivity of the PHASES score. This facilitated a comparison between the gradient boosting model and the PHASES score. The confusion matrix for the model is shown in Table 2(a), the resulting statistical measures in Table 3.
Figure 1.
ROC curves of the cross validated gradient boosting model in comparison with the PHASES score. Each of the 5 CV-folds is represented by a ROC curve. The dark blue curve is the ROC of the accumulated test sets. The orange curve is the ROC of the PHASES scores from the data set. The PHASES heuristic from Bijlenga et al. [18] is plotted on the curve as threshold 4.
Table 2.
Confusion matrices of (a) the gradient boosting model and (b) the PHASES score as predictor; (a) is a composition of 5 confusion matrices for . The results refer exclusively to the test data of the cross validation folds. In (b), the PHASES threshold is applied, where a score ≥ 4 is predictive for rupture, as proposed by Bijlenga et al. [18].
Table 3.
Statistical analysis of the results of the gradient boosting model compared to the PHASES score. The threshold of the model is chosen such that the sensitivity of the model is at least as high as the sensitivity of the PHASES score to facilitate a comparison between the two approaches.
The histogram in Figure 2a shows the frequency distribution of the model predictions. The interval [0, 0.1] contains UIAs and interval (0.9, 1] covers ruptured aneurysms. The closer the predicted rupture probabilities are to 0.5, the more the ratio of actually unruptured to ruptured aneurysms tends towards 1:1. In other words, the reliability of the model increases exponentially the closer the predicted probability approaches either the interval boundary 0 or 1. This property reveals a certain symmetry in the diagram, with the rupture probability forming the axis of symmetry. The mean probability for ruptured aneurysms is 0.7247, respectively 0.2699 for UIAs. Thus, they have an almost equal distance to , which again confirms the symmetry.
Figure 2.
Frequency distribution of (a) rupture probabilities predicted by the model and (b) PHASES scores. The black bars represent aneurysms that actually ruptured (resp. hatched bars for unruptured aneurysms).
The feature importance analysis (Figure 3) reveals that the model heavily weighs the BMI (feature importance = 0.1615). This is closely followed by the consumption of anticoagulants (0.1157) and the harbouring vessel (0.1100). The hypertension (0.0183), nicotine consumption (0.0190), gender (0.0194), and diabetes mellitus (0.0212) seem to have the least influence on the decision-making of the model.
Figure 3.
Feature importance ranked by the gradient boosting model. Vessel abbreviations: ICA—internal carotid artery, ACoA—anterior communicating artery, ED—extradural, PCoA—posterior communicating artery, VA—vertebral artery, BA—basilar artery. Anomaly abbreviations: DV—duplicated vessel, ID—infundibular dilation, Ect—ectasia, Dol—dolicho-basilaris, FPCA—fetal-type posterior cerebral artery, VAD—vertebral artery dissection, St—stenosis, AS—arteriosclerosis, H—hypoplastic vessel, C—collateral vessel. Shape abbreviations: sac.—saccular, irreg.—irregular.
3.2. Comparison to PHASES Score
The PHASES threshold (as proposed by Bijlenga et al. [18]) was applied for all 437 patients for whom the required information was available. The results for the PHASES score are shown in the confusion matrix in Table 2, the resulting statistical measures in Table 3.
In addition, a ROC curve was computed for the PHASES score, which can directly be compared to the ROC curves of the gradient boosting models (Figure 1). The peak of the ROC curve at PHASES = 4 shows that the threshold proposed by Bijlenga et al. [18] is the best possible within the PHASES scale. This observation is confirmed in the histogram (Figure 2b), where the UIAs predominate in the interval [0, 3]. Within [4, 5], the SAH portion outweighs slightly, and no clear pattern can be identified for [6, 16].
Nevertheless, the AUC of the gradient boosting model is significantly higher than the AUC of the PHASES score , which is only slightly better than random on this data set.
4. Discussion
Aiming to improve patient counseling and decision making in aneurysm care, a respectable number of risk scoring systems have been developed and then investigated to better understand the aneurysm-related hazard, but only few—most significantly the PHASES score—have shown practical value and were eventually established in the clinical routine [22,23,24]. However, the suitability of the PHASES score in general, and even more for patients in geographically constrained areas, has been questioned by several authors [8,14]. Facing the problem of counseling patients with UIA on a daily basis, our study was initiated with the aim to provide those affected with a more accurate tool for risk assessment. For this purpose, we used gradient boosting, a state-of-the-art machine learning algorithm based on multiple decision trees, for risk evaluation and compared its performance with the performance of the PHASES score in a substantial number of locally acquired patients with unruptured and ruptured brain aneurysms.
Our results demonstrate the clear superiority of the machine learning approach over the PHASES score in our patient collective. More specifically, gradient boosting allowed predicting rupture and outperformed the well-established PHASES score as follows. With a probability of 84.04%, the intracranial aneurysm of a patient with a negative prediction will indeed not rupture when applying the threshold (see NPV in Table 3). Therefore 13.94 (84.04–70.1%) percentage points (pp) more negative predictions can be trusted compared to the PHASES score. Respectively 20.21 pp (74.03–53.82%) more positive diagnoses are trustworthy, which practically means 20.21 pp less unnecessary invasive treatments (see PPV in Table 3). By moving the decision threshold closer to 0, the sensitivity and NPV can be be increased to the desired value. Similarly, a higher specificity and PPV can be achieved by using and shifting it towards 1. Moreover, the prediction probabilities computed by the model are relatively reliable near the interval boundaries 0 and 1 (see Figure 2a). The symmetry of the rupture probabilities to 0.5 indicates that maximum accuracy can be achieved near . The comparison of the ROC curves also confirm that the model clearly outperforms the PHASES score in terms of classification (see Figure 1). Since the PHASES score heavily weighs the size of an aneurysm, a high score mostly indicates the presence of a large aneurysm. For those high scores, e.g., 6 and greater, its ROC fluctuates around the diagonal line, which implies that from this point on, the PHASES score does not perform better than randomly tossing a coin.
Since the model is trained on a balanced data set, patients with and without ruptured aneurysms are well represented. Other studies on rupture prediction of intracranial aneurysms with machine learning are based on imbalanced data sets, such as in Shi et al. (395 ruptured, 109 unruptured) [25], Ou et al. (68 ruptured, 306 unruptured) [26], and Liu et al. (124 unstable, 296 stable) [27]. This leads to a high accuracy a priori (even before applying an algorithm). However the AUC in those three studies (0.88, 0.882, 0.853) is barely different to the AUC achieved by our model (0.8639). Another approach, a convolutional neuronal network trained with three-dimensional digital subtraction angiographies, yielded an inferior AUC of 0.755 [28]. The same holds for an extreme gradient boosting algorithm trained with blood biomarkers and clinical features, which hits an AUC of 0.765 [29] and, therefore, is also significantly lower.
Considering the relevance of the different features included in this study, our findings further contribute to the scientific body of evidence questioning the historically established role of the pure size of UIAs for risk prediction. In line with, e.g., the study of AlMatter et al. [8], the size of the aneurysm plays a subordinate role in the model’s decision-making, as illustrated in Figure 3. In fact, the ratio of width and length (width/length), which roughly represents the aneurysm shape, proves more important but still has moderate impact. Interestingly, our results show an extraordinary significance of BMI and patient age for rupture risk in our cohort. Both variables have been linked to the risk of hemorrhage in previous work [30,31], with the yet unexplained phenomenon of the obesity paradox in context of UIAs, i.e., obese patients with growing age are less likely to suffer from aneurysmal SAH. As a consequence, BMI, age, and the aneurysm localization should have a greater weighting for the risk evaluation. However, it should be noted that feature importance based on the Gini criterion tends to overestimate continuous features [32]. In addition, the diagram should not be used to infer “the higher or lower the BMI resp. age, the more likely is SAH”. Those relationships may be nonlinear for the gradient boosting machine and the structure of the underlying decision trees must be analyzed in greater detail.
The weighting of the individual features for the risk of hemorrhage notoriously varies between distinct populations [33], which is certainly based on different Mendelian and lifestyle backgrounds, among other factors. Therefore, using the proposed model in spatially confined patient cohorts has the potential to improve aneurysm care at the individual level. Our study is based on a retrospectively maintained database of a single neurovascular center. Cross-validation of our model with patients of further distinct, but also spatially confined catchment areas is wanted, and will certainly improve the understanding of the influence of features on the risk of hemorrhage.
5. Conclusions
This study demonstrates that the machine learning approach is superior to the PHASES score for rupture prediction of UIAs. Since the patient cohort is geographically constrained, the model can enhance risk evaluation and patient counselling in this specific area.
Author Contributions
Conceptualization, G.W., C.M. and S.S.; methodology, G.W. and C.M.; software, G.W.; validation, G.W.; formal analysis, G.W.; investigation, G.W. and C.M.; resources, A.H. and U.N.; data curation, G.W. and A.H.; writing–original draft preparation, G.W., C.M. and S.S.; writing–review and editing, G.W., C.M., U.N. and S.S.; visualization, G.W.; supervision, C.M. and S.S.; project administration, C.M. and U.N.; funding acquisition, C.M. All authors have read and agreed to the published version of the manuscript.
Funding
The work of G.W. and C.M. was supported by the German Federal Ministry of Education and Research (BMBF, 01/S18026A-F) by funding the competence center for Big Data and AI (ScaDS.AI Dresden/Leipzig).
Institutional Review Board Statement
The study was conducted in accordance with the Declaration of Helsinki, and approved by the Institutional Ethics Committee of Leipzig Hospital University (#208-15-01062015, June 2015) prior to the collection and analysis of patient data.
Informed Consent Statement
Informed consent was obtained from all subjects involved in the study.
Data Availability Statement
The machine learning model presented here can be used in the following web application: https://service.scadsai.uni-leipzig.de/med/aneurysm/ (accessed on 20 December 2021).
Conflicts of Interest
The authors declare no conflict of interest.
Abbreviations
The following abbreviations are used in this manuscript:
| UIA | unruptured intracranial aneurysm |
| SAH | subarachnoid hemorrhage |
| PPV | positive predictive value |
| NPV | negative predictive value |
| TPR | true positive rate |
| TNR | true negative rate |
| ROC | receiver operating characteristic |
| AUC | area under the curve |
| ML | machine learning |
References
- Vlak, M.H.; Algra, A.; Brandenburg, R.; Rinkel, G.J. Prevalence of unruptured intracranial aneurysms, with emphasis on sex, age, comorbidity, country, and time period: A systematic review and meta-analysis. Lancet Neurol. 2011, 10, 626–636. [Google Scholar] [CrossRef]
- Vernooij, M.W.; Ikram, M.A.; Tanghe, H.L.; Vincent, A.J.; Hofman, A.; Krestin, G.P.; Niessen, W.J.; Breteler, M.M.; van der Lugt, A. Incidental Findings on Brain MRI in the General Population. N. Engl. J. Med. 2007, 357, 1821–1828. [Google Scholar] [CrossRef] [PubMed]
- Huang, J.; van Gelder, J.M. The Probability of Sudden Death from Rupture of Intracranial Aneurysms: A Meta-analysis. Neurosurgery 2002, 51, 1101–1107. [Google Scholar] [CrossRef] [PubMed]
- Nieuwkamp, D.J.; Setz, L.E.; Algra, A.; Linn, F.H.; de Rooij, N.K.; Rinkel, G.J. Changes in case fatality of aneurysmal subarachnoid haemorrhage over time, according to age, sex, and region: A meta-analysis. Lancet Neurol. 2009, 8, 635–642. [Google Scholar] [CrossRef]
- Darsaut, T.E.; Findlay, J.M.; Magro, E.; Kotowski, M.; Roy, D.; Weill, A.; Bojanowski, M.W.; Chaalala, C.; Iancu, D.; Lesiuk, H.; et al. Surgical clipping or endovascular coiling for unruptured intracranial aneurysms: A pragmatic randomised trial. J. Neurol. Neurosurg. Psychiatry 2017, 88, 663–668. [Google Scholar] [CrossRef]
- Etminan, N.; Rinkel, G.J. Unruptured intracranial aneurysms: Development, rupture and preventive management. Nat. Rev. Neurol. 2016, 12, 699–713. [Google Scholar] [CrossRef]
- Pierot, L.; Barbe, C.; Ferré, J.C.; Cognard, C.; Soize, S.; White, P.; Spelle, L. Patient and aneurysm factors associated with aneurysm rupture in the population of the ARETA study. J. Neuroradiol. 2020, 47, 292–300. [Google Scholar] [CrossRef]
- AlMatter, M.; Bhogal, P.; Pérez, M.A.; Schob, S.; Hellstern, V.; Bäzner, H.; Ganslandt, O.; Henkes, H. The Size of Ruptured Intracranial Aneurysms. Clin. Neuroradiol. 2017, 29, 125–133. [Google Scholar] [CrossRef]
- Greving, J.P.; Wermer, M.J.H.; Brown, R.D.; Morita, A.; Juvela, S.; Yonekura, M.; Ishibashi, T.; Torner, J.C.; Nakayama, T.; Rinkel, G.J.E.; et al. Development of the PHASES score for prediction of risk of rupture of intracranial aneurysms: A pooled analysis of six prospective cohort studies. Lancet Neurol. 2014, 13, 59–66. [Google Scholar] [CrossRef]
- Wende, T.; Kasper, J.; Wilhelmy, F.; Prasse, G.; Quäschling, U.; Haase, A.; Meixensberger, J.; Nestler, U. Comparison of the unruptured intracranial aneurysm treatment score recommendations with clinical treatment results—A series of 322 aneurysms. J. Clin. Neurosci. 2022, 98, 104–108. [Google Scholar] [CrossRef]
- Hernández-Durán, S.; Mielke, D.; Rohde, V.; Malinova, V. Is the unruptured intracranial aneurysm treatment score (UIATS) sensitive enough to detect aneurysms at risk of rupture? Neurosurg. Rev. 2020, 44, 987–993. [Google Scholar] [CrossRef] [Green Version]
- Haase, A.; Schob, S.; Quäschling, U.; Hoffmann, K.T.; Meixensberger, J.; Nestler, U. Epidemiologic and anatomic aspects comparing incidental and ruptured intracranial aneurysms: A single centre experience. J. Clin. Neurosci. 2020, 81, 151–157. [Google Scholar] [CrossRef] [PubMed]
- Shi, Z.; Hu, B.; Schoepf, U.; Savage, R.; Dargis, D.; Pan, C.; Li, X.; Ni, Q.; Lu, G.; Zhang, L. Artificial Intelligence in the Management of Intracranial Aneurysms: Current Status and Future Perspectives. Am. J. Neuroradiol. 2020, 41, 373–379. [Google Scholar] [CrossRef] [PubMed] [Green Version]
- Silva, M.A.; Patel, J.; Kavouridis, V.; Gallerani, T.; Beers, A.; Chang, K.; Hoebel, K.V.; Brown, J.; See, A.P.; Gormley, W.B.; et al. Machine Learning Models can Detect Aneurysm Rupture and Identify Clinical Features Associated with Rupture. World Neurosurg. 2019, 131, e46–e51. [Google Scholar] [CrossRef]
- Team, T. Pandas development Pandas-Dev/Pandas: Pandas. Zenodo 2020, 21, 1–9. [Google Scholar] [CrossRef]
- McKinney, W. Data Structures for Statistical Computing in Python. In Proceedings of the 9th Python in Science Conference (SciPy 2010), Austin, TX, USA, 28 June–3 July 2010; pp. 56–61. [Google Scholar]
- Pedregosa, F.; Varoquaux, G.; Gramfort, A.; Michel, V.; Thirion, B.; Grisel, O.; Blondel, M.; Prettenhofer, P.; Weiss, R.; Dubourg, V.; et al. Scikit-learn: Machine Learning in Python. J. Mach. Learn. Res. 2011, 12, 2825–2830. [Google Scholar]
- Bijlenga, P.; Gondar, R.; Schilling, S.; Morel, S.; Hirsch, S.; Cuony, J.; Corniola, M.V.; Perren, F.; Rüfenacht, D.; Schaller, K. PHASES Score for the Management of Intracranial Aneurysm. Stroke 2017, 48, 2105–2112. [Google Scholar] [CrossRef] [PubMed]
- Robin, X.; Turck, N.; Hainard, A.; Tiberti, N.; Lisacek, F.; Sanchez, J.C.; Müller, M. pROC: An open-source package for R and S+ to analyze and compare ROC curves. BMC Bioinform. 2011, 12, 77. [Google Scholar] [CrossRef]
- Breiman, L. Manual on Setting up, Using, and Understanding Random Forests V3.1; Statistics Department University of California Berkeley: Berkeley, CA, USA, 2002; Volume 1, pp. 3–42. [Google Scholar]
- Breiman, L.; Friedman, J.; Olshen, R.; Stone, C. Classification and Regression Trees, 1st ed.; Chapman & Hall: London, UK, 1984. [Google Scholar]
- Neulen, A.; Pantel, T.; König, J.; Brockmann, M.A.; Ringel, F.; Kantelhardt, S.R. Comparison of Unruptured Intracranial Aneurysm Treatment Score and PHASES Score in Subarachnoid Hemorrhage Patients with Multiple Intracranial Aneurysms. Front. Neurol. 2021, 12, 445. [Google Scholar] [CrossRef]
- Brinjikji, W.; Pereira, V.M.; Khumtong, R.; Kostensky, A.; Tymianski, M.; Krings, T.; Radovanovich, I. PHASES and ELAPSS Scores Are Associated with Aneurysm Growth: A Study of 431 Unruptured Intracranial Aneurysms. World Neurosurg. 2018, 114, e425–e432. [Google Scholar] [CrossRef]
- Backes, D.; Rinkel, G.J.; Greving, J.P.; Velthuis, B.K.; Murayama, Y.; Takao, H.; Ishibashi, T.; Igase, M.; TerBrugge, K.G.; Agid, R.; et al. ELAPSS score for prediction of risk of growth of unruptured intracranial aneurysms. Neurology 2017, 88, 1600–1606. [Google Scholar] [CrossRef] [PubMed]
- Shi, Z.; Chen, G.; Mao, L.; Li, X.; Zhou, C.; Xia, S.; Zhang, Y.; Zhang, B.; Hu, B.; Lu, G.; et al. Machine Learning-Based Prediction of Small Intracranial Aneurysm Rupture Status Using CTA-Derived Hemodynamics: A Multicenter Study. Am. J. Neuroradiol. 2021, 42, 648–654. [Google Scholar] [CrossRef] [PubMed]
- Ou, C.; Liu, J.; Qian, Y.; Chong, W.; Zhang, X.; Liu, W.; Su, H.; Zhang, N.; Zhang, J.; Duan, C.Z.; et al. Rupture Risk Assessment for Cerebral Aneurysm Using Interpretable Machine Learning on Multidimensional Data. Front. Neurol. 2020, 11, 570181. [Google Scholar] [CrossRef] [PubMed]
- Liu, Q.; Jiang, P.; Jiang, Y.; Ge, H.; Li, S.; Jin, H.; Li, Y. Prediction of Aneurysm Stability Using a Machine Learning Model Based on PyRadiomics-Derived Morphological Features. Stroke 2019, 50, 2314–2321. [Google Scholar] [CrossRef] [PubMed]
- Kim, H.C.; Rhim, J.K.; Ahn, J.H.; Park, J.J.; Moon, J.U.; Hong, E.P.; Kim, M.R.; Kim, S.G.; Lee, S.H.; Jeong, J.H.; et al. Machine Learning Application for Rupture Risk Assessment in Small-Sized Intracranial Aneurysm. J. Clin. Med. 2019, 8, 683. [Google Scholar] [CrossRef] [PubMed] [Green Version]
- Heo, J.; Park, S.J.; Kang, S.H.; Oh, C.W.; Bang, J.S.; Kim, T. Prediction of Intracranial Aneurysm Risk using Machine Learning. Sci. Rep. 2020, 10, 6921. [Google Scholar] [CrossRef]
- Zheng, J.; Xu, R.; Sun, X.; Zhang, X. Small vs. Large Unruptured Cerebral Aneurysm: Concerns with the Age of Patient. Front. Neurol. 2021, 12, 735456. [Google Scholar] [CrossRef]
- Chen, S.; Mao, J.; Chen, X.; Li, Z.; Zhu, Z.; Li, Y.; Jiang, Z.; Zhao, W.; Wang, Z.; Zhong, P.; et al. Association Between Body Mass Index and Intracranial Aneurysm Rupture: A Multicenter Retrospective Study. Front. Aging Neurosci. 2021, 13, 515. [Google Scholar] [CrossRef]
- Nembrini, S.; König, I.R.; Wright, M.N. The Revival of the Gini Importance? Bioinformatics 2018, 34, 3711–3718. [Google Scholar] [CrossRef] [Green Version]
- Ohkuma, H.; Tabata, H.; Suzuki, S.; Islam, M.S. Risk Factors for Aneurysmal Subarachnoid Hemorrhage in Aomori, Japan. Stroke 2003, 34, 96–100. [Google Scholar] [CrossRef] [Green Version]
Publisher’s Note: MDPI stays neutral with regard to jurisdictional claims in published maps and institutional affiliations. |
© 2022 by the authors. Licensee MDPI, Basel, Switzerland. This article is an open access article distributed under the terms and conditions of the Creative Commons Attribution (CC BY) license (https://creativecommons.org/licenses/by/4.0/).