1. Introduction
Bioinformatics development made it possible to obtain new tools for studying genetic sequences. In particular, the algorithms for visualization of the nucleotide composition of DNA molecules and RNA are developing. Research in this area has become increasingly relevant in light of the latest challenges, such as the Coronavirus pandemic.
HCVs (human coronaviruses) are large RNA viruses that infect the lung tissue of humans. The authors of the article [
1] developed models and morphological cultures of the respiratory tract for the study of coronaviruses, the identification of antiviral drugs, and the assessment of viral inhibition. With tens of thousands of verified cases worldwide, SARS-CoV-2 has caused a substantial number of deaths, creating a grave threat to public health [
2]. Various medical, social, and bioengineering methods have been proposed to combat SARS-CoV-2, including detection and prognosis [
3,
4] highlighting the significance of a chest surface plasmon resonance (SPR)-based biosensor and AI-assisted COVID-19 diagnosis. Publications from various companies around the world discuss the financial consequences of the Coronavirus/COVID-19 crisis [
5,
6]. According to the statistics, each additional month of the crisis costs 2.5–3 percent of the global GDP on average.
The article [
7] presents the results of a phylogenetic analysis of viral genome sequences from India. In SARS-CoV-2 strains, a nonsynonymous mutation 4809C> T (S1515F) has been discovered in the NSP3 gene. The review [
8] aims to analyze the genetic similarity and diversity of coronavirus strains, which could reveal SARS-sensitive CoV2′s antigenic targets. According to the research results [
9], the 2019-nCoV appears to be a hybrid virus between the bat coronavirus and an undiscovered coronavirus. In terms of virulence, the immunological response of the body, and vaccine efficiency, each strain is different [
10]. The focus of the research [
11] is to examine epidemiological, clinical, and laboratory characteristics of COVID-19 and MERS-COV populations. SARS-CoV-2 is an RNA virus that can produce a range of strains due to mutation. The next generation of diagnostic assays should be able to detect numerous coronaviruses simultaneously, multiplexed, and with high throughput in a single response [
12]. As a result, several medical diagnostic laboratories employ deep learning techniques in molecular genetics [
13].
The authors [
14] have proposed a machine learning-based coronavirus prediction technique, where 1000 RNA sequences of SARS-CoV-1, MERS, SARS-CoV-2, and other viruses are used to train a naive Bayes classifier. In their work [
15], the authors report the current predictions from structure prediction using a machine learning-based method applying molecular dynamics simulation-based refinement.
The cited articles discuss topical issues of the diversity of coronaviruses and individual prevention measures associated with it. That is since viruses tend to mutate, and their changes require monitoring to ensure the biological protection of public health. The paper discusses a method for tracking changes in mutation dynamics and a comparative analysis of viruses.
2. Methods: An Algorithm for Genometric Visualization of Genetic Sequences
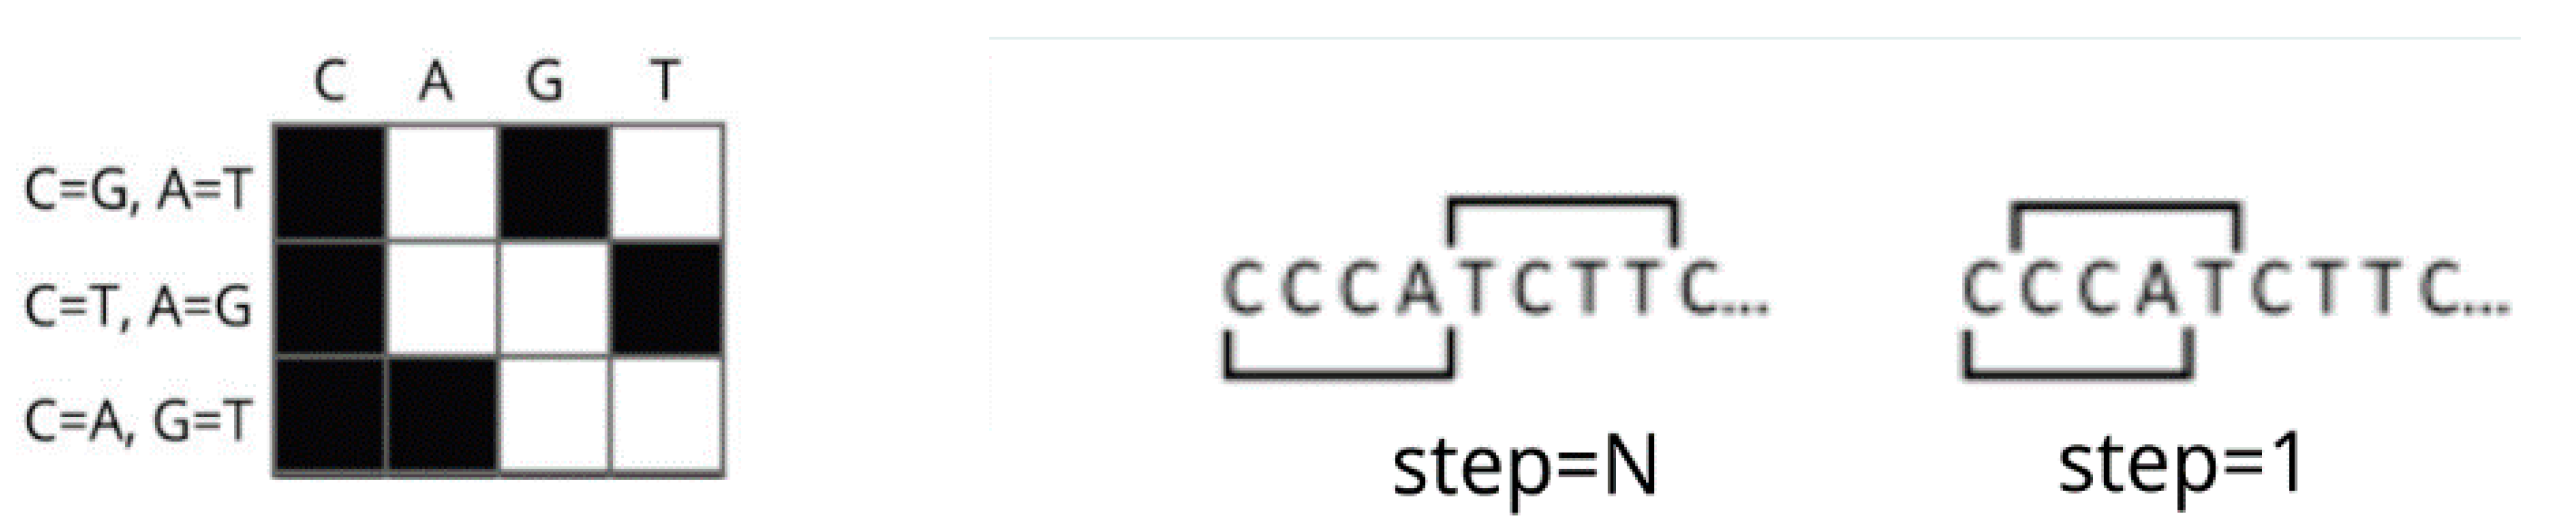
Each nitrogenous base of the genetic information has three binary representations. S.V. Petoukhov binary sub-alphabets represent a type of presentation variant. The binary sub-alphabets in the set of nitrogenous bases differ according to the kinds of boolean properties: C = T “pyrimidines”/A = G “purines”; A = C “amino”/G = T “keto”; C = G has 3 hydrogen bonds and A = T has two hydrogen bonds. Based on the boolean properties method for scale-parametric analysis of large nucleotide sequences described in [
16,
17,
18,
19,
20] is as follows:
- (1)
A sequence of characters encoding nitrogen bases from the set A, G, C, and T or A, G, C, and U decomposes into N equal-length segments, where N is a method parameter. N-plets refer to the associated equal-length elements.
- (2)
Three binary sequences comprising 0 and 1 can describe the pattern of nitrogen bases. The method (considering 0 or 1) affects the orientations and other symmetrical changes in the resulting display.
- (3)
The resulting three records of the elements are encoded in three decimal representations or other uniquely identifying functions.
There have been three basic types of genometric visualizations devised and documented hitherto, each displaying different features of nucleotide sequences [
17]. The first type represents the integral type of visual representation (every point on the graph relates to the total count of ones or zeros in the binary format of the N-plet). The second one is the structural form of visual representation (each point relates to the numeric interpretation of the binary format of the N-plet). Ultimately, the third type is the frequency form of imaging (each point on the graph relating to the count of ones or zeros in the binary format of the N-plet or to the frequency of occurrence of the N-plet binary code in the entire sequence).
We can depict three binary sub-alphabets in the form of a matrix, shown in
Figure 1. It is possible to divide the nucleotide sequence into equal parts in various ways: with overlap (step = 1) and without overlap (step = N). For the best quality and resolution of visualizations, we used step = 1. With this approach, the number of points in visualizations becomes N times larger, which allows for obtaining more accurate results.
Each row and each column of the Hadamard matrix is a Walsh function. Walsh’s functions are a complete set of orthogonal functions that can be used to represent any discrete function in a manner similar to using trigonometric functions in Fourier analysis. In this study, we relied on the objectively existing system of orthogonal Walsh functions, which is formed by the physicochemical properties of nucleotides (and not on the IUPAC system). These functions have been considered in detail by us in previous publications and are based on a trio of binary sub-alphabets. Any changes in the binary encoding while observing the basic Walsh functions lead to invariant transformations of the resulting mappings—rotations and reflections.
We have proposed an objective measure to reveal the most distinct fractal structure. In the formula, N is the visualization scale parameter for nucleotide sequences of length
L:
Square brackets are the operation of taking the integer part of a number. Width and height of two-dimensional square dot images:
Next, we will consider these types of imaging using the example of the SARS-CoV-2 coronavirus strain imaging in one-dimensional and two-dimensional spaces.
Figure 2 illustrates the structural visualization type, where two-dimensional mapping has a symmetrical fractal structure.
Figure 3 shows the integral visualization type, and
Figure 4 depicts a frequency type of visualization. We employed these three types of visualization in the present work since they are fundamental and the most informative. Different imaging algorithms can produce different results depending on the analyzed genetic sequence, namely its composition and length. We set out to compare these three types of coronavirus imaging.
The biology behind the imaging is to use a three-channel view of essential traits: purine/pyrimidine, keto/amino, two/three hydrogen bonds. Each of these features forms a channel that has common two-dimensional mappings with other channels. We derived all numerical parameters in the resolution at which the most distinct fractal structure appeared.
Visualization methods based on the genetic functions of Walsh allow evaluation of the qualitative features and differences between nucleotide sequences, which become visible in the structure of the visualizations. For short viruses, these differences are less than between the DNA of different species of living organisms. As can be seen from
Figure 3, for coronavirus, there is a correlation between its one-dimensional representations in purine/pyrimidine and keto/amino sub-alphabets. This correlation is a feature of this coronavirus. The detection of this feature became possible due to the application of the method proposed in this paper. Apparently, such features can be the subject of further research by biologists and virologists.
Some visualizations are shown in 1D and others in 2D to demonstrate the capabilities of the method, as well as to demonstrate various options for visualization and comparison of the nucleotide composition of viruses. Thus, our work is not only research but also methodological.
Figure 2,
Figure 3 and
Figure 4 show the use of different visualization methods for the same genetic sequence of a coronavirus. Simultaneously, for a clear construction, diverse methods required diverse scaling parameters N. Please note that the fragment size of N nucleotides is only one display point. There are as many such points as there are parts of N nucleotides in length in the sequence. If N is too small, then the number of combinations of N nucleotides will also be small to build a sufficiently explicit display. If N is extremely large, few points will be present, which will not lend clarity, either. A rule based on combinatorics can direct us to acceptable clarity. According to this rule, N represents the integer part of the base two logarithms of the square root of the length of the nucleotide sequence. Furthermore, to improve the clarity of the mappings, we used fragments of N nucleotides in length as intersecting fragments with the minimum possible overlap of one nucleotide. We practiced these methods to build possibly the most explicit mappings of such short sequences as the RNA of coronaviruses.
3. Results
3.1. Visualization and Comparative Analysis of Coronavirus Serotypes
To carry out genometric visualization, the authors used the genetic data presented in [
6].
Table 1 shows the seven most common strains of the human coronavirus [
1].
The results presented in
Figure 5 are well distinguishable for each data instance. As seen in
Figure 5, the most qualitative type of visualization for the visual distinction of nucleotide sequences is one-dimensional integral. The black lines highlight the COVID-19 (SARS-CoV-2) coronavirus strain, and the gray lines indicate the remaining strains from
Table 1.
A 2D structural imaging characterizes more generalized differences in nucleotide sequences.
Figure 6 illustrates the results of this type of visualization. Based on the comparative analysis of the structural type of visualization, we can conclude that the results can be divided into two groups:
- (1)
HCoV-229E, HCoV-NL63, HCoV-HKU1, HCoV-OC43
- (2)
MERS-CoV, SARS-CoV, SARS-CoV-2.
Figure 6 reveals certain differences in the structure of coronaviruses. In this instance, it is possible to distinguish three main groups. Viruses HcoV-NL63, HcoV-HKU1, HcoV-OC43 have a similar structure, almost invisible to the eye in two-dimensional representations, forming the first group among themselves. MERS-CoV, SARS-CoV, and SARS-CoV-2 viruses have a more pronounced fractal structuring, which is similar to all. Here, a higher concentration of dots (polynucleotides 1024 nucleotides long) is observed. The HcoV-229E virus is an intermediate variant between these two groups, closer to the first group.
The secondary structure of RNA is determined by the formation of a double helix. Unlike DNA, these helices are relatively short, typically shorter than 8–10 base pairs in length, and are interrupted by single-stranded nucleotides and branches. The method we used does not allow visualization of such short and branching structures since it is intended for visualization of sufficiently long nucleotide sequences. Therefore, we did not consider secondary structures in this study.
In this study, the task was to build visual representations of RNA chains of various coronaviruses for their visual representation and comparative analysis. The method used by the authors made it possible to construct linear mappings along the nucleotide chain, where features and heterogeneity in the RNA nucleotide composition are visible. Two-dimensional mappings were also obtained, in which RNA’s are represented as square matrices with fractal properties and symmetries. The fractal properties of these matrices are a consequence of the mathematics behind the Walsh functions, responsible for the noise immunity of genetic information. This article demonstrated the possibility of applying new methods to the analysis of coronavirus RNA.
3.2. A Visualization of SARS-CoV-2 Coronavirus Datasets
To perform genometric visualization of the SARS-CoV-2 coronavirus datasets, the authors used the US NCBI dataset published at
https://www.ncbi.nlm.nih.gov/datasets/coronavirus/genomes/ (accessed on 20 January 2022). This dataset contains about half a million (401,330) SARS-CoV-2 coronavirus samples.
Imaging did not involve any genetic sequence manipulation (alignment, etc.). In
Figure 7, each of the three plots corresponding to a set of nitrogenous bases with three forms of binary oppositional features shows all the instances represented in the dataset. In
Figure 7, we can see that despite the absence of any preparatory steps before genometric imaging, all coronavirus specimens presented in the dataset possess a similar structure in all (three) types of boolean properties.
Figure 8 shows the result of frequency imaging of the same dataset. Accordingly, we can conclude that this type of visualization has a considerable overlap of results. Here, we compare the SARS-CoV-2 with other familiar strains.
In general, the genometric approach as a variant of visualizing the nucleotide composition of DNA/RNA has proved its effectiveness in solving various practical problems for visualizing the nucleotide composition of the coronavirus RNA in various parameter spaces. The RNA length of coronaviruses was found to be sufficient for the manifestation of the fractal structure in two-dimensional visualizations (
Figure 6). It is worth noting that such a property as the manifestation of a fractal structure on two-dimensional genometrics is uncharacteristic of all viruses and depends on the length of the RNA of the virus. As a rule, the longer the RNA of the virus is, the more clearly we trace the structure in the parametric visualization space.
Summarizing the above, as a result of the calculated experiments, we can derive several conclusions. To divide the results into groups, it is better to use structural visualization. For a more qualitative difference in the results, it is more efficient to use integral visualization. On structural and integral visualizations, neural networks can be trained for fast recognition. Frequency imaging is unsuitable for comparative analysis on large datasets.
4. Conclusions
The article examined various types of imaging and carried out a comparative analysis of various strains of the coronavirus. Various variants of one of the coronavirus strains were also examined and visualized. The research results allow us to conclude that some visualization options have shown their clarity and effectiveness in displaying the nucleotide composition of coronaviruses.
The application of a new method for visualization and comparative analysis of coronaviruses RNA is shown. The scaling parameter was chosen based on a mathematical formula that allows choosing the optimal display scale.
The critical biological concept of the study is that any molecular genetic sequence of nucleotides, including the RNA of viruses, has three binary-opposite features. Simultaneously, one-to-one functional-geometric manifestations exhibit in various spaces. In this paper, we considered solely one- and two-dimensional images.
The scientific value of the proposed results lies in the visual representation of the molecular structure of such a complex and complex object as coronavirus RNA. This allows us to visualize and compare diverse types of coronaviruses in their easy-to-perceive parametric space. Our earlier articles [
16,
17,
18,
19,
20] describe in detail all methods of constructing visualizations.
At any rate, the problem of coronaviruses remains relevant. The number of severe complications and deaths from coronaviruses is on the rise. Moreover, the virus mutates. It has already caused serious economic and social difficulties, showing some systemic issues and imperfections of the health care system in several cases. In this regard, the relevance of studies to identify and compare the internal structure of various strains of coronaviruses is beyond doubt.
In this respect, the authors draw attention to the use of genometric imaging methods for research in the field of virology. The results obtained are apparent and demonstrate the possibility of using parametric visualization algorithms. There is a need to note that the presented visualization algorithms and the results of their application to identify the parametric structure of coronaviruses seem to be very promising, not only for human perception but also for machine learning methods and neural network algorithms. This is due to the ergonomics of the perception of genetic information, which receives a more structured look to improve the quality of the work of neural network algorithms and other analytical methods.
It should be noted that the results of this study correlate with the results of work [
21] devoted to visualization and analysis of coronaviruses based on machine learning technology. However, our research is focused on algorithms for the visual processing of genetic information for the comparative analysis of viruses, bypassing traditional machine learning methods.
The possibility and adequacy of new visualization tools in bioinformatics shown in this work will contribute to an in-depth study of the topic of pandemics and the involvement of various specialists in the analysis of genetic data, which, in turn, will contribute to solving urgent problems of bioinformatics and healthcare.
Compliance with Ethical Standards: this article does not include human or animal research by any of the authors. Ivan V. Stepanyan declares that he does not have any conflicts of interest. Michail Y. Lednev declares that he does not have any conflicts of interest.


