1. Introduction
The morphology of a galaxy can provide useful information about its characteristics, and galaxy morphology has been studied extensively in the past century [
1]. Basic classification of galaxy morphology includes the broad morphological types of elliptical, spiral and lenticular galaxies, and the classification can be extended to irregular [
2] and peculiar [
3] galaxies. Established and commonly used examples of more detailed systems for galaxy morphology classification are the Hubble sequence and the de Vaucouleurs system [
4].
One of the important tools used for studying the morphology of galaxies are catalogs of galaxies annotated by their morphology. Such catalogs can be prepared by astronomers who analyze large sets of galaxy images manually [
5,
6,
7]. In the era of Big Data and autonomous digital sky surveys, the vast astronomical pipelines reinforces the use of automation to annotate many millions of galaxies. Since manual analysis is limited by the amount of galaxies that can be analyzed, catalogs of galaxy morphology have been compiled by using the power of a large number of non-expert volunteers who inspect galaxy images manually, and collectively are able to provide morphological analysis of a large number of galaxies [
8,
9,
10]. More recently, computer vision algorithms have been used to annotate galaxies automatically and generate catalogs [
11,
12,
13,
14].
A visually dominant morphological feature of a spiral galaxy is its spin direction. Spiral galaxies may have clockwise or counterclockwise oriented patterns, separating spiral galaxies into two classes. Galaxy spin direction may be considered to be merely a feature of the location of the observer, as a galaxy that may seem to be spinning clockwise to an observer on Earth might seem to be spinning counterclockwise to an observer located at some distant galaxy. Therefore, galaxies that spin clockwise are expected to be symmetric to galaxies that spin counterclockwise in all of their morphological features, except from their spin direction.
Previous studies have shown clear evidence of photometric differences between clockwise and counterclockwise galaxies [
15,
16]. These experiments were based on photometric data taken from Sloan Digital Sky Survey [
15], the Panoramic Survey Telescope and Rapid Response System [
16], and Hubble Space Telescope [
16]. For instance, a supervised machine learning experiment was performed such that the label of each sample was the galaxy spin direction (clockwise or counterclockwise), and the features of each sample were the 454 photometric measurements provided by the SDSS pipeline. The results showed that for ∼64% of the galaxies, the machine learning algorithm was able to predict whether the galaxy is clockwise or counterclockwise based on the photometric variables [
15]. That accuracy is significantly stronger than the random chance classification accuracy of 50% (
p) [
15]. The experiment was also repeated using a galaxy dataset that was classified to galaxies that spin clockwise and galaxies that spin counterclockwise. That was done through a fully automatic process and without any human intervention, and provided similar results of ∼65% classification accuracy [
15].
Other studies showed evidence of asymmetry between the number of galaxies with opposite spin directions as observed from Earth [
17,
18,
19,
20,
21]. This consistent evidence using different instruments and various data analyses suggests that certain differences can exist between galaxies with opposite spin directions. Here, a machine learning method is applied to test whether galaxies that spin clockwise are morphologically the same as galaxies that spin counterclockwise as observed from Earth; while each galaxy is different, comparison of a large number of galaxies enables a statistical analysis that can allow to identify possible morphological differences between galaxies that spin in opposite directions.
2. Data
The main dataset used in the experiment contains 77,840 spiral galaxies that were classified automatically into clockwise and counterclockwise galaxies. The dataset is described in [
21]. As described in [
13], the galaxies were initially selected from SDSS DR8 such that the Petrosian radius of the galaxies was at least 5.5
, and i magnitude of less than 18 to filter galaxies that are too small or too dim to identify their morphology.
Then, the galaxies were separated by their spin directions. That was done by applying the Ganalyzer algorithm [
22], as was done in [
19,
20,
21]. Ganalyzer first applies a transformation of the galaxy image into its radial intensity plots. The radial intensity plot is an image of 360 × 35 pixels, such that the
X axis is the polar angle of the pixel in the original image compared to the galaxy center, and the
Y axis is the radial distance from the galaxy center in percents of the galaxy radius. Then, a peak detection algorithm is applied to identify groups of peaks in the horizontal lines of the radial intensity plot [
22]. Since pixels on the arm of the galaxy are expected to be brighter than pixels that are not on the arm of the galaxy, the group of peaks identify the galaxy arms. Each vertical line made by the peaks detected in the neighboring horizontal lines of the radial intensity plot is a galaxy arm, and the slope of the line corresponds to the direction of the galaxy arm. A linear regression is then applied to each vertical line, and the sign of the regression coefficient reflects the direction of the curve. The direction of the curve indicates whether the arm is leading or trailing, and therefore, can deduce the spin direction of the galaxy. The
Ganalyzer algorithm is fully described with examples and performance analysis in [
19,
20,
21,
22]. The use of the algorithm to generate the specific dataset of gakaxy images used here is described in [
21].
Because many galaxies, such as elliptical galaxies, do not have a visually clear spin direction, not all galaxies can be assigned with a spin direction by their visual appearance alone. To avoid galaxies with unclear spin direction, only galaxies that had at least 30 peaks in their radial intensity plots were used. Galaxies that did not have at least 30 peaks were not used in the analysis. Separating the galaxies to clockwise and counterclockwise galaxies provided a dataset of 39,187 galaxies that spin clockwise and 38,653 galaxies that spin counterclockwise. The entire process of the galaxy annotation is described in [
21].
Figure 1 and
Figure 2 show the distribution of the r magnitude and the redshift of the galaxies in the datset, respectively. The vast majority of the galaxies do not have spectra, and therefore, just the subset of 10,281 galaxies that had spectroscopic information could be used for deducing the redshift distribution.
In addition to the dataset of automatically classified galaxies, another dataset that was used in the experiment was a dataset of 13,440 galaxies used in [
15]. These galaxies were annotated and inspected manually by the author in a long labor-intensive process. Because the human perception is sensitive to the spin direction of the galaxy [
23], the galaxies were mirrored randomly before they were annotated. Then, the galaxies were mirrored again to verify that the annotation was correct. The two annotations of each galaxy were compared, and in case of disagreement, the galaxy was inspected carefully for the third time to determine whether its spin direction can be identified clearly. Just 12 galaxies had 2 conflicting annotations. Because the third manual inspection did not lead to a clear identification of the spin directions of these galaxies, all of these galaxies were excluded from the analysis.
Figure 3 shows examples of galaxies that are not necessarily elliptical, but their spin direction could not be determined in an obvious and reliable manner.
That process required substantial labor of about 150 h of work, but provided a clean dataset of 6941 clockwise galaxies and 6499 counterclockwise galaxies. For the rest of the galaxies, the spin direction could not be determined (e.g., edge-on galaxies). Galaxy pairs were also excluded from the experiment, and therefore, the weak spin magnitude correlation in galaxy pairs [
24] did not affect the results. A final inspection step included random selection of 500 galaxies to verify that all galaxies are classified correctly, and found no errors in the classifications.
3. Machine Learning Algorithm
Galaxy morphology has been analyzed by using deep neural networks (DNNs), and specifically deep convolutional neural networks [
12,
14,
25,
26,
27,
28,
29,
30]; while DNNs have demonstrated excellent performance in the automatic classification of image data, there are several downsides to using DNNs for purposes related to analysis of subtle asymmetries. DNNs rely on a large number of data-driven non-intuitive rules that are determined automatically during the training process, and are very difficult to understand. The nature of deep neural networks, therefore, makes it more difficult to turn the empirical results such as classification accuracy into useful insights about the specific features that identify differences between the galaxy morphological types. Moreover, DNNs are also sensitive to background information that can lead to substantial biases [
31]. These biases were also identified to be present among galaxy images, but are difficult to quantify due to the complex non-intuitive nature of the algorithm [
32]. In the absence of specific measurements, and given the assumption that the DNNs can be biased, DNNs might not be a sound approach to identifying subtle asymmetries in the morphology of galaxies.
To provide a more informative machine learning analysis of a possible asymmetry between galaxies with opposite spin directions, the Wndchrm method was used [
33]. Wndchrm is a non-parametric method that is not based on deep neural networks, and has been widely used to classify and analyze galaxy morphology [
13,
34]. Wndchrm implements a comprehensive and large set of numerical content descriptors that reflect multiple aspects of the image content, including textures [
35,
36], edges [
37], fractals [
38], statistics of the pixel intensities [
39], polynomial decomposition [
40,
41], Radon features [
42], and Gabor filters [
43]. These features are filtered automatically by their Fisher discriminant scores [
44], and classified by the Weighted Nearest Neighbor [
33] or other pattern recognition algorithms as will be described in this section.
Wndchrm is non-parametric in the sense that all features are computed for all images. The user is not required to make any preliminary assumption about the data, and the most informative features are selected automatically by the pattern recognition algorithm, and without involving decisions made by the user. The advantage of the approach compared to DNNs is that it uses defined features, and therefore, the analysis can identify specific morphological features that correlate with the asymmetry of spin directions of spiral galaxies. That is different from DNNs, which can provide high classification accuracy but does not excel in its ability to identify explainable differences between the classes; while the Wndchrm approach can identify specific defined image descriptors that can differentiate between the morphology of the galaxies, it is not certain that such features will be identified with statistical significance. However, the analysis attempts to identify such features. That analysis is not possible with DNNs, which often work as a “black box”, and does not allow to identify explainable attributes that differentiate between the different classes. An analysis with a DNN is described in
Section 3.3.
3.1. Machine Learning Analysis of the Manually Annotated Galaxies
The manually annotated galaxies taken from [
15] allowed a dataset of 12,000 galaxy images such that 5000 galaxies spinning clockwise and 5000 galaxies spinning counterclockwise galaxies were used for training, and 1000 from each class were used for testing. That allowed to train and test the Wndchrm image classifier described in
Section 3. The classifier was able to differentiate between the two classes in accuracy of ∼54.3%. The classification accuracy is not high, but it is higher than 50% mere chance accuracy, when the prediction of the galaxy is done by guessing. Using cumulative binomial probability such that the number of trials is 2000 and the chance of success is 0.5, the probability to have 1085 or more successes by mere chance is ∼0.00008.
Wndchrm was initially designed as a machine learning tool that can analyze images of cells [
33], and therefore, its image content descriptors are rotationally invariant, so that mirroring an image is not expected to lead to a difference in the Wndchrm analysis. Therefore, while clockwise and counterclockwise galaxies are visually different from each other, Wndchrm is not expected to differentiate between these galaxies, and a difference detected by Wndchrm might reflect other differences between the galaxy images that are not directly related to the spin direction. However, it might still be possible that some of the features are sensitive to the spin direction, leading to the ability of the classifier to identify between clockwise and counterclockwise spiral galaxies.
To completely eliminate the effect of the spin direction, two datasets were created such that each dataset had two classes, and all galaxies in both classes have the same spin direction. That was done by mirroring all images of one of the classes in each dataset. The first dataset contained one class of the original clockwise galaxy images and another class of the mirrored counterclockwise galaxy images. The second dataset contained the original counterclockwise galaxy images, while the clockwise galaxies were mirrored. That provided two datasets such that each dataset contained two classes, and all galaxies in the two classes had the same spin direction. The uncompressed TIFF file format was used, so that no compression can have an impact on the mirrored images.
While the TIFF format is not a common file format in astronomy, it is much more frequent in the field of machine vision. Normally, the TIFF format does not allow to deduce accurate photometric information that is available when using other formats such as FITS. However, in the case of this study, the important information is not the photometry, but the morphology of the galaxies, and therefore, the ability to deduce accurate photometry, is not a primary expectation from the image format. Because the TIFF images contain several color channels in a single image file, they provide more useful information to analyze the shape of the galaxy compared to FITS images, which normally provide a single color band. The TIFF files are not compressed, to avoid possible effect of the compression algorithm.
The machine learning experiment was then repeated using each of these datasets. The numerical image content descriptors were classified using several different pattern recognition algorithms. These supervised machine learning algorithms are Weighted Nearest Distance (WND) [
33], as well as Random Forest [
45], Decision Table [
46], Naive Bayesian classifier [
47], Dagging [
48], Bagging [
49], OneR [
50], and radial basic function (RBF) Networks [
51], available as part of the Weka machine learning software [
52,
53].
The classification accuracy was also compared to the classification accuracy observed when the galaxies were separated randomly into clockwise and counterclockwise galaxies.
Figure 4 and
Figure 5 display the classification accuracy of each of the classifiers when the clockwise galaxies are mirrored and when the counterclockwise galaxies are mirrored, respectively.
As the figures show, the classification accuracy of the dataset where the clockwise galaxies were mirrored was ∼54.6% (p≃ 0.00002), and the accuracy of the dataset in which the counterclockwise galaxies were mirrored was ∼54.1% (p≃ 0.0001). The observation that clockwise and counterclockwise galaxies can be identified by a machine learning algorithm with higher accuracy than mere chance shows that even when the spin direction is the same, the classifier can still differentiate between clockwise and counterclockwise galaxies, indicating that there could be differences between these galaxies other than the spin directions. That means that when observing a large number of spiral galaxies, galaxies that spin in one direction can be morphologically different from galaxies spin in the opposite direction.
When assigning the galaxies with random spin directions, the classification accuracy using WND was ∼49.7%. The probability to have that classification accuracy by chance is ∼0.37. All other machine learning algorithms provided similar results, i.e., around mere chance accuracy.
3.2. Machine Learning Analysis Using Computer-Annotated Data
To compare the results with a dataset that was annotated in a fully automatic manner, the same analysis was applied using the automatically classified dataset described in
Section 2. For the experiment, the galaxies with spectra were used, providing a dataset comparable in size to the manually classified dataset, with 5142 counterclockwise galaxies and 5139 galaxies that spin clockwise.
As with the manually classified dataset, the clockwise galaxies were classified against the mirrored counterclockwise galaxies, and the counterclockwise galaxies were classified against the mirrored clockwise galaxies. That led to two different datasets, each with two classes, and in each dataset, the galaxy images in both classes had the same spin direction. The classification accuracy of the clockwise and counterclockwise galaxies using different pattern recognition algorithms are displayed in
Figure 6.
As the graphs show, the classification accuracy is comparable to the classification accuracy of the dataset of manually classified galaxies described in
Section 3.1. The random forest algorithm outperformed the WND classifier, and the Decision Table algorithm provided the highest classification accuracy. The naive Bayes and the OneR classifiers provide a classification accuracy very close to mere chance, but the other classifiers all provide a classification accuracy higher than random.
3.3. Analysis Using a Deep Convolutional Neural Network
Another experiment used the same dataset used in
Section 3.2, but the images classifier that was used was a deep convolutional neural network. The neural network that was used was of simple architecture as described in [
32], and based on the LeNet-5 architecture [
54]. The full description of the network is available in [
32].
As before, 1000 images from each class were used for testing, and the rest for training and validation.
Table 1 summarizes the classification accuracy observed with three different experiments. In the first experiments, the galaxies were not mirrored. That experiment was followed by two other experiments in which the clockwise or counterclockwise galaxies were mirrored to normalize the spin direction of the entire dataset. A fourth experiment was performed by assigning random spin directions to the galaxies. In all cases, the neural networks were trained from initial random weights, and without using any pre-defined weights in the form of transfer learning that might have an unexpected impact on the analysis.
As the table shows, the original images were classified in accuracy far higher than mere chance. That can be explained by the fact that CNNs are not rotationally invariant, and therefore, the CNN can differentiate between galaxies with opposite spin directions. When normalizing the images by mirroring one of the classes, the results become comparable and slightly higher than the results observed with the feature-based machine learning algorithms. When assigning the galaxies with random labels, the classification accuracy drops to random accuracy level.
3.4. Numerical Image Content Descriptors
Wndchrm uses a comprehensive set of 2885 numerical content descriptors of the visual data [
33], weighted by their Fisher discriminant scores. More informative descriptors have a higher Fisher discriminant score, and therefore, a stronger impact on the classification decision. These image content descriptors are extracted from the raw pixels, as well as from different transforms of the image [
33]. The groups of numerical image content descriptors with the highest cumulative Fisher discriminant scores are displayed in
Figure 7. As the figure shows, numerous different numerical image content descriptors differentiate between galaxies that spin clockwise and galaxies that spin counterclockwise.
None of the numerical image content descriptors shown in
Figure 7 show a statistically significant difference in the means measured in clockwise and counterclockwise galaxies. The features with the highest Fisher discriminant scores are the Zernike features [
41] extracted from the Wavelet transforms of the galaxy images. The Zernike moment of degree
m and angular dependence
n is defined by
, where
is the complex conjugate and
is the polar coordinate expression of the Zernike polynomial
.
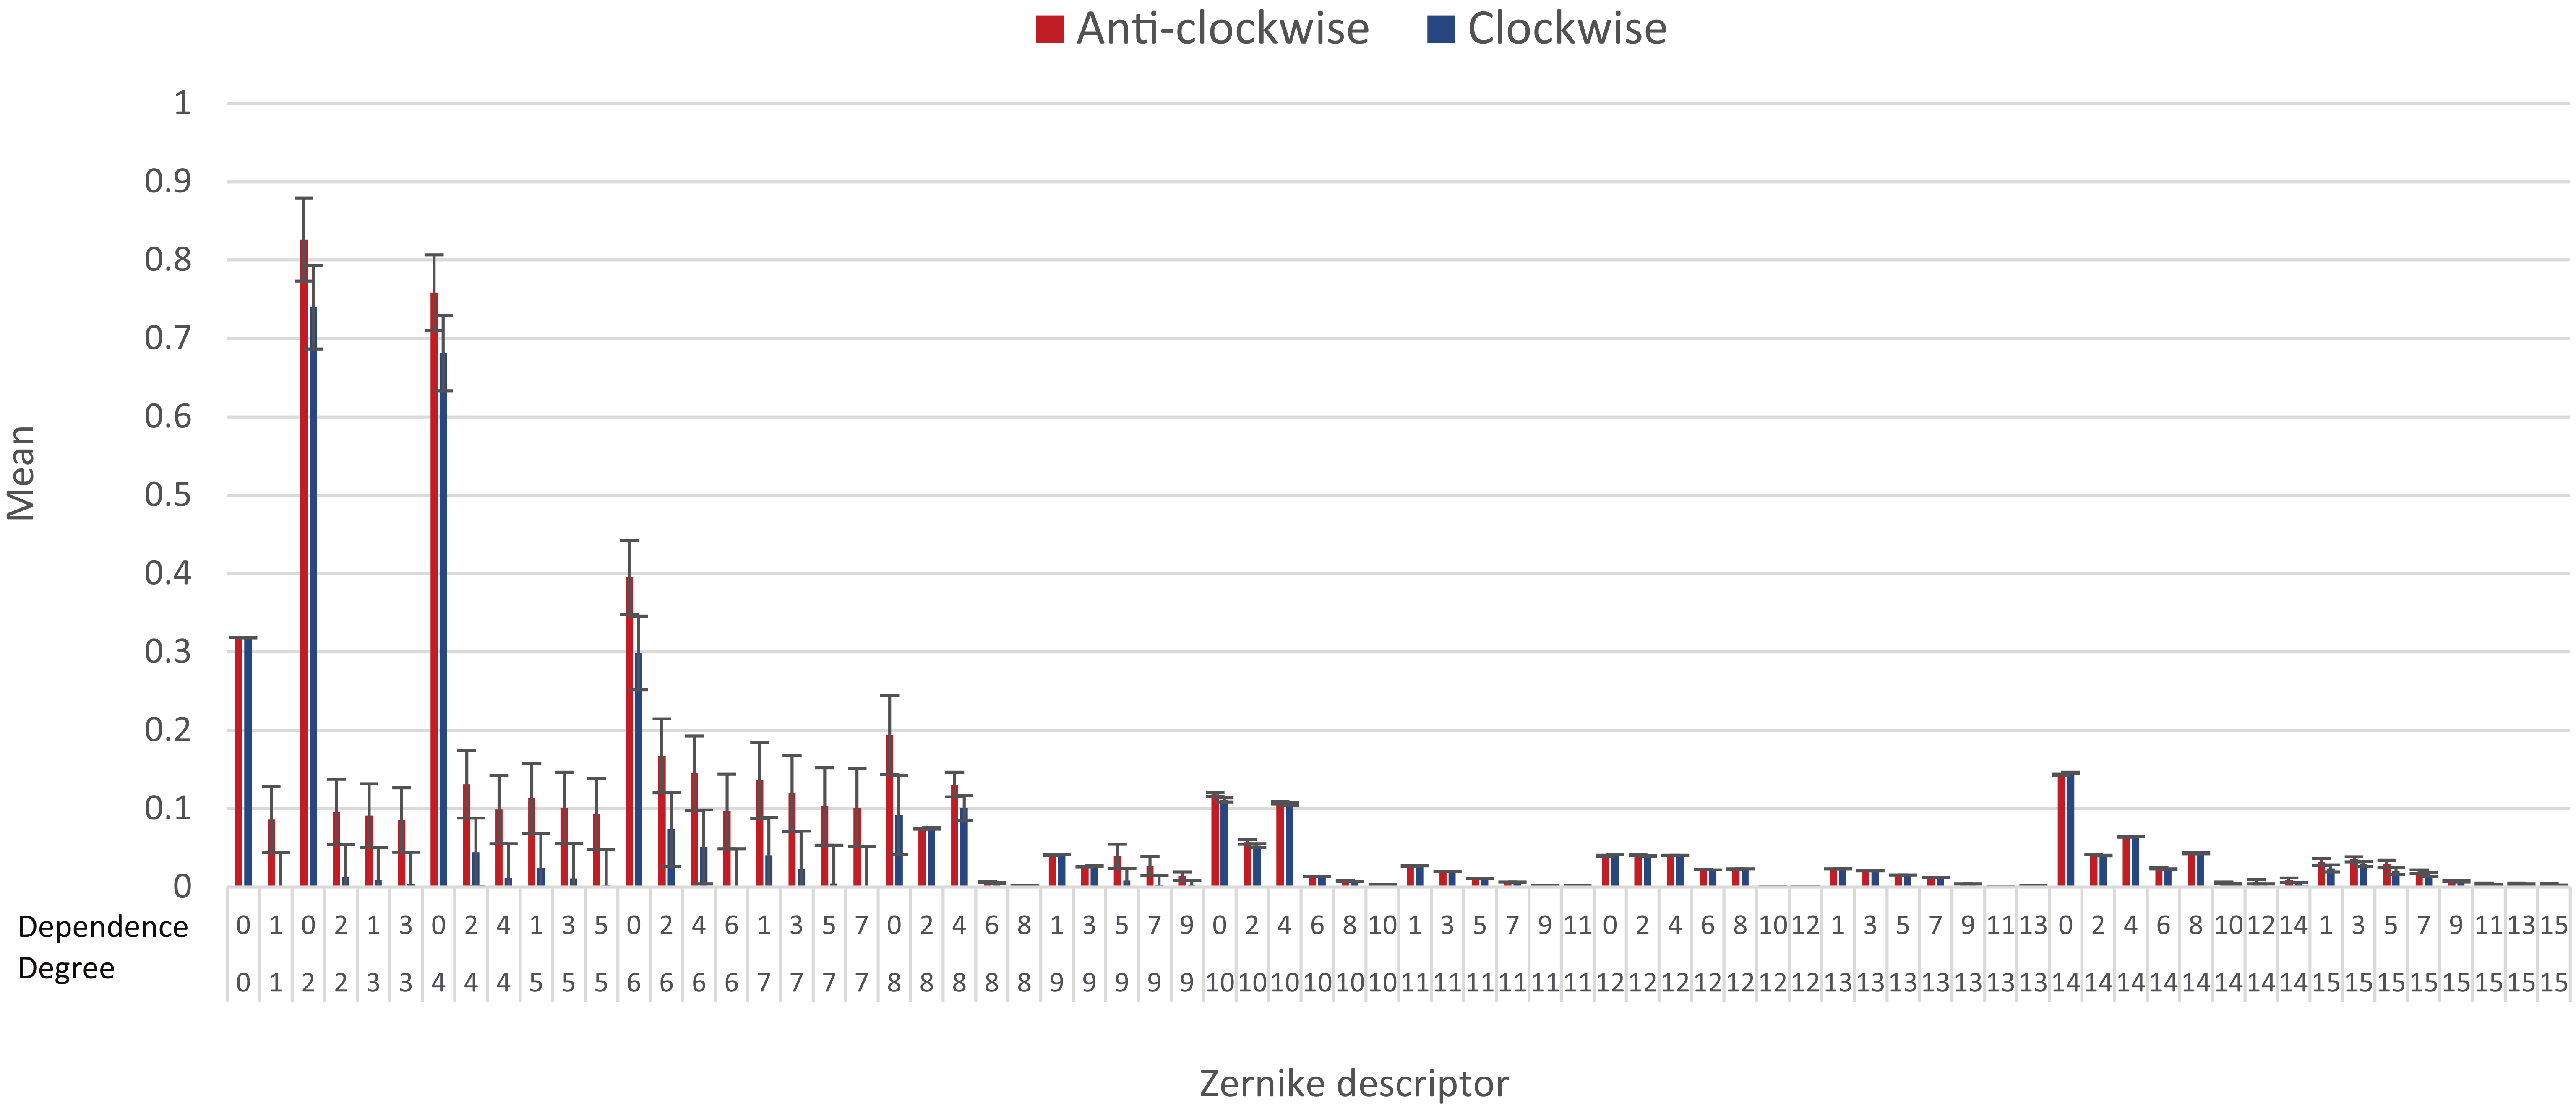
The Zernike features used by Wndchrm are the magnitude of the complex numbers, leading to 72 descriptors based on the different degrees and angular dependences, up to a degree of 15 [
33]. The means of these descriptors measured from clockwise and counterclockwise galaxies are displayed in
Figure 8.
None of these features show a statistically significant difference, but it can be noticed that the feature values are somewhat higher for counterclockwise galaxies in the lower degrees, especially when the angular dependence is 0. Although the differences are not statistically significant, they can imply that counterclockwise galaxies have better fitness when the number of consistent changes in pixel intensity around the center is lower. That can happen if clockwise galaxies are flatter and more dense than counterclockwise galaxies, and have a less dominant bulge. It is important to note that these differences are not statistically significant, and the variety of shapes of spiral galaxies in each of the group makes it difficult to make clear characterization of all galaxies within each class.
3.5. Redshift Effect on the Classification of Clockwise and Counterclockwise Galaxies
Another experiment that was performed aimed at testing the change in the accuracy of the automatic classification when the galaxies are limited to certain redshift ranges. For that purpose, the galaxies were divided into five redshift ranges of 0–0.04, 0.02–0.06, 0.04–0.08, 0.06–0.1, and 0.08–0.12. When , the number of galaxies drops sharply, and does not allow sufficient data to train and test the machine learning algorithm.
The ability of the algorithm to separate automatically between clockwise and mirrored counterclockwise galaxies (and vise versa) was done as described in
Section 3, such that 1500 clockwise and counterclockwise galaxies in each redshift range were used for training, and 100 galaxies from each class for testing. Because the number of test galaxies was low, the experiment was done by using cross-validation, such that the classification of the galaxies in each redshift range was repeated 15 times, and in each run, 100 different galaxies per class were used for testing. Then, the accuracy of the 15 runs was averaged to deduce the classification accuracy.
Figure 9 shows the average classification accuracy between images of clockwise galaxies and mirrored images of counterclockwise galaxies, and between counterclockwise galaxies and mirrored clockwise galaxies for each redshift range.
As the figure shows, the classification accuracy tends to increase when the redshift gets higher; while it is expected that galaxies with higher redshift would seem fainter and smaller, the galaxies in the dataset were all bright and had large surface size. In any case, the effect of the redshift is expected to impact both clockwise and counterclockwise galaxies equally. That means that if clockwise galaxies become smaller and fainter due to the higher redshift, galaxies spinning counterclockwise in the same redshift range are also expected to become smaller and fainter. Because both clockwise and counterclockwise galaxies are taken from the same field and the same redshift range, the impact on the redshift should be equal on both clockwise and counterclockwise galaxies, and therefore, is not expected to increase the classification accuracy when assuming that clockwise and counterclockwise galaxies are not different in their morphology.
4. Discussion
The nature of galaxy rotation is one of the greatest mysteries in space science, and it is not clear why and how galaxies rotate. Early astronomers assumed that the rotation of stars around their galaxy center is driven by gravity, as is the case of planets orbiting their star. That turned to be not nearly the case, as it has been shown and proven that unlike planets, the velocity of stars does not change significantly as their distance from the galaxy center increases [
55]. That unexpected observation led to the assumption that the vast majority of the mass of a galaxy is made of dark matter that does not interact with light or any other radiation [
55]. Other theories proposed that the rotation of galaxies is driven by different physics that does not agree with the known Newtonian physics [
56,
57,
58], and that modifications to Newtonian dynamics (MOND) can explain the anomaly of the galaxy rotation, as well as other observations such as the Hubble constant tension [
59]. Despite five decades of research, no proven answer has been found, and research efforts are still being continued. In fact, more recent observations showed that the common assumption that galaxy rotation was initiated by gravitational interactions might not be correct, as rotating galaxies have been observed before they could interact with other galaxies and spin according to the current models [
60]. Such observations agree with theories of primordial spin [
61], and in such a case, it can be expected that the spin directions of galaxies at higher redshift are aligned [
20].
This paper applies machine learning to study the symmetry of galaxies with opposite spin directions. Substantial previous work, starting in the 20th century, proposed that the number of galaxies with opposite spin directions is not necessarily equal within statistical fluctuations [
17,
18,
19,
20,
21]. More recent work also proposed that the brightness and color of galaxies that spin in opposite directions is, on average, different [
15,
16]. This study aims at addressing a new type of asymmetry between galaxies that rotate in opposite ways, which is the morphology of the galaxies. The morphology of a galaxy is definitely linked to its color and distance from Earth, and therefore, differences in color and brightness of the galaxies can also be linked with their morphology, making the observation shown in this paper expected.
By analyzing the morphology using machine learning, this study shows that the morphology of galaxies that spin clockwise can be different from the morphology of galaxies that spin counterclockwise. Naturally, a single galaxy cannot be used to show such difference, and therefore, the study is done by analyzing a large number of galaxies, and classifying them by their images. The results show that a machine learning classifier can identify the galaxy spin direction based on its shape in accuracy higher than mere chance. That shows that spiral galaxies that spin in opposite directions are not necessarily symmetric on a large scale.
One of the observation is the link between the morphological differences and the redshift. That link might be considered unexpected, as the level of details of the galaxy images is expected to decline as the redshift gets higher, and therefore, an image classifier is expected to become less informative when classifying between these images of galaxies with higher redshift. On the other hand, it has been shown that the asymmetry between the number of galaxies that spin in opposite directions increases with the redshift [
20]. Redshift is known to correlate with the morphology of the galaxies [
62,
63]. Therefore, a higher population of galaxies that spin in a certain direction at the higher redshift ranges is expected to lead to certain average differences in the morphology of these groups of galaxies. That is, if the morphology of the galaxies is linked to its redshift, and the distribution of clockwise and counterclockwise galaxies changes in different redshifts ranges, the morphology of the galaxies can become different.
Clearly, further research will be required to verify the observations and fully characterize and profile its nature. Future work will include the analysis of larger datasets, covering a larger footprint of the sky. Such analysis can allow to better profile the differences in morphology at different redshift ranges and different parts of the sky. Sky surveys such as the Dark Energy Survey (DES) and the Dark Energy Spectroscopic Instrument (DESI) Legacy Survey can provide such large datasets of galaxy images, and the Dark Energy Spectroscopic Instrument can provide the spectra of a high number of galaxies. Such data can allow to identify possible large-scale patterns exhibited by the possible asymmetry of the morphology of galaxies spinning in opposite directions.


