Article

Hybrid Sparrow Clustered (HSC) Algorithm for Top-N Recommendation System

by
Bharti Sharma
1,
Adeel Hashmi
1,
Charu Gupta
2,*,
Osamah Ibrahim Khalaf
3,
Ghaida Muttashar Abdulsahib
4 and
Malakeh Muhyiddeen Itani
5
1
Maharaja Surajmal Institute of Technology, New Delhi 110058, India
2
Bhagwan Parshuram Institute of Technology, New Delhi 110089, India
3
Al-Nahrain Nanorenewable Energy Research Center, Al-Nahrain University, Baghdad 64074, Iraq
4
Department of Computer Engineering, University of Technology, Baghdad 10066, Iraq
5
General Education Program, Dar Al-Hekma University, Jeddah 22246, Saudi Arabia
*
Author to whom correspondence should be addressed.
Symmetry 2022, 14(4), 793; https://doi.org/10.3390/sym14040793
Submission received: 5 March 2022 / Revised: 18 March 2022 / Accepted: 30 March 2022 / Published: 11 April 2022

Abstract

:
Recommendation systems suggest relevant items to a user based on the similarity between users or between items. In a collaborative filtering approach for generating recommendations, there is a symmetry between the users. That is, if user A has similar interests with user B, then an item liked by B can be recommended to A and vice versa. To provide optimal and fast recommendations, a recommender system may generate and keep clusters of existing users/items. In this research work, a hybrid sparrow clustered (HSC) recommender system is developed, and is applied to the MovieLens dataset to demonstrate its effectiveness and efficiency. The proposed method (HSC) is also compared to other methods, and the results are compared. Precision, mean absolute error, recall, and accuracy metrics were used to figure out how well the movie recommender system worked for the HSC collaborative movie recommender system. The results of the experiment on the MovieLens dataset show that the proposed method is quite promising when it comes to scalability, performance, and personalized movie recommendations.

1. Introduction

With the rapid expansion of information on the Web, locating relevant information has become a prominent issue. E-commerce has grown significantly in the Internet era, enabling the selling of various products. E-commerce users face difficulties when it comes to selecting a product among millions of options. The recommendation system assists the e-commerce user in making selections among millions of products [1]. A recommender system (RS) gathers information about the goods a consumer is interested in and makes recommendations about those items or products [2]. Nowadays, practically every e-commerce website makes use of RS, supporting millions of users. E-commerce sites such as Netflix and MovieLens [3] for movies, Amazon [4] for books, CDs, and a variety of other things, Entree for restaurants, and Jester [5] for jokes all make use of a recommender system to aid their customers. The recommender system’s output is used by both e-commerce organizations and users [6]. That is, RS not only assists the consumer in obtaining the desired item, but also increases the organization’s revenue by selling more products.
A recommender system’s objective is to give relevant product recommendations to the customer. Algorithms for recommendation systems fall into three broad categories: collaborative, content-based, and hybrid [2]. Collaborative filtering (CF) is the simplest and most efficient of the three algorithms, having been implemented in a variety of real-world applications, including Netflix and Amazon. According to the prediction approach utilized, CFs can be classified as item-based or user-based. Collaborative filtering identifies individuals who share common interests and generates predictions about them. On the other hand, the item-based approach proposes the most related things to the user. The symmetric relationship of collaborative filtering have been exploited in SRMC [7] and PCA-SVD transformed K-means++ [8] approach. Content-based filtering (CBF) [9,10] makes a suggestion based on what the same person did before. The CBF is based on the item’s description and the user’s background [11,12]. For example, when you use the demographic filtering technique [13], you look for people who have the same nationality, age, gender, and more. In [14] hybrid filtering is discussed, which combines both the filtering techniques [15,16]. In order to improve the performance of CF, different clustering techniques are used to make better recommendations based on what users like [17,18]. Clustering is a way to group people together based on how well they rate the same things. A cluster of users is sent to an active user who likes the same things as the people in that cluster. Clustering methods like k-means and fuzzy c-means are available in user-based CF. The quality of the recommendation system is still an open question.
Several techniques have been devised for the development of recommender systems, including swarm-based algorithms [19]. These algorithms are nature-inspired and based on the decision-making capabilities of decentralized and self-organized clans of organisms in a community. These organisms obtain local information from the environment as well as other agents. These organisms’ co-evolutionary behavior resembles the iterative nature of swarm algorithms, such as the firefly algorithm (FA), cuckoo search algorithm (CSA), grasshopper algorithm (GA), whale algorithm (WSA), sparrow search algorithm (SSA), etc. [
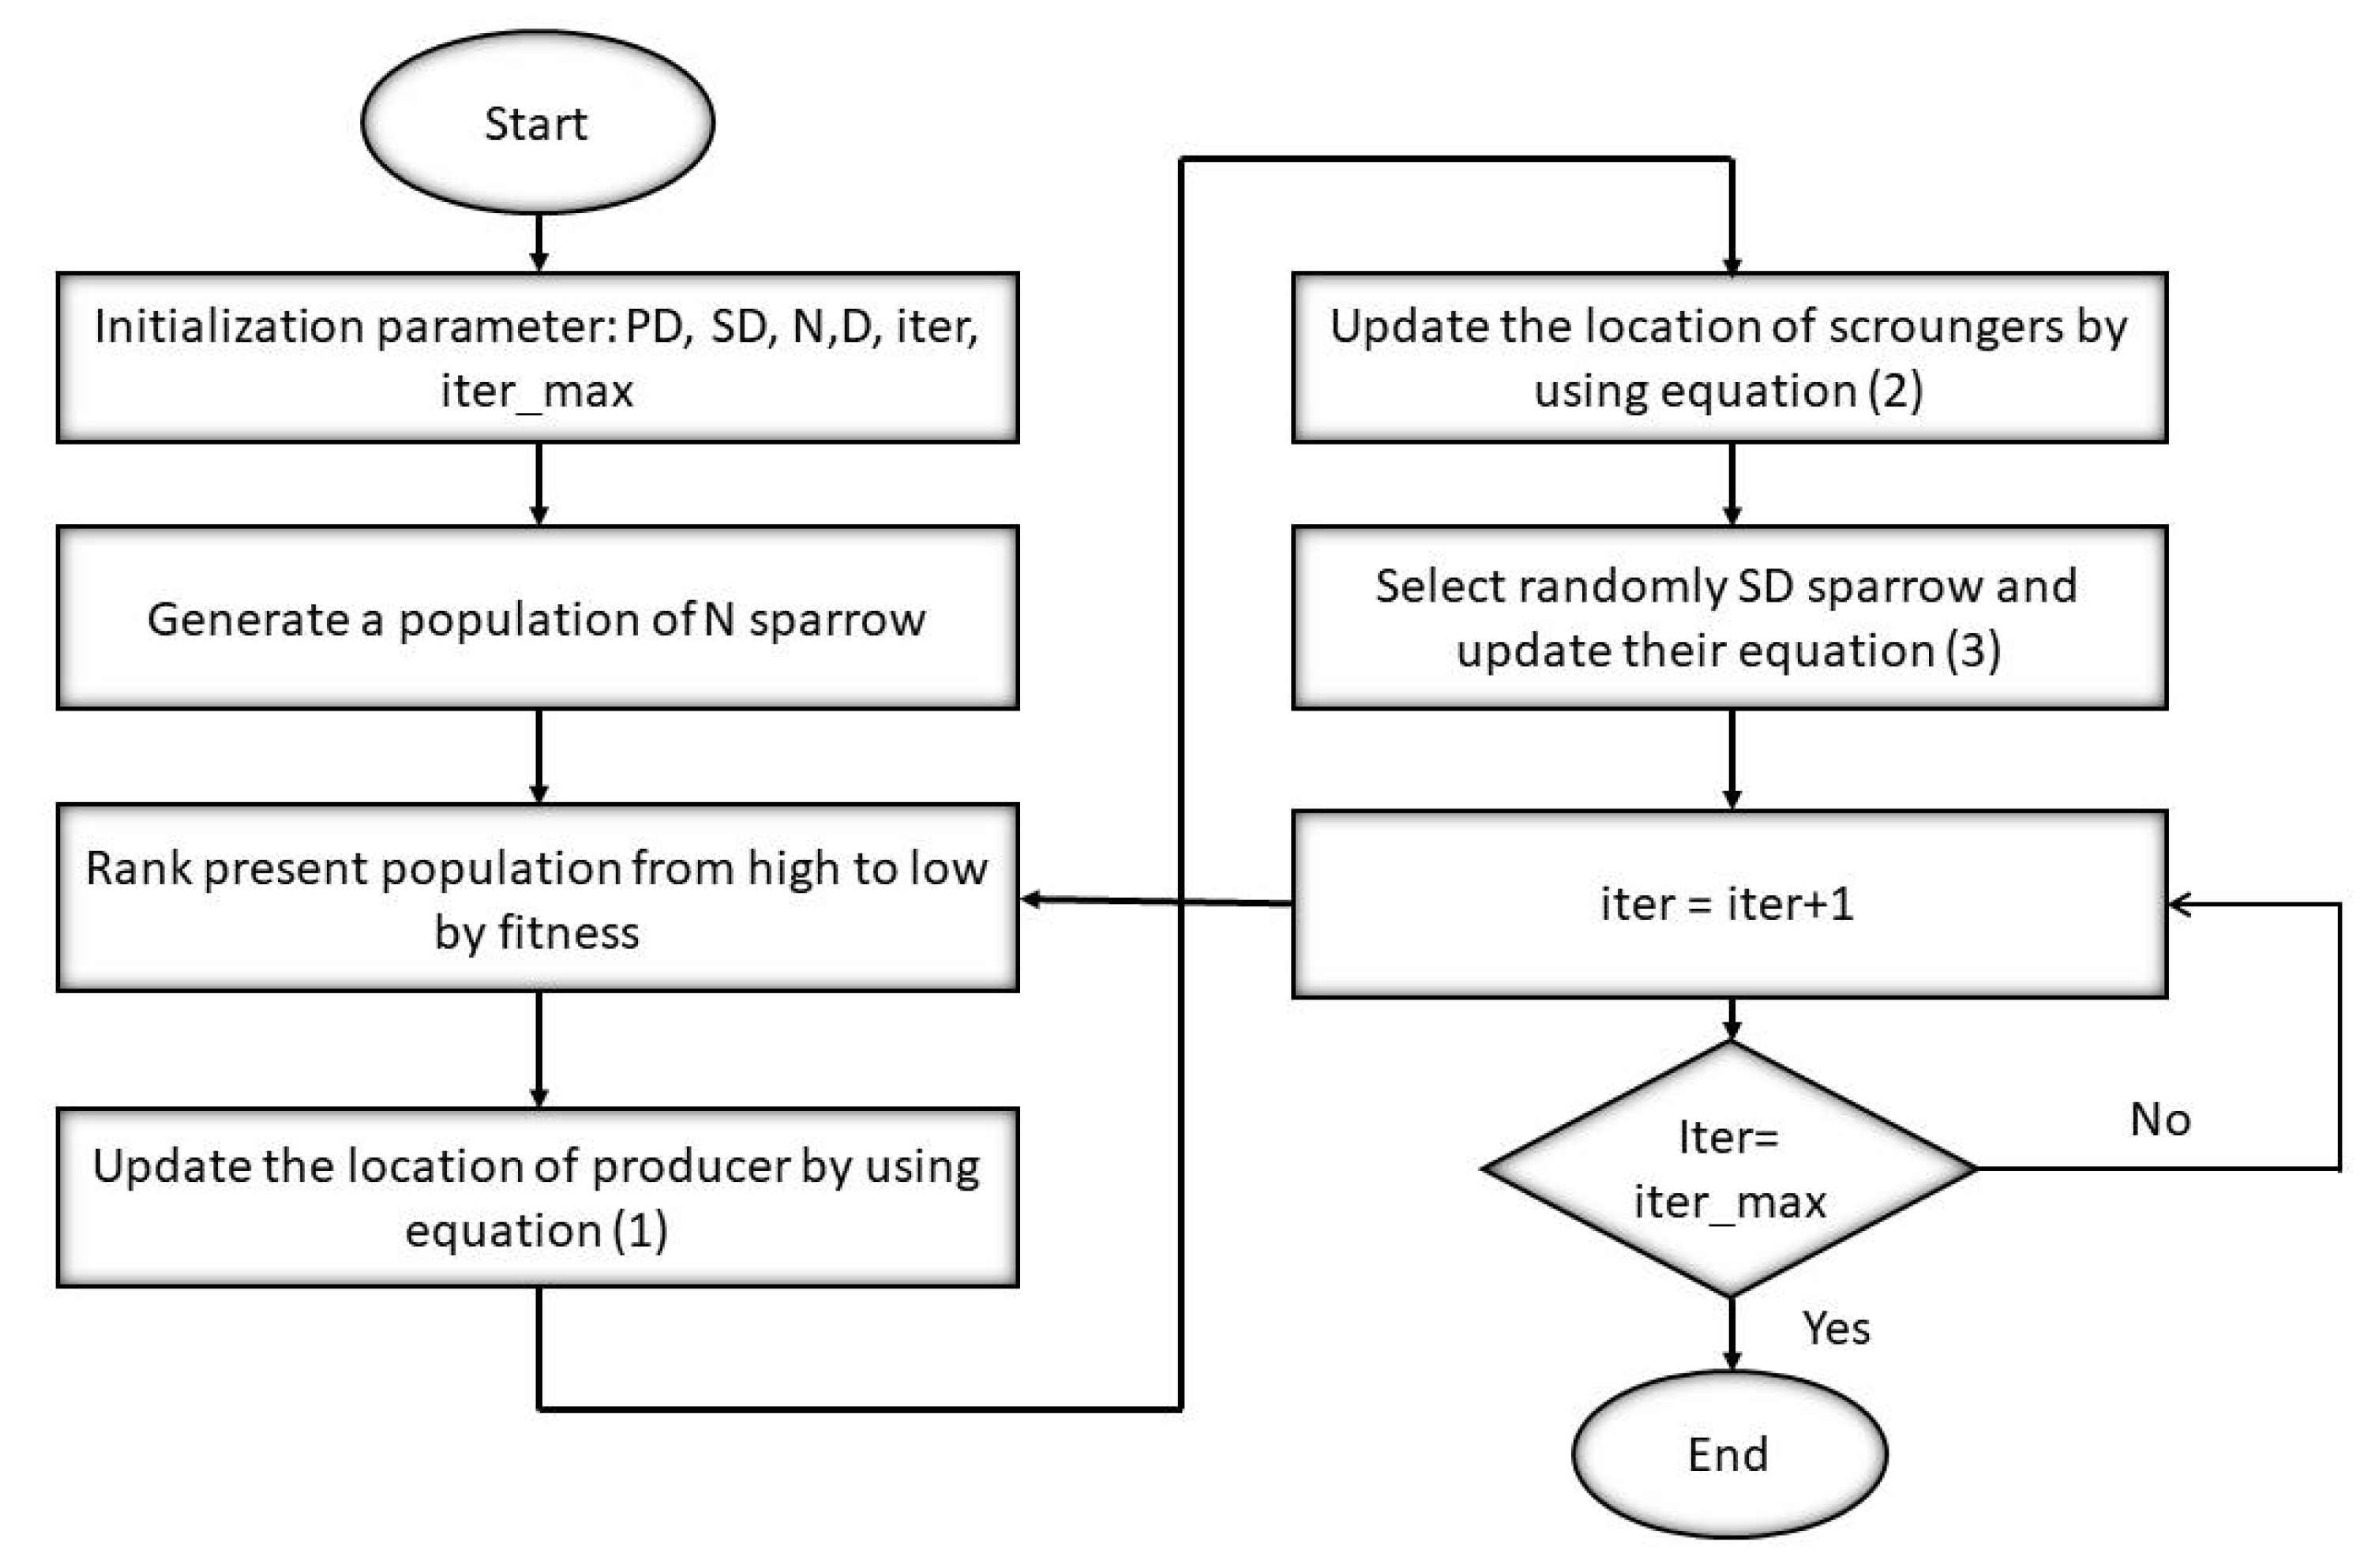
20]. SSA is based on the group wisdom, foraging, and anti-predator behavior of sparrows [21]. This is why it is used in research to find the best way to improve [22,23,24,25,26,27,28,29,30].
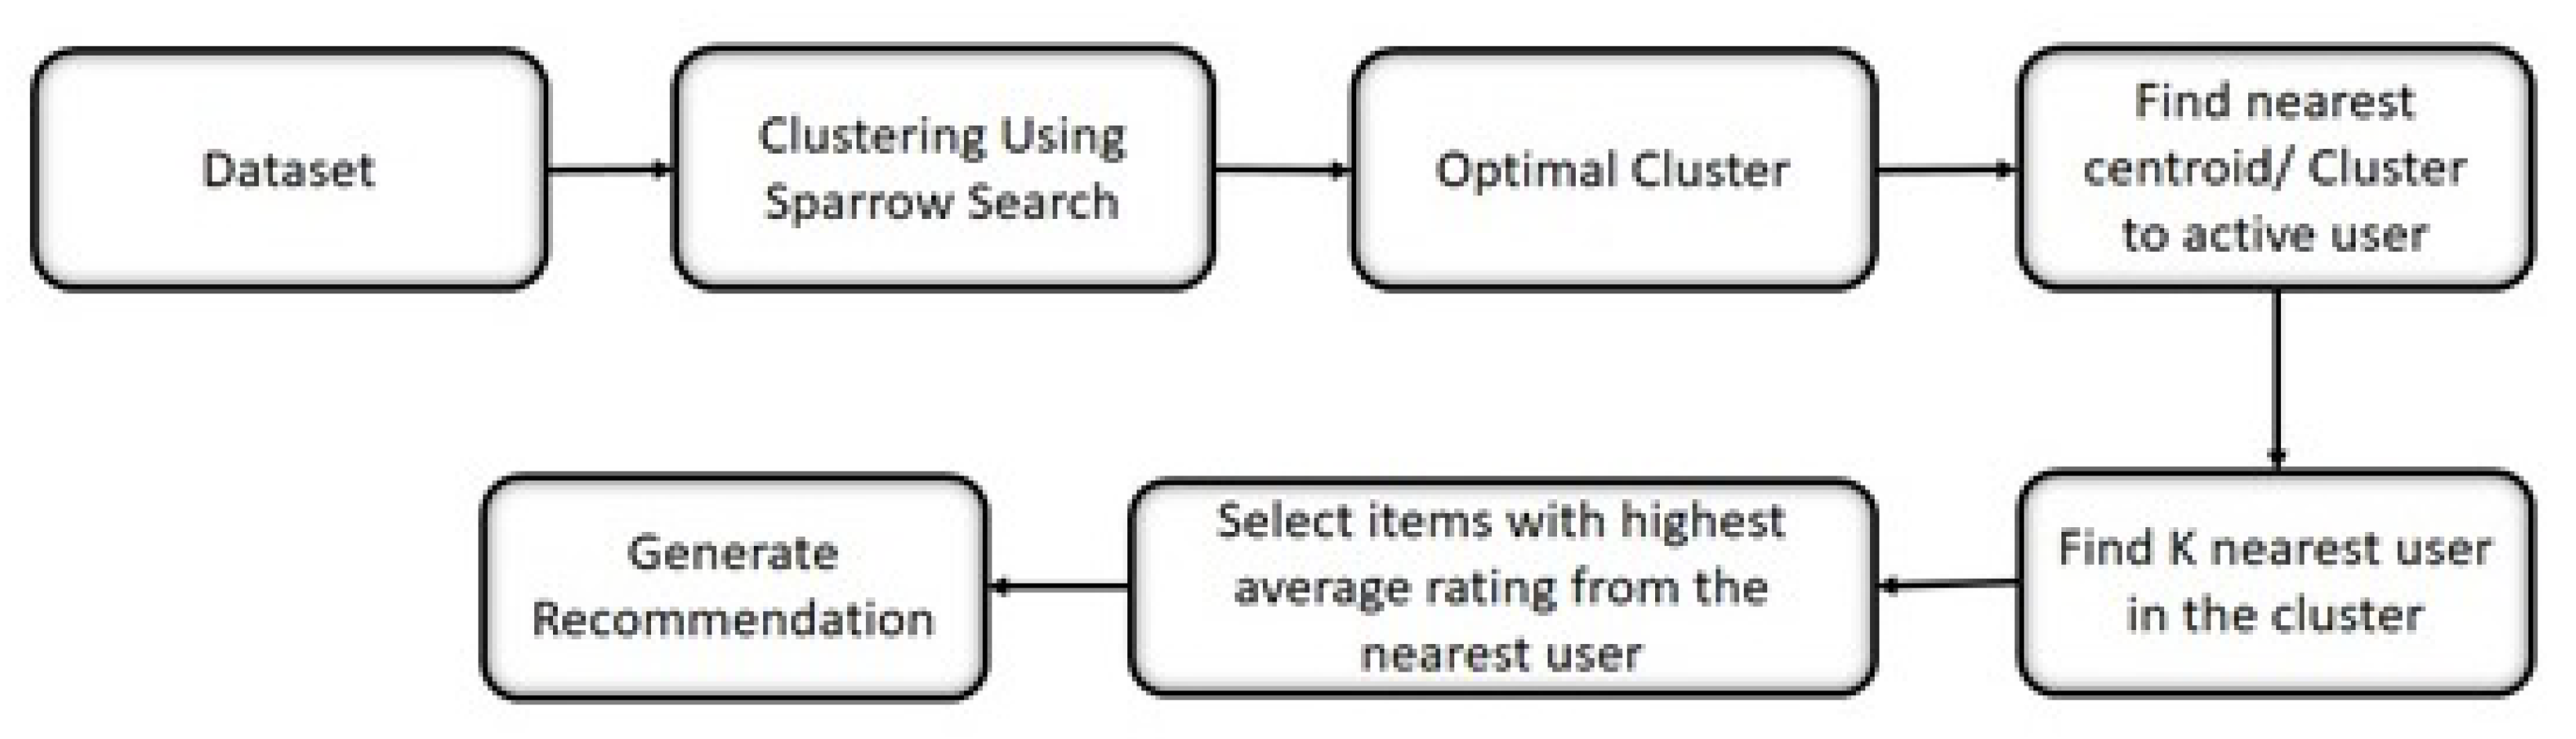
In this paper, we incorporate swarm intelligence-based optimization to generate optimal cluster(s) for a recommendation system by using a sparrow search algorithm. The proposed algorithm exploits the symmetric relationships between the users to generate better recommendations. Swarm-based recommendation systems work in two phases, which include the training phase and recommendation phase. Phase I is an offline process in which a rating matrix is produced from the collected data and clusters are obtained by using a swarm clustering algorithm. Phase II is an online process in which the recommendation for an active user is performed.
The rest of the paper is organized as follows: Section 2 provides the literature survey related to swarm intelligence and recommender systems, Section 3 presents the methodology used for generating recommendations, Section 4 deals with experiments and results, and Section 5 gives the conclusion and future scope.

2. Related Work

Some important things to ponder when evaluating the CF recommender systems are covered in [31]. These include the user’s task, the dataset used, and how to judge a recommender system’s accuracy. One way to make a recommendation is to use clustering. The cluster that is formed must have a minimum number of inter- and the maximum number of intra- similarities [14]. Clustering techniques are used a lot in CF-based recommender systems to make them work better.
According to Feng et al. [32], co-clustering can increase the performance of top N suggestions. They demonstrate a recommendation system called user–item community detection-based recommendation (UICDR). The primary idea is to create a bipartite network of data about how people and objects interact. Individuals and objects are classified into several categories. When we have clusters of people and things, we may apply its same collaborative filtering algorithms to each cluster. The results demonstrate that the suggested method can greatly improve the performance of the top N suggestions for a variety of well-known collaborative filtering techniques.
In [33], the clustering method is used to make traditional recommender systems work better with multi-criteria ratings. It used Mahalanobis distance to figure out how similar people in the same cluster are, which made recommendations more accurate. The authors of [34] came up with a way to improve the quality of recommendations by using a weighted clustering method viz. spherical k-means. If there are a lot of users and a lot of items, this method doesn’t get more complicated (in contrast to existing incremental methods). Therefore, the proposed collaborative filtering system is better for dynamic settings, wherein there are a lot of databases and information changes quickly. In the experiments, real-world datasets were used to see how well and how quickly the method works in terms of scalability and how well it makes recommendations.
Numerous research publications have demonstrated that traditional clustering approaches (such as k-means clustering) can provide local bests. Thus, clustering and algorithms inspired by nature-inspired global optimization can be employed to enhance the performance of recommendations. Reference [35] developed a hybrid movie recommendation system that incorporated both genetic algorithms (GAs) and k-means clustering. It employs principle component analysis (PCA) to reduce the size of the movie population space, hence speeding up the calculations. The studies (conducted on the MovieLens dataset) demonstrate that the suggested method is capable of being extremely accurate and providing more dependable and tailored movie recommendations than existing methods. The authors of [36] used the PSO to enhance the performance of a recommender system. They employed a k-means approach to obtain the initial parameters for particle swarm optimization in the suggested method (PSO). PSO begins with a seed and enhances fuzzy c-means (FCM) to do soft grouping of data (users) rather than hard clustering as in k-means.
The author of [37] devised a method for making a top-N recommendation based on ant behavior. This approach is divided into two sections. Users’ opinions are clustered into categories with a preset number of clusters by using an ant-based clustering technique. The results are then kept in a database for future recommendations and can be used to assist individuals in locating what they’re looking for. The second phase involves making a recommendation to the user who is currently using the app. The new method’s efficiency was evaluated by using the Jester dataset and was compared to a conventional collaborative filtering-based approach. The proposed solution outperforms the usual recommender system, as demonstrated by the findings.
The authors of [38] create a collaborative recommender system for movies by using a gray wolf optimization algorithm and fuzzy c-means (FCM) clustering. To obtain the initial clusters from the MovieLens dataset, the gray wolf optimizer technique is employed. FCM is used to categorize users in a dataset according to how similar their ratings are. The authors of [39] made recommendations by using the collaborative filtering technique, k-means clustering, and cuttlefish optimization. The proposed solution begins with the k-means algorithm, which groups people with similar tastes together, and then uses the cuttlefish algorithm to generate the best recommendations based on the k-means algorithm’s results.
In [40], the authors combine the k-means and cuckoo search algorithms to create recommender systems, whereas in [41], the k-means clustering technique is combined with an algorithm for optimizing artificial bee colonies. In the first phase of the proposed strategy, k-means is employed to classify people into distinct clusters. The second phase employs the artificial bee colony optimization technique to enhance the k-means procedure’s outcomes [42]. The proposed method’s results demonstrate significant progress in terms of scalability and performance. Additionally, they provide more accurate personalized movie recommendations by avoiding the cold start issue. In [43], an urban travel recommendation is made by using a hybrid quantum-induced swarm intelligence clustering. The authors demonstrate a novel method for grouping users in order to create a collaborative filtering-based recommender system that takes advantage of quantum-behaved particle swarm optimization. Because clustering algorithms were combined with collaborative filtering to put individuals with shared characteristics into clusters, the recommendation’s efficiency was boosted.
For dynamic recommendation systems, [44] discusses an evolutionary clustering method that groups objects based on their time characteristics. The clustering algorithm creates comparable user groups and increases them over time. This graph illustrates how user performance evolves over time in terms of accuracy and relevance. The authors of [45] demonstrate how to use evolutionary clustering to forecast ratings based on user collaborative filtering. The primary objective of the strategy demonstrated is to put people with similar interests together and to assist them in finding things that best suit their inclinations. Collaborative filtering is used in each cluster following the clustering procedure. The target rating is determined collaboratively by the users in the cluster. The authors of [46] use hierarchical particle swarm optimization to do clustering (HPSO-clustering). It is based on the PSO method and offers both hierarchical and partitional clustering advantages. The authors of [47] employ three techniques: visual clustering recommendation, a blend of visual clustering, and user-based methods, and a hybrid of visual clustering and item-based methods. To aggregate user stuff together, a genetic algorithm is applied.

3. Materials and Methods

The approach used in this work for generating recommendations is presented in Figure 1. The dataset is passed to the sparrow search algorithm for generating optimal clusters. For generating recommendations for the current user, the cluster with the nearest centroid is selected. In the selected cluster, the k-nearest neighbors are selected by using the kNN algorithm. The items rated by these k-nearest users are averaged, and the items with highest average ratings are suggested to thr active user.

3.1. Clustering Using Sparrow Search

A sparrow is a small but very clever bird with a good memory. There are two types of captive house sparrows: producers and scroungers [48]. The producers look for food sources themselves, while the scroungers get food from producers. The sparrows often change their behavior and switch between making and scavenging [49,50,51,52]. Sparrows keep an eye on the behavior of the sparrows around them.
Individuals’ energy reserves also play a role in how the sparrow chooses to forage. The sparrows with low energy reserves look for food more often [53,54,55]. It’s important to point out that the birds that live on the outside of the population are more likely to be attacked by predators and are always trying to get a better place [56,57]. Keep in mind that the animals that are in the middle may move closer to their neighbors in order to reduce their area of danger [58]. We also know that all sparrows have a natural curiosity about everything, and they are always on the lookout for danger. For example, when a bird sees a predator, one or more of them chirp and the whole group flees [59]. The behavior of sparrows can be summarized as follows:
(1)
The producers usually have a lot of energy and give scavengers places or directions to look for food. They are in charge of finding places where a lot of food can be found. The amount of energy each person has is based on how well they are thought of by others.
(2)
As soon as the sparrow sees the predator, the birds start to chirp as a warning. To keep people safe, producers have to lead all scavengers to the safe area when the alarm value is higher than the safety level.
(3)
Each sparrow can become a producer as long as it looks for the best places to get food, but the overall population doesn’t change.
(4)
The sparrows with the most energy would be the ones who made the food. Several people who are starving are more likely to fly to other places to get food so that they can have more energy to do things.
(5)
The scavengers follow the person who can give them the best food as they look for food. In the meantime, some scavengers may keep an eye on the people who make the food and compete with each other to get more.
(6)
The sparrows at the edge of the group move quickly to a safe area when they sense danger. The sparrows in the middle move around so they can be near other people.
Let X i , j denote ith sparrow’s jth coordinate of location (t denotes the iteration). The site of the producer is updated as per Equation (1),
X i , j t = X i , j t · e x p i α · i t e r m a x i f R 2 < S T X i , j t + Q · L i f R 2 S T
where, α ϵ ( 0 , 1 ] is a random number, R 2 ϵ [ 0 , 1 ] represents the alarm value, S T ϵ [ 0.5 , 1.0 ] represents the safety threshold, Q is a random number from a normal distribution, L is a 1 × d matrix for which each element inside is 1.
The location of the scrounger is updated as per Equation (2),
X i , j t + 1 = Q · e x p x w o r s t t x i , j t i 2 i f i > n 2 x p t + 1 + X i , j t X p t + 1 · A + · L o t h e r w i s e
where, X w o r s t denotes the current global worst location, X p is the optimal position occupied by the producer, A is a 1 × d matrix with each element being +1 or −1, and A + = A T A A T 1 .
The sparrows on the periphery have a higher chance of being attacked by predators, so they constantly move inwards. We assume that these sparrows, which can sense danger, account for 10 to 20% of the population. Equation (3) expresses their inward movement,
X i , j t + 1 = X b e s t t + β · X i . j t X b e s t t i f f i > f g X i , j t + K · x i , j t x w o r s t t ( f i f w ) + ϵ i f f i = f g
where, X b e s t denotes the current global best location, β is a random value from a normal distribution, K ϵ [ 1 , + 1 ] is a random number, f i is the fitness value of the current sparrow, f g   and   f w are current global best and global worst fitness values, and ϵ is the smallest constant to avoid zero division error.
Like the other swarm-based algorithms, the sparrow search algorithm can also be utilized for data clustering (refer to Figure 2 and Algorithm 1). The fitness function for the clustering process is WCSS (within-cluster sum of squared errors), i.e., the average Euclidean distance of all the points from their assigned cluster head. To make successful recommendations to users based on their interests, we introduce a new recommender system based on a hybrid sparrow clustering recommender system (HSC). This is intended to be more adaptable than typical recommender systems in generating diverse and unique recommendations.
Algorithm 1. Algorithm fir clustering using sparrow search
Input
• data: the dataset to be clustered
K: the number of clusters to be generated
N: the number of sparrows
P: the number of producers
S: the number of sparrow who sense the danger
G: the maximum iterations
Algorithm
1.       Create N sparrow, each having K cluster heads with random normalized values.
2.       Create clusters of data for each sparrow (based on shortest Euclidean distance).
3.       Calculate the fitness of each sparrow.
4.       Rank the sparrows and find the current best and cueeent worst sparrow.
5.       for i = 1 to P: update sparrow location using Equation (1).
6.       for i = P + 1 to N: update sparrow location using Equation (2).
7.       for i = 1 to S: update sparrow location using Equation (3).
8.       Change the location of each sparrow if it is better than the old location.
9.       Repeat the step 3–8 for G iterations.
10.       Return the cluster- heads of the fittest sparrow.
Output: Optimal clusters

3.2. Generating Recommendation by Using Sparrow Clustered Recommendation System

To generate recommendations for an active user, a cluster (among k-clusters) is to be selected. A simple approach is to select the cluster whose centroid has the highest similarity with the active user (e.g., the centroid with the lowest Euclidean distance with the active user). If there are large numbers of clusters, then multiple clusters can also be used for better results. In such a case, the probability that a cluster i is chosen for generating recommendations was given by
P i = p i × d i i = 1 k p i × d i
where p i is the density of the cluster, and d i is the Euclidean distance between the active user profile and the centroid of the cluster.
The density of the cluster (i.e., p i ) can be calculated as follows:
p i = N i i = 1 k N i
where, N i are the number of users in the cluster.
The recommendations are provided from the cluster with the highest probability or multiple clusters that lie in a particular probability range. The latter approach may provide the active user recommendations which are different and make him interested in trying something new. After selecting the clusters for recommendations, the next step is to predict the ratings for the active user’s unrated items and recommend the items whose predicted value is high. If there is only one chosen cluster, then the values of unrated items are simply the average of the corresponding item ratings by all the users in the cluster. But if multiple clusters have been selected, then we also consider the quality of ratings in each chosen cluster. A criterion of the rating quality of a cluster is the number of ratings available of each item in the cluster. The higher the densities of ratings, the better the quality of the cluster,
Q i = p = 1 t r i p n i × t
where, Q i is the quality of cluster, n i is the number of users in cluster i, t is the number of items, and r i p is the count of ratings available for item p in cluster i.

4. Results

4.1. Phase I: Training Phase

From Table 1, Table 2 and Table 3, the MovieLens dataset has 100,000 ratings of 943 users for 1682 movies. The movies are classified into 19 genres viz. action, comedy, horror, etc. The dataset is divided into two parts, 80% as training data and 20% as test data. The data is converted into a 943 × 1682 matrix. The dataset need not be normalized as the ratings are in the scale of 1–5. However, the dataset is sparse (only 100,000 ratings out of possible 1,586,126 available), so we need to replace the missing values by 0. The rating matrix containing the rating data is clustered into K clusters by using the sparrow search technique. N sparrows are initially generated, each having k cluster heads. Each cluster head has 1682 dimensions with values in the range of 1–5, generated at random. For each sparrow, K clusters are generated by assigning each point in the dataset to the nearest cluster head in the sparrow (the similarity measure used is Euclidean distance), and the WCSS (within-cluster sum of squares) is calculated. The sparrow with the lowest WCSS is considered to be the fittest sparrow, and the less fit sparrows are moved toward the fittest sparrow. This process is repeated to a certain number of iterations, and the fittest sparrow after all these iterations is considered to be the final solution (clusters).

4.2. Phase II: Process of Recommendation for Active Users

To generate recommendations for an active user, a cluster (among k-clusters) is to be selected. The selected cluster is the one whose centroid is nearest to the current user. Within the selected cluster, the movies which have highest average ratings are recommended. For performance analysis of our recommendation system framework, we calculate various metrics like MAE, SD, RMSE, and t-value. Different graphs and tables of the calculated results are shown for a better understanding of the framework.

4.2.1. Mean Absolute Error (MAE)

We calculated mean absolute error on the dataset of the MovieLens dataset by using Equation (7),
MAE = p i j t i j M
where, M is the number of movies in the dataset, p i j is the predicted value for i user on j items, and t i j is the true rating. The results are shown in Table 4 for the calculated MAE for different values of K. The outcome as observed from this table is that as we increase the number of clusters, MAE values gradually decrease.

4.2.2. Standard Deviation (SD)

By using Equation (8), we calculate SD on the MovieLens dataset,
SD = i = 1 k j = 1 n i l = 1 D l l ¯ D n i .

4.2.3. Root Mean Square Error (RMSE)

We calculated RMSE on the MovieLens dataset by using Equation (9),
RMSE = p t 2 n
where, p is the predicted value, t is the actual value, and n is the number of predicted ratings.

4.2.4. t-Value

This t-value basically depends on the values of the mean obtained for different clusters and their calculated SD values. We calculate the t-value of the dataset by using Equation (10),
t value = i = 1 k j = 1 k X i ¯ X j ¯ SD i 2 n i + SD j 2 n j .

4.2.5. Precision

Precision is a measure of exactness that determines the fraction of relevant items retrieved from all items retrieved. As an example, precision refers to the proportion of recommended movies that are good,
Precision = t p t p + f p t p : true positive , f p : false positive .

4.2.6. Recall

Recall is a measure of completeness. It determines the fraction of relevant items retrieved out of all relevant items. As an example, recall can refer to the proportion of all good movies recommended,
Precision = t p t p + f n t p : true positive , f n : false negative .
Results obtained by executing a sequence of experiments are based on four datasets and some metrics with varied parameters. Experiments were performed to evaluate the efficiency of the presented system in a collaborative filtering environment. A system with the configuration of Intel i5 (3.00 GHz), 4 GB RAM, Windows 10 was used for experimental computation, and all the algorithms are executed in the Python programming language (Anaconda environment). Result visualization is done in MS Excel (Microsoft, Redmond, WA, USA).
Four datasets (i.e., MovieLens 100 k, MovieLens 1 million, Jester, and Epinions) are used for result observations considering different parameters like ratings, users, and items.
  • MovieLens 100,000—an original dataset composed from the MovieLens website (movielens.umn.edu, accessed on 4 May 2022) in a time frame of 7 months (i.e., from 19 September 1997 to 22 April 1998) consists of 100,000 ratings of 1682 movies from 943 users. Rating scale ranges between 1 and 5. Data is easily available for experimental computation and analysis.
  • MovieLens 1 million—This Dataset consists of four features: userID, MovieID, rating, and timestamp. It includes 6040 MovieLens users who provided 1,000,209 ratings of 3900 movies. With a rating scale of 1–5 stars, every single user provides a minimum of 20 ratings.
  • Jester—Jester is a dataset of 59,132 users and 150 jokes, and consists of 1.7 million ratings ranging between −10 and 10. It is widely available and is often used for experimental examination of collaborative filtering recommender systems. The dataset features include [userid], [itemid] and [rating]. University of California, Berkeley created this dataset, and the data is associated with an online joke-recommendation system.
  • Epinion—A total of 664,824 ratings of 139,738 items from 49,290 users constitutes the Epinion dataset. Open-source data composed from Epinion.com includes userid, itemid, and rating. A scale is set ranging from 1–5 for rating individual items. The performance of the proposed sparrow-based recommendation system is based on a different cluster size.
Table 4 and Figure 3 compare the MAE, SD, RMSE, t-value, recall, and precision values for hybrid sparrow-based clustered algorithms to the collaborative filtering technique (CF) to demonstrate the proposed algorithm’s performance based on different cluster size.
Table 5 compares the performance of the proposed algorithm with state-of-the-art algorithms on the MovieLens 100 k dataset. From the results, it is observed that the proposed algorithm gives better results than other state-of-the-art algorithms and similar swarm-based algorithms.
Table 6 compares the performance of the proposed algorithm with state-of-the-art algorithms on the MovieLens 1 million dataset. From the results, it is observed that the proposed algorithm gives better results than other state-of-the-art algorithms and similar swarm-based algorithms.
Table 7 compares the performance of the proposed algorithm with state-of-the-art algorithms for the Jester dataset. From the results, it is observed that the proposed algorithm gives better results than other state-of-the-art algorithms and similar swarm-based algorithms.
Table 8 compares the performance of the proposed algorithm with state-of-the-art algorithms for the Epinion dataset. From the results, it is observed that the proposed algorithm gives better results than other state-of-the-art algorithms and similar swarm-based algorithms.
Figure 4, Figure 5, Figure 6 and Figure 7 provide the visualization of the comparative results of the proposed algorithm with state-of-the art algorithms for the MovieLens 100 k, MovieLens 1 million, Jester, and Epinion datasets, respectively.
From the results, we conclude that the proposed sparrow algorithm for clustering outperforms the existing algorithms in terms of all the metrics. The sparrow algorithm outperformed SVD and NMF algorithms in the range of 5 to 10%, and other swarm-based algorithms in the range of 2–10%.

5. Conclusions and Future Scope

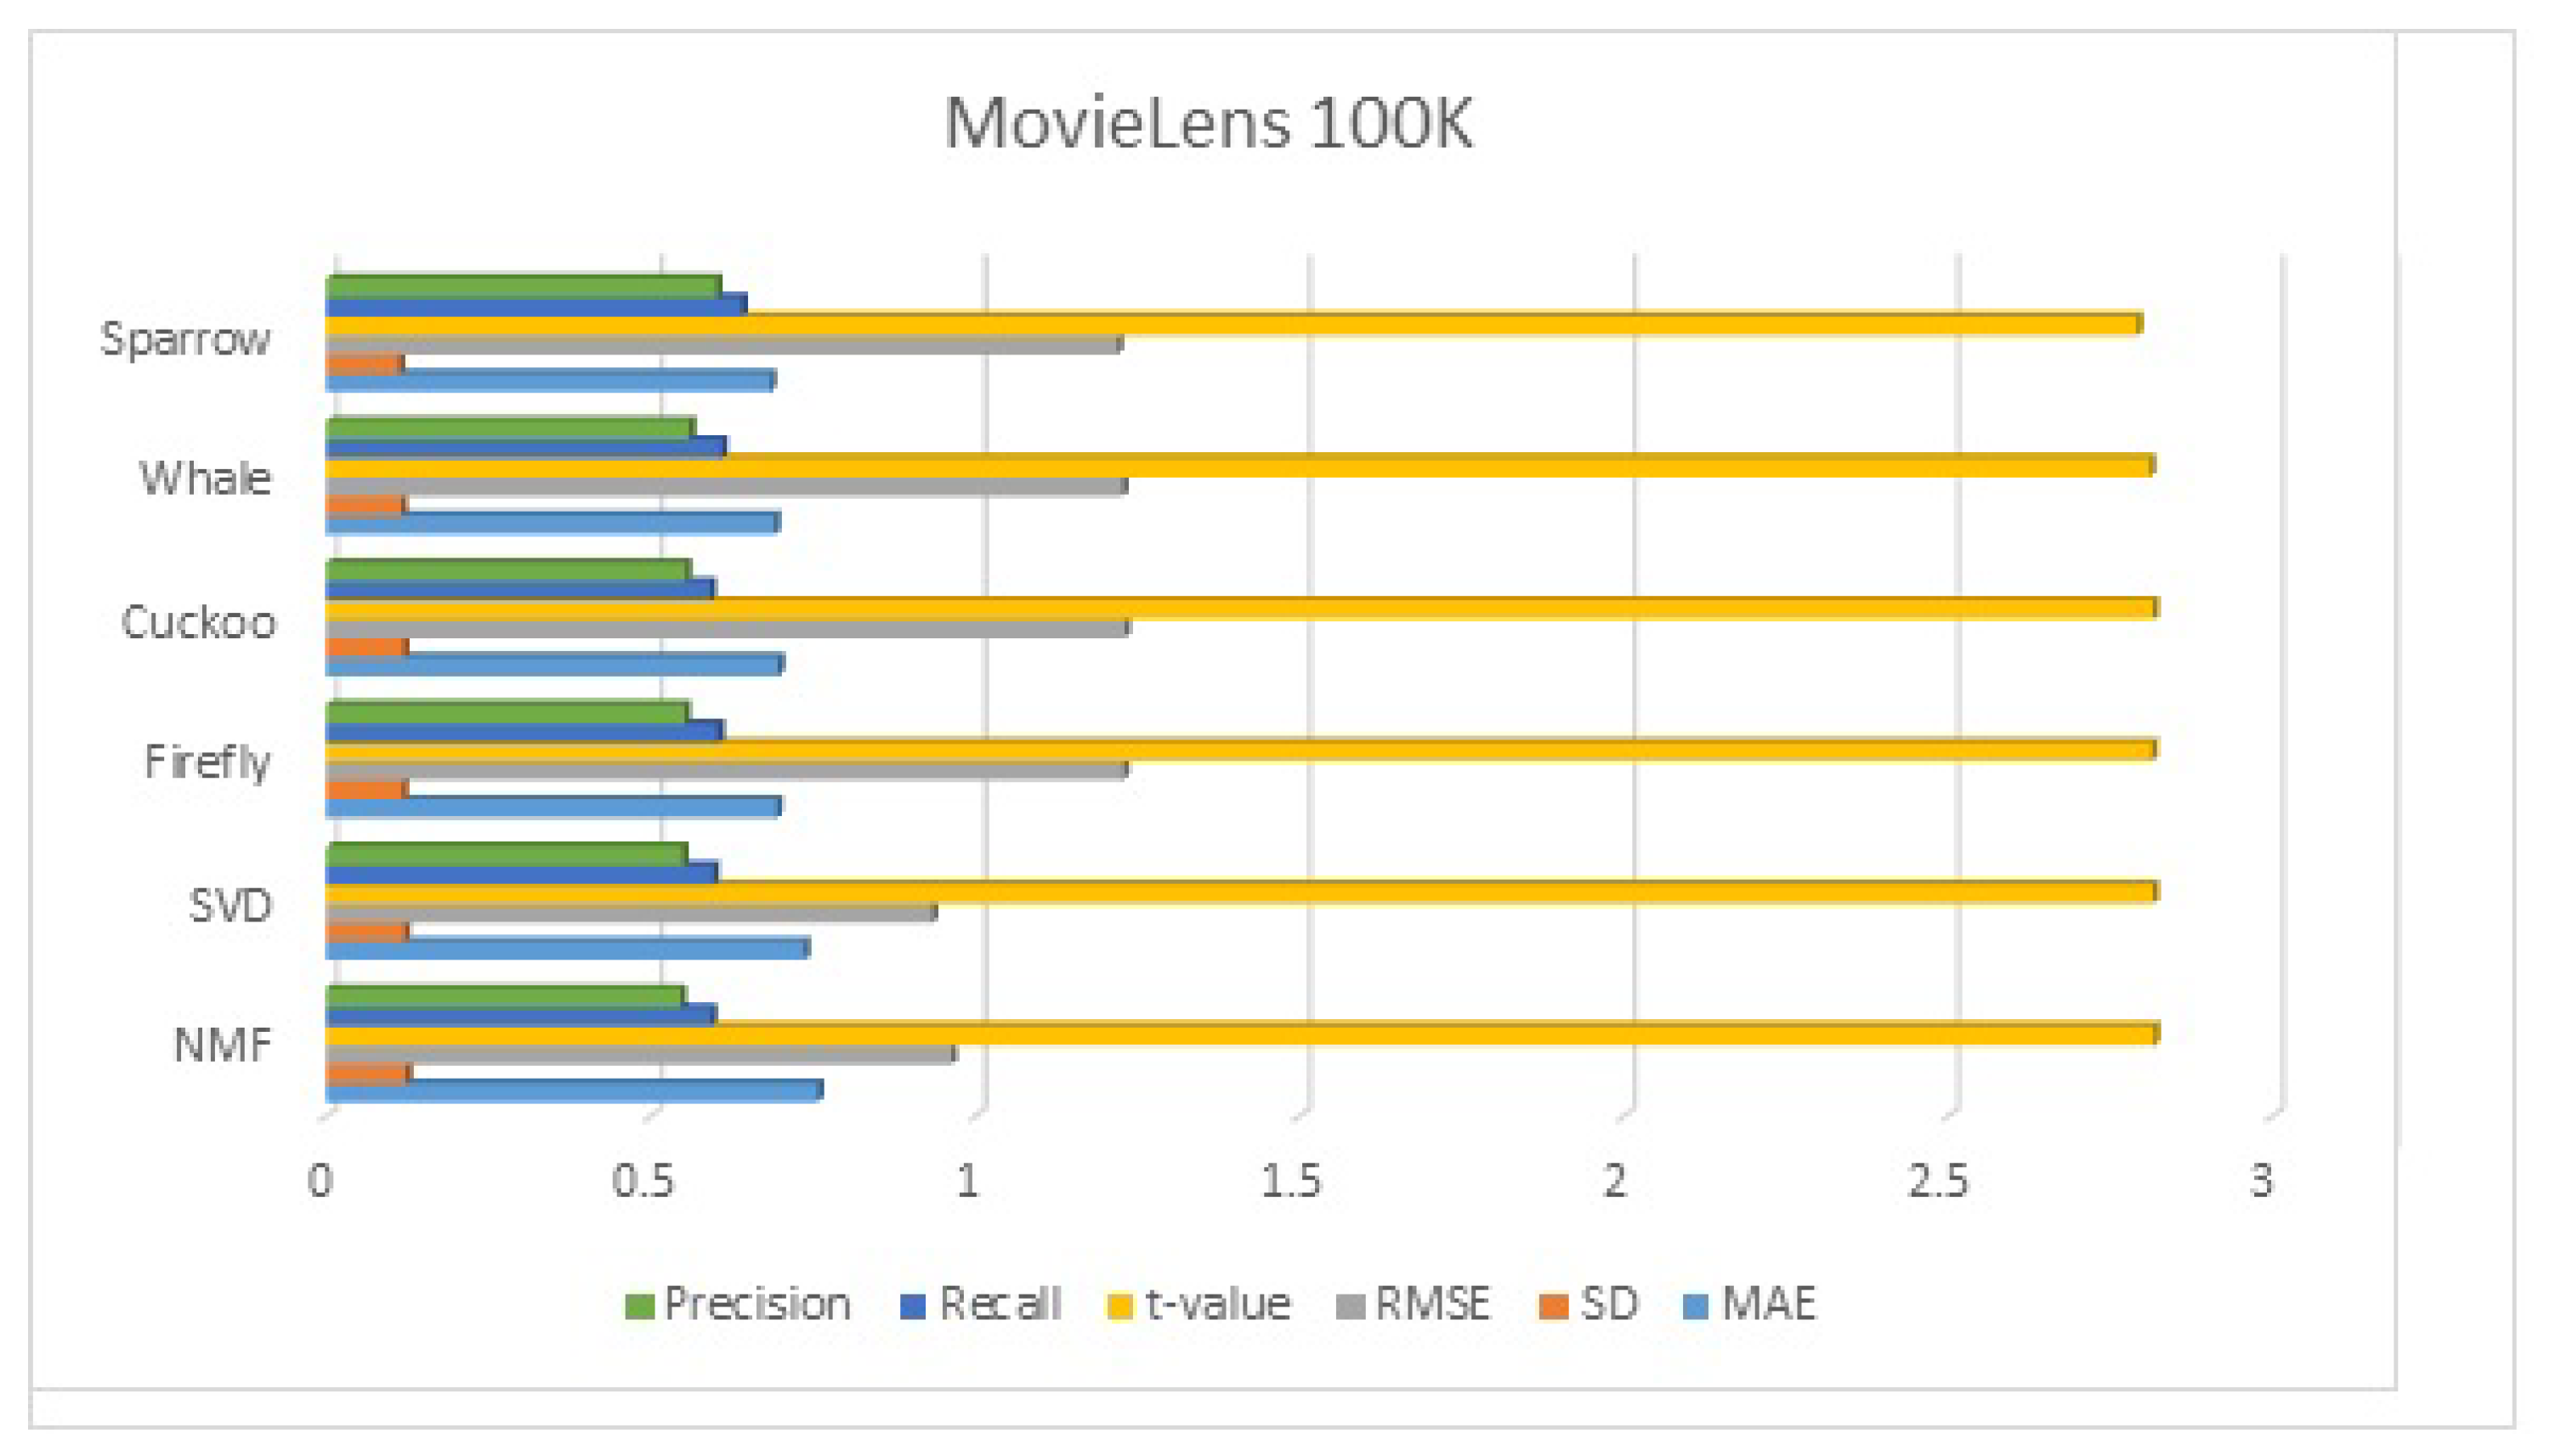
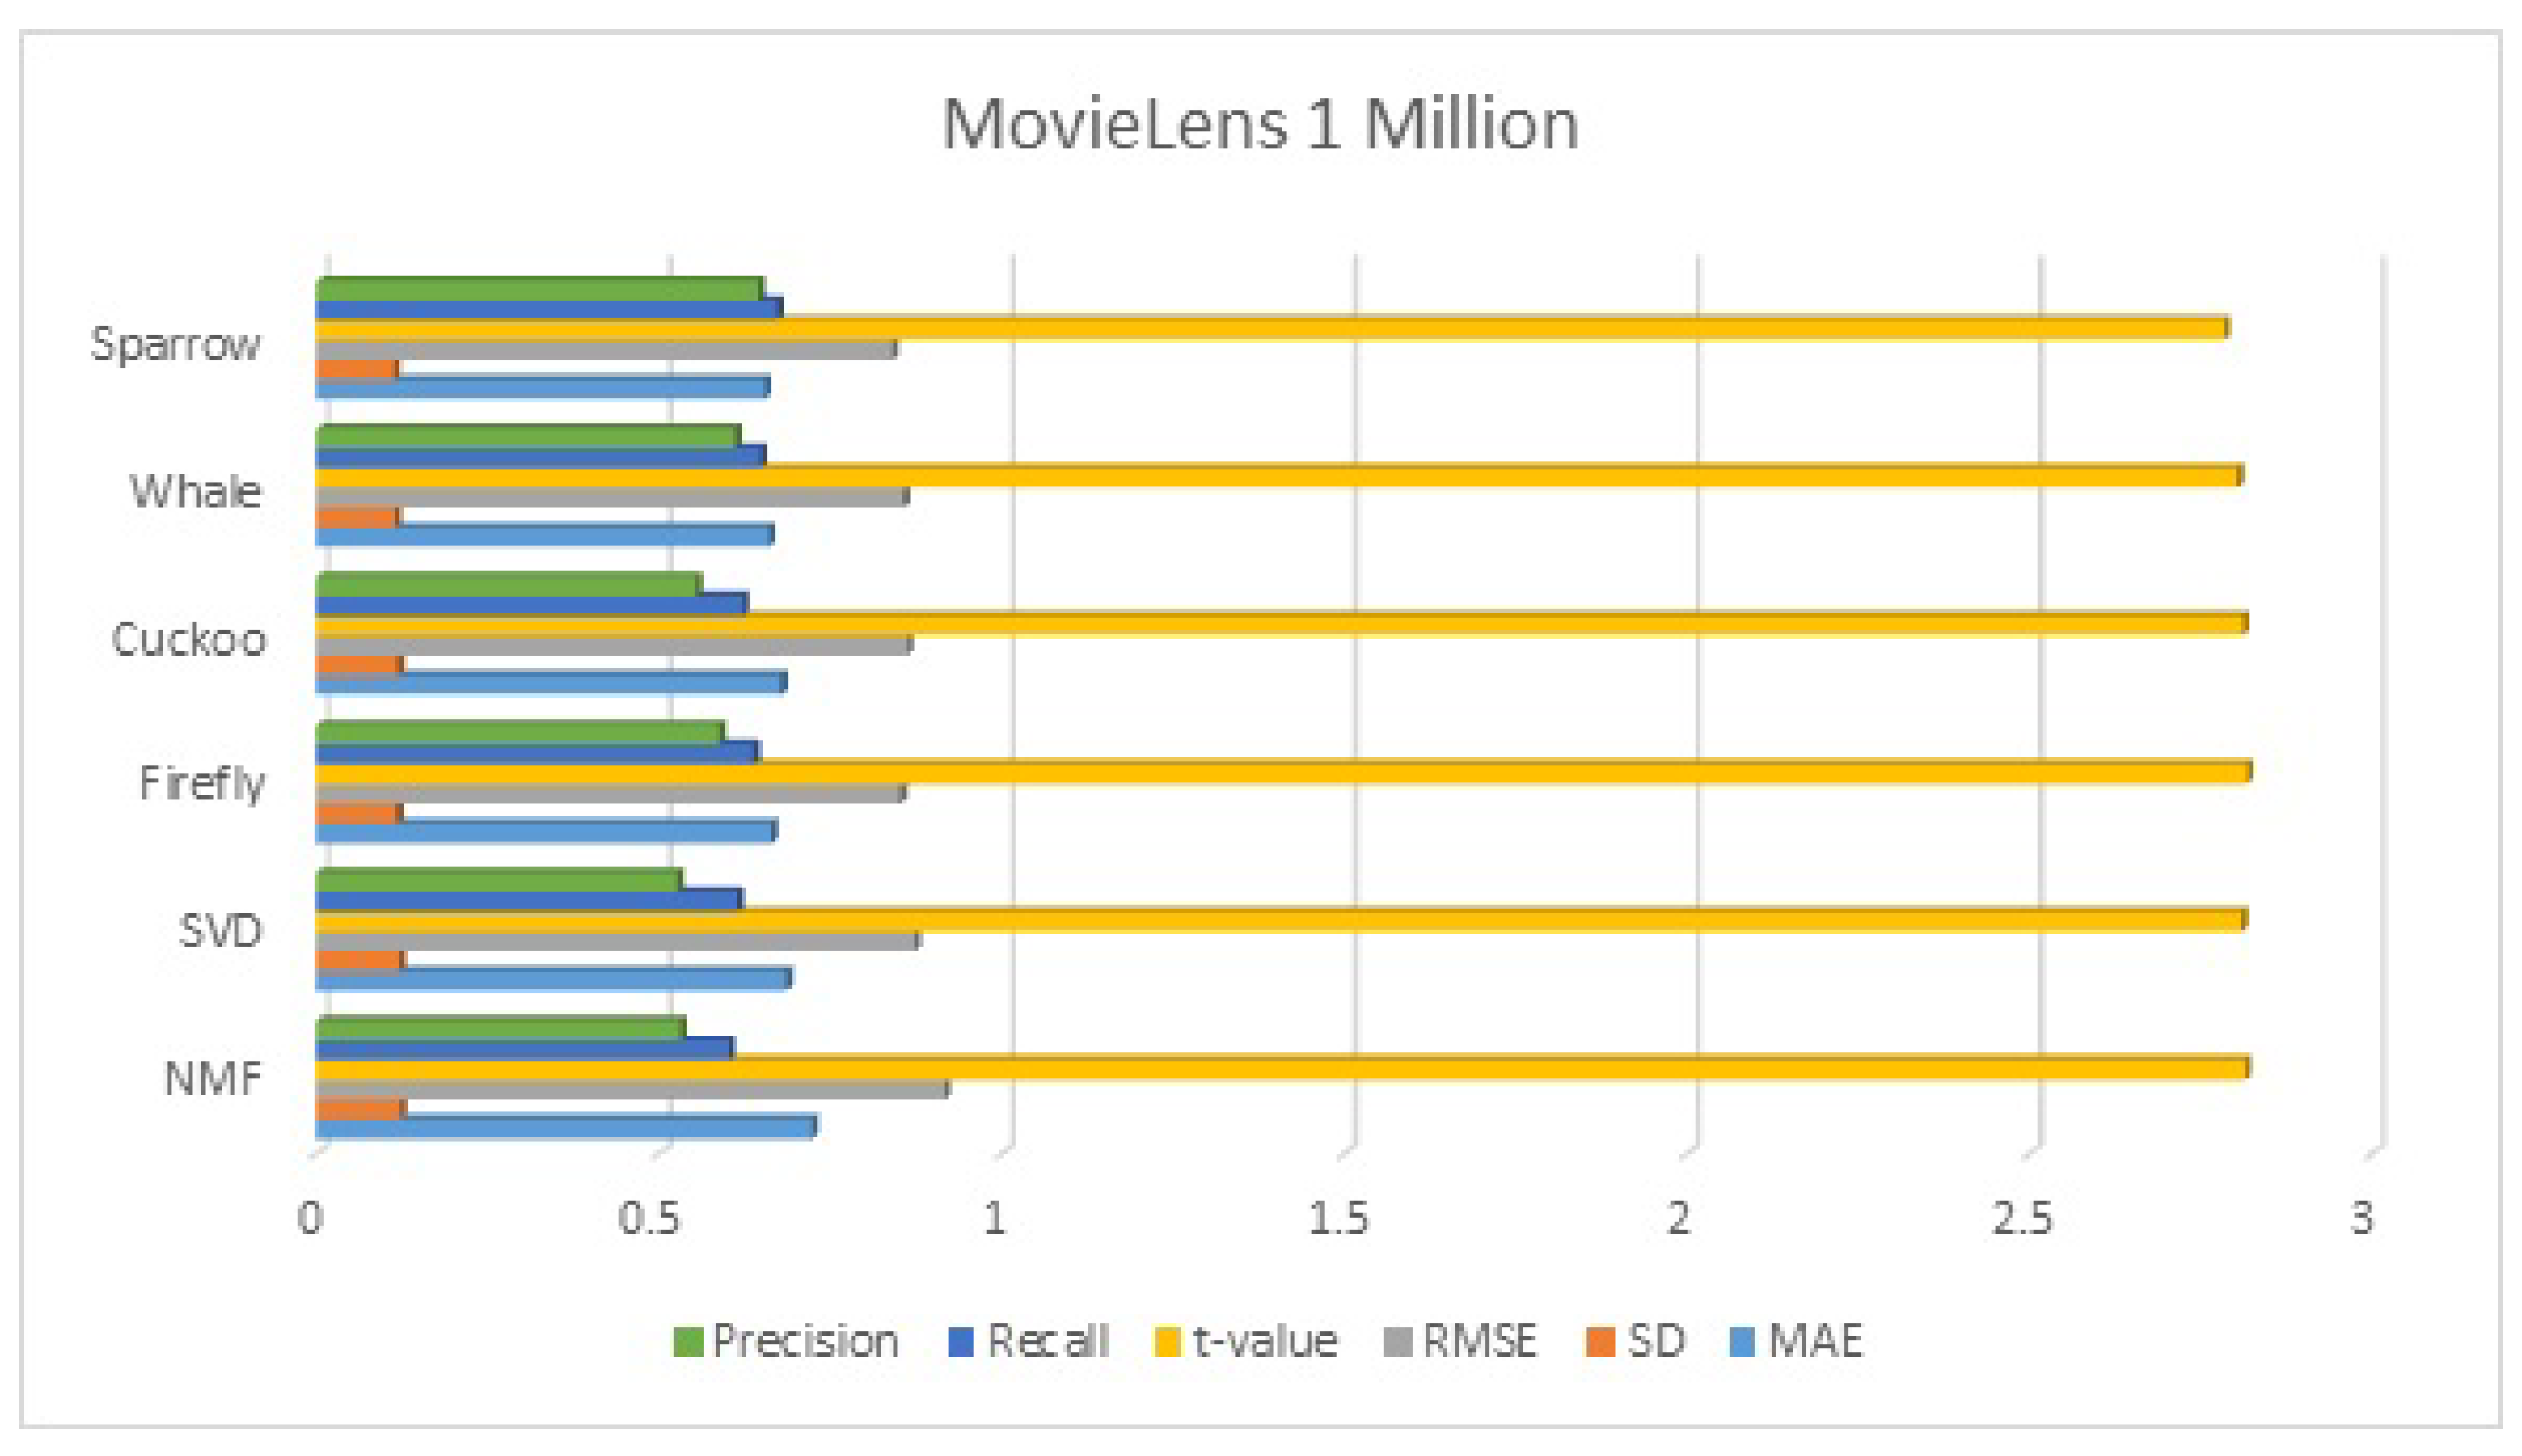
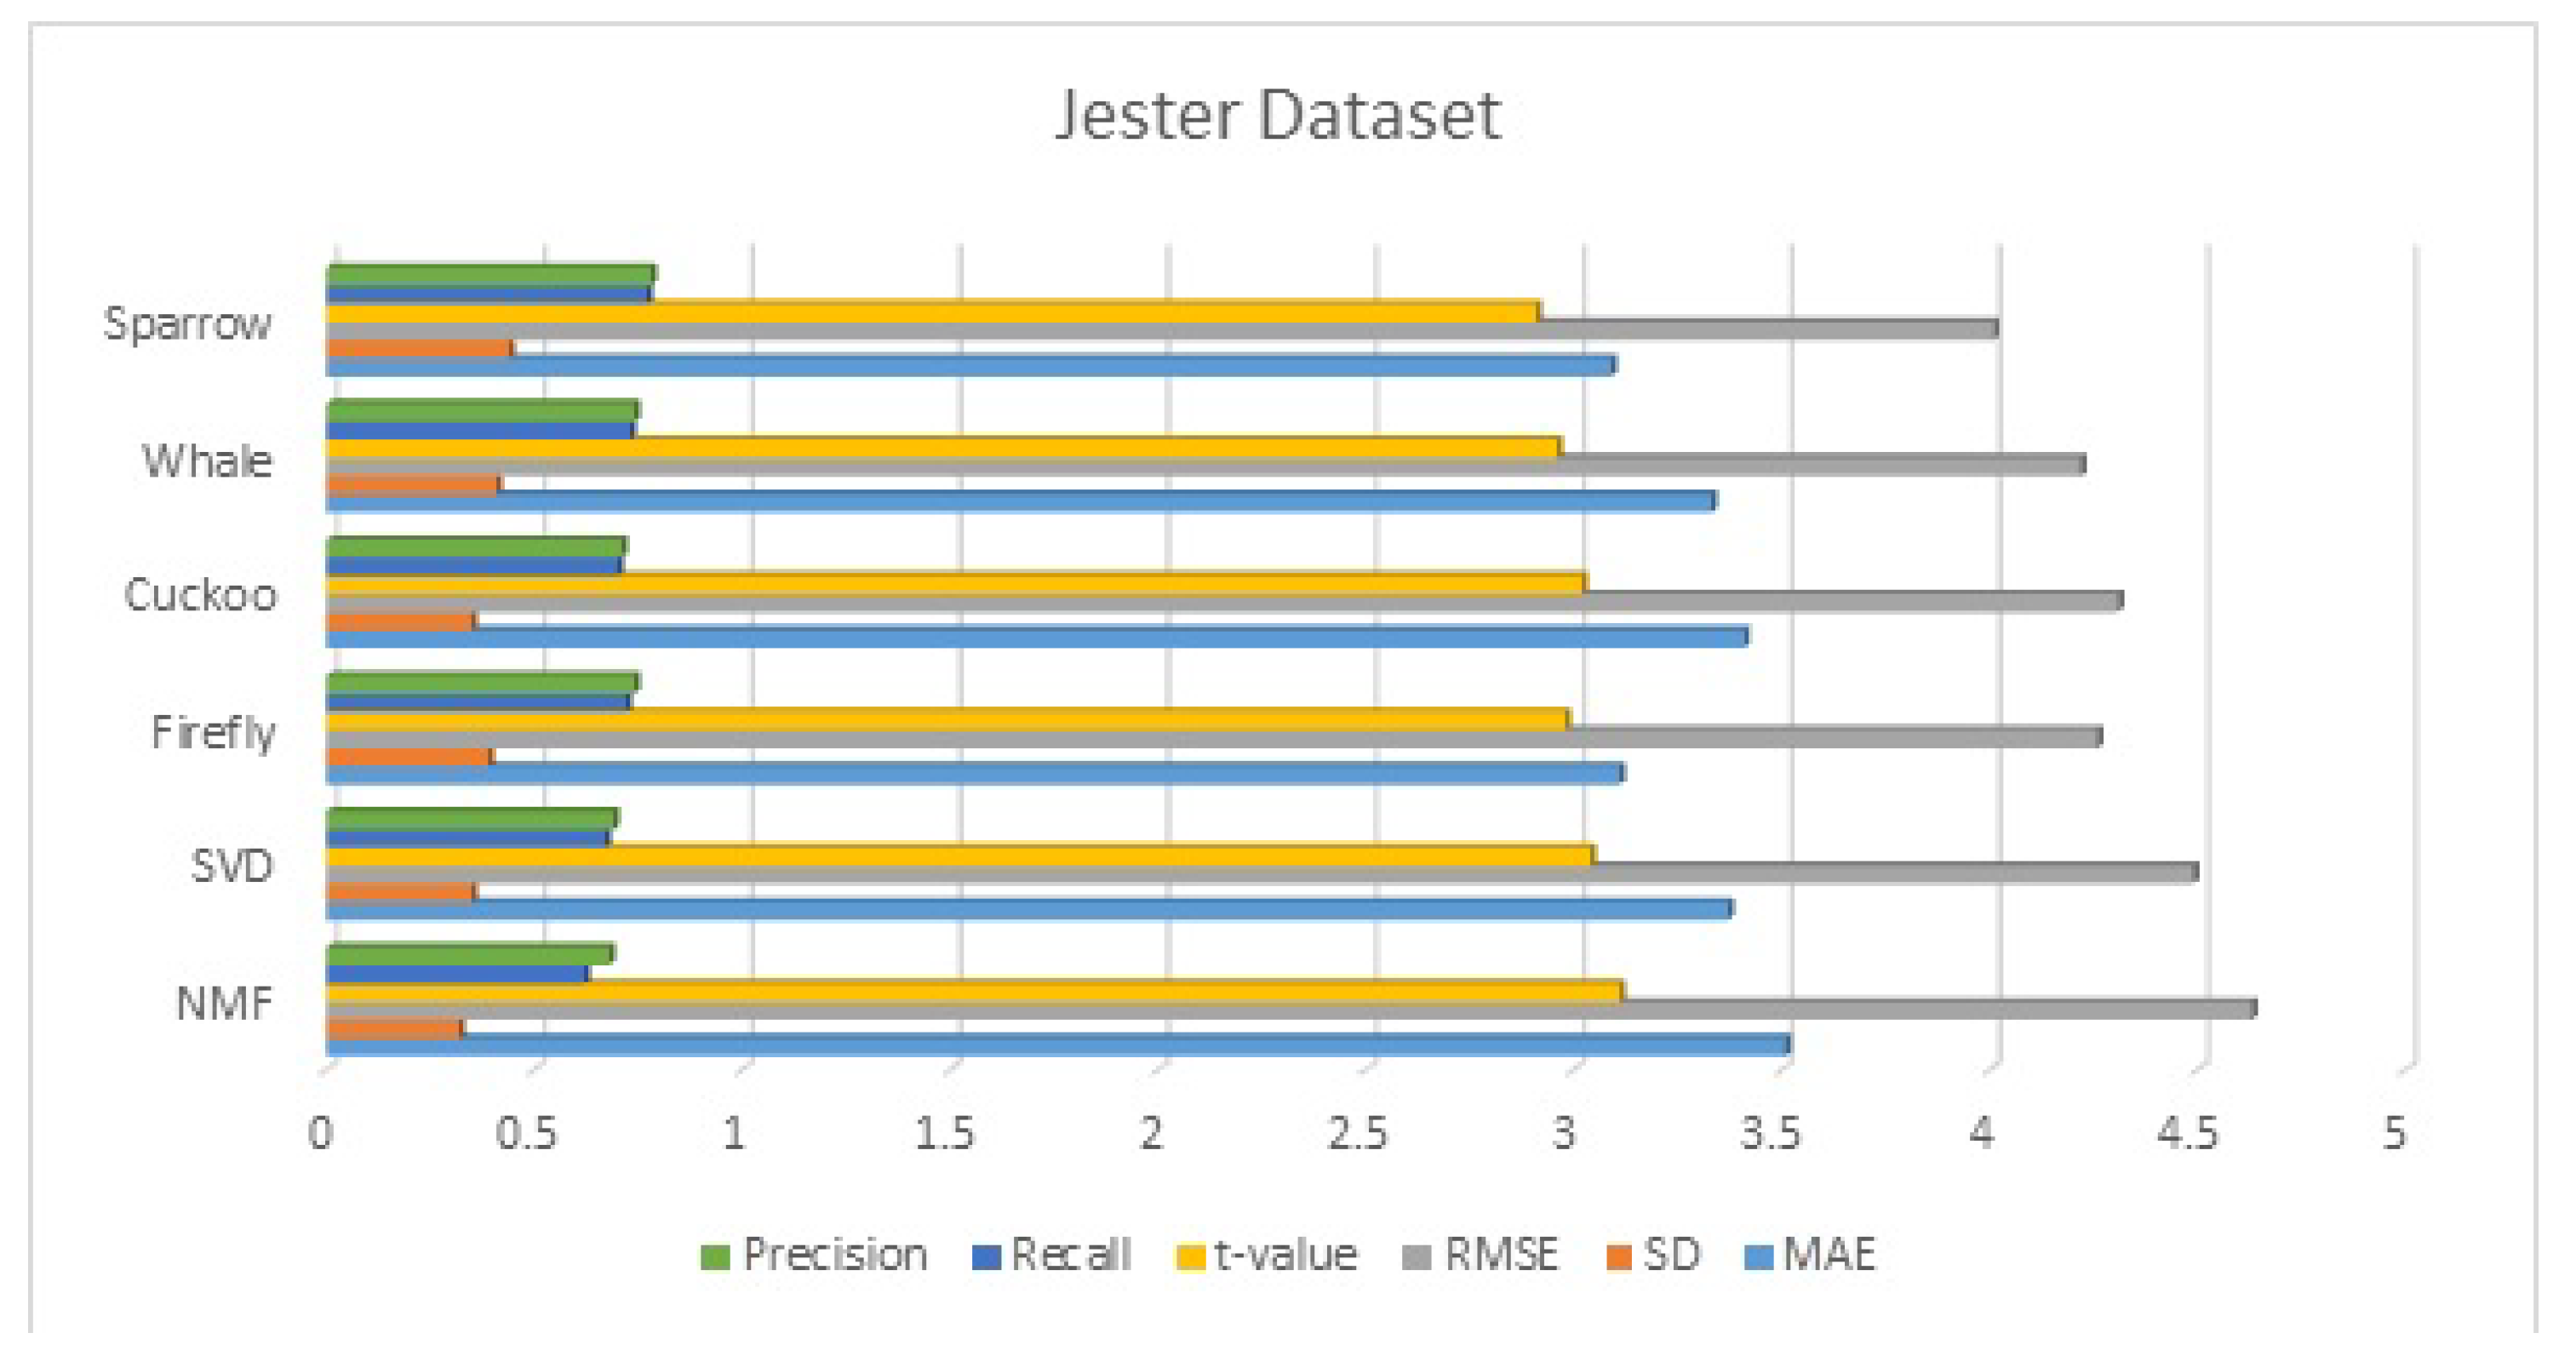
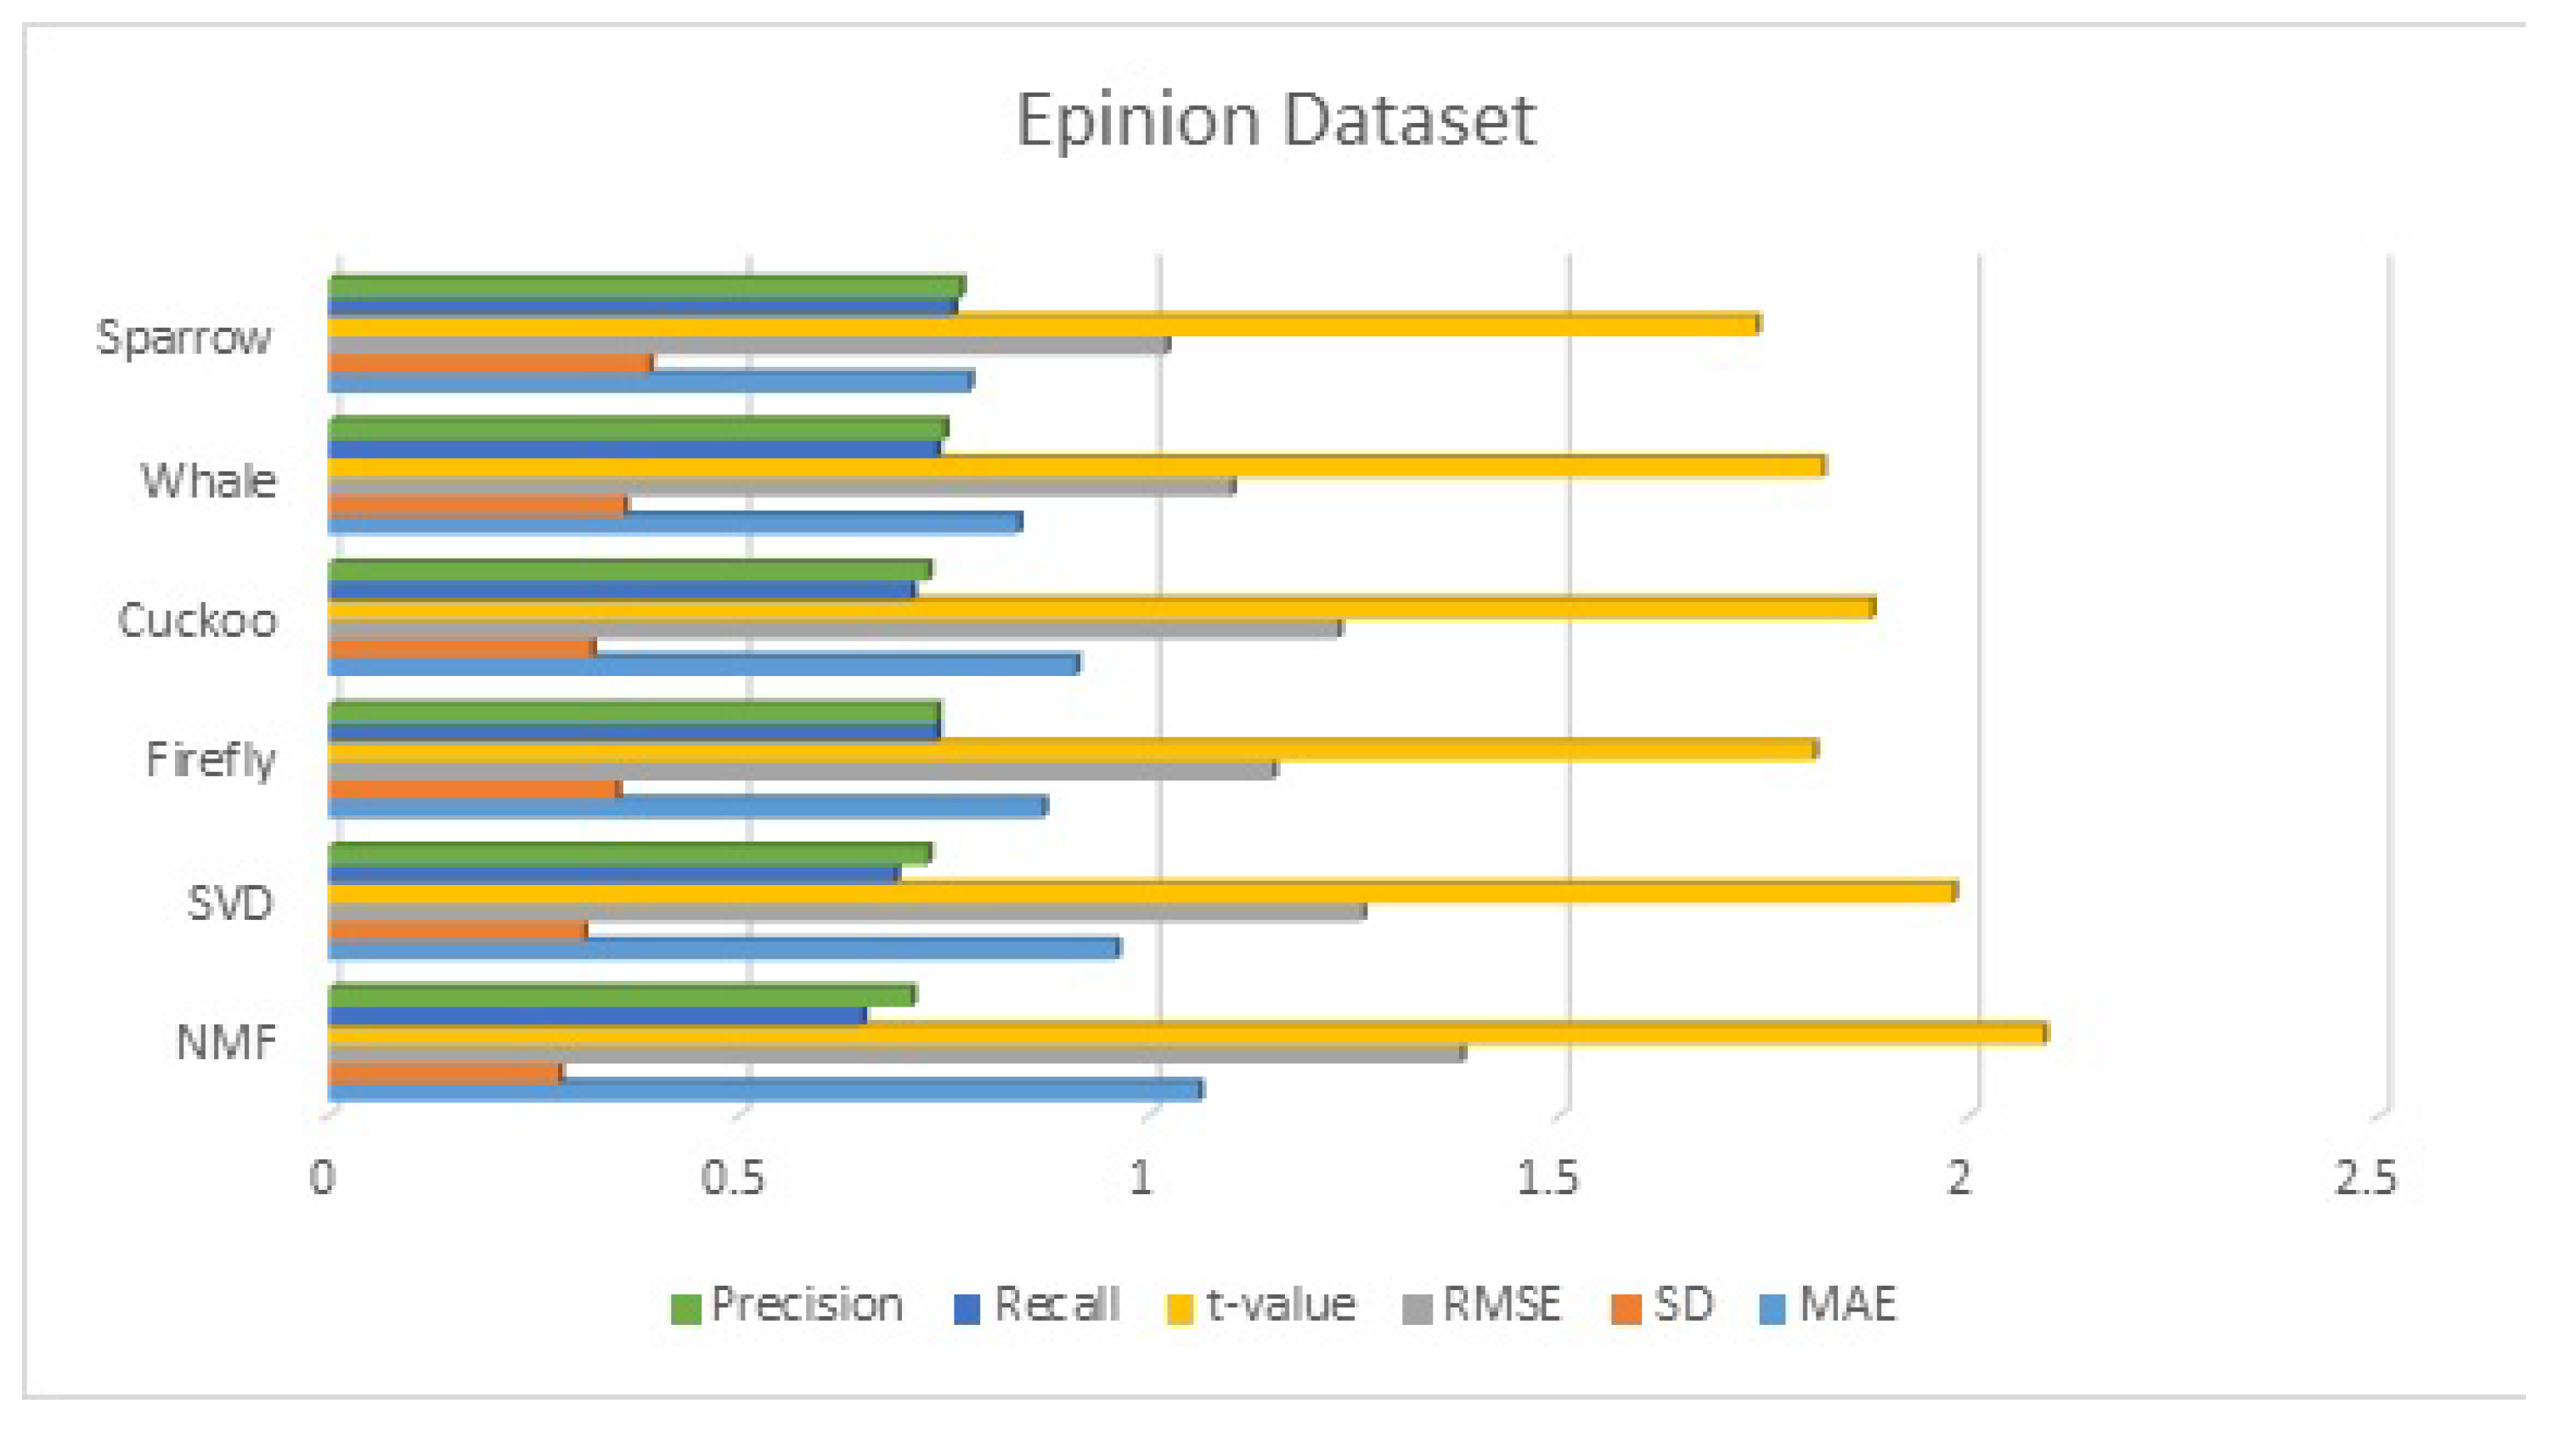
The use of standard clustering algorithms in recommender systems leads to slow results especially when a dataset is large. To speed up the clustering process, swarm intelligence-based clustering is a better option. In this proposed system, we presented a recommender system with four metaheuristic clustered algorithms, namely the firefly clustered algorithm, the cuckoo clustered algorithm, the whale clustered algorithm, and the sparrow clustered algorithm. In the proposed system, the symmetric nature of collaborative filtering is utilized. As far as clustering-based recommendation systems are concerned, getting optimal clusters is imperative in giving good recommendations. To obtain the optimal cluster, we need to minimize the within-cluster sum of squared (WCSS) distance. All algorithms are optimization algorithms and are used for reducing WCSS, which becomes the fitness function to be optimized.
The best clusters are then used to provide relevant and timely recommendations depending on the preferences of other cluster members. After obtaining the optimal cluster, recommendations can be generated by first selecting the right cluster(s) and then selecting the suitable items from the clusters. A straightforward approach is to select the cluster whose cluster head is closest to the active user, average the ratings for each item in the cluster, and then recommend the item with the highest cluster average rating. We evaluated our approach’s performance by using standard statistical measures such as mean absolute error, standard deviation, root mean squared error, and t-value. The results demonstrate that our approach generates highly relevant recommendations. In future work, alternative nature-inspired algorithms, such as multi-objective metaheuristic algorithms, can be utilized in place of the single-objective algorithm.

Author Contributions

Conceptualization, B.S.; methodology, B.S. and A.H.; software, A.H.; validation, B.S., A.H. and C.G.; formal analysis, O.I.K.; investigation, O.I.K. and G.M.A.; resources, M.M.I.; data curation, A.H.; writing—original draft preparation, B.S.; writing—review and editing, A.H.; visualization, B.S.; supervision, C.G.; project administration, O.I.K. and G.M.A.; funding acquisition, M.M.I. All authors have read and agreed to the published version of the manuscript.

Funding

Not applicable.

Institutional Review Board Statement

Not applicable.

Informed Consent Statement

Not applicable.

Data Availability Statement

Not applicable.

Conflicts of Interest

The authors declare no conflict of interest.

References

  1. Civicioglu, P.; Besdok, E. A conceptual comparison of the Cuckoo-search, particle swarm optimization, differential evolution and artificial bee colony algorithms. Artif. Intell. Rev. 2013, 39, 315–346. [Google Scholar] [CrossRef]
  2. Bobadilla, J.; Ortega, F.; Hernando, A.; Gutiérrez, A. Recommender systems survey. Knowl.-Based Syst. 2013, 46, 109–132. [Google Scholar] [CrossRef]
  3. Adomavicius, G.; Tuzhilin, A. Toward the next generation of recommender systems: A survey of the state-of-the-art and possible extensions. IEEE Trans. Knowl. Data Eng. 2005, 17, 734–749. [Google Scholar] [CrossRef]
  4. Fahad, A.; Alshatri, N.; Tari, Z.; Alamri, A.; Khalil, I.; Zomaya, A.Y.; Foufou, S.; Bouras, A. A survey of clustering algorithms for big data: Taxonomy and empirical analysis. IEEE Trans. Emerg. Top. Comput. 2014, 2, 267–279. [Google Scholar] [CrossRef]
  5. Herlocker, J.; Konstan, J.A.; Riedl, J. An empirical analysis of design choices in neighborhood-based collaborative filtering algorithms. Inf. Retr. 2002, 5, 287–310. [Google Scholar] [CrossRef]
  6. Konstan, J.A.; Riedl, J. Recommender systems: From algorithms to user experience. User Model. User-Adapt. Interact. 2012, 22, 101–123. [Google Scholar] [CrossRef] [Green Version]
  7. Zhang, X.; Qin, J.; Zheng, J. A Social Recommendation based on metric learning and Users’ Co-occurrence Pattern. Symmetry 2021, 13, 2158. [Google Scholar] [CrossRef]
  8. Addagarla, S.K.; Amalanathan, A. Probabilistic unsupervised machine learning approach for a similar image recommender system for E-commerce. Symmetry 2020, 12, 1783. [Google Scholar] [CrossRef]
  9. Sarwar, B.; Karypis, G.; Konstan, J.; Riedl, J. Item-based collaborative filtering recommendation algorithms. In Proceedings of the 10th international conference on World Wide Web, Hong Kong, China, 1–5 May 2001; pp. 285–295. [Google Scholar]
  10. Salter, J.; Antonopoulos, N. CinemaScreen recommender agent: Combining collaborative and content-based filtering. IEEE Intell. Syst. 2006, 21, 35–41. [Google Scholar] [CrossRef]
  11. Van Meteren, R.; Van Someren, M. Using content-based filtering for recommendation. In Proceedings of the Machine Learning in the New Information Age: MLnet/ECML2000 Workshop; 2000; Volume 30, pp. 47–56. Available online: https://www.semanticscholar.org/paper/Using-Content-Based-Filtering-for-Recommendation-Meteren/4a57e0f0641b7a70fece89c14fbf5030869ededb (accessed on 4 March 2022).
  12. Thorat, P.B.; Goudar, R.; Barve, S. Survey on collaborative filtering, content-based filtering and hybrid recommendation system. Int. J. Comput. Appl. 2015, 110, 31–36. [Google Scholar]
  13. Krulwich, B. Lifestyle finder: Intelligent user profiling using large-scale demographic data. AI Mag. 1997, 18, 37. [Google Scholar]
  14. Singh, S.P.; Solanki, S. Recommender system survey: Clustering to nature inspired algorithm. In Proceedings of the 2nd International Conference on Communication, Computing and Networking, Chandigarh, India, 29–30 March 2018; Springer: Berlin/Heidelberg, Germany, 2019; pp. 757–768. [Google Scholar]
  15. Burke, R. Hybrid web recommender systems. In The Adaptive Web; Springer: Berlin/Heidelberg, Germany, 2007; pp. 377–408. [Google Scholar]
  16. Porcel, C.; Tejeda-Lorente, A.; Martínez, M.; Herrera-Viedma, E. A hybrid recommender system for the selective dissemination of research resources in a technology transfer office. Inf. Sci. 2012, 184, 1–19. [Google Scholar] [CrossRef]
  17. Park, D.H.; Kim, H.K.; Choi, I.Y.; Kim, J.K. A literature review and classification of recommender systems research. Expert Syst. Appl. 2012, 39, 10059–10072. [Google Scholar] [CrossRef]
  18. Tsai, C.F.; Hung, C. Cluster ensembles in collaborative filtering recommendation. Appl. Soft Comput. 2012, 12, 1417–1425. [Google Scholar] [CrossRef]
  19. Sharma, B.; Hashmi, A.; Kumar, A. Whale Optimization based Recommendation System. Int. J. Innov. Technol. Explor. (IJITEE) 2019, 8, 2640–2644. [Google Scholar]
  20. Sangeeta; Sitender. Comprehensive analysis of hybrid nature-inspired algorithms for software reliability analysis. J. Stat. Manag. Syst. 2020, 23, 1037–1048. [Google Scholar]
  21. Xue, J.; Shen, B. A novel swarm intelligence optimization approach: Sparrow search algorithm. Syst. Sci. Control Eng. 2020, 8, 22–34. [Google Scholar] [CrossRef]
  22. Khalaf, O.I.; Abdulsahib, G.M.; Sabbar, B.M. Optimization of wireless sensor network coverage using the Bee Algorithm. J. Inf. Sci. Eng. 2020, 36, 377–386. [Google Scholar]
  23. Wang, X.; Liu, J.; Liu, X.; Liu, Z.; Khalaf, O.I.; Ji, J.; Ouyang, Q. Ship feature recognition methods for deep learning in complex marine environments. Complex Intell. Syst. 2022, 1–17. [Google Scholar] [CrossRef]
  24. Khaparde, A.R.; Alassery, F.; Kumar, A.; Alotaibi, Y.; Khalaf, O.I.; Pillai, S.; Alghamdi, S. Differential evolution algorithm with hierarchical fair competition model. Intell. Autom. Soft Comput. 2022, 33, 1045–1062. [Google Scholar] [CrossRef]
  25. Subramani, N.; Mohan, P.; Alotaibi, Y.; Alghamdi, S.; Khalaf, O.I. An Efficient Metaheuristic-Based Clustering with Routing Protocol for Underwater Wireless Sensor Networks. Sensors 2022, 22, 415. [Google Scholar] [CrossRef] [PubMed]
  26. Rajendran, S.; Khalaf, O.I.; Alotaibi, Y.; Alghamdi, S. MapReduce-based big data classification model using feature subset selection and hyperparameter tuned deep belief network. Sci. Rep. 2021, 11, 1–10. [Google Scholar] [CrossRef] [PubMed]
  27. Zhao, H.; Chen, P.L.; Khan, S.; Khalafe, O.I. Research on the optimization of the management process on internet of things (Iot) for electronic market. Electron. Libr. 2020, 39, 526–538. [Google Scholar] [CrossRef]
  28. Li, G.; Liu, F.; Sharma, A.; Khalaf, O.I.; Alotaibi, Y.; Alsufyani, A.; Alghamdi, S. Research on the natural language recognition method based on cluster analysis using neural network. Math. Probl. Eng. 2021, 2021, 9982305. [Google Scholar] [CrossRef]
  29. Adigwe, I.; Oriola, J. Towards an understanding of job satisfaction as it correlates with organizational change among personnel in computer-based special libraries in Southwest Nigeria. Electron. Libr. 2015, 33, 773–794. [Google Scholar] [CrossRef]
  30. Sengan, S.; Sagar, R.V.; Ramesh, R.; Khalaf, O.I.; Dhanapal, R. The optimization of reconfigured real-time datasets for improving classification performance of machine learning algorithms. Math. Eng. Sci. Aerosp. (MESA) 2021, 12, 43–54. [Google Scholar]
  31. Herlocker, J.L.; Konstan, J.A.; Terveen, L.G.; Riedl, J.T. Evaluating collaborative filtering recommender systems. ACM Trans. Inf. Syst. (TOIS) 2004, 22, 5–53. [Google Scholar] [CrossRef]
  32. Feng, L.; Zhao, Q.; Zhou, C. Improving performances of Top-N recommendations with co-clustering method. Expert Syst. Appl. 2020, 143, 113078. [Google Scholar] [CrossRef]
  33. Wasid, M.; Ali, R. An improved recommender system based on multi-criteria clustering approach. Procedia Comput. Sci. 2018, 131, 93–101. [Google Scholar] [CrossRef]
  34. Salah, A.; Rogovschi, N.; Nadif, M. A dynamic collaborative filtering system via a weighted clustering approach. Neurocomputing 2016, 175, 206–215. [Google Scholar] [CrossRef]
  35. Wang, Z.; Yu, X.; Feng, N.; Wang, Z. An improved collaborative movie recommendation system using computational intelligence. J. Vis. Lang. Comput. 2014, 25, 667–675. [Google Scholar] [CrossRef]
  36. Katarya, R.; Verma, O.P. A collaborative recommender system enhanced with particle swarm optimization technique. Multimed. Tools Appl. 2016, 75, 9225–9239. [Google Scholar] [CrossRef]
  37. Bedi, P.; Sharma, R.; Kaur, H. Recommender system based on collaborative behavior of ants. J. Artif. Intell. 2009, 2, 40–55. [Google Scholar] [CrossRef] [Green Version]
  38. Katarya, R.; Verma, O.P. Recommender system with grey wolf optimizer and FCM. Neural Comput. Appl. 2018, 30, 1679–1687. [Google Scholar] [CrossRef]
  39. Senbagaraman, M.; Senthilkumar, R.; Subasankar, S.; Indira, R. A movie recommendation system using collaborative approach and cuttlefish optimization. In Proceedings of the International Conference on Emerging Trends in Engineering, Science and Sustainable Technology, Karkala, India, 12 May 2017; pp. 95–99. [Google Scholar]
  40. Katarya, R.; Verma, O.P. An effective collaborative movie recommender system with cuckoo search. Egypt. Inform. J. 2017, 18, 105–112. [Google Scholar] [CrossRef] [Green Version]
  41. Katarya, R. Movie recommender system with metaheuristic artificial bee. Neural Comput. Appl. 2018, 30, 1983–1990. [Google Scholar] [CrossRef]
  42. Katarya, R.; Verma, O.P. Effectual recommendations using artificial algae algorithm and fuzzy c-mean. Swarm Evol. Comput. 2017, 36, 52–61. [Google Scholar] [CrossRef]
  43. Logesh, R.; Subramaniyaswamy, V.; Vijayakumar, V.; Gao, X.Z.; Indragandhi, V. A hybrid quantum-induced swarm intelligence clustering for the urban trip recommendation in smart city. Future Gener. Comput. Syst. 2018, 83, 653–673. [Google Scholar] [CrossRef]
  44. Rana, C.; Jain, S.K. An evolutionary clustering algorithm based on temporal features for dynamic recommender systems. Swarm Evol. Comput. 2014, 14, 21–30. [Google Scholar] [CrossRef]
  45. Chen, J.; Wang, H.; Yan, Z. Evolutionary heterogeneous clustering for rating prediction based on user collaborative filtering. Swarm Evol. Comput. 2018, 38, 35–41. [Google Scholar] [CrossRef]
  46. Alam, S.; Dobbie, G.; Riddle, P.; Koh, Y.S. Hierarchical PSO clustering based recommender system. In Proceedings of the 2012 IEEE Congress on Evolutionary Computation, Brisbane, Australia, 10–15 June 2012; pp. 1–8. [Google Scholar]
  47. Marung, U.; Theera-Umpon, N.; Auephanwiriyakul, S. Top-N recommender systems using genetic algorithm-based visual-clustering methods. Symmetry 2016, 8, 54. [Google Scholar] [CrossRef] [Green Version]
  48. Barnard, C.J.; Sibly, R.M. Producers and scroungers: A general model and its application to captive flocks of house sparrows. Anim. Behav. 1981, 29, 543–550. [Google Scholar] [CrossRef]
  49. Barta, Z.; Liker, A.; Mónus, F. The effects of predation risk on the use of social foraging tactics. Anim. Behav. 2004, 67, 301–308. [Google Scholar] [CrossRef]
  50. Coolen, I.; Giraldeau, L.A.; Lavoie, M. Head position as an indicator of producer and scrounger tactics in a ground-feeding bird. Anim. Behav. 2001, 61, 895–903. [Google Scholar] [CrossRef] [Green Version]
  51. Koops, M.A.; Giraldeau, L.A. Producer–scrounger foraging games in starlings: A test of rate-maximizing and risk-sensitive models. Anim. Behav. 1996, 51, 773–783. [Google Scholar] [CrossRef] [Green Version]
  52. Liker, A.; Barta, Z. The effects of dominance on social foraging tactic use in house sparrows. Behaviour 2002, 139, 1061–1076. [Google Scholar] [CrossRef] [Green Version]
  53. Johnson, C.; Grant, J.W.; Giraldeau, L.A. The effect of handling time on interference among house sparrows foraging at different seed densities. Behaviour 2001, 138, 597–614. [Google Scholar] [CrossRef]
  54. Bautista, L.M.; Alonso, J.C.; Alonso, J.A. Foraging site displacement in common crane flocks. Anim. Behav. 1998, 56, 1237–1243. [Google Scholar] [CrossRef] [Green Version]
  55. Lendvai, A.Z.; Barta, Z.; Liker, A.; Bókony, V. The effect of energy reserves on social foraging: Hungry sparrows scrounge more. Proc. R. Soc. Lond. Ser. B Biol. 2004, 271, 2467–2472. [Google Scholar] [CrossRef] [Green Version]
  56. Budgey, R.; Hutton, S. Three dimensional bird flock structure and its implications for birdstrike tolerence in aircraft. Proc. Int. Bird Strike Comm. 1998, 24, 307–320. [Google Scholar]
  57. Pomeroy, H.; Heppner, F. Structure of turning in airborne rock dove (Columba livia) flocks. Auk 1992, 109, 256–267. [Google Scholar]
  58. Hamilton, W.D. Geometry for the selfish herd. J. Theor. Biol. 1971, 31, 295–311. [Google Scholar] [CrossRef]
  59. Pulliam, H.R. On the advantages of flocking. J. Theor. Biol. 1973, 38, 419–422. [Google Scholar] [CrossRef]
Figure 1. Generation of the recommendation system.
Symmetry 14 00793 g001
Figure 2. Flow Chart of Sparrow Search Algorithm.
Symmetry 14 00793 g002
Figure 3. Performance of a sparrow search based on cluster size.
Symmetry 14 00793 g003
Figure 4. Performance comparison of the MovieLens 100 k dataset.
Symmetry 14 00793 g004
Figure 5. Performance comparison of the MovieLens 1 million dataset.
Symmetry 14 00793 g005
Figure 6. Performance comparison of the Jester dataset.
Symmetry 14 00793 g006
Figure 7. Performance comparison of the Epinion dataset.
Symmetry 14 00793 g007
Table 1. Snapshot of MovieLens dataset.
Movie #1Movie #2...Movie #1682
User #103...0
User #240...2
.......
.......
.......
User #94305...0
Table 2. Sample snapshot of the population (20 sparrows with 3 cluster heads each).
Movie #1Movie #2.Movie #1682
Sparrow #1Cluster-Head #123.3
Cluster-Head #231.5
Cluster-Head #341.2
......
......
Sparrow #20Cluster-Head #151.1
Cluster-Head #212.2
Cluster-Head #324.4
Table 3. Sample of cluster assigned to each user in fittest sparrow (assuming that there are 3 clusters in each sparrow).
User #1User #2User #3.User #943
Cluster #313.2
Table 4. Performance of sparrow-search recommender system based on different cluster size on MovieLens 100 k dataset.
S. No.No. of Clusters (k)MAESDRMSEt-ValueRecallPrecision
1100.7850.1791.2823.3480.3290.311
2200.7760.1261.2802.8140.3780.361
3300.7650.1241.2742.7910.4430.426
4400.7440.1331.2582.8160.4910.452
5500.7290.1251.2482.8160.5340.498
6600.7120.1121.2392.8160.5670.538
7700.6950.1171.2292.8140.6040.552
Table 5. Performance comparison with other algorithms (k = 70) on MovieLens 100 k.
NMFSVDFireflyCuckooWhaleSparrow
MAE0.7580.7370.6950.6970.6910.685
SD0.1230.1210.1170.1190.1150.113
RMSE0.9630.9341.2291.2311.2281.220
t-value2.8182.8162.8142.8162.8112.792
Recall0.5940.5970.6040.5920.6100.640
Precision0.5460.5490.5520.5540.5600.602
Table 6. Performance comparison with other algorithms (k = 70) of MovieLens 1 million.
NMFSVDFireflyCuckooWhaleSparrow
MAE0.7240.6860.6640.6780.6600.654
SD0.1230.1210.1170.1190.1150.113
RMSE0.9160.8730.8520.8620.8570.841
t-value2.8142.8092.8182.8112.8032.784
Recall0.6020.6140.6380.6220.6480.673
Precision0.5310.5260.5880.5540.6110.645
Table 7. Performance comparison with other algorithms (k = 70) of the Jester dataset.
NMFSVDFireflyCuckooWhaleSparrow
MAE3.513.373.113.413.333.09
SD0.320.350.390.350.410.44
RMSE4.634.494.264.314.224.01
t-value3.113.042.983.022.962.91
Recall0.620.670.720.700.730.77
Precision0.680.690.740.710.740.78
Table 8. Performance comparison with other algorithms (k = 70) on Epinion dataset.
NMFSVDFireflyCuckooWhaleSparrow
MAE1.060.960.870.910.840.78
SD0.280.310.350.320.360.39
RMSE1.381.261.151.231.101.02
t-value2.091.981.811.881.821.74
Recall0.650.690.740.710.740.76
Precision0.710.730.740.730.750.77
Publisher’s Note: MDPI stays neutral with regard to jurisdictional claims in published maps and institutional affiliations.

