Article

Evolution of Microstructure, Texture and Corrosion Properties of Additively Manufactured AlSi10Mg Alloy Subjected to Equal Channel Angular Pressing (ECAP)

1
Department of Engineering Materials and Biomaterials, Silesian University of Technology, 18A Konarskiego Street, 44-100 Gliwice, Poland
2
Materials Research Laboratory, Silesian University of Technology, 18A Konarskiego Street, 44-100 Gliwice, Poland
3
Faculty of Mechanical Engineering, VSB-TU Ostrava, 17. Listopadu 2172/15, 708 00 Ostrava, Czech Republic
*
Author to whom correspondence should be addressed.
Symmetry 2022, 14(4), 674; https://doi.org/10.3390/sym14040674
Submission received: 9 March 2022 / Revised: 21 March 2022 / Accepted: 22 March 2022 / Published: 24 March 2022
(This article belongs to the Special Issue Advances in Materials Science with Symmetry/Asymmetry)

Abstract

:
In the selective laser melting process (SLM), the region irradiated by the laser beam is melted and quickly solidified, forming solidification lines (laser scan tracks) with symmetrical shapes. Because of the unique (rapid) crystallization conditions, the subgrain structures, typically observed inside these solidification lines, could also have variable geometric symmetrical patterns, e.g., cellular, pentagonal, or hexagonal cellular. The existence of such distinctive microstructures in SLM-made alloys has a significant impact on their superior mechanical and corrosion properties. Thus, any modification of this symmetrical microstructure (due to post-processing) can degrade or improve the properties of SLM-fabricated alloys. This study presents the experimental results on the effects of heat treatment and ECAP on microstructure modification and corrosion behavior of SLM-fabricated AlSi10Mg alloy. Light microscopy, scanning electron microscopy (SEM), electron backscattered diffraction (EBSD), and X-ray diffraction (XRD) were used for microstructural analysis. The corrosion properties of the given samples were determined using open-circuit potential (OCP), potentiodynamic polarization, and electrochemical impedance spectroscopy (EIS) techniques. EBSD observations showed that the imposed strain resulted in an obvious reduction in grain size to ~1.42 µm and ~0.24 µm after the first and second ECAP passes, respectively. Electrochemical tests revealed that the corrosion resistance of the ECAP-processed AlSi10Mg alloy improved significantly, which was confirmed by a nobler Ecorr and lower Icorr values, and higher polarization resistance. The final results indicated that the strain-induced crystalline defects provided more nucleation sites for the formation of a denser and thicker oxide film, thus enhancing the corrosion resistance of the AlSi10Mg alloy.

1. Introduction

In recent years, ultrafine-grained materials (UFG) have attracted considerable attention from specialists in materials science. This is because they are characterized by unique properties such as high strength, superplasticity, and improved fatigue life [1,2]. UFG materials are commonly fabricated using bulk severe plastic deformation methods (SPD). These methods include high-pressure torsion (HPT) [3], equal-channel angular pressing (ECAP) [4], accumulative roll bonding (ARB) [5], and some others [6,7]. Consequently, processing using the above-mentioned methods results in significant microstructure modifications. In addition to microstructure refinement, there are also changes in the grain boundary misorientation angles, crystallographic texture, defect density, and/or the size and distribution of intermetallic phases.
Although in recent years a large number of investigations have been reported on the fundamental understanding of superior mechanical properties for UFG Al–Si alloys [8,9,10,11,12,13,14], the reports on their corrosion behaviors are rather limited. To date, scientists have examined mainly the corrosion properties of severely deformed hypo- and hyper-eutectic Al–Si alloys. In this context, Jiang et al. [15] studied the corrosion resistance of a hyper-eutectic Al-26% Si alloy processed by ECAP. They found that the homogeneous UFG structure contributed to higher pitting resistance. Gebril et al. [16] investigated the microstructure evolution and corrosion properties of the ECAP-processed A356 aluminum alloy. They reported a decrease in the corrosion rate due to particle refinement through ECAP. In another study, Wang et al. [17] used a similar hypo-eutectic Al-7Si alloy to investigate the effect of grain refinement on its corrosion behavior in a solution of 3.5 wt % NaCl by electrochemical impedance spectroscopy. They reported enhanced corrosion resistance as a result of a decrease in the number of active sites, microstructure homogeneity, breakage, and uniform distribution of brittle coarse silicon and intermetallic phases. Furthermore, Cheng et al. [18] investigated the corrosion properties of the Al-7Si-0.3Mg alloy subjected to spinning deformation. They discovered that the susceptibility to corrosion of the interdendritic region dropped as a result of the refinement of the eutectic silicon phase.
Compared to traditional manufacturing methods, unique conditions during the SLM process [19] favor the formation of distinct microstructures composed of the melting pool boundary network [20], the grain boundary network [21], and the cellular network [22]. These conditions also induce defects, such as porosities, microcracks, and rough surfaces. Along with the boundaries of the molten pool [23], defects formed during the fabrication process can eventually act as preferred sites for localized corrosion, thus degrading the corrosion performance of AM products.
Considering the impact of these imperfections on the corrosion performance of AM Al–Si alloys, significant attention has recently been devoted to studying the effects of thermal post-processing on AM parts. In this context, Cabrini et al. [24] and Zakay et al. [25] studied the effects of heat treatments on the corrosion resistance of the laser powder bed fusion (L-PBF) AlSi10Mg alloy. Both studies have shown that the corrosion resistance of the as-fabricated samples was enhanced by heat treatment at 200–300 °C due to stress-relieving. Nonetheless, the corrosion resistance of the built samples was reduced as the heat-treated temperature increased to 400–500 °C, which was related to the detrimental effect on the corrosion performance of the coarse Si particles and Mg2Si. However, it should be noted that, despite improving corrosion resistance, the heat treatment process is not currently designed to remove any porosity. AM defects can be minimized by employing specific approaches, such as hot isostatic pressing (HIP) [26], shot peening [27], or SPD processing [28]. The HIP is a very effective secondary process that reduces the amount of porosity in the parts and improves their corrosion resistance. However, this is generally achieved at the expense of mechanical properties [29]. The shot peening process is also capable of reducing process-induced pores, refining grain sizes, inducing high compressive residual stresses, increasing surface hardness, and fatigue life of the SLM samples [27], but it often results in deterioration of the sample surface quality. On the other hand, HPT processing can significantly reduce porosity, and refine and homogenize the microstructure, resulting in improved mechanical and corrosion properties [3,28,30]. This process has serious limitations—the sample shape is in the form of a disk, which is not appropriate for industrial applications.
Regardless of the promising capability of the HPT method in modifying the microstructure and improving the corrosion properties of L-PBF alloys, there is still limited information available in the open literature on the bulk severe plastic deformation processes, such as ECAP as a post-printing procedure on AM parts. In particular, there is still no solid experimental evidence addressing the following two questions: (i) How do the defects formed (grain boundaries) modify the reactivity of the passive layer? (ii) How does the change in the unique solidification structure of AM alloy due to ECAP affect its corrosion resistance? Therefore, a systematic investigation and characterization of the microstructure and corrosion behavior of an ECAP-processed AM Al–Si alloy merits attention, both for its possible engineering applications and to extend the current knowledge of the ECAP process.
Consequently, the objective of the article is to investigate the effects of microstructural modifications caused by repetitive pressings through the 120° ECAP die on the corrosion behavior of the additively manufactured AlSi10Mg alloy. In this work, the corrosion performance was measured by conducting electrochemical tests in a sequence of open-circuit potential (OCP), potentiodynamic polarization, and electrochemical impedance spectroscopy (EIS). Our results indicated that the melt pool boundary fraction, Si particle, and grain size significantly affected the electrochemical responses of the ECAP processed AlSi10Mg alloy; however, despite the beneficial effect of the grain refinement, we identified that the melt pool boundaries emerged as preferential sites for localized pitting corrosion.
The justification for the use of the additively manufactured AlSi10Mg alloy in this study lies in the fact that the unique cellular microstructure offers substantially different deformation mechanisms from conventional counterparts [22], thus providing suitable starting points for severe grain refinement. According to studies by Zhang et al. [31] and Kim et al. [32], the basic deformation mechanism in rapidly solidified Al–Si alloys includes plastic incompatibility across the Al/Si interface (accommodated by geometrically necessary dislocations during straining) and the deformation twinning of the Si phase.

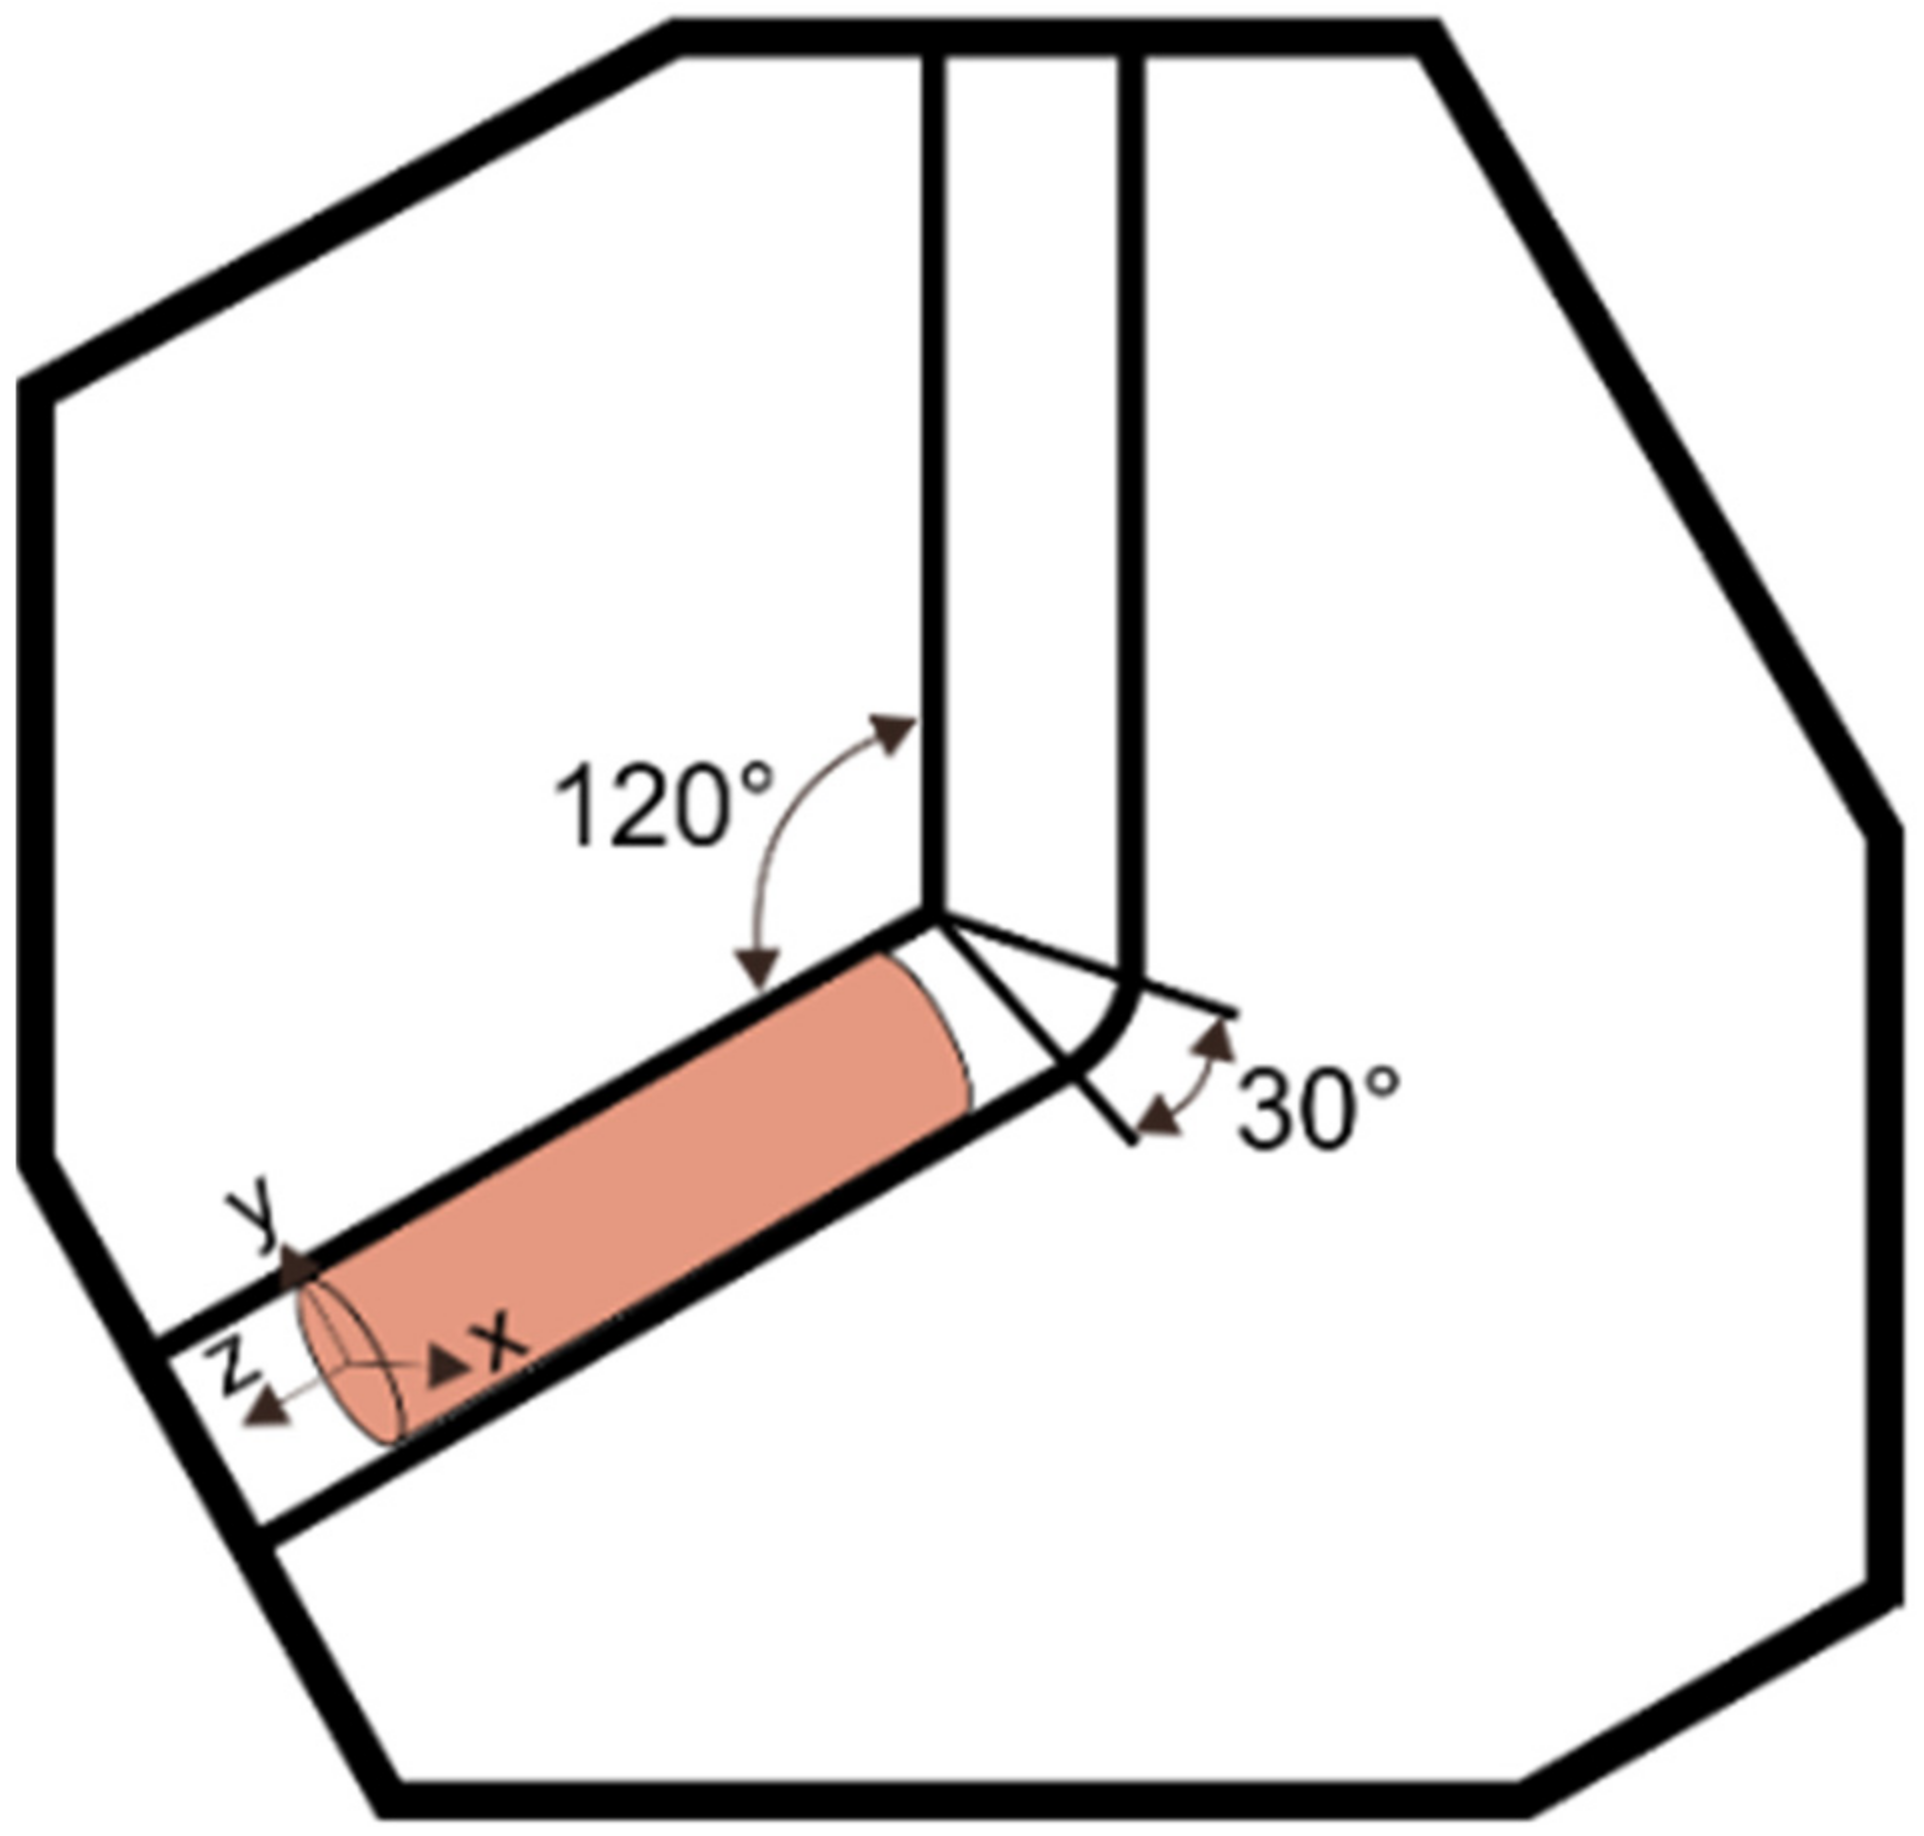
2. Materials and Methods

In this work, selective laser melting fabricated the samples from a spherical gas-atomized AlSi10Mg powder supplied by Sigma Aldrich (Germany); Table 1 gives its nominal chemical composition.
The TruPrint 1000 system from Trumpf (Germany) fabricated the cylindrical samples (length 45 mm, diameter 11 mm). All samples were prepared under an argon atmosphere with H2O and O2 concentrations below 20 ppm. The process details (i.e., model slicing, scanning strategy, component orientation) were planned, using the Materialize Magics software (Materialise, Belgium). The parameter sets utilized for sample fabrication are as follows:
  • Scanning speed 1400 mm/s;
  • Laser beam diameter 55 μm;
  • Layer thickness build-up of 20 μm.
More details about the applied scanning strategy and SLM process parameters can be found in our previous studies [33,34].
A short-time low-temperature annealing heat treatment was necessary to relieve the internal residual stresses derived from the manufacturing process and increase the alloy workability prior to ECAP processing at room temperature. To achieve this, SLM samples were placed in a conventional laboratory dryer and heated under an argon atmosphere for 8 min at 300 °C.
Heat-treated cylindrical samples were machined to their final dimensions of 45 mm long with a 9.95 mm diameter. To reduce friction between the work sample and the die wall, MoS2 was used as a lubricant. The ECAP process was conducted at room temperature using a die with a channel angle of Φ = 120° and a curvature angle of ψ = 30° (see scheme in Figure 1). The work samples were processed by 1 (S2-1 sample) and 2 (S2-2 sample) passes of ECAP via route A. Table 2 shows the labeling scheme and detailed information about the heat treatment/ECAP procedure.
An inverted Axio Observer Z1 light microscope (Carl Zeiss NTS GmbH, Oberkochen, Germany) and a Zeiss Supra 35 scanning electron microscope (Carl Zeiss NTS GmbH, Oberkochen, Germany) equipped with an energy spectrometer (EDS) characterized the microstructures of the samples. For this analysis, samples were prepared following standard metallographic procedures. The polished surfaces were then etched using Barker’s (2 vol.% fluoroboric acid in distilled water) or Keller’s Reagent (2.5 vol.% nitric acid 1.5 vol.% hydrochloric acid, and 1.0 vol.% hydrofluoric acid in distilled water).
The structural analysis was performed by X-ray diffraction using a PANalytical X’Pert Pro diffraction system (Malvern Panalytical Ltd., Royston, UK) equipped with a CoKα radiation source.
For the electron backscattered diffraction (EBSD) characterization, samples were polished using the standard metallographic techniques and then etched using Keller’s reagent. The grain structure was recorded using orientation imaging microscopy (OIM) applying the EBSD technique integrated with a Zeiss Supra 35 SEM controlled and analyzed using OIM software (EDAX, Inc., Mahwah, NJ, USA). The step size in EBSD was set to 0.3 μm for heat-treated (S2), 0.09 μm for 1 ECAP (S2-1), and 0.06 μm for 2 ECAP (S2-2) samples. A neighbor orientation correlation data cleaning process (level 4) was applied, followed by a grain confidence index standardization cleanup with a grain tolerance angle threshold of 2°. After data cleaning, a coincidence index filter of 0.05 was used to remove any points that were not indexed correctly.
Prior to corrosion test, the specimens were ground using 4000 SiC abrasive paper. All experiments were carried out after a fixed time to stabilize the passive film in laboratory air. Anodic polarization tests were performed using a standard three-electrode corrosion cell setup connected to a PC-controlled Atlas 0531 EU potentiostat, as per the PN ISO 17475:2010 standard [35].
In this configuration, the test sample, a saturated silver chloride electrode Ag/AgCl, and a platinum wire were used as the working electrode reference electrode, and supporting electrode, respectively, and a 3.5 wt % NaCl solution was used as the electrolyte, which is an effective electrolyte for indexing and ranking the corrosion resistance of different materials. The dissociation of chloride from sodium is easy through the electron emission. The dissociation of chloride from sodium is easy through electron emission. The ionic mobility strength of chloride ions in NaCl 3.5 wt %. is more potent than a solution with higher ions concertation (i.e., 9.6 wt %NaCl) and less than medium with lower concertation ions (i.e., 2 wt % NaCl). It is associated with nonlinear inverse functions for the cation mobility and anion mobility of NaCl solution versus molar concentration at a different temperature. Potential scans (Eocp) were carried out after 1 h of open circuit voltage stabilization (Eocp), with a scan rate of 1 mV/s from the initial value Einit = Eocp − 100 mV. EIS tests were conducted using AutoLab’s PGSTAT 302N system (AutoLab, Warsaw, Poland) with a frequency response analyzer (FRA2) and a three-electrode system identical to those used during potentiodynamic tests, after frequency stabilization for 1 h from 10−3 to 104 Hz with a perturbation amplitude of 10 mV. All electrochemical measurements were performed in triplicate to ensure high statistical accuracy.

3. Results

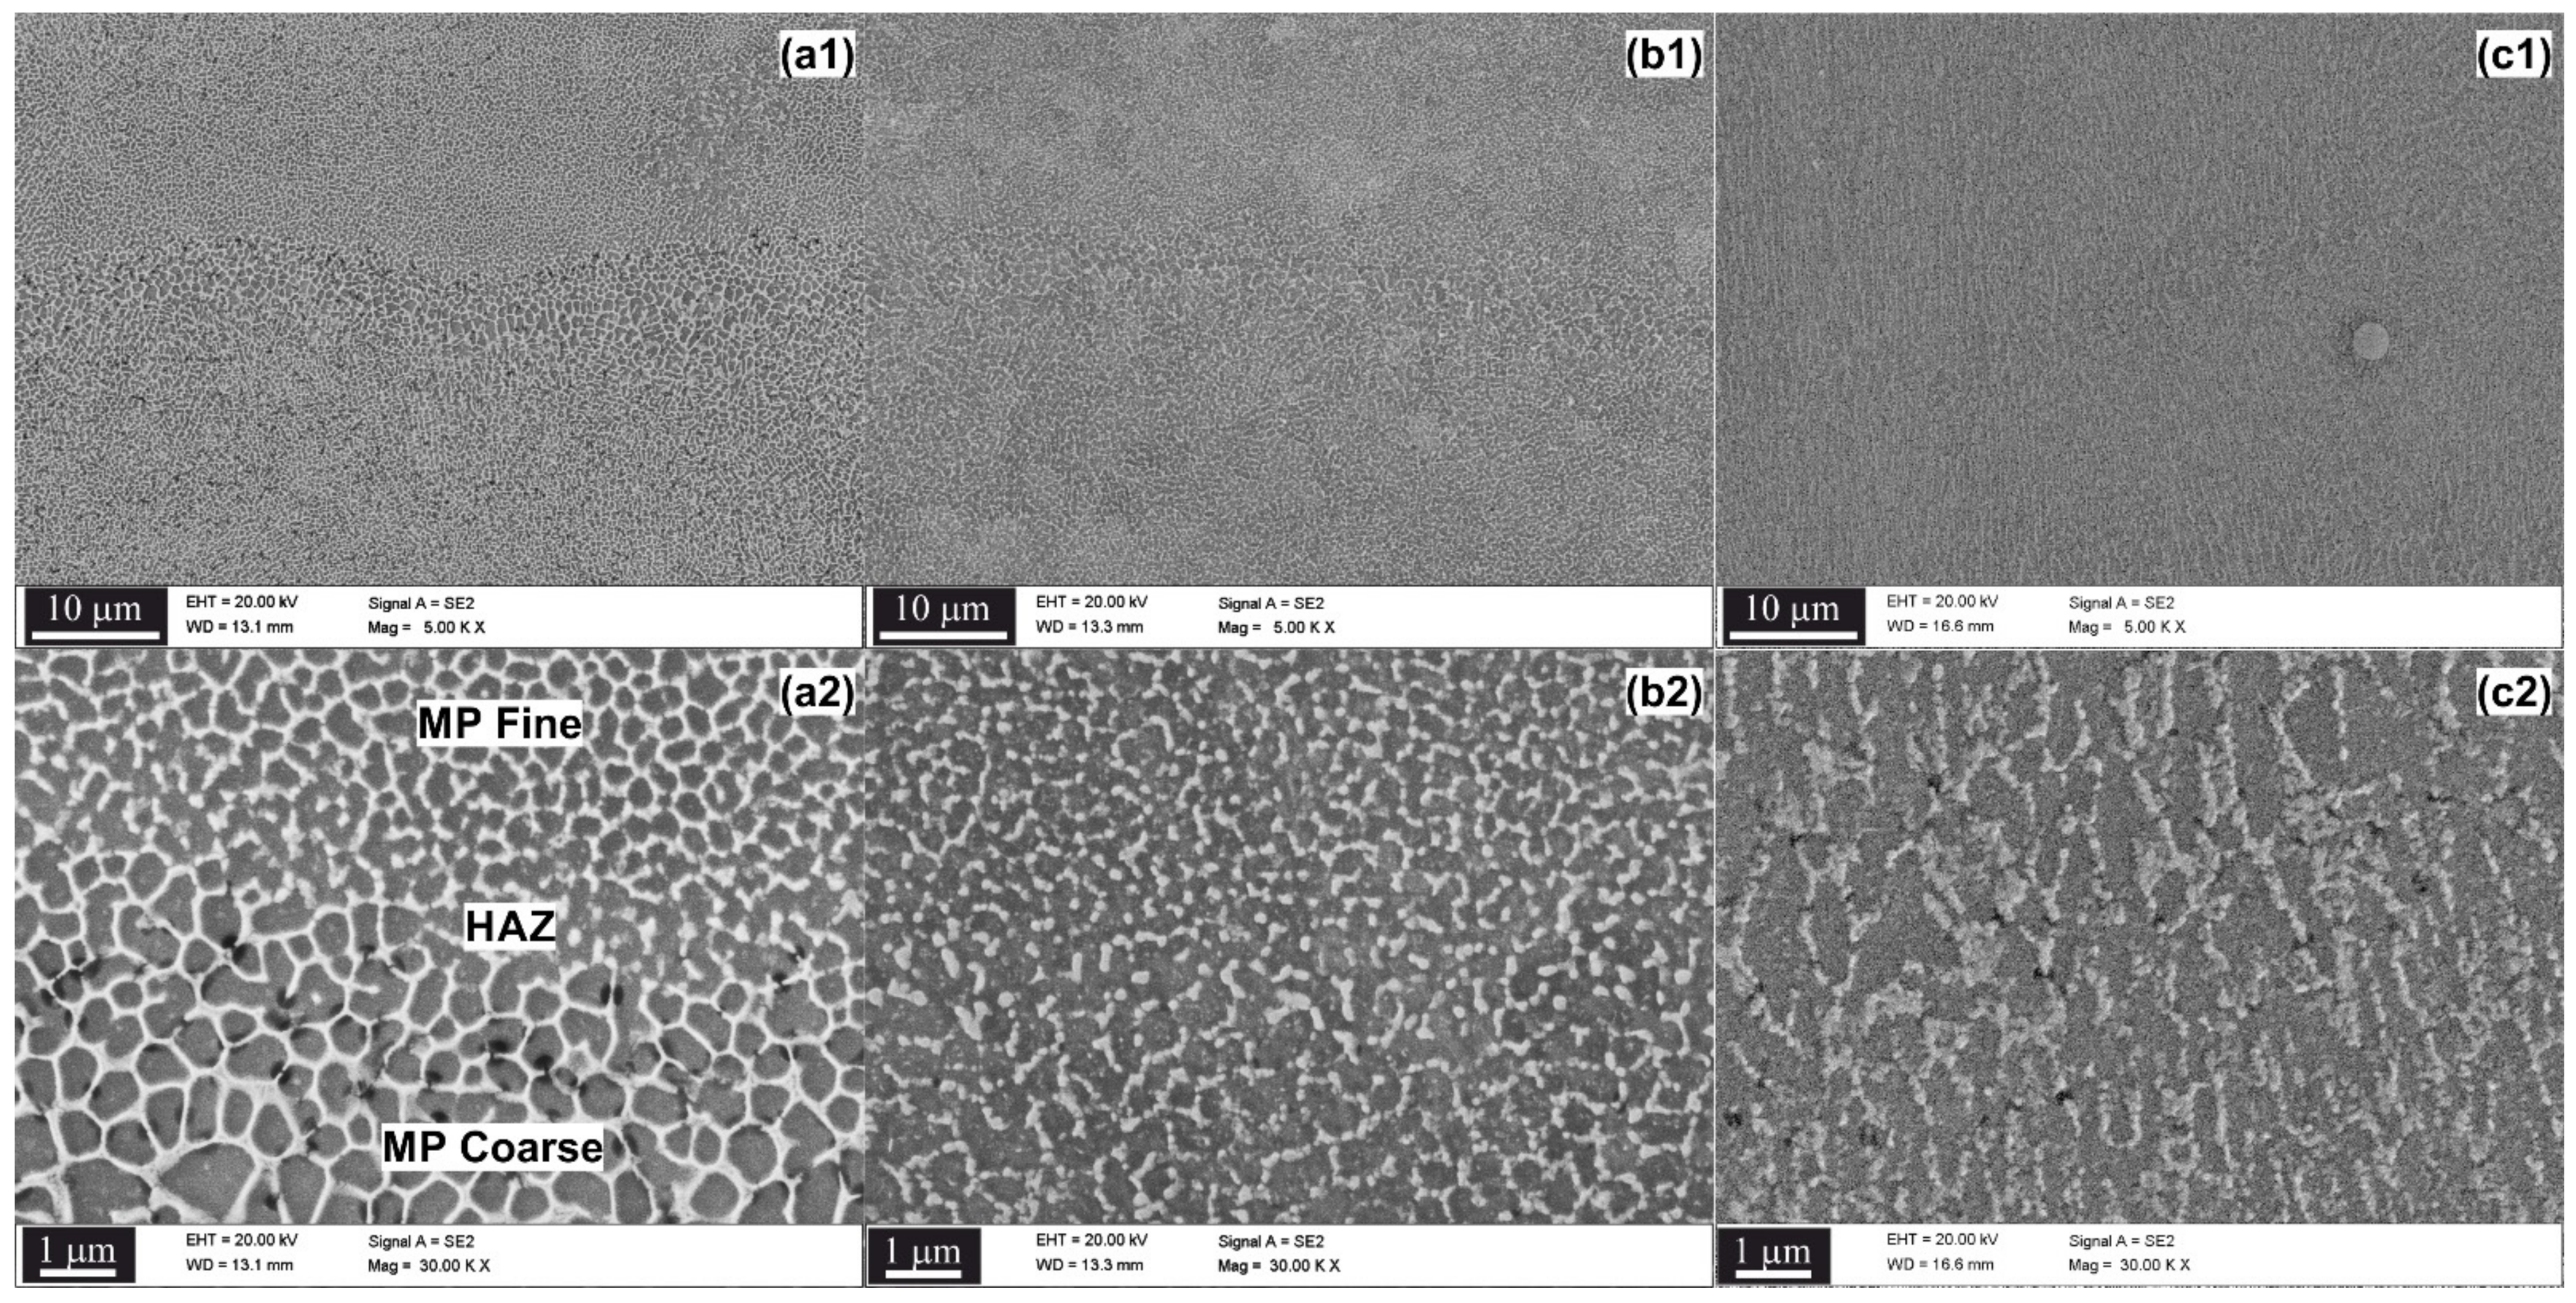
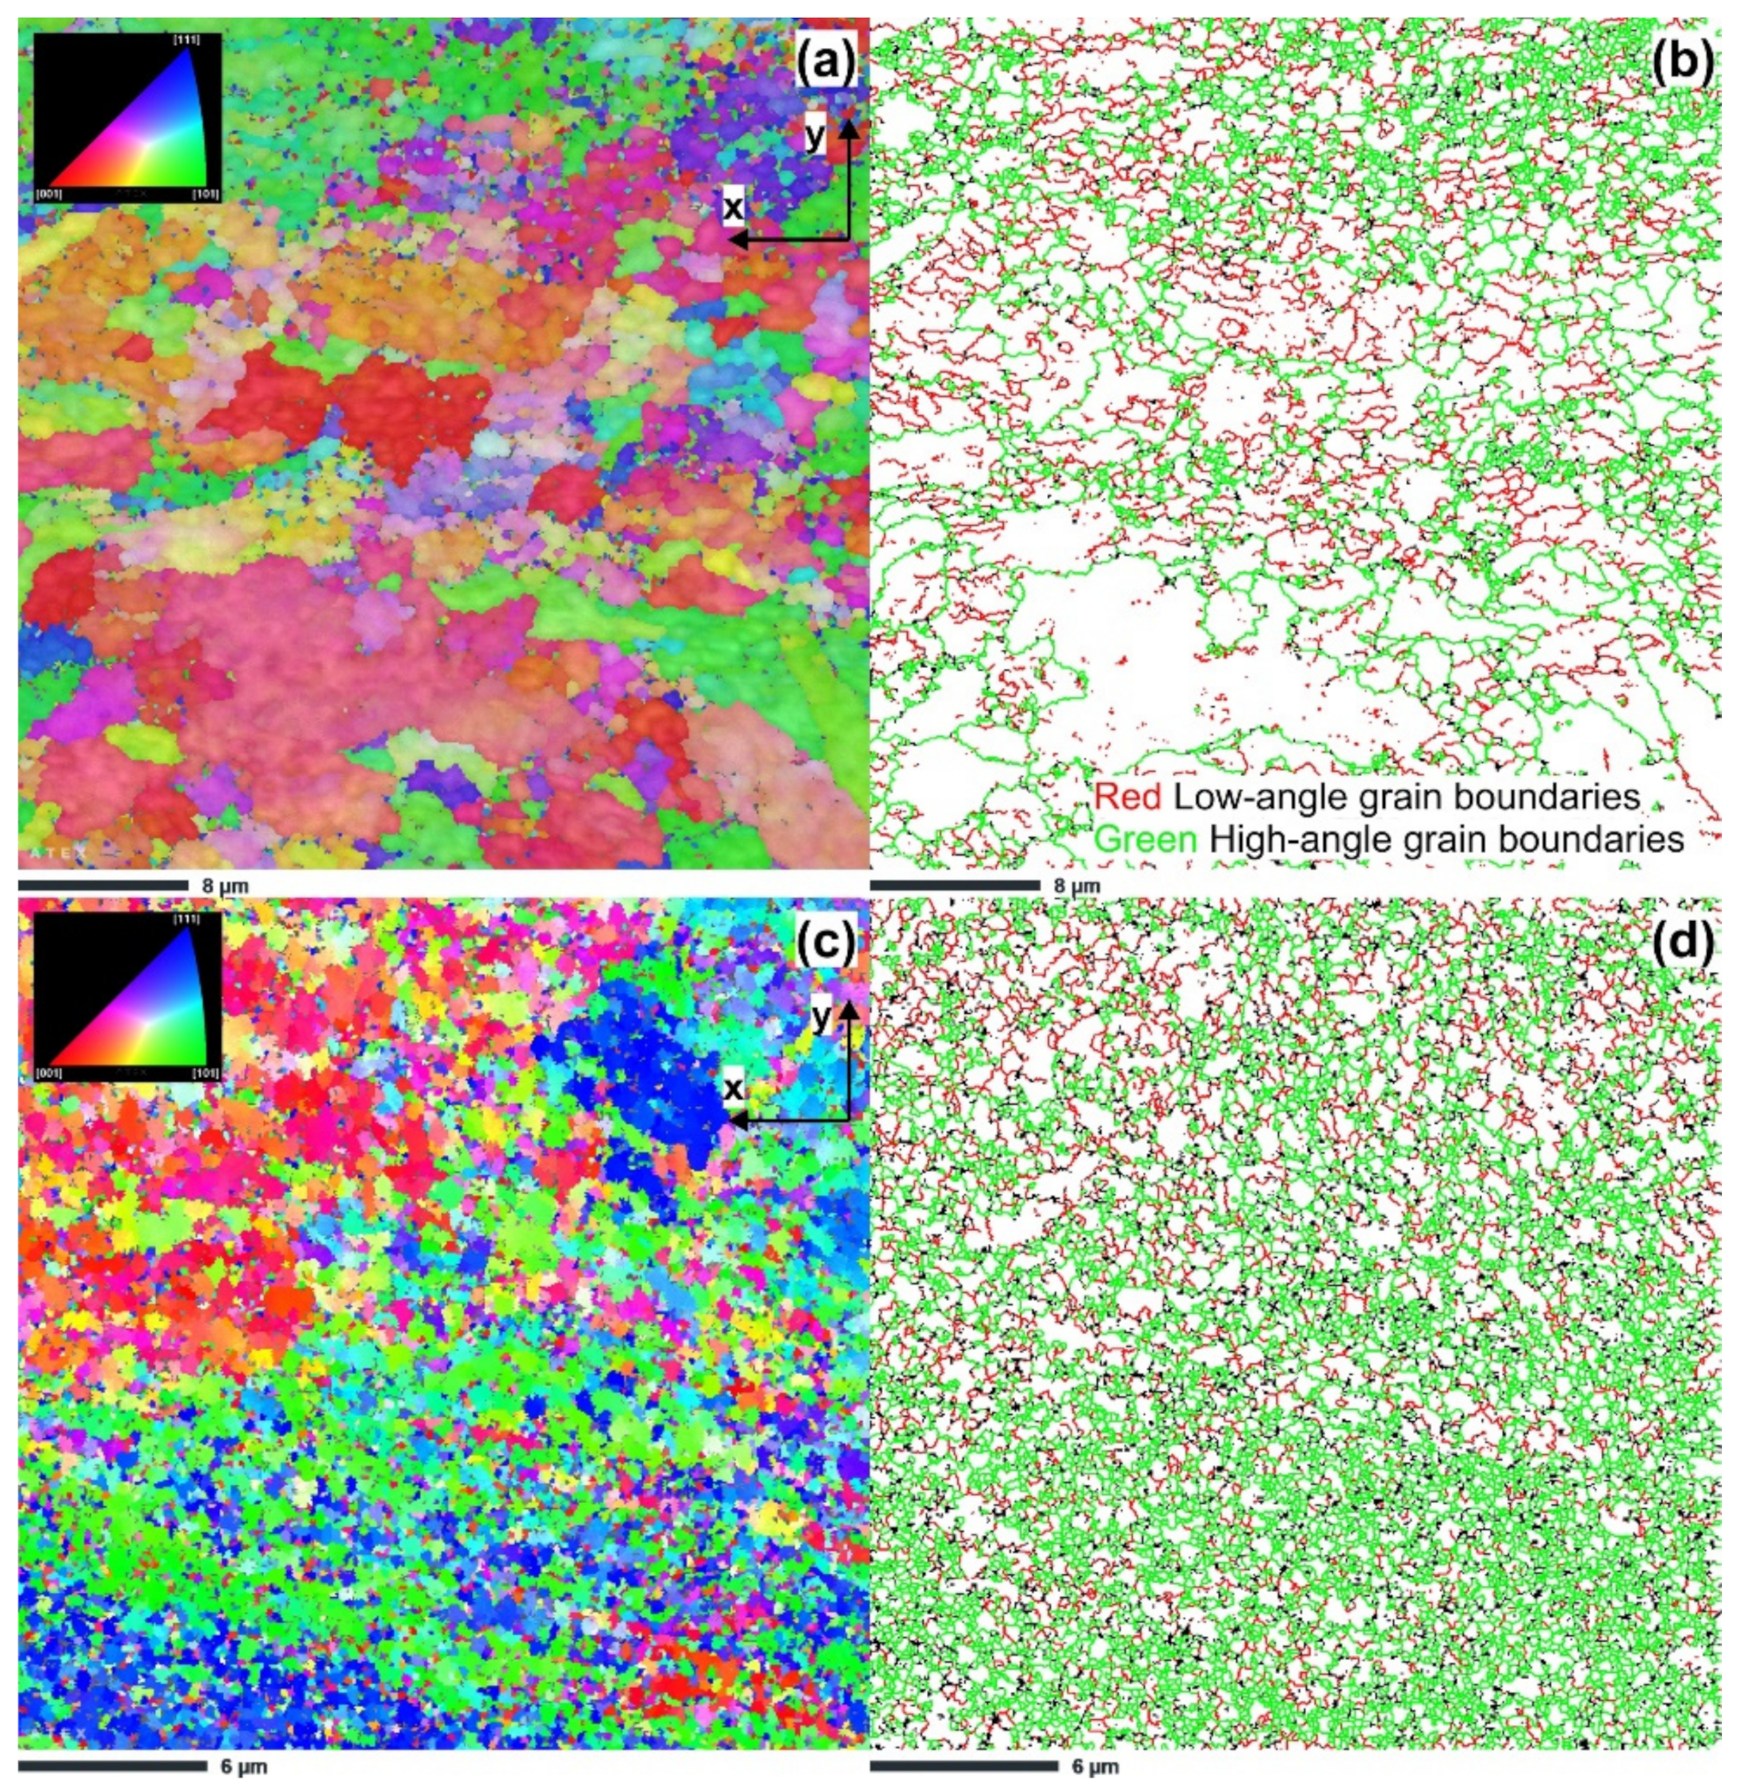
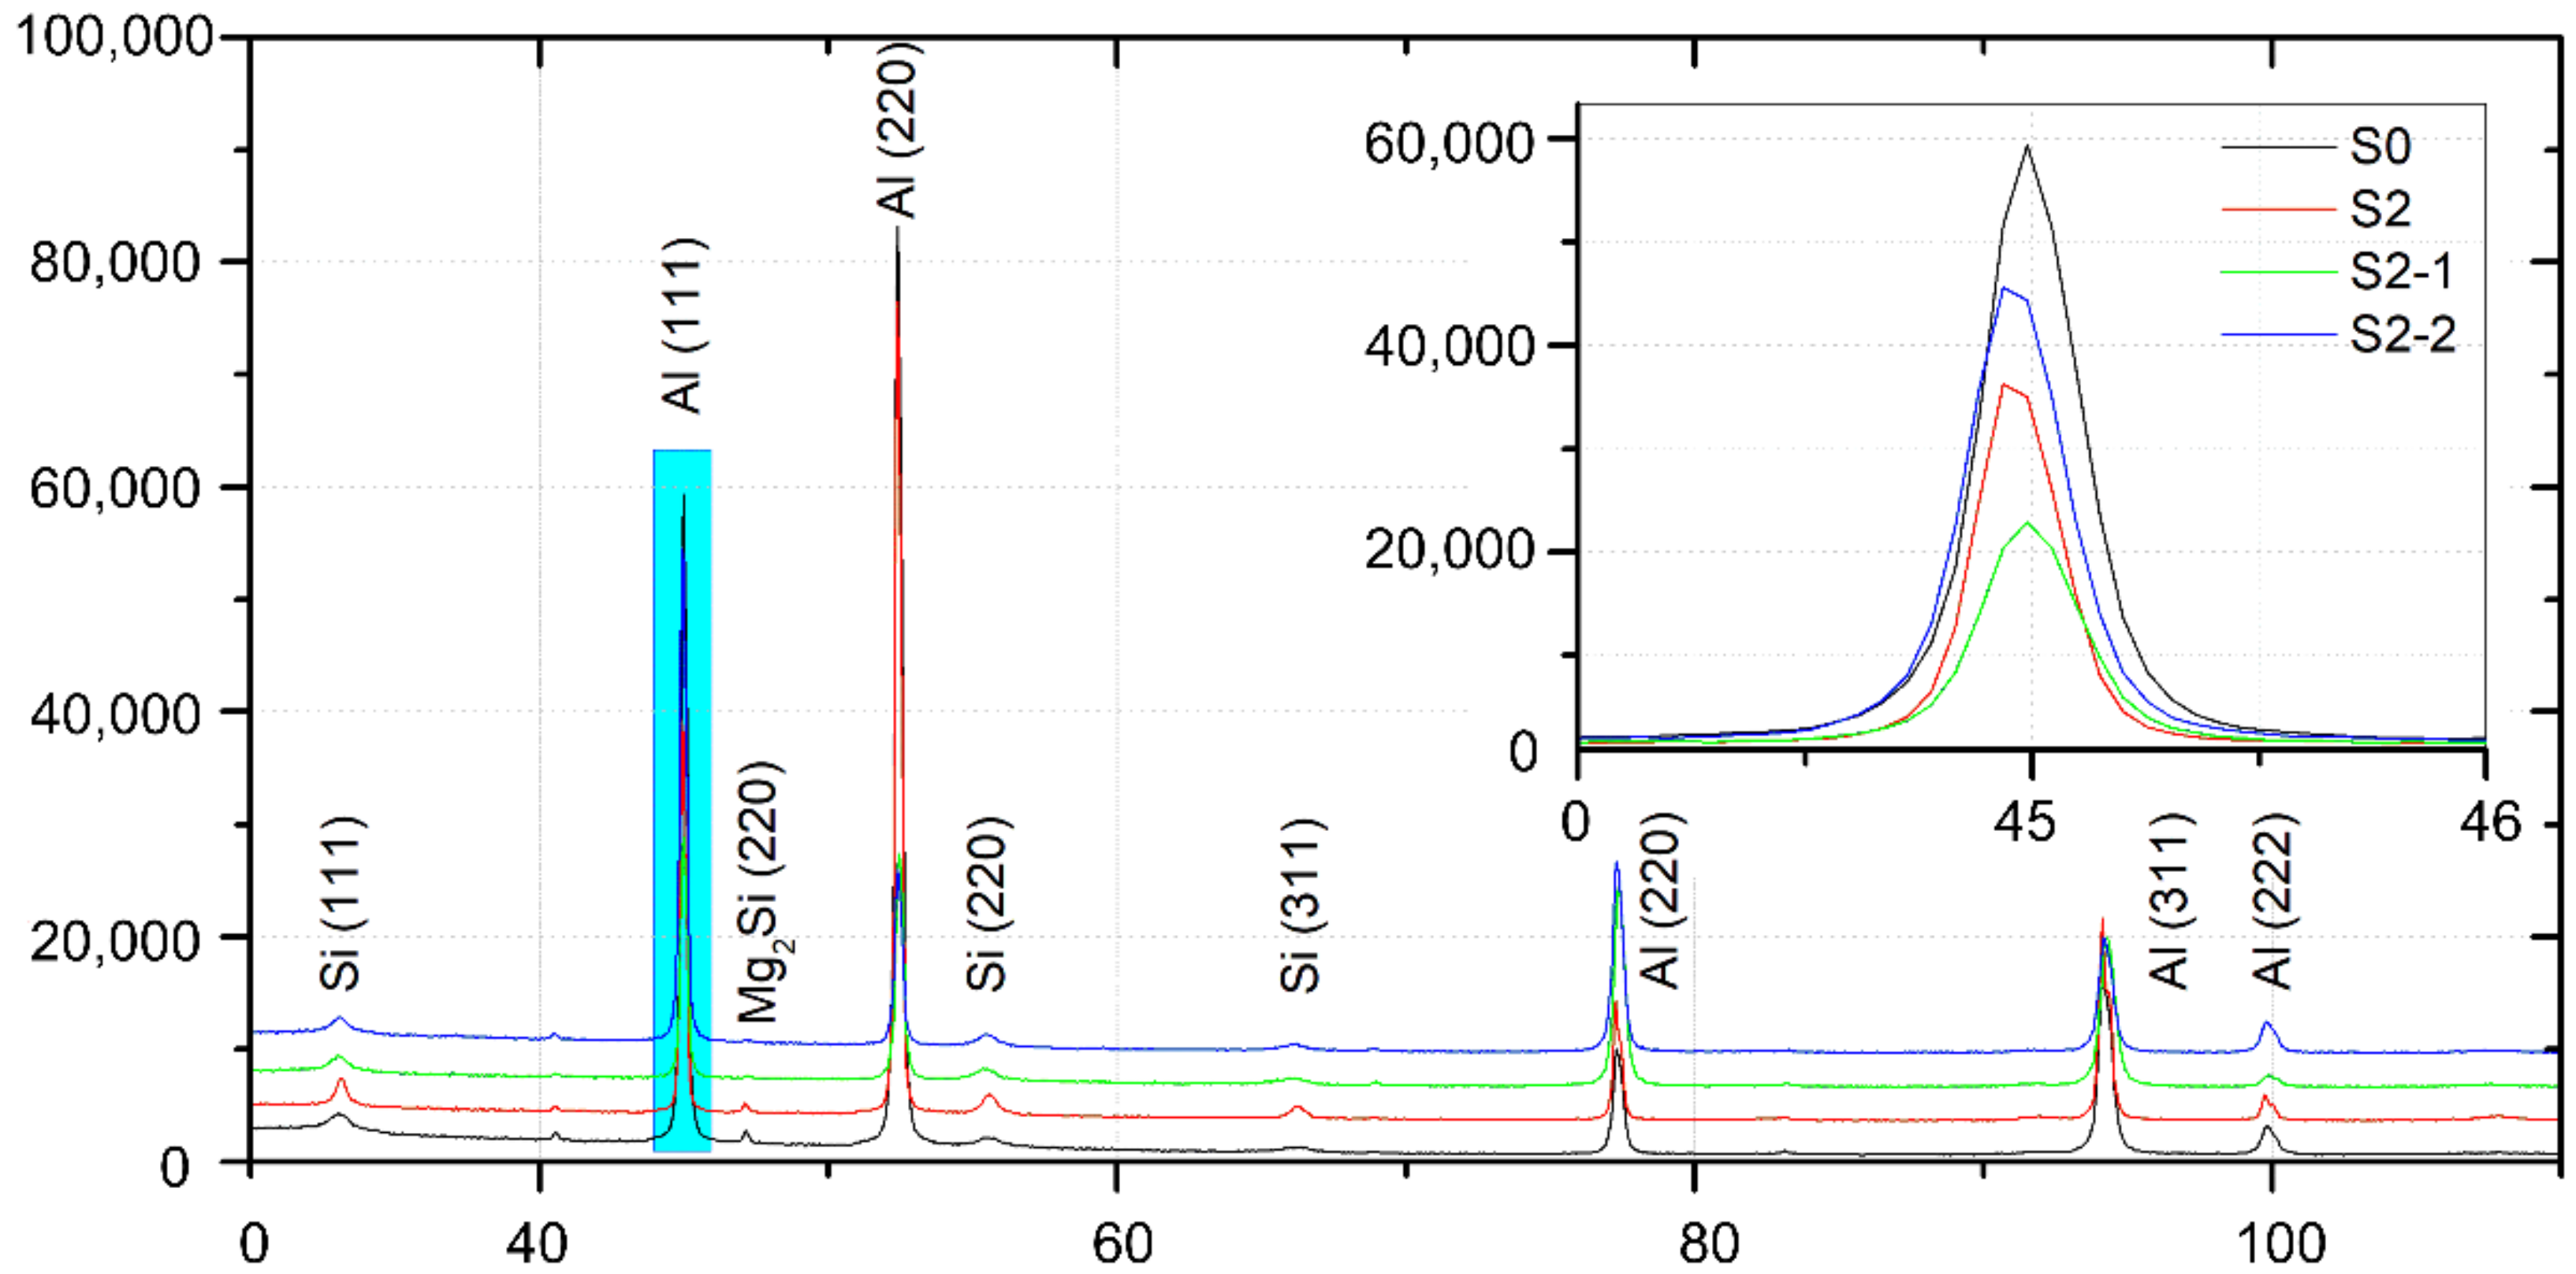
3.1. Microstructure Characterization

Figure 2(a1,a2) shows the microstructure of the as-built (S0) sample taken in the XY plane, perpendicular to the building direction. The microstructure featured almost symmetrical discontinuous laser scan tracks, which are typical for metallic materials prepared by SLM. The laser scan track boundaries appeared to be more heavily etched and darker than their interiors, where smaller crystals with diverse crystallographic orientations were also visible.
Figure 2(b1,b2) shows the microstructure of the same sample taken in the XZ plane (parallel to the build direction). As seen, the microstructure consisted of semicircular (fish-scale) patterns along the Z-direction, of which the geometry is attributed to the Gaussian effect of the incident laser beam.
Figure 2(c1,c2,d1,d2) shows the microstructure of the heat-treated sample (S2). The light microscopy images did not provide distinct evidence of microstructure evolution with respect to the untreated (S0) sample. Therefore, it was necessary to perform a more detailed analysis using SEM.
Figure 3(a1,a2) shows the microstructure of the as-built SLM AlSi10Mg sample, examined using secondary electrons. As indicated in the magnified image of the melt pool boundary, the microstructure of the as-built sample was heterogeneous, showing three different zones. These zones were identified as fine (‘MP fine’), coarse (‘MP coarse’), and a heat-affected zone (‘HAZ’). The ‘MP fine’ zone was composed of fine primary α-Al cells (darker gray) surrounded by a continuous cellular Si network (lighter white). The ‘MP coarse’ zone consisted of a coarser Si network, while the ‘HAZ’ consisted of a partially broken Si network.
Heat treatment significantly modified the cellular Si network in the ‘MP fine’ and ‘MP coarse’ zones (on the XY plane), Figure 3(b1,b2), and columnar Si network (on the XZ plane), Figure 3(c1,c2). After being held at 300 °C for 8 min, the initial continuous cellular network of Al/Si was dissolved by coarsening of the Si precipitates.
Figure 4 shows the optical micrographs of the ECAP processed samples. A microstructure consisting of multiple semicircular patterns was revealed in sample S2-1, Figure 4a. These patterns replaced the discontinuous laser scan tracks in the XY plane. The second pass made significant progress in microstructure evolution, which can be quantitatively evaluated by measuring the height of the ‘fish scale’ patterns and the fraction of the boundary of the melt pool. As can be seen, the ‘fish scale’ patterns became compressed and elongated along the x-axis (Figure 4b), so their height decreased from 54 ± 6 μm (S2-1 sample) to 16 ± 5 μm (S2-2 sample). Additionally, the fraction of melt pools (MP) boundaries increased; see the brighter areas in Figure 4c,d.
Figure 5a,b shows the inverse pole figure (IPF-Z) orientation and grain boundary maps (representing the XY plane) of the heat-treated sample. The IPF-Z orientation map, Figure 5a, revealed distinct areas with fine grains along a curving area (indicated by dotted lines) corresponding to the laser scan track boundary (heat affected zone), which is typical for SLM alloys [36]. Meanwhile, the vicinity of the laser scan track was composed of larger equiaxed grains. According to the grain boundary map, Figure 5b, and the data summarized in Table 3, the fraction of low-angle boundaries (LABs, defined as boundaries with misorientation angle between 3° and 15°) of the heat-treated sample was approximately 8%. The measured average grain size for the XY plane was approximately 3.2 µm.
Figure 5c,d presents the inverse pole figure (IPF-Z) orientation and grain boundary maps (representing the XZ plane) for the same sample. The EBSD result shows that the microstructure was composed of columnar grains, Figure 5c, with an average grain size of approximately 10.1 µm. Such a grain morphology is typical for the side plane of SLM-fabricated samples and results from the boundaries of the epitaxial growth from the molten pool [37]. According to the grain boundary map, Figure 5d, the side (XZ) plane contained a large fraction of LABs than the building (XY) plane (~27% of the total grain boundaries).
Figure 6 shows the inverse pole figure (IPF-Z) orientation and grain boundary maps of the ECAP processed samples. In these maps, to reduce the influence of noise on the data, crystallites smaller than or equal to four map pixels were ignored. As is visible, the first ECAP pass caused significant modification of the microstructure. Referring to Figure 6a, the microstructure became more homogeneous and finer. The fraction of low-angle boundaries (LAGBs) increased to ~29.2%. At the same time, the average grain size decreased to 1.425 µm. The second ECAP pass brought significant progress in grain refinement, shown in Figure 6c,d. It appears that the cell boundaries acted as additional obstacles for mobile dislocation; therefore, with the progressive increase in the number of ECAP pressings, these cells formed subgrains. Consequently, the fraction of grains that had low angle misorientation decreased slightly to 19.32%, and the grain size was further reduced from 1.42 to 0.25 µm.
Figure 7 presents a series of the typical (111) pole figures derived from EBSD data, which were plotted for heat-treated and ECAP processed samples. According to the notation proposed by Toth [38], the heat-treated sample on the XY plane demonstrated the major 011 100 Goss and minor 001 100 cube texture components, shown in Figure 7a, which is typical for the bi-directional scanning strategy [39]. Taking into account the side surface (XZ plane), elongated grains oriented along the building direction formed, shown in Figure 5c, which resulted in an increased preferred fiber texture composed of {011}<112> (brass) orientations, shown in Figure 7b.
After the first pass of ECAP (Figure 7c), the type of texture components changed. We identified a strong shear A 1 | A 2   111 112 texture component with a maximum intensity of ~4.6 mr (multiply random). With further increasing the deformation strain to ~ 1.2 (2 ECAP passes), shown in Figure 7d, the A 1 | A 2   111 112 components became strengthened and, additionally, the B | B   ¯ 112 110 texture component appeared.
Figure 8 shows the full XRD patterns corresponding to each investigated condition. In these patterns, we identified the main reflections, which corresponded to the Fcc Al, diamond cubic Si, and cubic Mg2Si phases. As can be observed, the Si peaks for the heat-treated S2 sample had higher intensities than those of the as-built S0 sample, which means that the heat-treatment period was long enough to initiate the precipitation of excess Si from the Al matrix, thus decreasing the Si content in the solid solution. This accordingly caused a lattice parameter increase from 4.0495 ± 0.0004 Å (S0 sample) to a more equilibrium value of 4.0509 ± 0.0003 Å (S2 sample), which for Al in AlSi10Mg alloys is reported to be 4.0515 Å [40]. The inset in Figure 8 illustrates the shift of the Al (100) reflection toward the lower 2θ angles, suggested the minor variations in the Al lattice parameter after ECAP. In fact, the calculated Al lattice parameter of the S2-1 sample decreased to 4.0476 ± 0.0003 Å; however, it increased slightly to 4.0502 ± 0.0003 Å after the second ECAP pass (S2-2 sample), which indicated variations in the Si solid solubility during ECAP processing.
Based on modified Vegard’s Equation (1) [41], we calculated 1.1 at% Si solute for as-built, 0.3 at% Si solute and heat-treated samples, respectively. The first pressing of ECAP led to solid solubility extension of silicon in the aluminum matrix. The amount of Si in the solid solution increased to 2.2 at% (note that for Al alloys, it is 1.65 at%); however, during the subsequent ECAP pass, the dynamic precipitation of supersaturated Si depleted the solute concentration in the solid solution [42], decreasing it to 0.7 at%.
α = 0.40515 0.0174 X S i
where α is the lattice parameter of the Al matrix, and XSi is the atomic fraction of Si in the Al matrix.

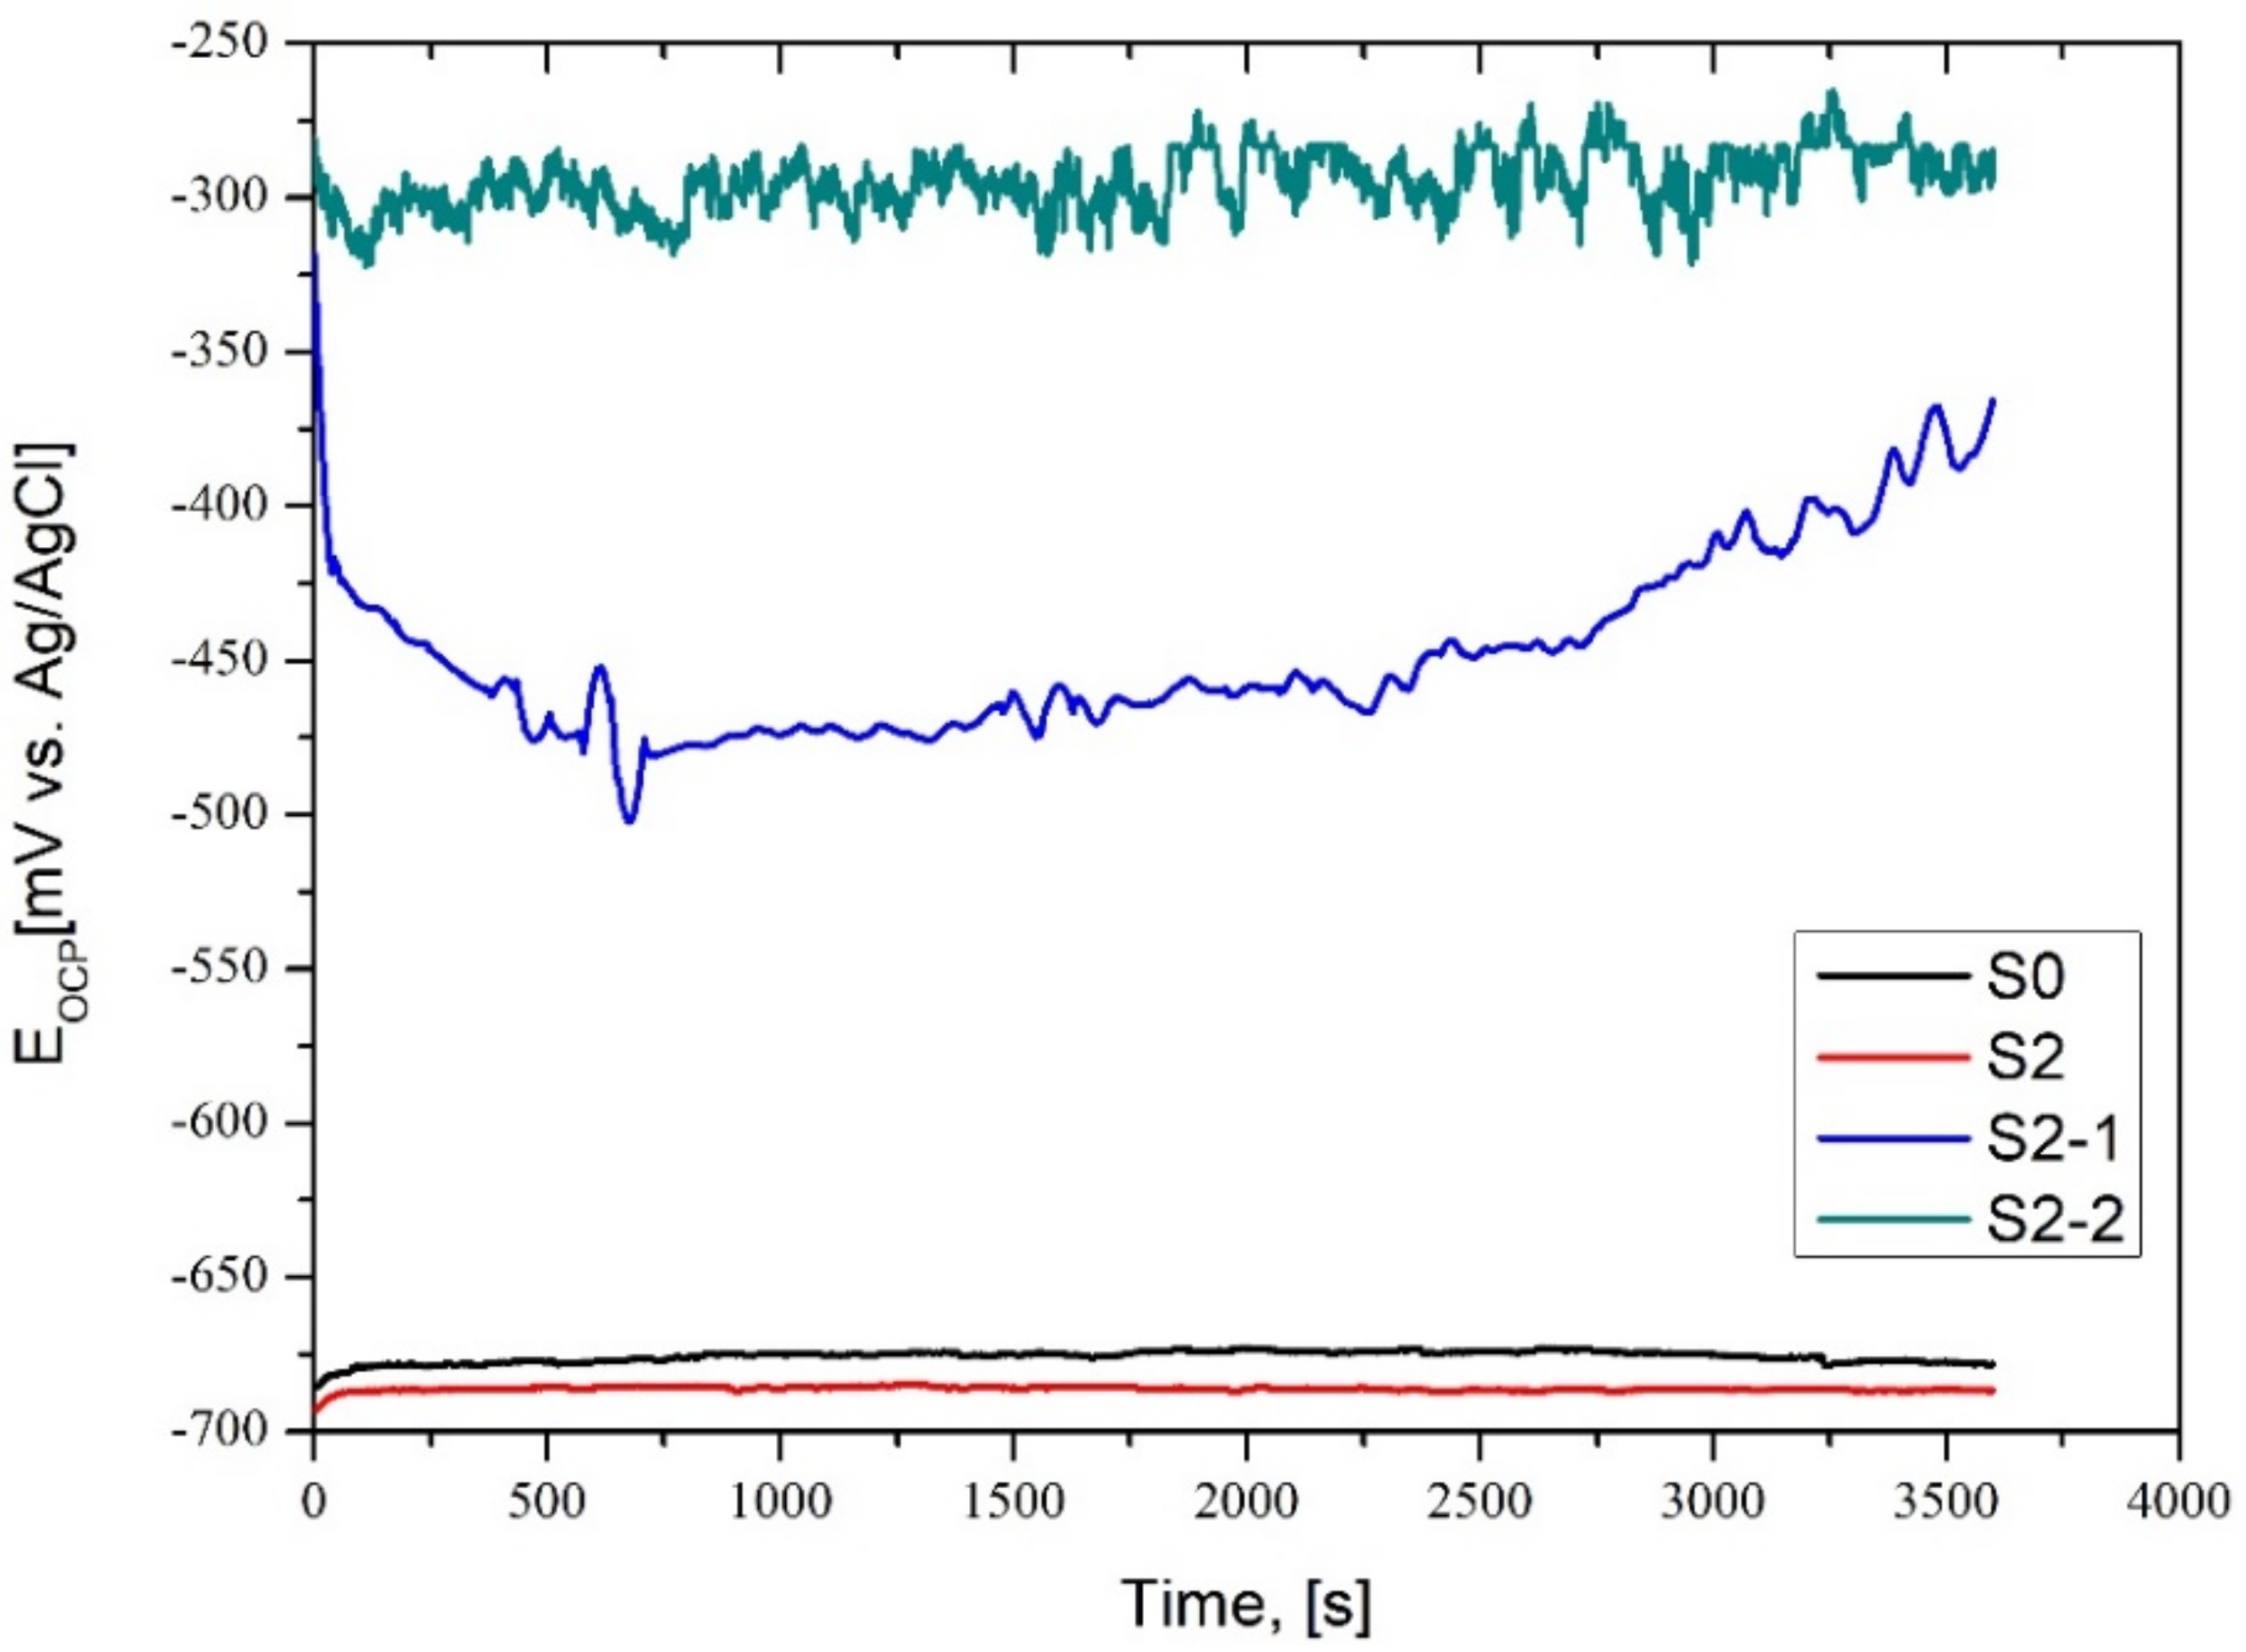
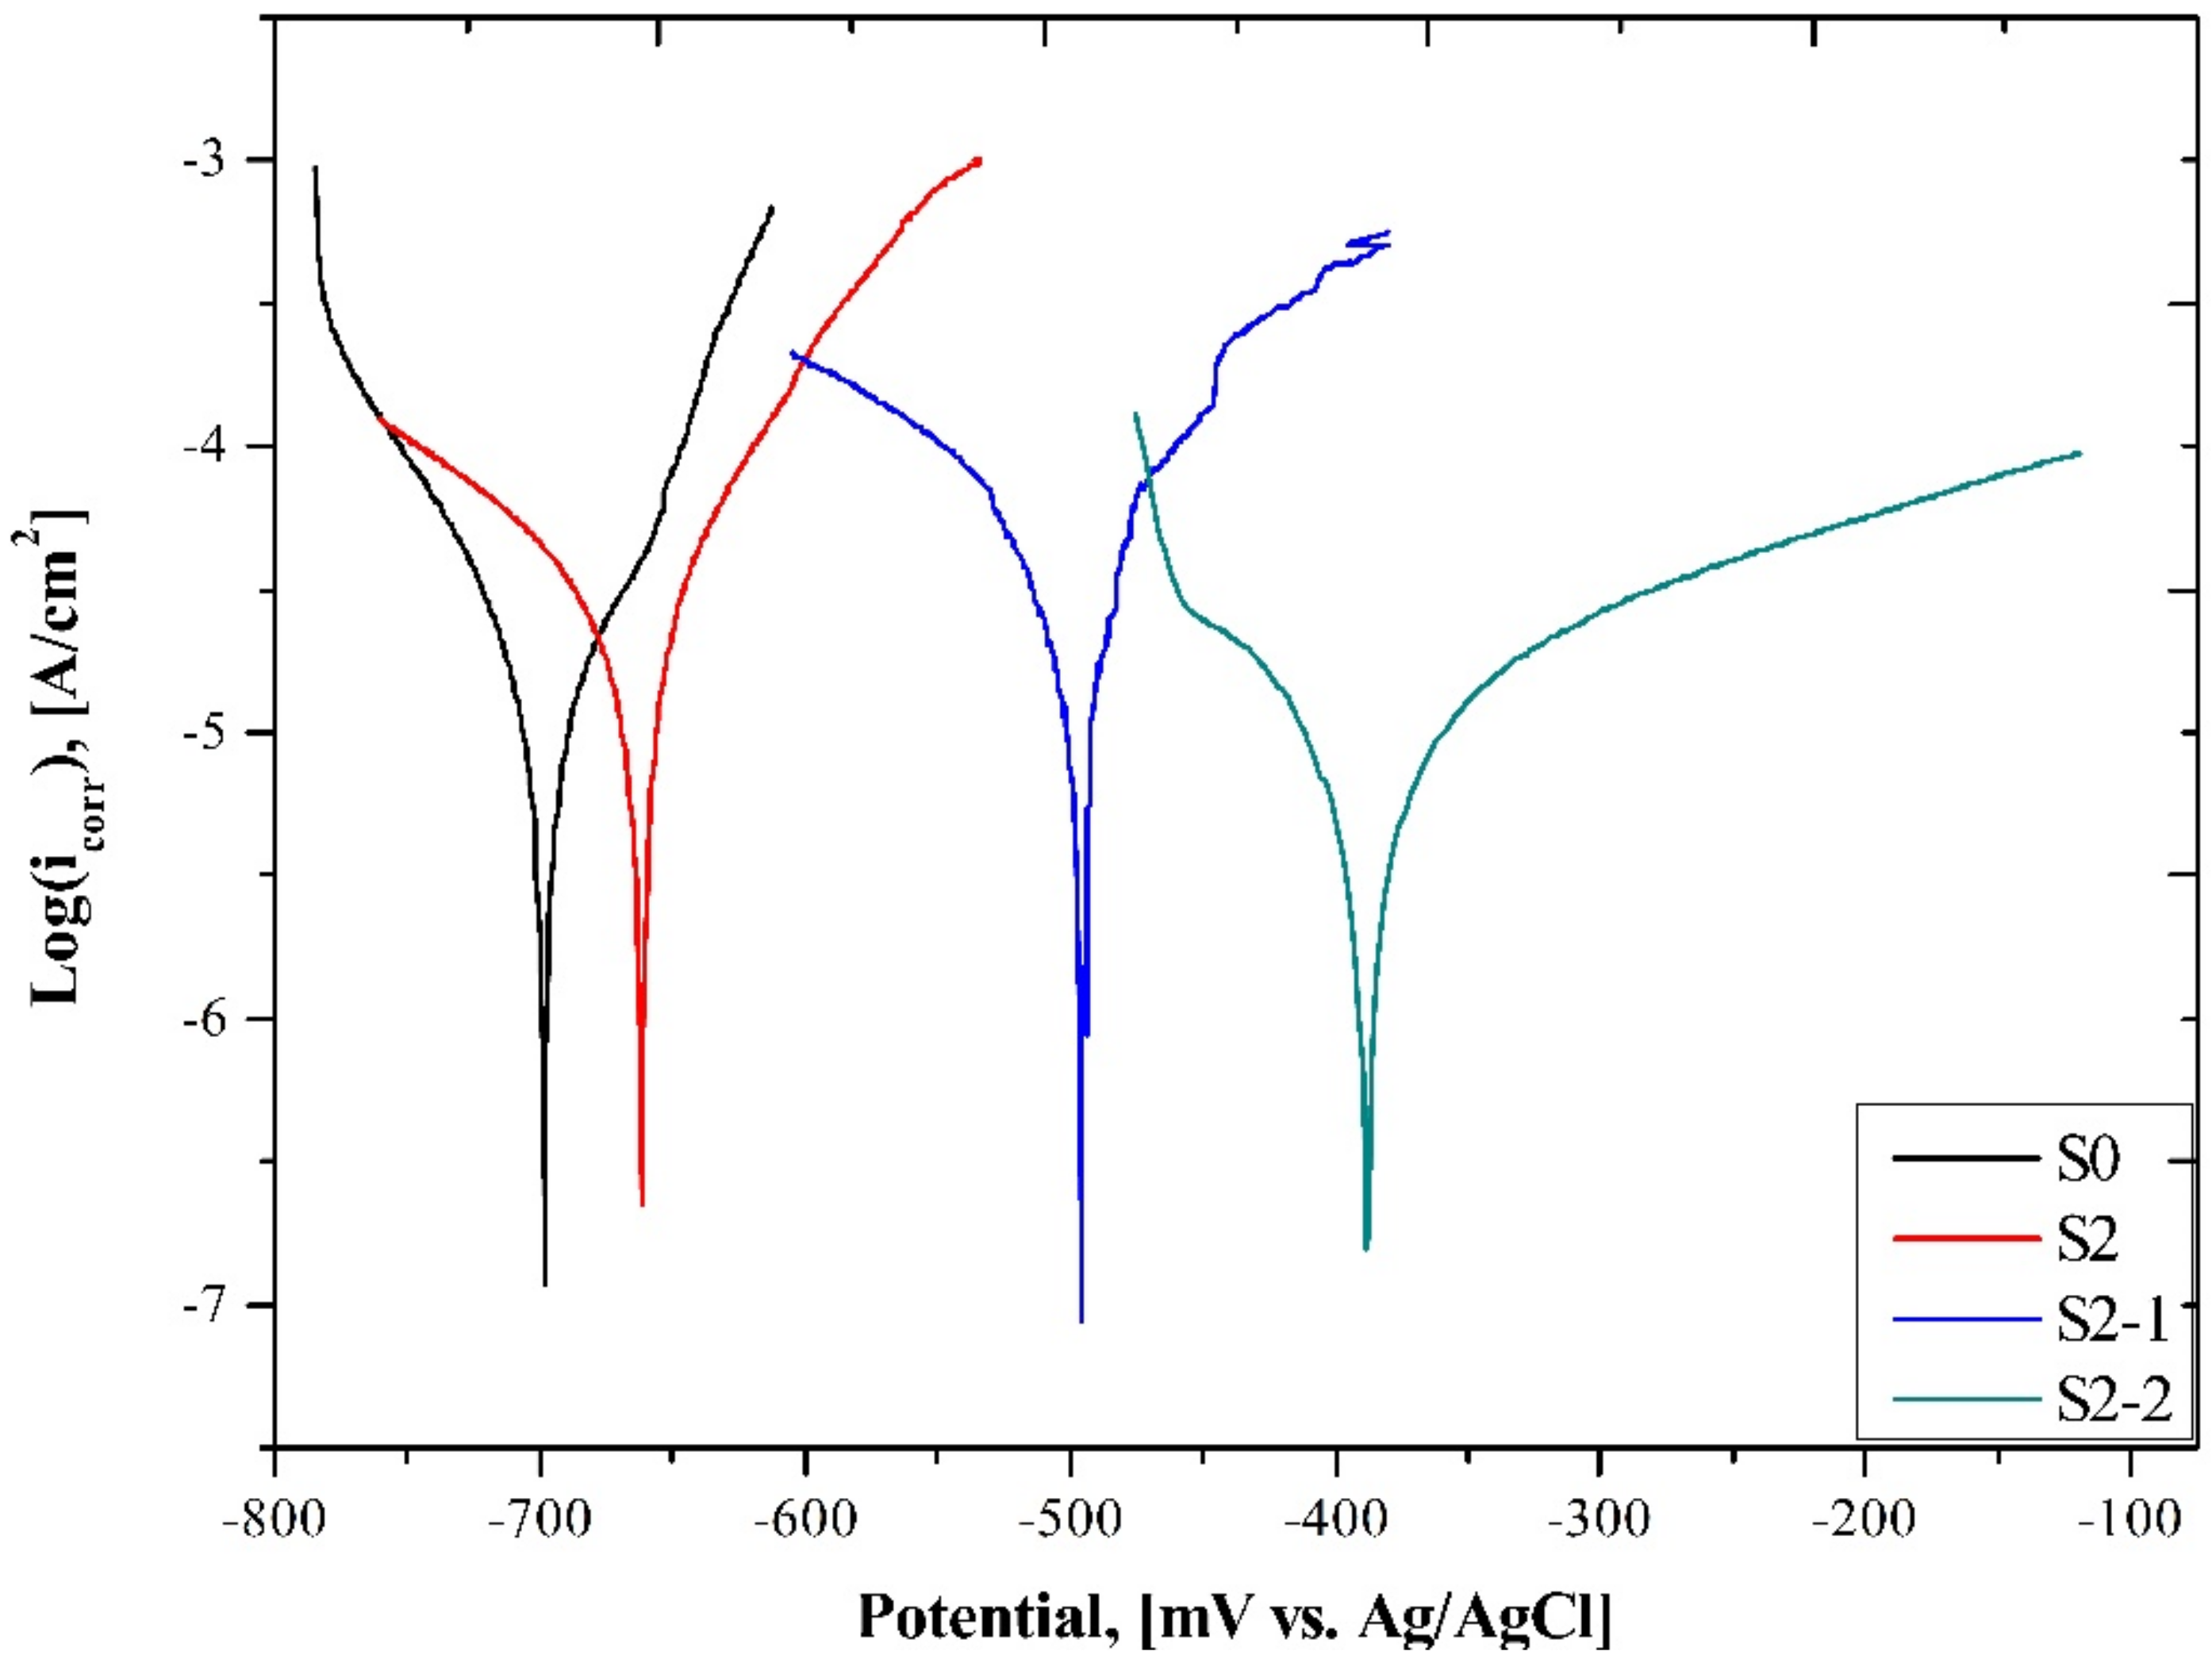
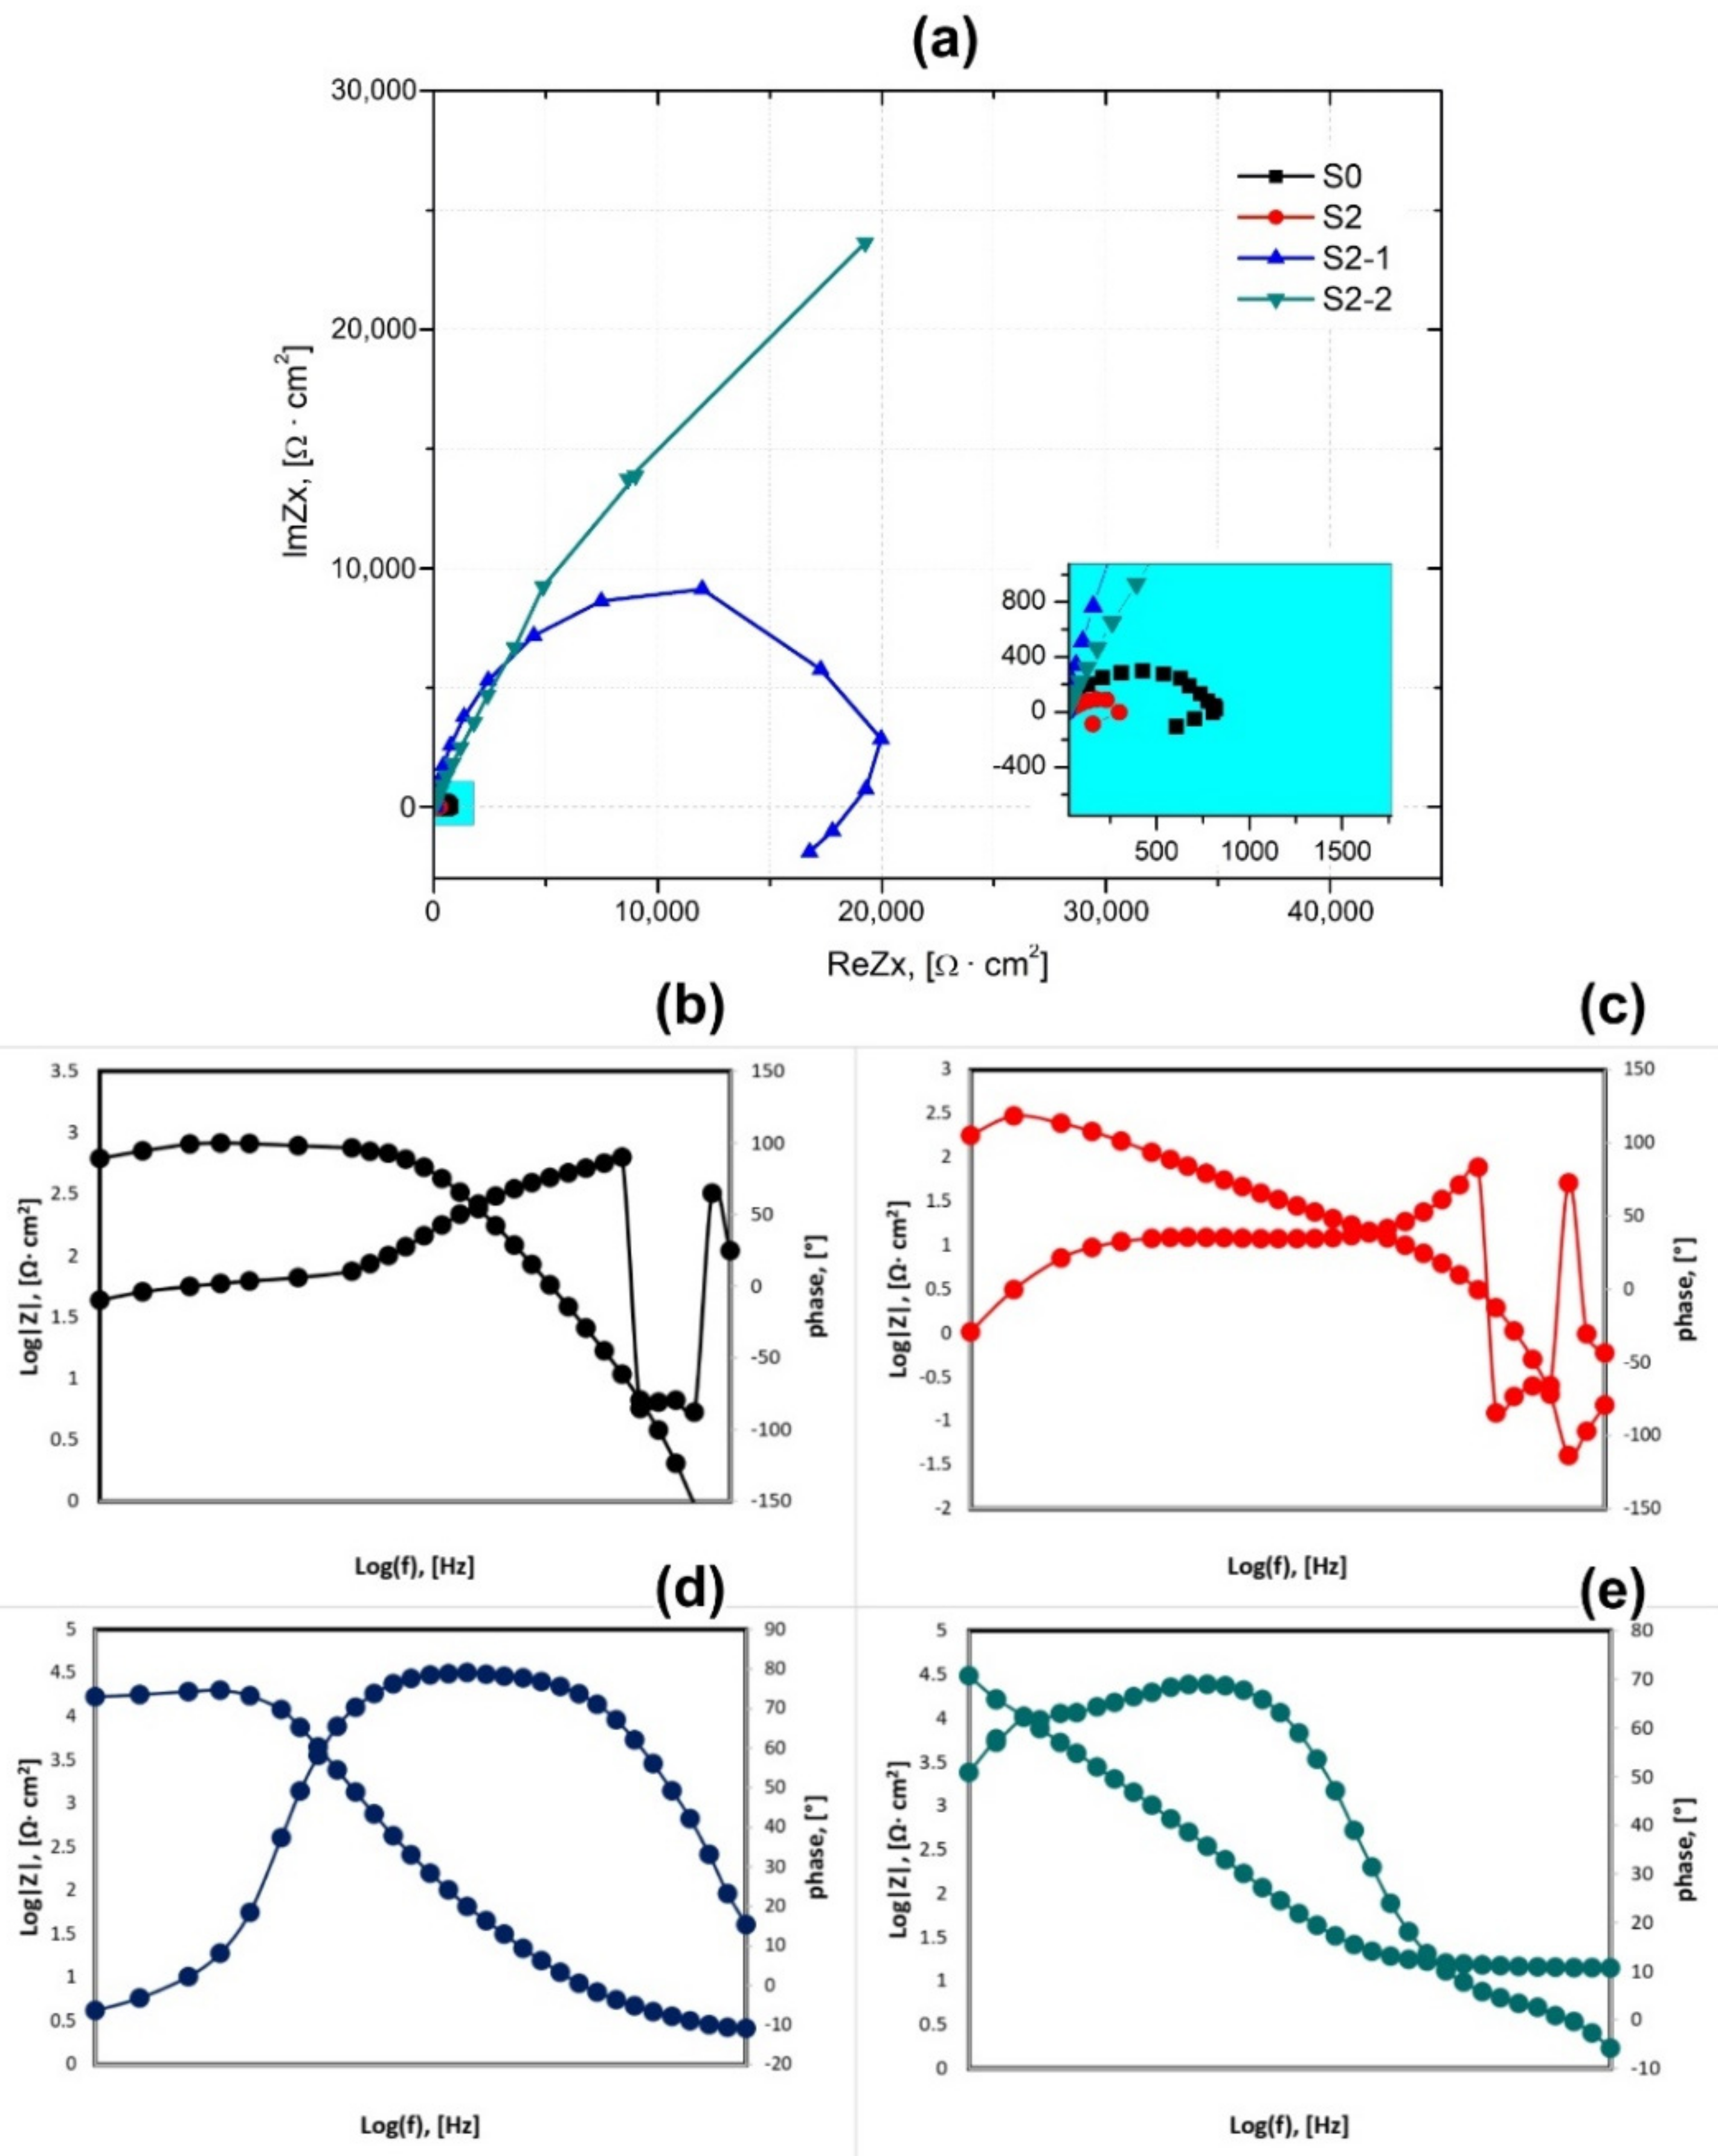
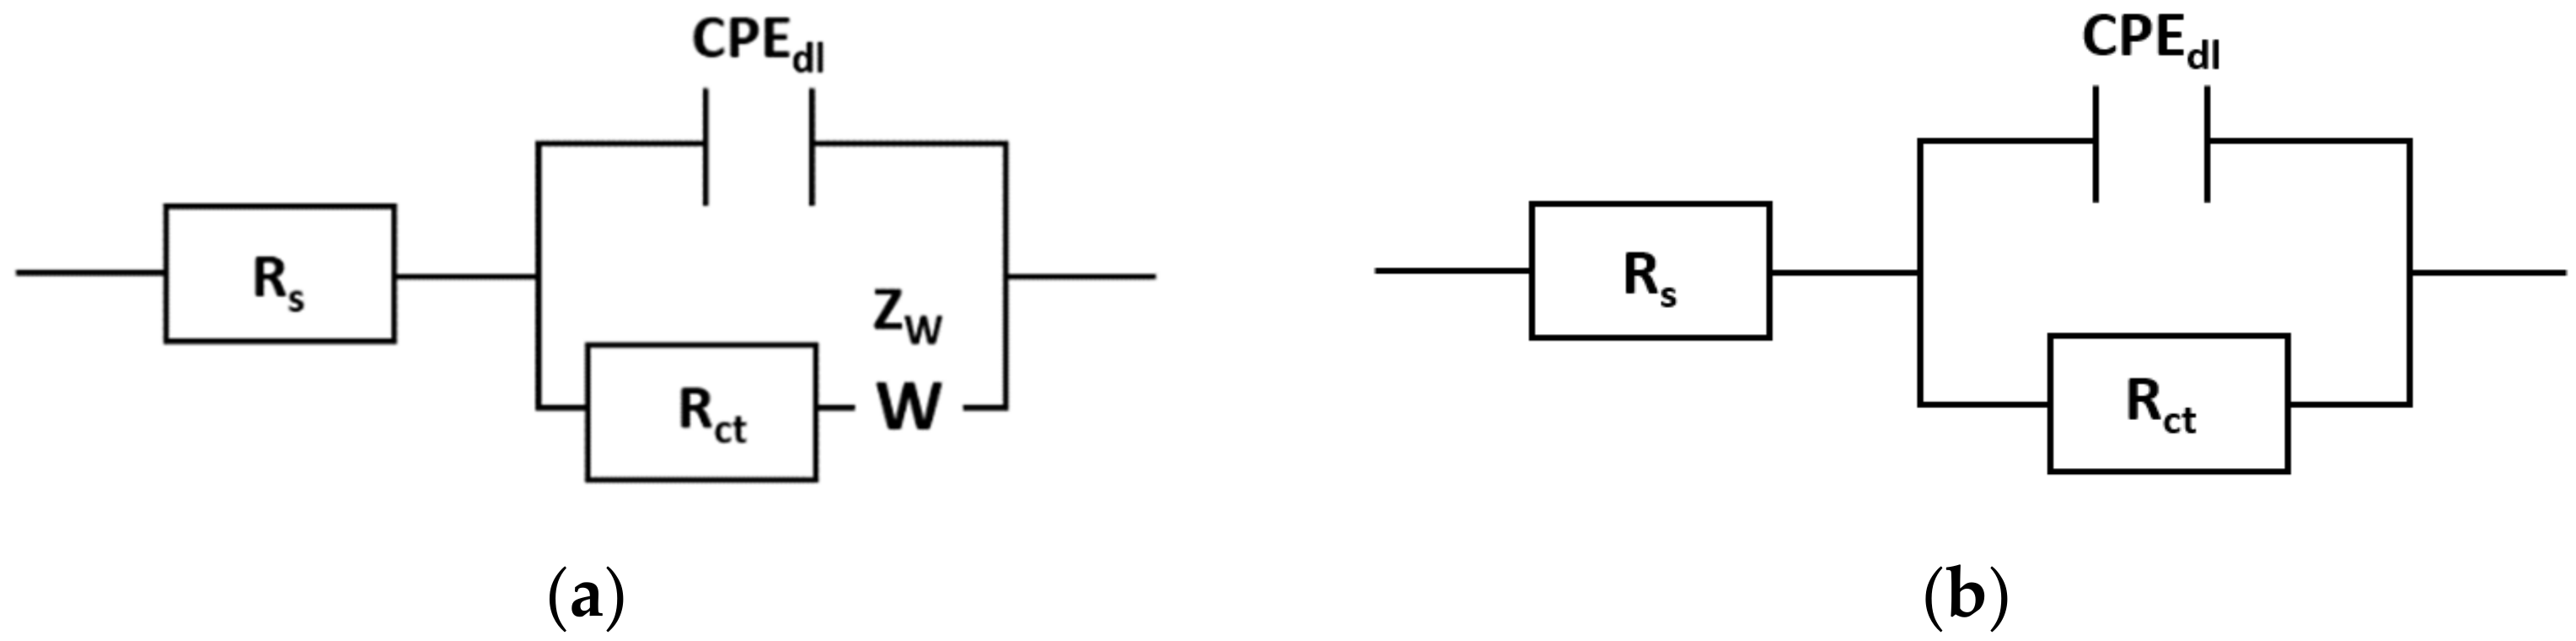
3.2. Corrosion Properties Analysis

The typical electrode potential (Eocp) as a function of immersion time in a 3.5% NaCl solution for the as-built, heat-treated and ECAP processed samples are presented in Figure 9. As can be seen, the stabilized Eocp values for the S0 and S2 samples were much lower (~–670 mV, and −685 mV, respectively) than for ECAP processed S2-1 (~–0.760 mV) and S2-2 samples (~–0.870 mV). Generally, the open circuit potential Eocp reflects the thermodynamic parameter, which guides us about the thermodynamic tendency of metallic materials to participate in electrochemical corrosion with the electrolyte or neighboring medium. A decrease in Eocp values with the subsequent stabilization indicate possible dissolution of the material surface, whereas an increase in the Eocp values with subsequent stabilization indicates an increased compactness of the passive layer and/or growth of corrosion products on the samples’ surfaces. The recorded Eocp values for the four tested samples belonged to the passive region domain of Al(OH)3 or Al2O3 in the Pourbaix diagram for aluminum [43], which indicated the formation of a Al(OH)3 or Al2O3 passive layer on the sample surface. Accordingly, the higher Eocp values for the ECAP processed samples indicated their higher corrosion resistance, which is due to the possibility of a more effective formation of the oxide layer from the corrosion product and, in effect, the passivation process.
Potentiodynamic measurements were conducted to understand the effects of heat treatment and subsequent ECAP on the corrosion rate. Figure 10 illustrates the polarization plots, while Table 4 lists the potential (Ecorr), the polarization resistance (Rp), and the corrosion current density (icorr) obtained from their respective polarization plots by Tafel extrapolation.
The obtained values of the corrosion potential Ecorr were in line with the open-circuit potential behavior Eocp. For the built S0 sample, the mean value of the corrosion potential was Ecorr = −663 ± 11 mVAg/AgCl. The corrosion potential decreased slightly after heat treatment to –693 ± 21 mVAg/AgCl. This is because thermal treatment at 300 °C changed the size and morphology of Si precipitates and resulted in a depletion of the silicon content of the aluminum matrix; therefore, the alloy matrix became less noble [44,45,46]. In this way, the effect of galvanic stimulation can be emphasized, which means that the Al anode matrix surrounding the large cathode is more prone to dissolution, which resulted in a cathodic shift of the Ecorr value.
ECAP processing resulted in an increase in the corrosion potential towards more noble values. The average Ecorr values were—−550 ± 17 mVAg/AgCl and –440 ± 14 mVAg/AgCl, respectively, for the S2-1 and S2-2 samples. In addition to the nobler Ecorr value, the ECAP processed samples were also characterized by a higher value of the polarization resistance Rp and a lower value of the current density icorr. The corrosion current density of the S0 and S2 samples (icorr = 7.3 ± 0.1 µA/cm2, and icorr = 18.5 ± 0.4 µA/cm2, respectively) was higher than the icorr of the two ECAP processed samples (icorr = 0.3 ± 0.05 µA/cm2, and icorr = 0.2 ± 0.04 µA/cm2, respectively), indicating their slower corrosion rates [47] (the resistance to general corrosion increases when icorr decreases and when Ecorr becomes less negative, that is, more noble). Overall, the observed improvement in pitting corrosion resistance can also be related to the porosity reduction. According to the study by Pezzato et al. [48], the presence of the porosity could influence the growth of the oxide layer. Therefore, a progressive reduction in AM defects during ECAP (according to our previous study, the porosity level decreased from 0.25% to 0.04% [34]), resulted in increased corrosion resistance of the samples.
Electrochemical impedance spectroscopy (EIS) was used to further investigate the corrosion process and characterize the electrochemical interface between the electrode and electrolytes. Figure 11 shows the representative Nyquist and Bode plots for the as-built, heat-treated, and ECAP-processed samples. Referring to Figure 11, single distinct capacitive loops in the middle and low frequencies can be distinguished. The registered capacitive arc is related to metal dissolution in the corrosion process, whose diameter is associated with charge transfer resistance, i.e., corrosion resistance. As a result of the Al-based alloy being immersed in an aqueous solution, a passive layer is first formed, which is mainly composed of Al2O3. The density and stability of this passive layer correlate with the corrosion resistance of the Al and Al alloys. The increased diameter of the registered capacitive arc thus corresponds to a greater ability to form a passive layer and thus an increased corrosion resistance. Therefore, the much larger capacitive loop radii registered for the ECAP processed samples indicated their greater surface protection and resistance of the passive layer against Cl [45]. It should be noted that the observed corrosion behaviors of the tested samples were consistent with the anodic polarization results (Figure 10 and Table 4), which confirmed the lower current densities for the S2-1 and S2-2 samples.
Equivalent circuits used for modeling the EIS data are depicted in Figure 12. In these models, Rs represents the ohmic drop in the electrolyte, and Rct, and CPEdl represents the charge–transfer resistance and its corresponding double-layer (dl) constant phase element at the interface of the substrate and the passive layer. Zw is the Warburg impedance, which is related to the diffusion of the reactive species at the electrode surfaces and incorporated with the lowest-frequency Rct and CPEdl parallel elements to characterize the EIS signal. As shown below, only for the S2-2 sample, the Randles equivalent circuit was represented by a single time constant, which indicates the appearance of a single passive layer (Figure 12b).
The mathematical impedance models of both ECMs are presented in Equations (2) and (3). The resistances of the electrolyte solution were comparable for all samples (~4 Ω).
Z = R s + 1 1 R ct + 1 Z +   Y 02 ( j ω ) n 2
Z = R s + 1 1 R ct + Y 02 ( j ω ) n 2
Table 5 shows the fitting parameters obtained from the impedance data for each sample. The charge transfer resistance (Rct) of the S2 sample (0.7 kΩ·cm2) was marginally lower than the S0 sample (0.8 kΩ·cm2). The Rct value increased significantly after the first ECAP pass to 22.4 kΩ·cm2, and then after the second ECAP pressing to 24.9 kΩ·cm2. The lower Rct value indicated that a less stable oxide film formed on the surfaces of the S0 and S2 samples, while the higher Rct value means that a thicker and denser inner oxide layer covered the surfaces of the ECAP processed samples. According to Song et al. [49], crystalline defects, such as grain boundaries, are advantageous to the formation of more stable and intact passive films, thus improving the corrosion resistance of aluminum alloys in chloride-containing solutions [50]. However, the ECAP processing resulted in the formation of a unique microstructure consisting of multiple melt pool boundaries (see microstructure evolution; Figure 4c,d), where, according to this study [51], a thinner passive/oxide layer is formed. This may have suppressed the beneficial effect of grain refinement (second ECAP pressing), resulting in only a minor increase in the Rct value. Referring to the study by Ji et al. [52], the boundary of the melt pool is where the coarse Si-rich phase gathers. This area is wide, and the protective film cannot cover it all, which enhances galvanic corrosion there. Therefore, surfaces that contain multiple melt pool boundaries, which are enriched with coarse Si particles, might undergo more severe galvanic corrosion. Here, despite the absence of the passive layer (in some areas), the reduction in grain size and, consequently, the increased density of the grain boundary density, decreased the overall reactivity of the surface and improved the corrosion performance of the AlSi10Mg alloy [53].

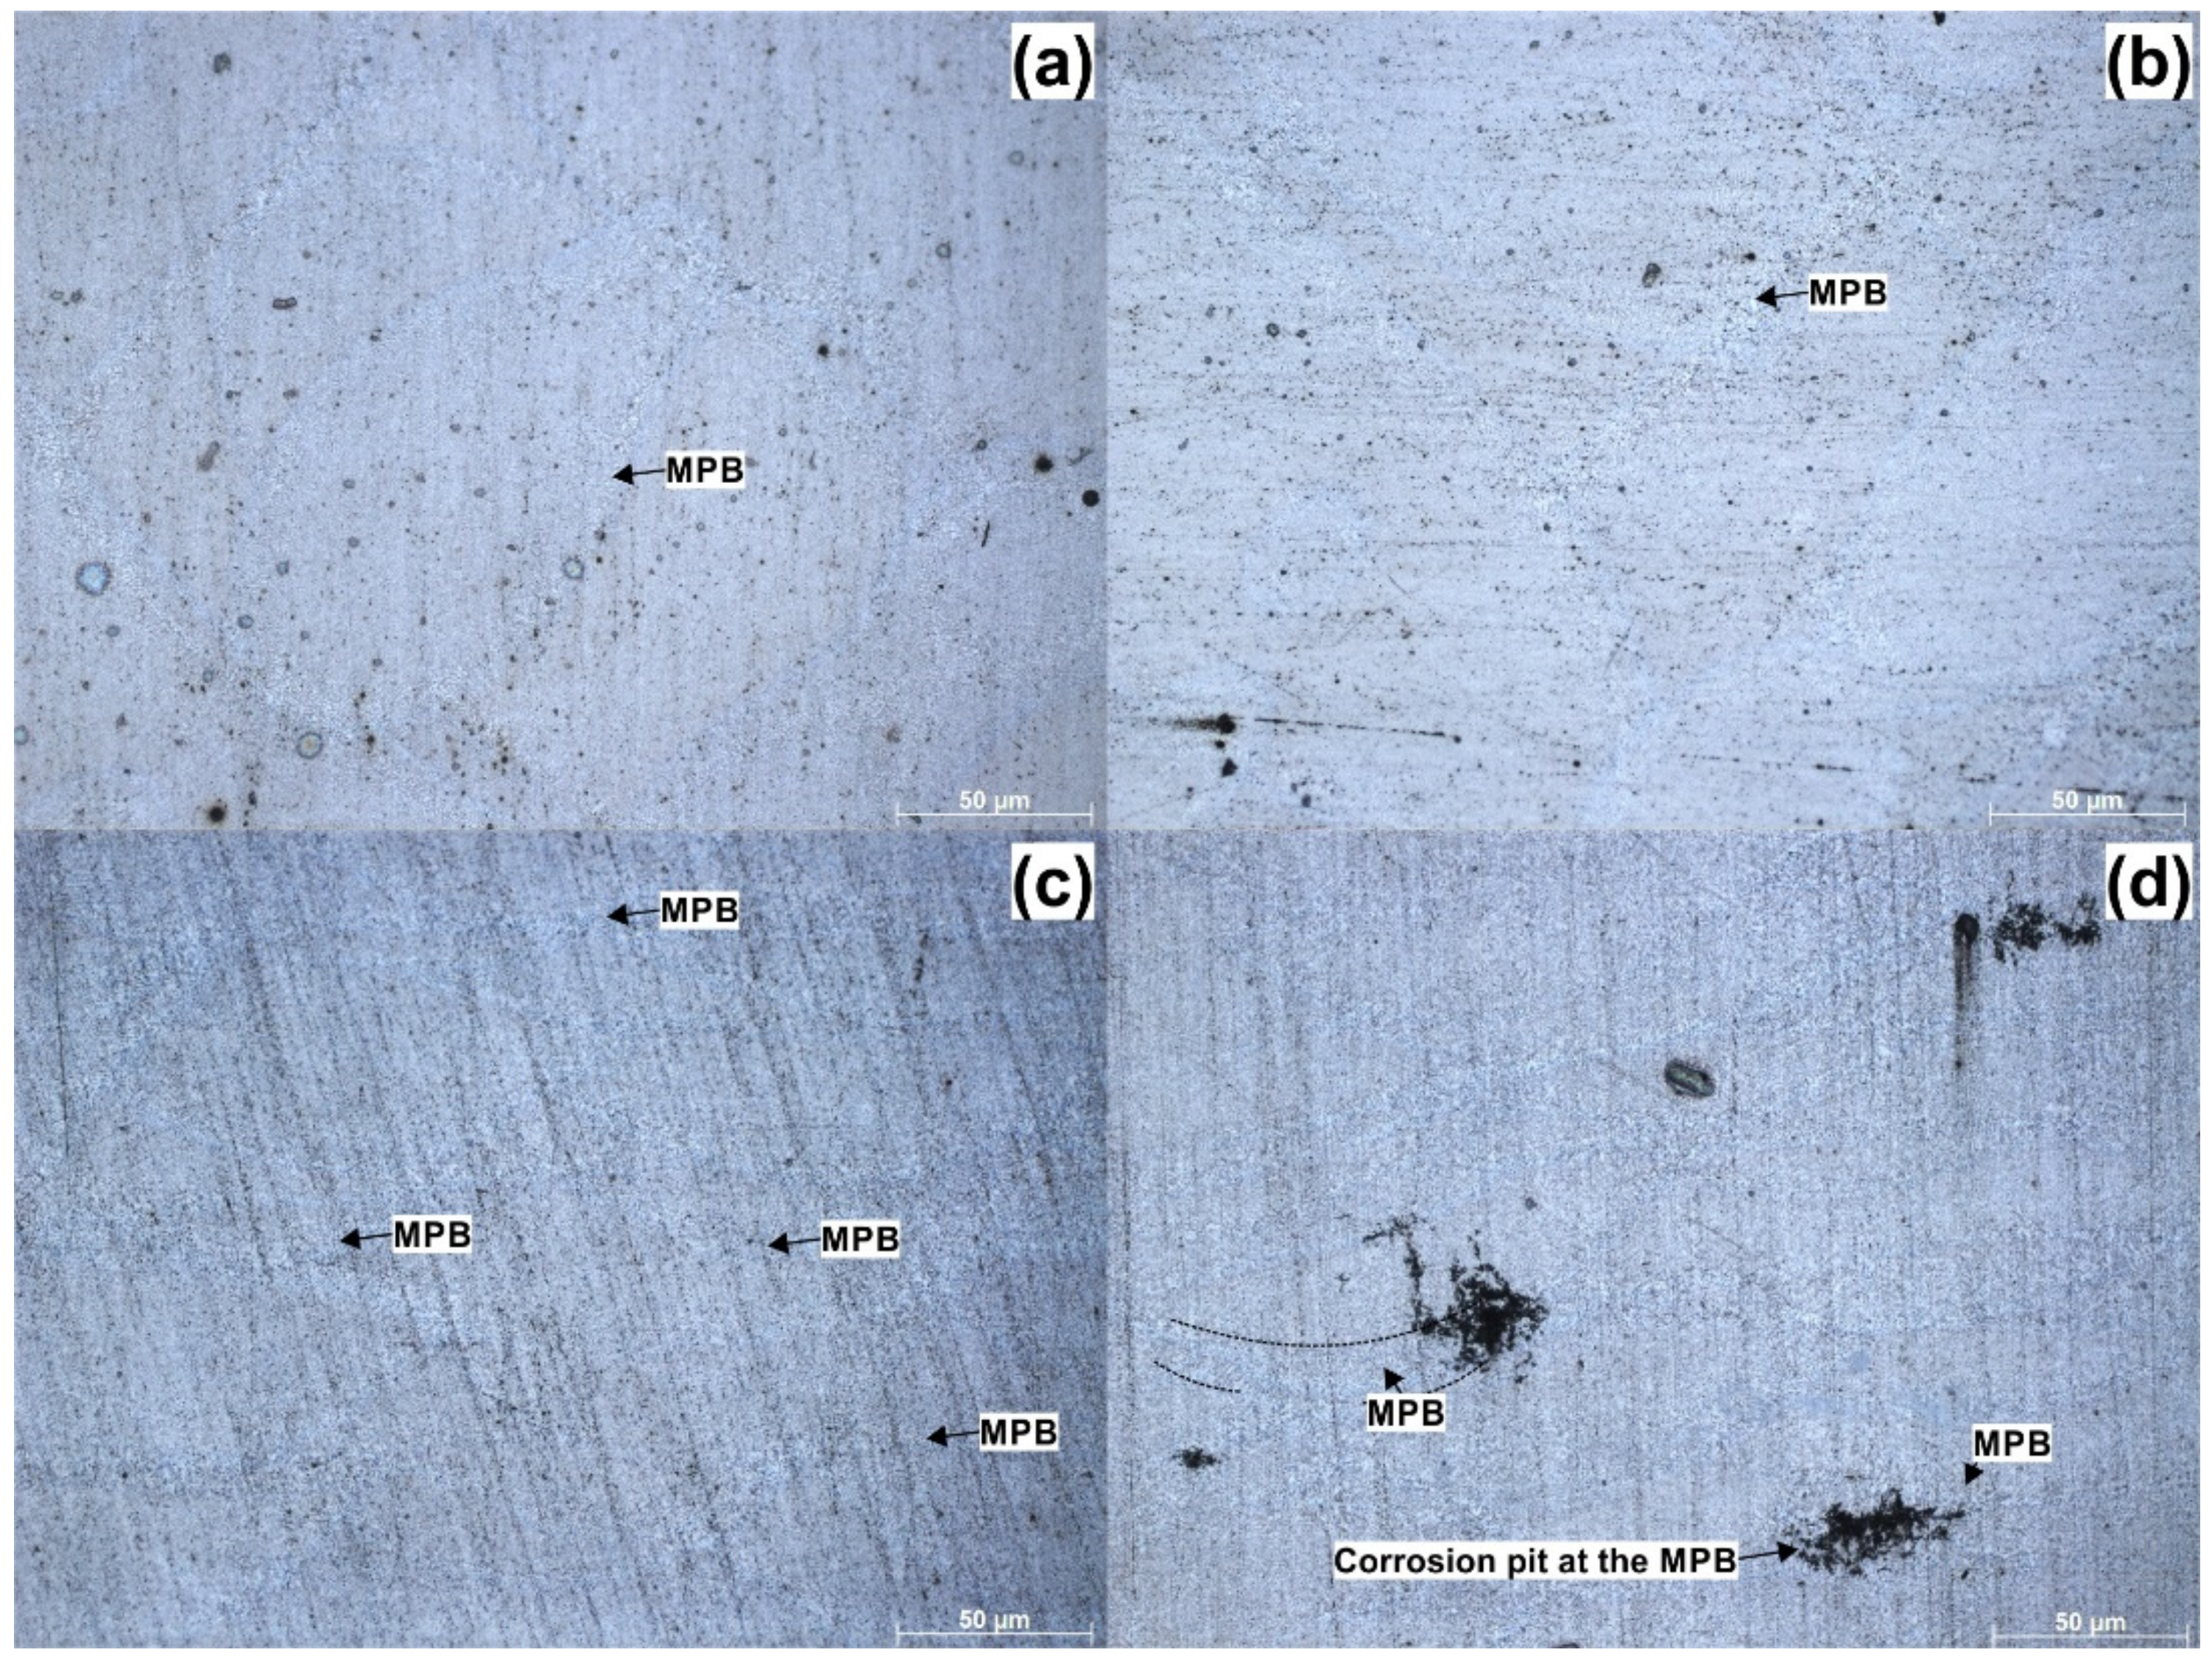
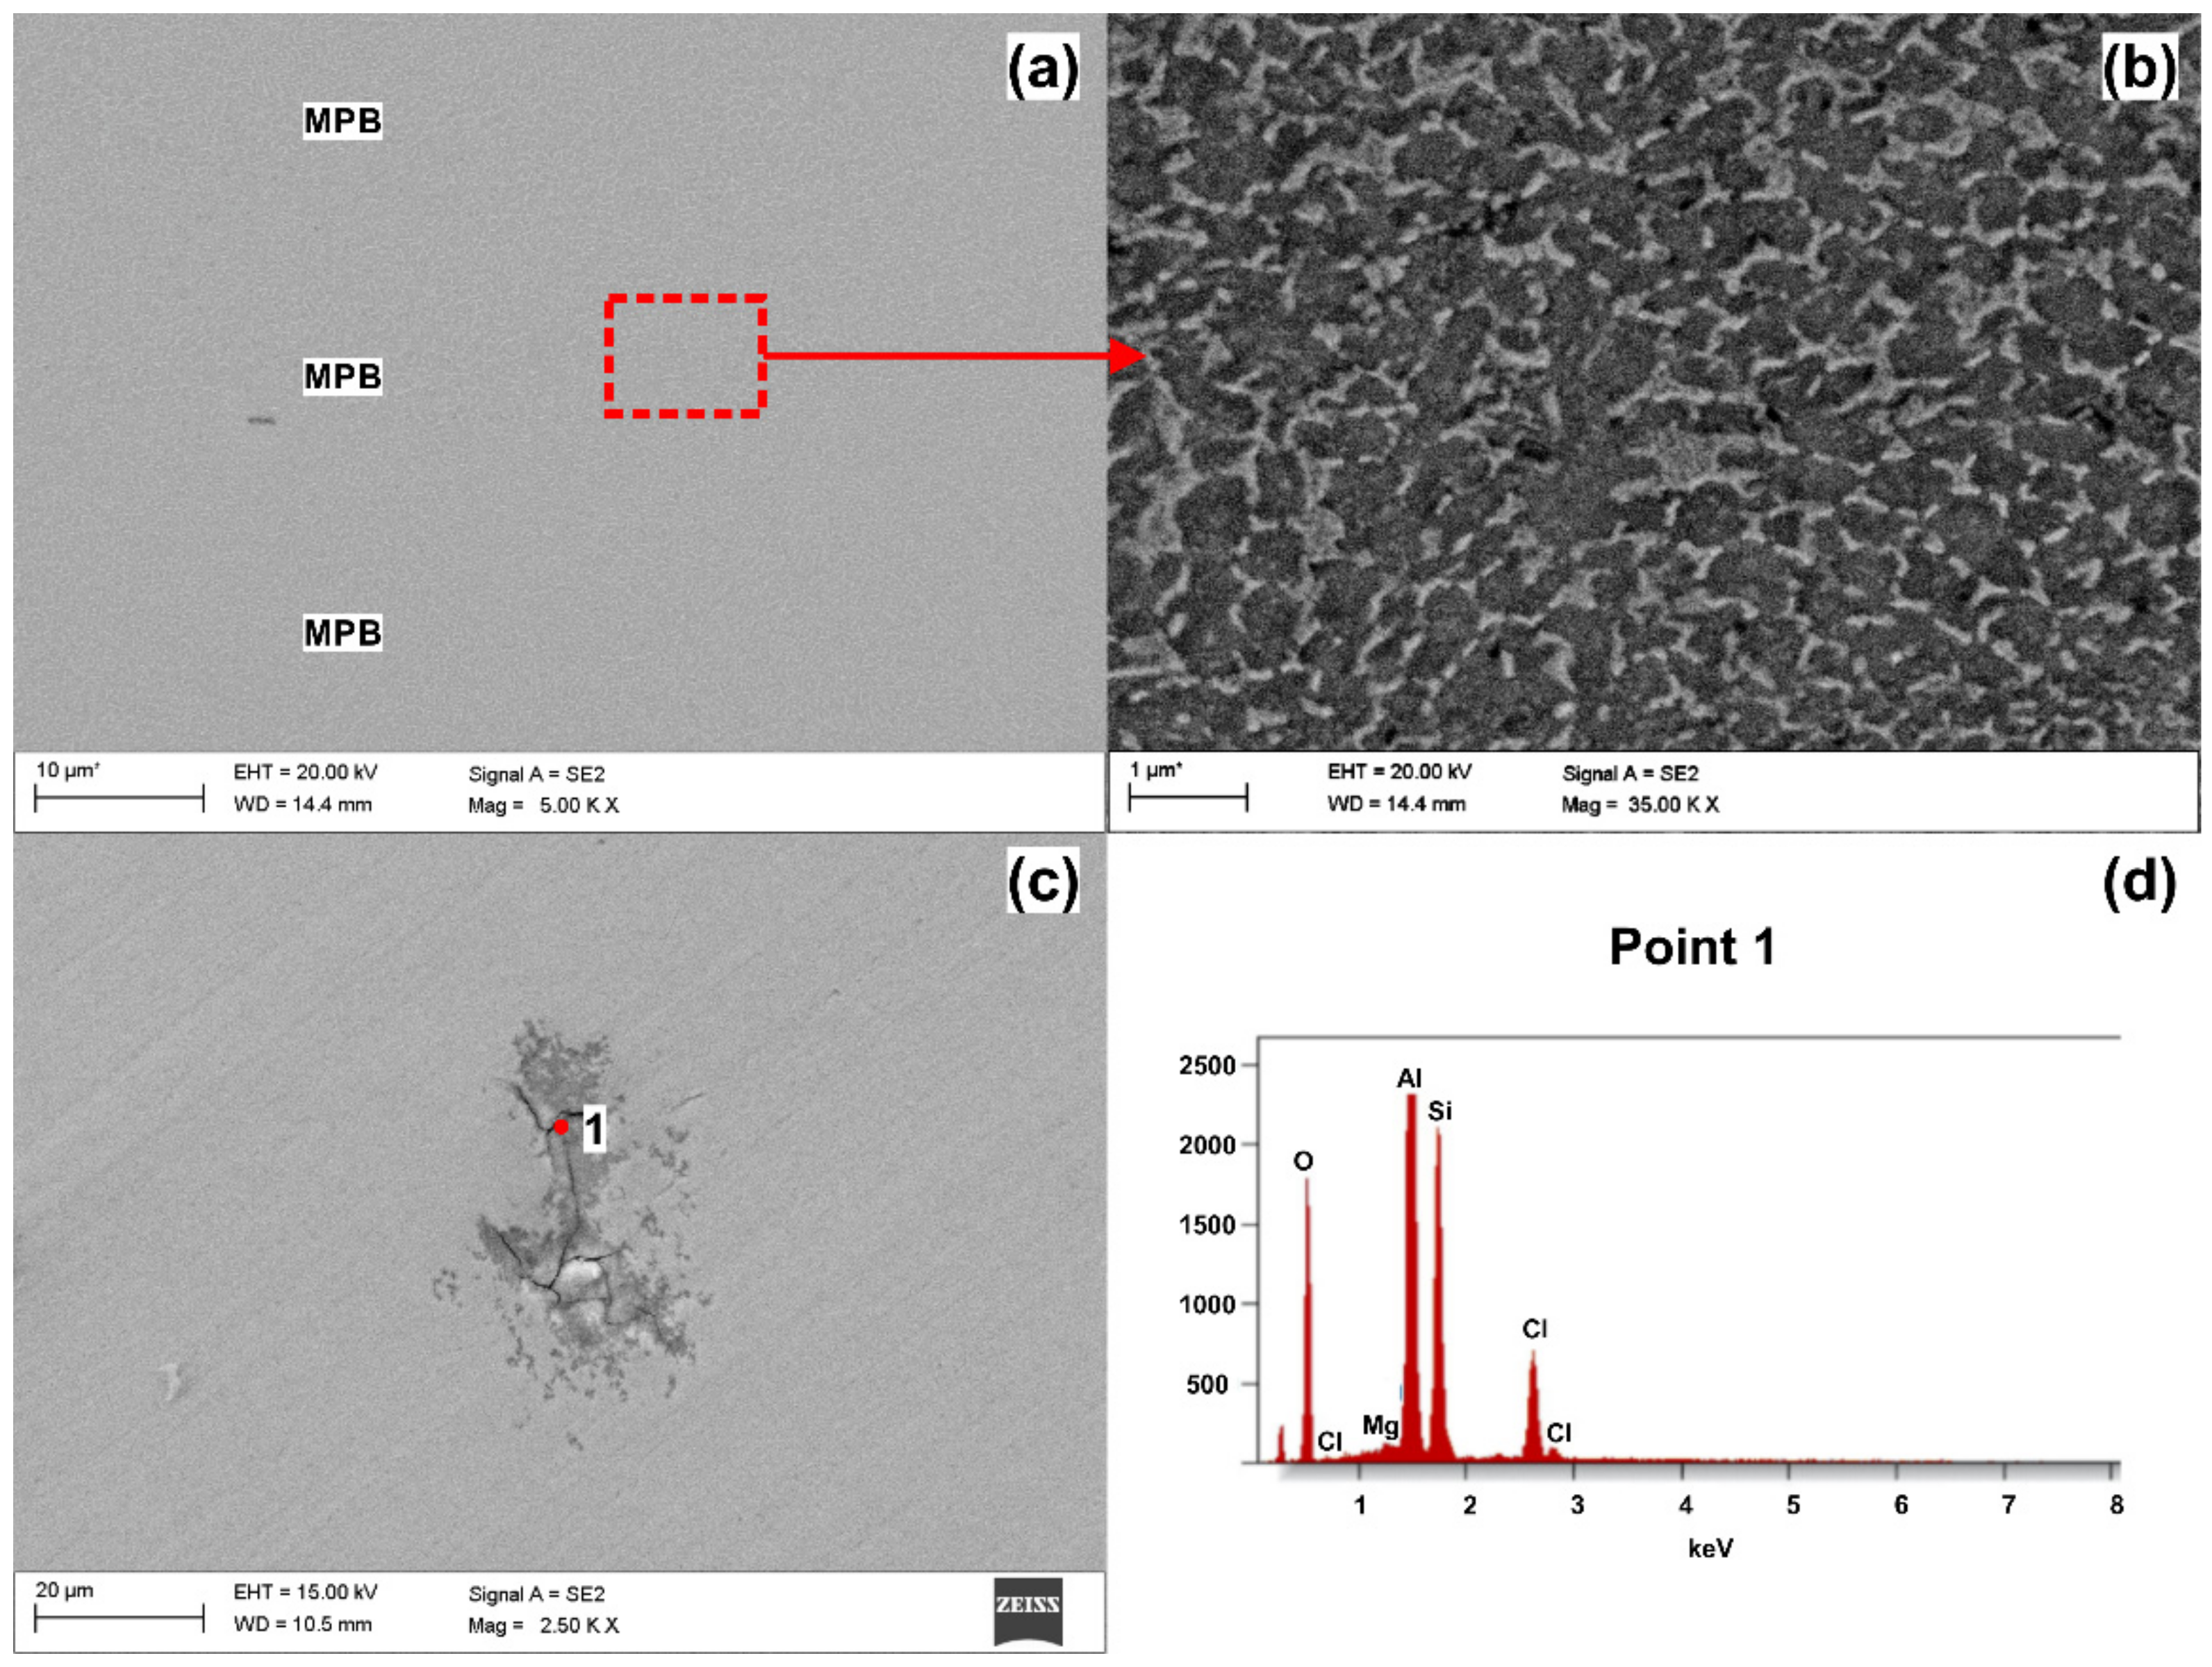
3.3. Corrosion Morphology

Figure 13a,b shows the representative light microscopy images of the corroded surfaces for the S0 and S2 samples. Multiple holes formed as a result of pit development. A qualitative analysis of both surfaces after anodic polarization tests revealed more intensive pitting along the melt pool boundary (MPB), which confirmed previous assumptions that the melt pool boundaries acted as weakened zones during corrosion [54]. The corrosion morphologies of the S0 and S2 samples were very similar, although for the S0 sample, more pits were recorded for the analyzed area.
Figure 13c,d shows significantly different corroded surfaces of samples S2-1 and S2-2, respectively. The surface of S2-1 remained almost unchanged (Figure 13c) with only small corrosion pits, which confirmed the excellent corrosion resistance of S2-1. However, the S2-2 sample surface underwent selective corrosion. As presented in Figure 13d, localized corrosion occurred by selective dissolution of the α-Al phase at the triple junction (near periphery) of the melt pool boundaries. This observation was consistent with reports by Revilla et al. [55] and Cabrini et al. [56]. According to their results, the localized corrosion attack in the SLM AlSi10Mg alloy started along the edge of the MPB in heat-affected zones.
Figure 14 shows secondary electron micrographs of the S2-2 sample before and after corrosion testing. A comparison of these images gave a better understanding of how the evolution of the microstructure (due to ECAP processing) affected the corrosion resistance of the SLM AlSi10Mg alloy. As shown in Figure 14a,b, coarser silicon crystals existed at the melt pool boundaries.
Several references [57,58] indicated that such particles stimulate α-Al corrosion since they produce local galvanic couples. In fact, a higher magnification (Figure 14c) revealed localized corrosion at the interface between the Si/α-Al interface. The results of the SEM/EDX analyses (Figure 14d) confirmed that the corrosion pits were located at the melt pool boundaries, where the coarser Si particles are exposed to the corrosive environment.

4. Conclusions

Corrosion resistance is one of the most important properties of metallic materials. This is because the corrosion of engineered materials represents a huge industrial problem. This causes untold economic losses and catastrophic damage to technical facilities. Corrosion resistance can be modified by modifying the grain size. Consequently, it is not unreasonable to expect surfaces with relatively high grain boundary densities to exhibit electrochemical behavior different from that of coarser grained surfaces with low grain boundary densities.
In this paper, we investigated the effect of ECAP on the microstructure and corrosion properties of the SLM AlSi10Mg aluminum alloy. The corrosion behavior of the as-built and heat-treated samples was compared with those fabricated by the hybrid route that combined selective laser melting, heat treatment, and ECAP processing. The following conclusions can be drawn:
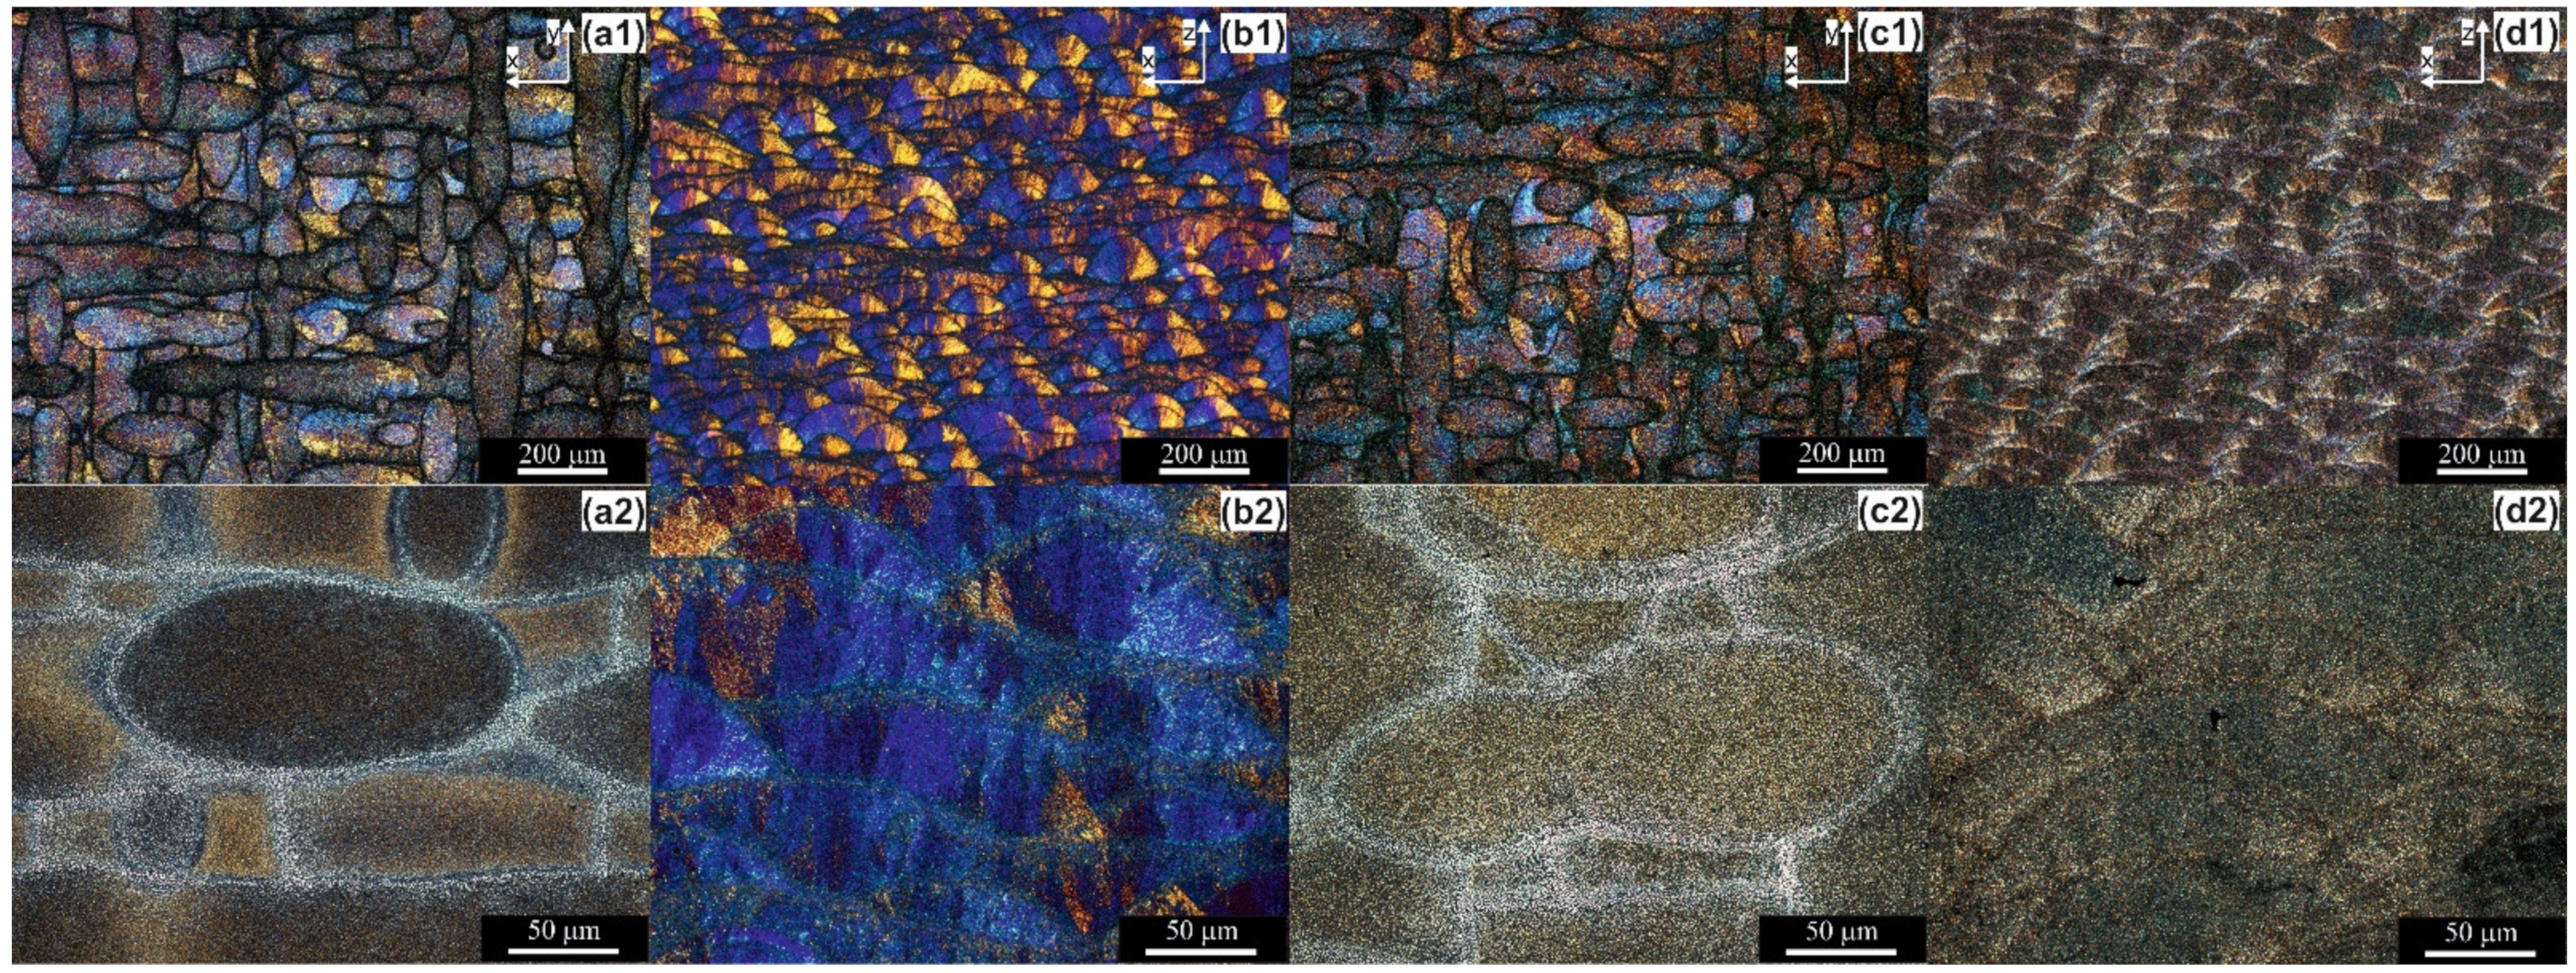
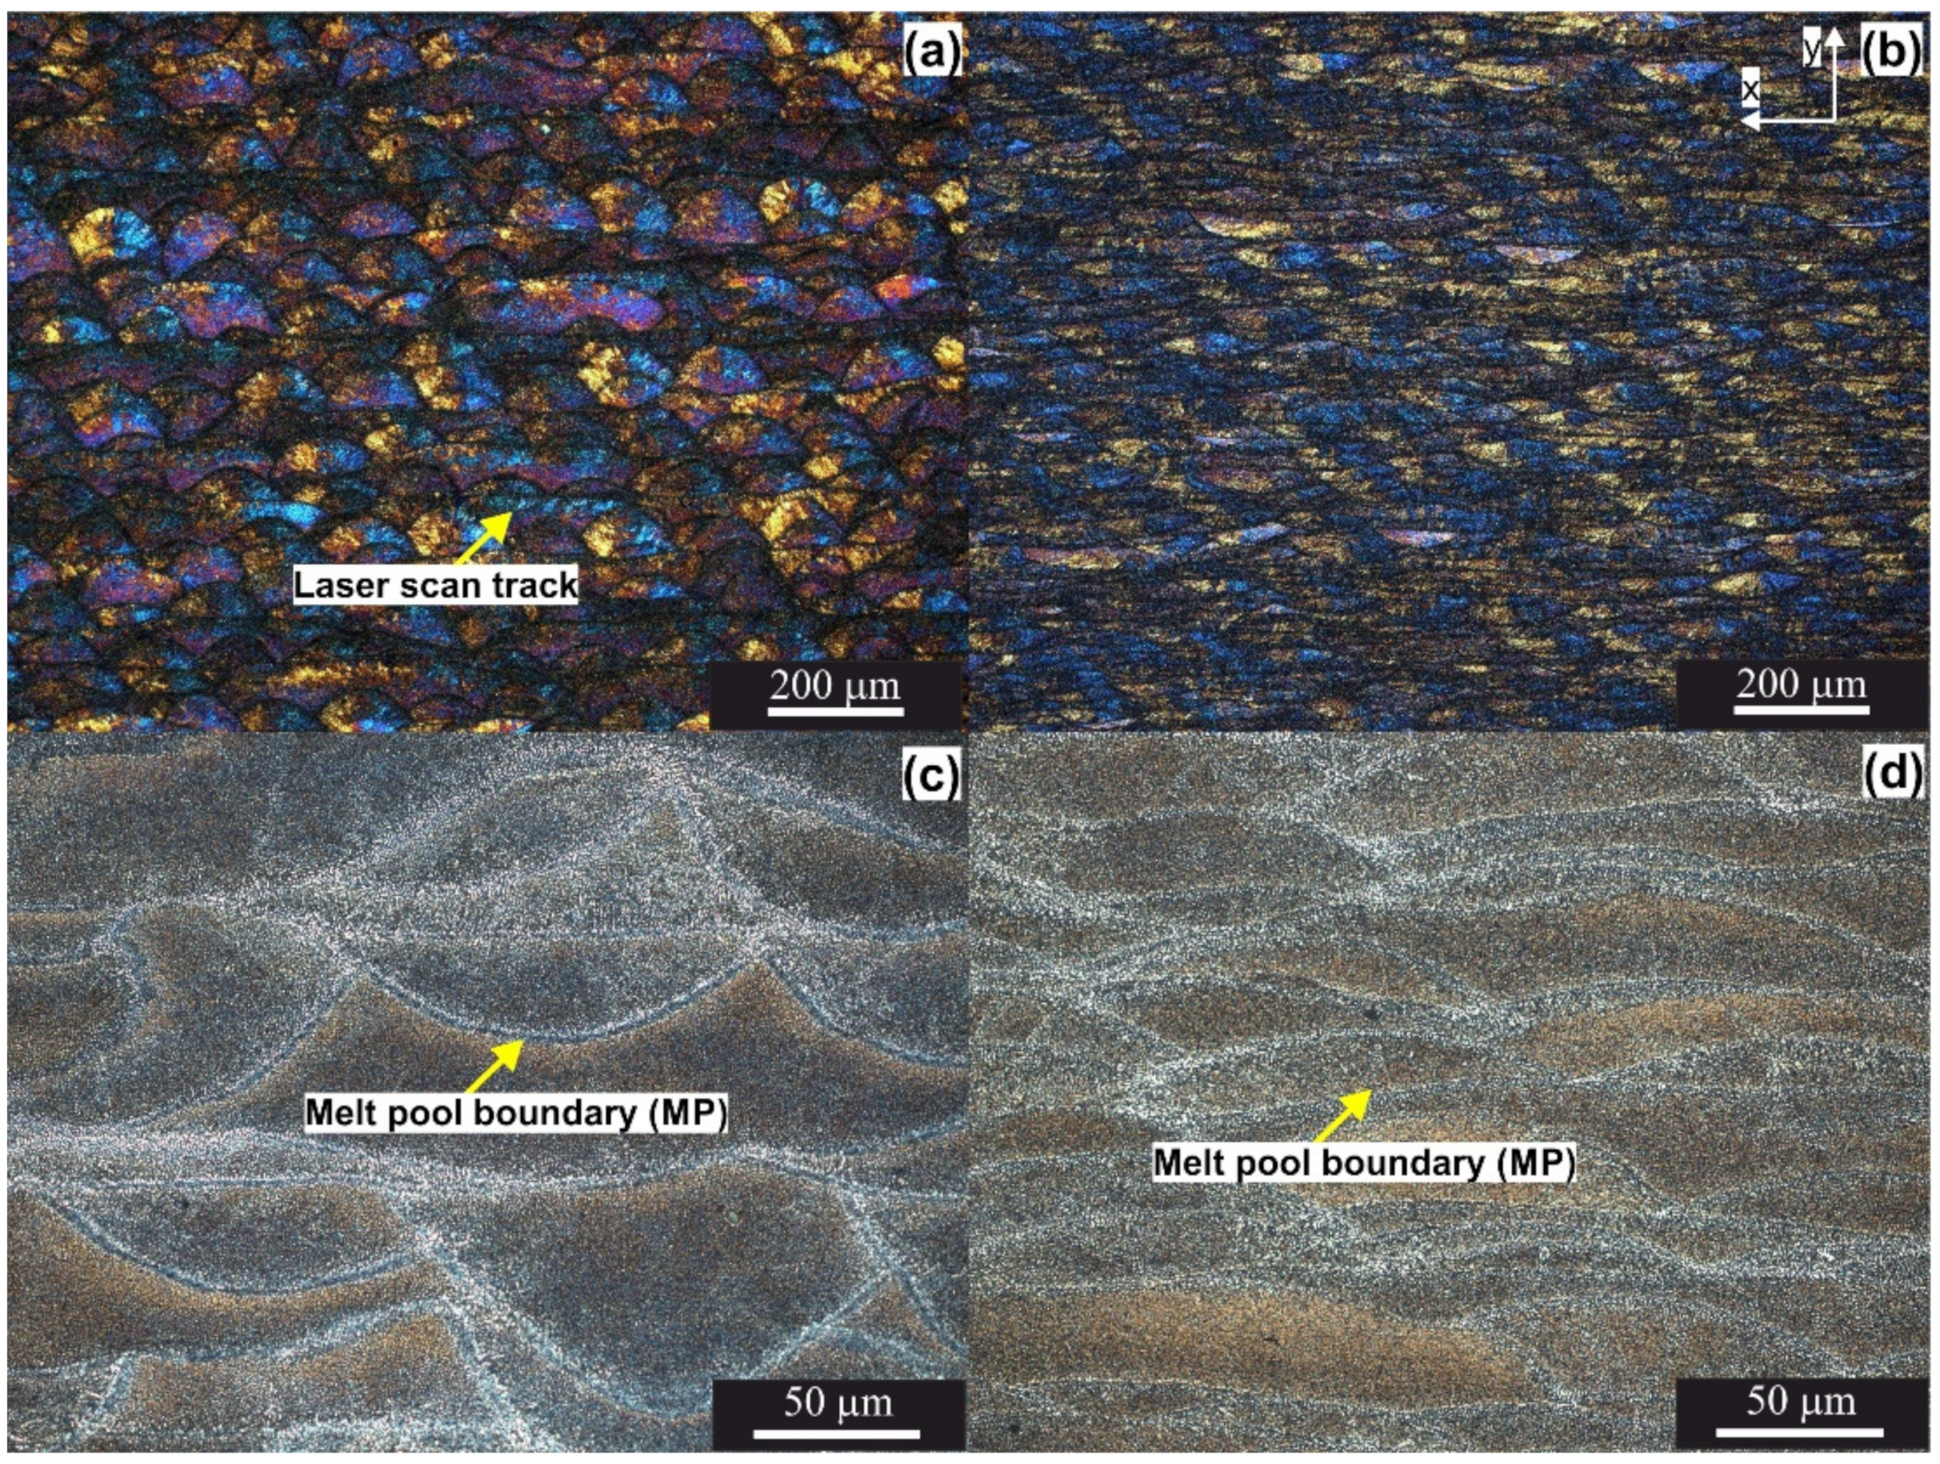
  • The ECAP-induced microstructural modifications promoted the formation of a layered structure that comprised semi-circular patterns and melt pool boundaries, whose fraction increased with additional ECAP pressings.
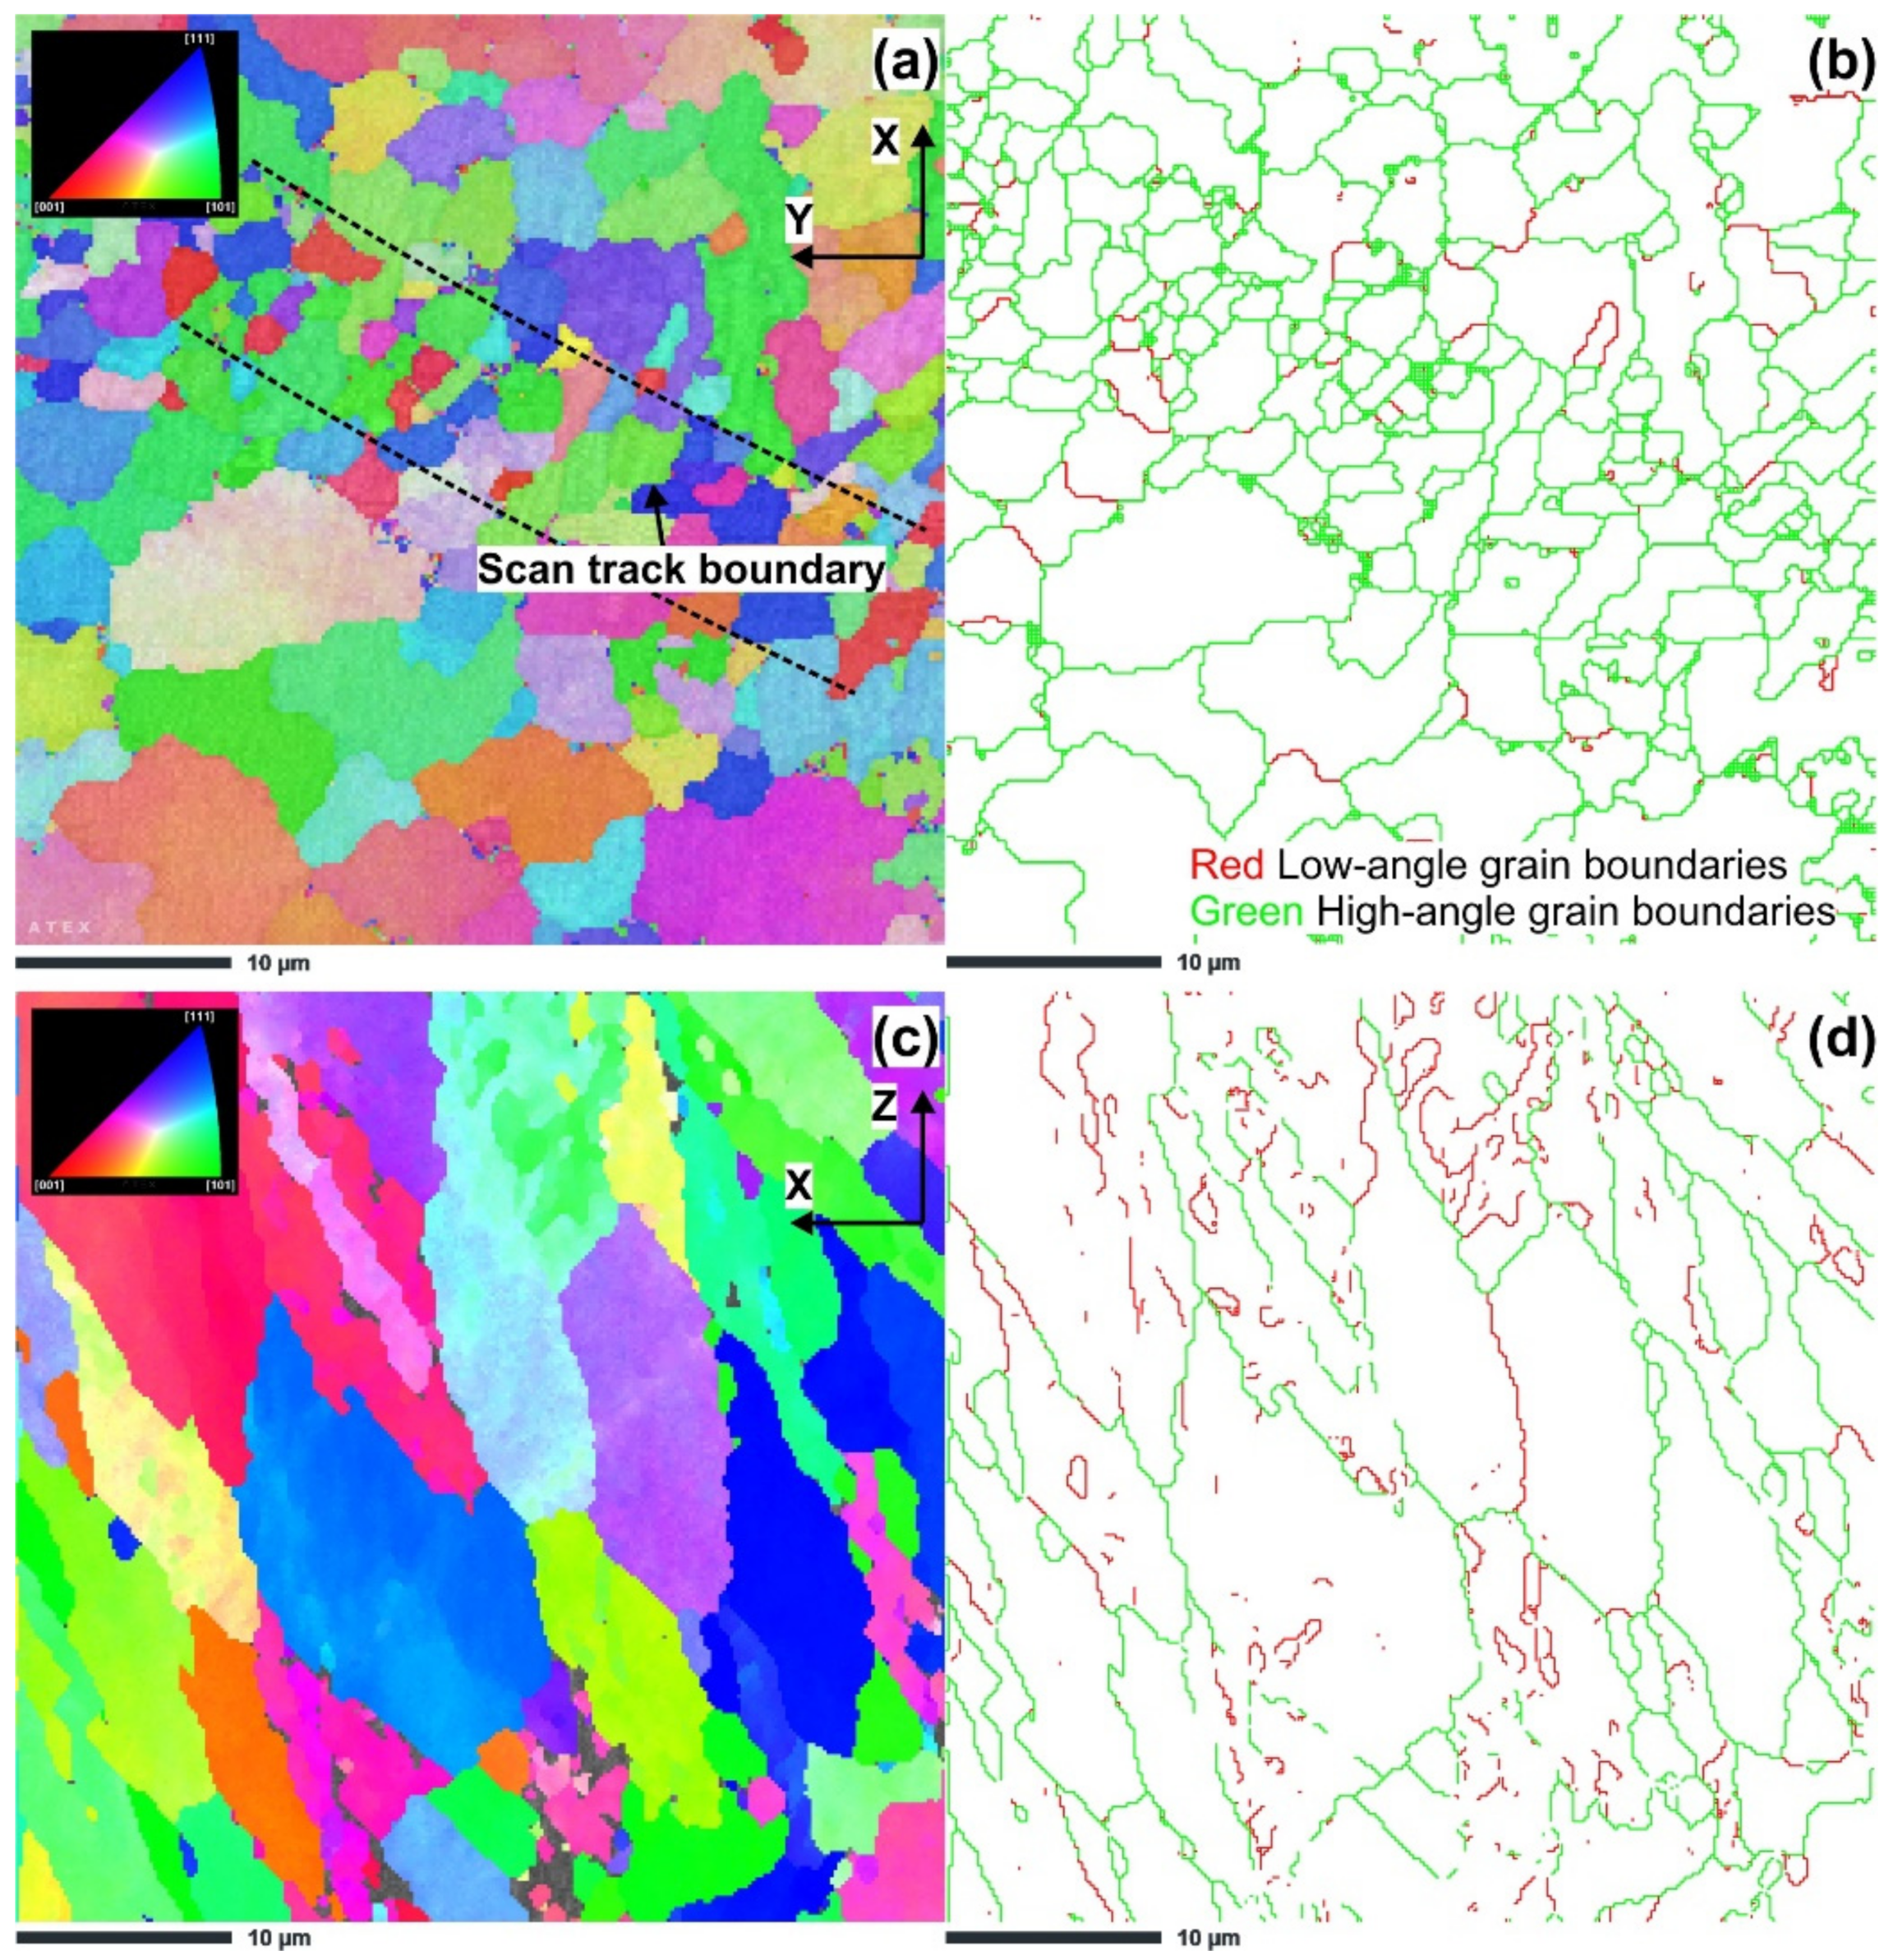
  • The results of the microstructural study via EBSD revealed that ECAP up to two passes led to significant grain size reduction to 1.42 μm after the first pass and 0.24 μm after the second pass.
  • Different corrosion behaviors occurred between the as-built/heat-treated and ECAP processed samples. Potentiodynamic polarization test results revealed the lowest corrosion current density accompanied by higher Rp parameter for ECAP-processed samples, confirming their superior corrosion resistance.
  • Microstructural examination of corroded surfaces revealed differences in corrosion attacks depending on the processing history. The as-built and heat-treated, which had microstructures composed of laser scan tracks, showed almost uniform pitting with the formation of slightly larger pits along the laser scan track boundaries (melt pool boundaries). The samples subjected to ECAP, having a microstructure composed of semi-circular patterns, showed superior corrosion resistance; however, in the sample subjected to two ECAP passes, the melt pool boundaries showed a more deeply penetrating corrosion that preferentially initiated in the areas where multiple melt-pool boundaries overlap. Nevertheless, globally, for ECAP samples, improved corrosion resistance was observed.

Author Contributions

Conceptualization, P.S. and A.W.; methodology, P.S. and A.W.; formal analysis, P.S. and A.W.; investigation, P.S., A.W., O.H., T.T., D.Ł. and K.M.; resources, S.R. and O.H.; data curation, P.S. and A.W.; writing—original draft preparation, P.S. and A.W.; supervision, T.T. and S.R. All authors have read and agreed to the published version of the manuscript.

Funding

This article was completed in association with project Innovative and additive manufacturing technology—new technological solutions for 3D printing of metals and composite materials, reg. no. 319 CZ.02.1.01/0.0/0.0/17_049/0008407 financed by Structural Funds of the European Union.

Institutional Review Board Statement

Not applicable.

Informed Consent Statement

Not applicable.

Data Availability Statement

Data are available from the corresponding author upon request.

Acknowledgments

Przemysław Snopiński is a scholarship holder of the Visegrad International Scholarship Grant for the period September 2021 to July 2022. This work was done in the framework of this scholarship.

Conflicts of Interest

The authors declare no conflict of interest.

References

  1. Zhu, Y.T.; Langdon, T.G. The fundamentals of nanostructured materials processed by severe plastic deformation. JOM 2004, 56, 58–63. [Google Scholar] [CrossRef]
  2. Beura, V.K.; Kale, C.; Srinivasan, S.; Williams, C.L.; Solanki, K.N. Corrosion behavior of a dynamically deformed Al–Mg alloy. Electrochim. Acta 2020, 354, 136695. [Google Scholar] [CrossRef]
  3. Mohd Yusuf, S.; Nie, M.; Chen, Y.; Yang, S.; Gao, N. Microstructure and corrosion performance of 316L stainless steel fabricated by Selective Laser Melting and processed through high-pressure torsion. J. Alloys Compd. 2018, 763, 360–375. [Google Scholar] [CrossRef]
  4. Tański, T.; Snopiński, P.; Pakieła, W.; Borek, W.; Prusik, K.; Rusz, S. Structure and properties of AlMg alloy after combination of ECAP and post-ECAP ageing. Arch. Civ. Mech. Eng. 2016, 16, 325–334. [Google Scholar]
  5. Reza Toroghinejad, M.; Ashrafizadeh, F.; Jamaati, R. On the use of accumulative roll bonding process to develop nanostructured aluminum alloy 5083. Mater. Sci. Eng. A 2013, 561, 145–151. [Google Scholar] [CrossRef]
  6. Beygelzimer, Y.; Varyukhin, V.; Synkov, S.; Orlov, D. Useful properties of twist extrusion. Mater. Sci. Eng. A 2009, 503, 14–17. [Google Scholar] [CrossRef] [Green Version]
  7. Snopiński, P.; Tański, T.; Gołombek, K.; Rusz, S.; Hilser, O.; Donič, T.; Nuckowski, P.M.; Benedyk, M. Strengthening of AA5754 Aluminum Alloy by DRECE Process Followed by Annealing Response Investigation. Materials 2020, 13, 301. [Google Scholar] [CrossRef] [Green Version]
  8. Liu, M.; Zheng, R.; Xiao, W.; Li, J.; Li, G.; Peng, Q.; Ma, C. Bulk nanostructured Al-Si alloy with remarkable improvement in strength and ductility. Scr. Mater. 2021, 201, 113970. [Google Scholar] [CrossRef]
  9. Mungole, T.; Nadammal, N.; Dawra, K.; Kumar, P.; Kawasaki, M.; Langdon, T.G. Evolution of microhardness and microstructure in a cast Al–7% Si alloy during high-pressure torsion. J. Mater. Sci. 2013, 48, 4671–4680. [Google Scholar] [CrossRef]
  10. Moradi, M.; Nili-Ahmadabadi, M.; Heidarian, B. Improvement of mechanical properties of AL (A356) cast alloy processed by ECAP with different heat treatments. Int. J. Mater. Form. 2009, 2, 85. [Google Scholar] [CrossRef]
  11. Song, D.; Wang, G.; Zhou, Z.; Klu, E.E.; Gao, B.; Ma, A.; Wu, Y.; Sun, J.; Jiang, J.; Ma, X. Developing a high-strength Al–11Si alloy with improved ductility by combining ECAP and cryorolling. Mater. Sci. Eng. A 2020, 773, 138880. [Google Scholar] [CrossRef]
  12. Damavandi, E.; Nourouzi, S.; Rabiee, S.M.; Jamaati, R. Effect of ECAP on microstructure and tensile properties of A390 aluminum alloy. Trans. Nonferrous Met. Soc. China 2019, 29, 931–940. [Google Scholar] [CrossRef]
  13. Zhang, Z.; Hosoda, S.; Kim, I.S.; Watanabe, Y. Grain refining performance for Al and Al-Si alloy casts by addition of equal-channel angular pressed Al-5 mass% Ti alloy. Mater. Sci. Eng. A 2006, 425, 55–63. [Google Scholar] [CrossRef]
  14. Ma, A.; Suzuki, K.; Saito, N.; Nishida, Y.; Takagi, M.; Shigematsu, I.; Iwata, H. Impact toughness of an ingot hypereutectic Al-23 mass% Si alloy improved by rotary-die equal-channel angular pressing. Mater. Sci. Eng. A 2005, 399, 181–189. [Google Scholar] [CrossRef]
  15. Jiang, J.; Ma, A.; Song, D.; Yang, D.; Shi, J.; Wang, K.; Zhang, L.; Chen, J. Anticorrosion behavior of ultrafine-grained Al-26 wt% Si alloy fabricated by ECAP. J. Mater. Sci. 2012, 47, 7744–7750. [Google Scholar] [CrossRef]
  16. Gebril, M.A.; Omar, M.Z.; Mohamed, I.F.; Othman, N.K.; Abdelgnei, M.A.H. Corrosion Improvement and Microstructure Evaluation of SEM-Solid A356 Alloy by Ecap Process. J. Phys. Conf. Ser. 2018, 1082, 12110. [Google Scholar] [CrossRef]
  17. Wang, X.; Nie, M.; Wang, C.T.; Wang, S.C.; Gao, N. Microhardness and corrosion properties of hypoeutectic Al-7Si alloy processed by high-pressure torsion. Mater. Des. 2015, 83, 193–202. [Google Scholar] [CrossRef]
  18. Cheng, Y.C.; Lin, C.K.; Tan, A.H.; Lin, J.C.; Lee, S.L. Effect of Spinning Deformation Processing on the Wear and Corrosion Properties of Al-7Si-0.3Mg Alloys. Mater. Manuf. Process. 2010, 25, 689–695. [Google Scholar] [CrossRef]
  19. Li, W.; Li, S.; Liu, J.; Zhang, A.; Zhou, Y.; Wei, Q.; Yan, C.; Shi, Y. Effect of heat treatment on AlSi10Mg alloy fabricated by selective laser melting: Microstructure evolution, mechanical properties and fracture mechanism. Mater. Sci. Eng. A 2016, 663, 116–125. [Google Scholar] [CrossRef]
  20. Rosenthal, I.; Stern, A.; Frage, N. Microstructure and Mechanical Properties of AlSi10Mg Parts Produced by the Laser Beam Additive Manufacturing (AM) Technology. Metallogr. Microstruct. Anal. 2014, 3, 448–453. [Google Scholar] [CrossRef]
  21. Wu, J.; Wang, X.Q.; Wang, W.; Attallah, M.M.; Loretto, M.H. Microstructure and strength of selectively laser melted AlSi10Mg. Acta Mater. 2016, 117, 311–320. [Google Scholar] [CrossRef] [Green Version]
  22. Li, Z.; Li, Z.; Tan, Z.; Xiong, D.B.; Guo, Q. Stress relaxation and the cellular structure-dependence of plastic deformation in additively manufactured AlSi10Mg alloys. Int. J. Plast. 2020, 127, 102640. [Google Scholar] [CrossRef]
  23. Chen, H.; Zhang, C.; Jia, D.; Wellmann, D.; Liu, W. Corrosion Behaviors of Selective Laser Melted Aluminum Alloys: A Review. Metals 2020, 10, 102. [Google Scholar] [CrossRef] [Green Version]
  24. Cabrini, M.; Calignano, F.; Fino, P.; Lorenzi, S.; Lorusso, M.; Manfredi, D.; Testa, C.; Pastore, T. Corrosion behavior of heat-treated AlSi10Mg manufactured by laser powder bed fusion. Materials 2018, 11, 1051. [Google Scholar] [CrossRef] [Green Version]
  25. Zakay, A.; Aghion, E. Effect of Post-heat Treatment on the Corrosion Behavior of AlSi10Mg Alloy Produced by Additive Manufacturing. JOM 2019, 71, 1150–1157. [Google Scholar] [CrossRef]
  26. Santos Macías, J.G.; Zhao, L.; Tingaud, D.; Bacroix, B.; Pyka, G.; van der Rest, C.; Ryelandt, L.; Simar, A. Hot isostatic pressing of laser powder bed fusion AlSi10Mg: Parameter identification and mechanical properties. J. Mater. Sci. 2022. [Google Scholar] [CrossRef]
  27. Maleki, E.; Unal, O.; Bandini, M.; Guagliano, M.; Bagherifard, S. Individual and synergistic effects of thermal and mechanical surface post-treatments on wear and corrosion behavior of laser powder bed fusion AlSi10Mg. J. Mater. Process. Technol. 2022, 302, 117479. [Google Scholar] [CrossRef]
  28. Mohd Yusuf, S.; Chen, Y.; Yang, S.; Gao, N. Microstructural evolution and strengthening of selective laser melted 316L stainless steel processed by high-pressure torsion. Mater. Charact. 2020, 159, 110012. [Google Scholar] [CrossRef]
  29. Finfrock, C.B.; Exil, A.; Carroll, J.D.; Deibler, L. Effect of Hot Isostatic Pressing and Powder Feedstock on Porosity, Microstructure, and Mechanical Properties of Selective Laser Melted AlSi10Mg. Metallogr. Microstruct. Anal. 2018, 7, 443–456. [Google Scholar] [CrossRef] [Green Version]
  30. Geenen, K.; Röttger, A.; Theisen, W. Corrosion behavior of 316L austenitic steel processed by selective laser melting, hot-isostatic pressing, and casting. Mater. Corros. 2017, 68, 764–775. [Google Scholar] [CrossRef]
  31. Lien, H.H.; Mazumder, J.; Wang, J.; Misra, A. Ultrahigh strength and plasticity in laser rapid solidified Al–Si nanoscale eutectics. Mater. Res. Lett. 2020, 8, 291–298. [Google Scholar] [CrossRef]
  32. Kim, D.K.; Hwang, J.H.; Kim, E.Y.; Heo, Y.U.; Woo, W.; Choi, S.H. Evaluation of the stress-strain relationship of constituent phases in AlSi10Mg alloy produced by selective laser melting using crystal plasticity FEM. J. Alloys Compd. 2017, 714, 687–697. [Google Scholar] [CrossRef]
  33. Snopiński, P.; Król, M.; Pagáč, M.; Petrů, J.; Hajnyš, J.; Mikuszewski, T.; Tański, T. Effects of equal channel angular pressing and heat treatments on the microstructures and mechanical properties of selective laser melted and cast AlSi10Mg alloys. Arch. Civ. Mech. Eng. 2021, 21, 92. [Google Scholar] [CrossRef]
  34. Snopiński, P.; Woźniak, A.; Pagáč, M. Microstructural Evolution, Hardness, and Strengthening Mechanisms in SLM AlSi10Mg Alloy Subjected to Equal-Channel Angular Pressing (ECAP). Materials 2021, 14, 7598. [Google Scholar] [CrossRef] [PubMed]
  35. PN-EN ISO 17475:2010; Corrosion of Metal and Alloys—Electrochemical Test Methods—Guidelines for Conducting Potentiostatic and Potentiodynamic, Polarization Measurements. ISO: Geneva, Switzerland, 2010.
  36. Liu, Y.J.; Liu, Z.; Jiang, Y.; Wang, G.W.; Yang, Y.; Zhang, L.C. Gradient in microstructure and mechanical property of selective laser melted AlSi10Mg. J. Alloys Compd. 2018, 735, 1414–1421. [Google Scholar] [CrossRef]
  37. Cheng, W.; Liu, Y.; Xiao, X.; Huang, B.; Zhou, Z.; Liu, X. Microstructure and mechanical properties of a novel (TiB2+TiC)/AlSi10Mg composite prepared by selective laser melting. Mater. Sci. Eng. A 2022, 834, 142435. [Google Scholar] [CrossRef]
  38. Tóth, L.S. Texture Evolution in Severe Plastic Deformation by Equal Channel Angular Extrusion. Adv. Eng. Mater. 2003, 5, 308–316. [Google Scholar] [CrossRef]
  39. Bahshwan, M.; Gee, M.; Nunn, J.; Myant, C.W.; Reddyhoff, T. In situ observation of anisotropic tribological contact evolution in 316L steel formed by selective laser melting. Wear 2022, 490–491, 204193. [Google Scholar] [CrossRef]
  40. Marola, S.; Manfredi, D.; Fiore, G.; Poletti, M.G.; Lombardi, M.; Fino, P.; Battezzati, L. A comparison of Selective Laser Melting with bulk rapid solidification of AlSi10Mg alloy. J. Alloys Compd. 2018, 742, 271–279. [Google Scholar] [CrossRef]
  41. Casati, R.; Coduri, M.; Checchia, S.; Vedani, M. Insight into the effect of different thermal treatment routes on the microstructure of AlSi7Mg produced by laser powder bed fusion. Mater. Charact. 2021, 172, 110881. [Google Scholar] [CrossRef]
  42. Immanuel, R.J.; Panigrahi, S.K. Influence of cryorolling on microstructure and mechanical properties of a cast hypoeutectic Al–Si alloy. Mater. Sci. Eng. A 2015, 640, 424–435. [Google Scholar] [CrossRef]
  43. Zorn, C.; Kaminski, N. Temperature-humidity-bias testing on insulated-gate bipolartransistor modules—Failure modes and acceleration due to high voltage. IET Power Electron. 2015, 8, 2329–2335. [Google Scholar] [CrossRef]
  44. Cabrini, M.; Lorenzi, S.; Testa, C.; Pastore, T.; Manfredi, D.; Lorusso, M.; Calignano, F.; Fino, P. Statistical approach for electrochemical evaluation of the effect of heat treatments on the corrosion resistance of AlSi10Mg alloy by laser powder bed fusion. Electrochim. Acta 2019, 305, 459–466. [Google Scholar] [CrossRef]
  45. Rafieazad, M.; Chatterjee, A.; Nasiri, A.M. Effects of Recycled Powder on Solidification Defects, Microstructure, and Corrosion Properties of DMLS Fabricated AlSi10Mg. JOM 2019, 71, 3241–3252. [Google Scholar] [CrossRef]
  46. Rafieazad, M.; Mohammadi, M.; Nasiri, A.M. On microstructure and early stage corrosion performance of heat treated direct metal laser sintered AlSi10Mg. Addit. Manuf. 2019, 28, 107–119. [Google Scholar] [CrossRef]
  47. Yang, Y.; Chen, Y.; Zhang, J.; Gu, X.; Qin, P.; Dai, N.; Li, X.; Kruth, J.-P.; Zhang, L.-C. Improved corrosion behavior of ultrafine-grained eutectic Al-12Si alloy produced by selective laser melting. Mater. Des. 2018, 146, 239–248. [Google Scholar] [CrossRef]
  48. Pezzato, L.; Dabalà, M.; Gross, S.; Brunelli, K. Effect of microstructure and porosity of AlSi10Mg alloy produced by selective laser melting on the corrosion properties of plasma electrolytic oxidation coatings. Surf. Coat. Technol. 2020, 404, 126477. [Google Scholar] [CrossRef]
  49. Dan, S.; Jiang, J.-h.; Lin, P.-h.; Yang, D.-h. Corrosion behavior of ultra-fine grained industrial pure Al fabricated by ECAP. Trans. Nonferrous Met. Soc. China 2009, 19, 1065–1070. [Google Scholar] [CrossRef]
  50. Song, D.; Ma, A.B.; Jiang, J.H.; Lin, P.H.; Shi, J. Improving corrosion resistance of pure Al through ECAP. Corros. Eng. Sci. Technol. 2011, 46, 505–512. [Google Scholar] [CrossRef]
  51. Revilla, R.I.; Rojas, Y.; De Graeve, I. On the Impact of Si Content and Porosity Artifacts on the Anodizing Behavior of Additive Manufactured Al-Si Alloys. J. Electrochem. Soc. 2019, 166, C530–C537. [Google Scholar] [CrossRef]
  52. Ji, Y.; Dong, C.; Kong, D.; Li, X. Design materials based on simulation results of silicon induced segregation at AlSi10Mg interface fabricated by selective laser melting. J. Mater. Sci. Technol. 2020, 46, 145–155. [Google Scholar] [CrossRef]
  53. Birbilis, N.; Ralston, K.D.; Virtanen, S.; Fraser, H.L.; Davies, C.H.J. Grain character influences on corrosion of ECAPed pure magnesium. Corros. Eng. Sci. Technol. 2010, 45, 224–230. [Google Scholar] [CrossRef]
  54. Zhang, H.; Gu, D.; Dai, D.; Ma, C.; Li, Y.; Cao, M.; Li, S. Influence of heat treatment on corrosion behavior of rare earth element Sc modified Al-Mg alloy processed by selective laser melting. Appl. Surf. Sci. 2020, 509, 145330. [Google Scholar] [CrossRef]
  55. Revilla, R.I.; Liang, J.; Godet, S.; De Graeve, I. Local Corrosion Behavior of Additive Manufactured AlSiMg Alloy Assessed by SEM and SKPFM. J. Electrochem. Soc. 2017, 164, C27. [Google Scholar] [CrossRef]
  56. Cabrini, M.; Lorenzi, S.; Pastore, T.; Pellegrini, S.; Manfredi, D.; Fino, P.; Biamino, S.; Badini, C. Evaluation of corrosion resistance of Al-10Si-Mg alloy obtained by means of Direct Metal Laser Sintering. J. Mater. Process. Technol. 2016, 231, 326–335. [Google Scholar] [CrossRef]
  57. Leon, A.; Aghion, E. Effect of surface roughness on corrosion fatigue performance of AlSi10Mg alloy produced by Selective Laser Melting (SLM). Mater. Charact. 2017, 131, 188–194. [Google Scholar] [CrossRef]
  58. Revilla, R.I.; Verkens, D.; Couturiaux, G.; Malet, L.; Thijs, L.; Godet, S.; De Graeve, I. Galvanostatic Anodizing of Additive Manufactured Al-Si10-Mg Alloy. J. Electrochem. Soc. 2017, 164, C1027. [Google Scholar] [CrossRef]
Figure 1. Schematic illustration of the ECAP die used in this study.
Symmetry 14 00674 g001
Figure 2. Microstructures of the AlSi10Mg alloy; (a1,a2) XY plane and (b1,b2) XZ plane of as-built sample, (c1,c2) XY plane and (d1,d2) XZ plane of heat-treated sample.
Symmetry 14 00674 g002
Figure 3. SEM images of the AlSi10Mg alloy melt pool boundary; (a1,a2) as-built (XY plane), (b1,b2) heat-treated (XY plane), (c1,c2) heat-treated (XZ plane).
Symmetry 14 00674 g003
Figure 4. Microstructure of the AlSi10Mg alloy (a,c) heat-treated + 1 ECAP pass, (b,d) heat-treated + 2 ECAP passes.
Symmetry 14 00674 g004
Figure 5. EBSD IPF-Z image and grain boundary orientation maps of AlSi10Mg alloy in heat-treated condition (a,b) XY plane, (c,d) XZ plane.
Symmetry 14 00674 g005
Figure 6. EBSD IPF-Z image and grain boundary orientation maps of AlSi10Mg alloy (a,b) heat-treated + 1 ECAP pass, (c,d) heat-treated + 2 ECAP passes, the color code representing the crystal orientation.
Symmetry 14 00674 g006
Figure 7. (111) pole figures of AlSi10Mg alloy (a) heat-treated XY plane, (b) heat-treated XZ plane, (c) heat-treated + 1 ECAP pass, (d) heat-treated + 2 ECAP passes.
Symmetry 14 00674 g007
Figure 8. XRD diffraction pattern of the AlSi10Mg alloy in different investigated conditions.
Symmetry 14 00674 g008
Figure 9. Open circuit potential curves of the tested samples.
Symmetry 14 00674 g009
Figure 10. Potentiodynamic polarization curves of all tested samples.
Symmetry 14 00674 g010
Figure 11. Nyquist (a) and Bode plots (be) of analyzed samples.
Symmetry 14 00674 g011
Figure 12. Schematic illustration and simplified equivalent circuit proposed for the corrosion mechanism of the samples in a 3.5 wt % NaCl solution: (a) S0, S2, and S2-1; (b) S2-2.
Symmetry 14 00674 g012
Figure 13. Corrosion morphologies of the (a) as-built, (b) heat-treated, (c) heat-treated + 1 ECAP pass, (d) heat-treated + 2 ECAP passes.
Symmetry 14 00674 g013
Figure 14. SEM images of the S2-2 sample, (a,b) before corrosion testing, (c) corrosion morphology, (d) corresponding EDS spectra from image (c).
Symmetry 14 00674 g014
Table 1. Elemental composition of the AlSi10Mg alloy, wt %.
SiMgFeTiZnMnNiCoAl
9–110.25–0.45<0.25<0.15<0.10<0.10<0.05<0.05Balance
Table 2. Labels used for respective sample conditions with details on the applied procedure.
LabelConditionHeat Treatment/ECAP Procedure
S0As-builtnone
S2Heat-treatedAnnealing at 300 °C for 8 min
S2-1Heat-treated and ECAP processedAnnealing at 300 °C for 8 min + 1 ECAP pass
S2-2Heat-treated and ECAP processedAnnealing at 300 °C for 8 min + 2 ECAP passes
Table 3. Summary of microstructural characteristics for investigated samples.
SampleAverage Grain Size, [µm]Fraction of Low-Angle Grain
Boundaries, %
Fraction of High-Angle Grain Boundaries, %
S2 (XY plane)3.248.4591.55
S2 (XZ plane)10.1126.7174.29
S2-11.4229.2470.76
S2-20.2519.3280.68
Table 4. Summarized results of pitting corrosion test.
SampleEcorr, [mV]icorr, [µA/cm2]Rp, [kΩ∙cm2]
S0−663 ± 117.3 ± 0.11.1 ± 0.1
S2−693 ± 2118.5 ± 0.40.9 ± 0.1
S2-1−550 ± 170.3 ± 0.0560.6 ± 2
S2-2−440 ± 140.2 ± 0.0475.5 ± 4
Table 5. Results of the fitting experimental data coming from EIS tests.
SampleRs, [Ω]Rct, [kΩ·cm2]CPEdl, [mV]Zw
Y, [Ω·cm−ms−n]n2
S040.83.6 × 10−60.8428
S240.74.2 × 10−6110
S2-1422.49.2× 10−50.8075
S2-2424.99.7 × 10−50.84-
Publisher’s Note: MDPI stays neutral with regard to jurisdictional claims in published maps and institutional affiliations.

