Abstract
The exponential growth in transmission of multimedia over the Internet and unsecured channels of communications is putting pressure on scientists and engineers to develop effective and efficient security schemes. In this paper, an image encryption scheme is proposed to help solve such a problem. The proposed scheme is implemented over three stages. The first stage makes use of Rule 30 cellular automata to generate the first encryption key. The second stage utilizes a well-tested S-box, whose design involves a transformation, modular inverses, and permutation. Finally, the third stage employs a solution of the Lorenz system to generate the second encryption key. The aggregate effect of this 3-stage process insures the application of Shannon’s confusion and diffusion properties of a cryptographic system and enhances the security and robustness of the resulting encrypted images. Specifically, the use of the PRNG bitstreams from both of the cellular automata and the Lorenz system, as keys, combined with the S-box, results in the needed non-linearity and complexity inherent in well-encrypted images, which is sufficient to frustrate attackers. Performance evaluation is carried out with statistical and sensitivity analyses, to check for and demonstrate the security and robustness of the proposed scheme. On testing the resulting encrypted Lena image, the proposed scheme results in an MSE value of 8923.03, a PSNR value of 8.625 dB, an information entropy of 7.999, NPCR value of 99.627, and UACI value of 33.46. The proposed scheme is shown to encrypt images at an average rate of 0.61 Mbps. A comparative study with counterpart image encryption schemes from the literature is also presented to showcase the superior performance of the proposed scheme.
1. Introduction
The unprecedented developments and complexity witnessed in today’s wireless communication networks and big data applications render security as an issue of paramount importance [1,2,3]. Data security, through cryptography and steganography [4,5,6,7,8,9], has thus become a vital means to ensure safe and secure operation and usage of millions of online applications [10]. Cryptography, being the core technology in information security, has attracted the attention of scientists and engineers, with investments in its research and developments skyrocketing in recent decades [11,12]. Although modern cryptographic algorithms employ block ciphers such as the data encryption standard (DES), the triple DES (3DES), and the advanced encryption standard (AES), they are not best-suited for the purposes of encrypting images. This is because images hold very large amounts of data [13]. Thus, global efforts in recent years were directed to design and build cryptosystems that are lightweight and better-suited to efficiently carry out image encryption. Outcomes of such efforts have usually involved the use of one or more pseudo random number generators (PRNGs) as well as true RNGs. The literature includes examples pooling from chaos theory [14], cellular automata (CA) [15], electrical circuits [16] and electronics [17], quantum physics [18], as well as many others. The next few paragraphs emphasize the importance of CA and chaos theory in security applications, as well as their utilization in state-of-the-art image encryption schemes. Next, substitution boxes (S-boxes) are discussed as a powerful tool to introduce confusion in a cryptosystem.
Cellular automata are systems of dynamical nature that are discrete both in space and time. A cellular automaton comprises an array of cells. Each such cell can take on a value from a finite number of possibilities, updated synchronously in discrete steps of time, based on an interaction rule. As many cryptographic algorithms are based on RNGs, CA seems to be a great fit, as they can be utilized as RNGs with multiple advantages. Those include algorithmic simplicity and the ease of hardware implementation [19]. One of the earliest uses of CA in cryptography was proposed by Wolfram in [20]. Soon enough, scientists and engineers adopted the idea of CA as encryption devices and started utilizing them as well. Most notably is the work of Nandi et al. [21], where a number of block and stream ciphers were proposed. These were based on CA built around Rule 51, Rule 90, Rule 150, Rule 153, and Rule 195. Achieved numerical results clearly showcase that the use of CA provides good defense against various attacks. Furthermore, the authors of [21] also proposed logic diagrams for VLSI implementations of such CA based encryption hardware. A more recent work entailing the use of Rule 30 is [22], where the authors contend that because randomly generated numbers from Rule 30 are tested for significant randomness, it can be applied in visual cryptography schemes with much success. In [23], the authors propose an image encryption algorithm that utilizes a memrestive hyperchaotic system, CA, and DNA sequence operations. Furthermore, they make use of SHA-256 in their key generation. The authors of [24] adopted a non-uniform CA framework to circumvent the problem of the limited number of CA reversal rules and the inability to generate long state sequences by some of them. In [25], the authors present an image encryption scheme built on a quantum logistic map, CA, and an RSA-based key generation. The authors of [26] employ a multi-delay Chebyshev map, along with CA and DNA coding for the purposes of image encryption. The work proposed by [27] also employs chaos theory in addition to CA, as well as adopts SHA-2. To date, the amount of literature making use of CA in cryptography is rather limited, especially when compared to its equivalent amount that extends ideas from chaotic and dynamical systems for the same purposes of security.
The inherent characteristics of chaotic functions as a random phenomenon in nonlinear systems prove advantageous in relation to cryptography [14], specifically, their high sensitivity to initial conditions, control parameters, periodicity, pseudo-randomness, and ergodicity [28]. These characteristics are made use of in designing image encryption schemes. Such schemes are classified into two categories: (a) one-dimensional (1D) and (b) multi-dimensional (MD). Although image encryption schemes that are based on 1D chaotic maps are less complex and more efficient for software and hardware implementations, they exhibit less desirable characteristics, in terms of shorter chaotic periods, non-uniform distribution of their chaotic output, and a higher vulnerability to cryptanalysis. In contrast, MD chaotic maps when employed in image encryption schemes provide higher security levels at the expense of a higher complexity and, thus, more running time for software and hardware implementations [29]. The literature on the use of 1D and MD for image encryption is extensive. For example, the authors of [30] propose a grayscale image encryption algorithm based on pixel shuffling through the Arnold map, followed by the use of a key that is generated through the 2D logistic sine map and a linear congruential generator. The authors of [31] utilized a finite field in order to generalize the logistic map and attempt to find an automorphic mapping between two logistic maps to compute parameters over the finite field . In [32], the authors employ a coupling of the 2D logistic map and a quantum chaotic map through the nearest-neighboring coupled-map matrices. Their proposed scheme makes use of the resulting higher complexity randomness to generate an encrypted image. The authors of [33] propose a symmetric cryptosystem for color images. Their proposed algorithm employs a hybrid form of the Lorenz system to achieve diffusion and DNA sequencing to achieve confusion. In [34], the authors make use of a Lorenz–Rossler chaotic system to carry out pixel diffusion, whereas 2D logistic maps are employed for confusion. The authors of [35] propose a color image encryption scheme that utilizes multiple chaotic maps with a minimum number of rounds of encryption. Their proposed scheme makes full use of the ideas of Shannon with regards to confusion and diffusion. A rather thorough numerical analysis was carried out by the authors of [36], who proposed a scheme based on an LA-semi group for confusion, whereas a chaotic continuous system was adopted for diffusion. In [37], the authors base their proposed image encryption scheme on three stages: A diffusion stage that utilizes a chaotic quantum logistic function, a scrambling stage for the pixel arrangement, which employs a 2D chaotic map, and then coupling the results of the first two stages with a nearest-neighbor coupled-map lattices. The authors of [38] propose an efficient image encryption scheme that is based on hyper-chaos and a vector operation. Their proposed scheme makes use of a post-processing method that creates a key matrix. The use of this key matrix results in an acute reduction in the number of required iterations of the utilized hyperchaotic system. In [39], a color image encryption scheme that involves the use of chaos theory and a zigzag transform is proposed. The authors employ the zigzag transform in conjunction with an arrangement that changes in a bidirectional crossover manner to carry out the first stage of image encryption. This is followed by the use of a logistic map and a hyperchaotic Chen dynamical system. This paragraph only touches upon the topic of employing chaos theory in image encryption applications. Recent literature on the topic is quite expansive. The next paragraph focuses on a different but rather important building block of many image encryption schemes: substitution boxes.
An S-box is a vital component in modern block encryption algorithms. It aids in generating an apparent ciphertext from any given plaintext. The simple act of adding an S-box to an encryption algorithm results in a non-linear mapping between the input and output data, thus providing the confusion property [40]. The higher the extent of confusion, the better the security offered by an S-box in a block cipher. In turn, for many block encryption algorithms, their robustness against attacks is directly related to the security provided through the utilization of one or more S-boxes. Although such algorithms could comprise multiple components, an S-box is usually the sole non-linear component that enhances sensitive data security [41,42]. State-of-the-art symmetric ciphers usually employ S-boxes that introduce a high level of confusion for attackers [13,43,44,45,46]. However, designing an S-box should be an efficient and low-complexity process in order for it to be suitable for real-time data encryption algorithms. For example, the generation of S-boxes through the employment of a linear fractional transformation (LFT) makes use of the Galois field. LFT, otherwise known as the Möbius transformation, is repeatedly mentioned in the literature for the design of S-boxes [47,48].
While recent literature on image encryption schemes proposes a multitude of algorithms that make use of chaos theory, very little research utilizes CA. Furthermore, the combined utilization of chaos theory and CA for image encryption is very limited in the literature. Schemes that do propose such combinations either suffer from low key spaces or lengthy encryption times, deeming them less than optimal for modern-day real-time image encryption applications. In this paper, the authors identify this as a research gap and attempt to fill it, by proposing a novel color image encryption scheme that combines ideas from chaos theory and CA. Furthermore, the proposed scheme possesses a large key space, yet exhibits a very small encryption time. The contributions of this paper are as follows. A lightweight color image encryption scheme is proposed. The proposed scheme is based on three stages. The first stage incorporates the use of Rule 30 CA, the second stage utilizes a robust S-box, and the third stage employs a solution of the Lorenz system. The proposed image encryption scheme makes use of the ideas of confusion and diffusion proposed by Shannon [49]. Performance analysis is carried out and compared against recent counterpart image encryption schemes from the literature. The computed numerical results are remarkable in terms of robustness and resistance to statistical and differential attacks. The proposed scheme is also shown to pass the NIST suite of tests. Finally, its suitability for real-time applications is evaluated, given its large key space and short running time. This paper is organized as follows. Section 2 introduces some preliminary ideas that are employed in the proposed scheme. Those include Rule 30 of CA, followed by the adopted S-box and the Lorenz system. Section 3 describes the methodology of the proposed image encryption scheme. Section 4 presents the numerical results of the computations and performance evaluation and provides appropriate commentary on them. Section 5 draws the conclusions of the paper, identifies a limitation, and suggests future work that could be further pursued.
2. Preliminary for the Proposed Image Encryption Scheme
The proposed image encryption scheme is composed of three stages. The first stage involves the use of Rule 30 cellular automaton to generate the first encryption key. The second stage makes use of an S-box. Finally, the third stage employs a solution of the Lorenz system to generate a second encryption key. The next sections introduce each of those concepts.
2.1. Rule 30 Cellular Automaton
A simple 2D cellular automaton is basically a 2D array with each cell taking 1 of 2 values, in this case, a 0 (white) or a 1 (black), plotted on an infinite sheet of graph paper, with a set of rules defining how the next cells would take on values. The neighborhood of a cell is defined in one of the two following ways: (1) The von Neumann neighborhood, and (2) The Moore neighborhood [50]. Figure 1 shows each of the neighborhoods of the center cell in each of the cellular automata. However, for the purposes of the image encryption scheme proposed in this paper, we are only interested in the simplest nontrivial cellular automaton with a cell’s neighborhood defined as the adjacent cells on either side of it. Thus, for any any given cell, along with its two neighbors, it would form a neighborhood of three cells, resulting in possible patterns. Rule 30 cellular automaton exhibits a class 3 behavior. This means that simple input patterns lead to chaotic and rather random outputs. Mathematically, Rule 30 gives the next state of any given cell as
where ⊕ and + on the RHS of (1) are the “xor” and “or” Boolean operators, respectively.
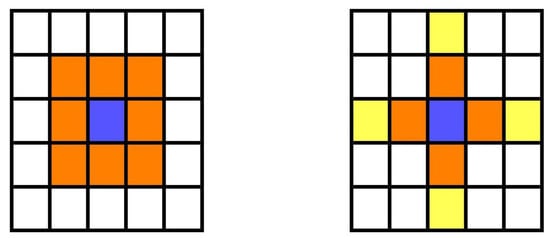
Figure 1.
The orange cells are the Moore neighborhood for the violet cell (left). The orange cells are the von Neumann neighborhood for the violet cell. The range-2 cross neighborhood includes the yellow cells also (right).
Figure 2 shows the utilization of the pattern shown in Figure 3 and expressed mathematically in (1) to generate the first 10 steps of the Rule 30 cellular automaton. Starting with the top row, there is only a single black cell, having a value of 1. This means that both of its adjacent neighbors are white cells, having a value of 0. Referring back to Figure 3, the sixth square depicts the current situation and shows a next cell that is also black, having a value of 1. Repeated utilization of the pattern in Figure 3 results in the generation of Figure 2 for 10 steps and Figure 4 for 100 steps. It was suggested in [15] that Rule 30 cellular automaton can be considered as a PRNG, as the center column satisfies the characteristics of a randomly generated bitstream. For example, examining the center column of Figure 2 reveals that the resulting bitstream is . Based on the work of Wolfram in [20], this fact was first utilized in [51] for the introduction of a block cipher for use in public-key cryptography. This is because given the rule, it is a straight forward process to compute future states; however, it is rather complex to compute previous ones.
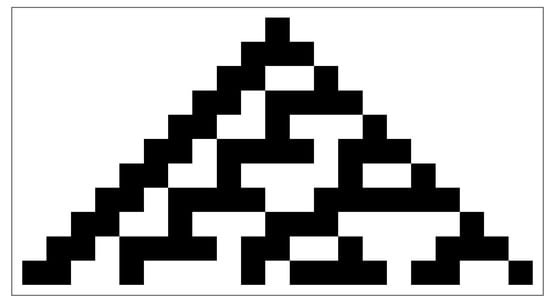
Figure 2.
The first 10 steps of Rule 30 cellular automaton.
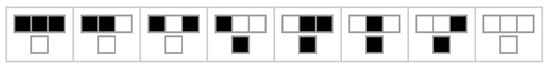
Figure 3.
Current pattern and new state for center cell of a Rule 30 cellular automaton.
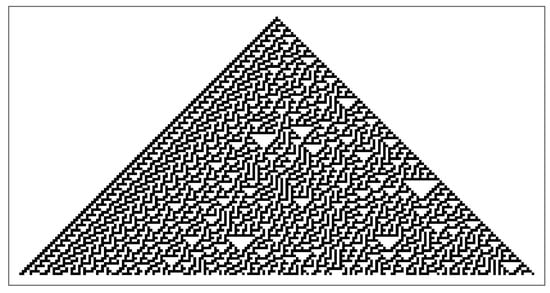
Figure 4.
The first 100 steps of Rule 30 cellular automaton.
2.2. S-Box
With the security and robustness of block ciphers being heavily dependent on the cryptographic abilities of the utilized S-boxes to introduce adequate confusion effects, it becomes clear that the choice of an S-box should be of prime importance when attempting to design a robust and secure image encryption scheme. The authors of [43] also realize the importance of how S-boxes introduce non-linearity and complexity into a cryptosystem and thus propose a novel method for the construction of S-boxes. In their paper, they propose a modular approach that comprises three operations: a transformation, modular inverses, and a permutation. Following their approach, highly non-linear S-boxes can be efficiently generated, each through a simple change in the initial transformation parameters. In their paper, the authors of [43] subject one such example constructed S-box to a number of performance evaluation benchmarks. Those include testing for high non-linearity, absence of fixed points, possession of SAC and BIC characteristics, as well as low differential uniformity and linear approximation probability. Table 1 provides an example of an S-box generated using the ideas proposed in [43], which we employ in our proposed image encryption scheme.

Table 1.
Example S-box values as constructed from the proposed method in [43].
2.3. The Lorenz System
A mathematical model for atmospheric convection was developed in 1963 by Edward Lorenz [52]. This model consists of three ordinary differential equations, now known as the Lorenz system. These differential equations are expressed as
where , and are system parameters proportional to the Prandtl number, the Rayleigh number, and specific physical dimensions of the layer itself, respectively [53]. For the values , and , the system exhibits a chaotic behavior and its solution would be plotted as in Figure 5. This renders the Lorenz system to be a non-linear, non-periodic, 3D, and deterministic one. From a cryptographic point of view, the ability to generate a chaotic solution in a deterministic manner is highly appreciated [14], which is why we adopt it as part of our proposed image encryption scheme.
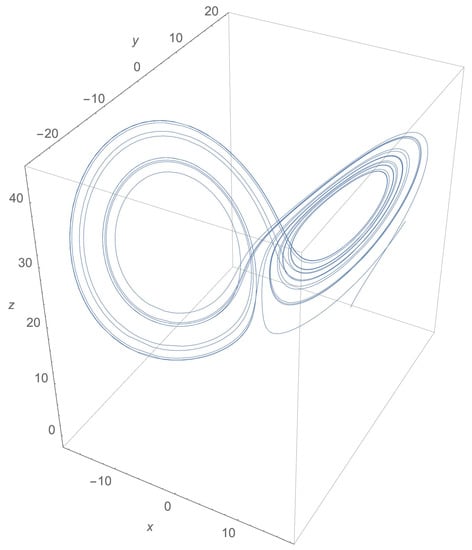
Figure 5.
The butterfly shape of a Lorenz system solution for the values , and .
3. Methodology of the Proposed RGB Image Encryption through Cellular Automata, S-Box and the Lorenz System
3.1. The Encryption Scheme
The proposed image encryption scheme is implemented in a number of steps, as follows.
- An image of appropriate dimensions is chosen and its pixels are converted into a 1D bitstream, d.
- The mean intensity of the image pixels, , is calculated aswhere is the intensity of pixel i. The resulting value is a rather small number, which we multiply by a magnifying factor . Let us denote the resulting value by :
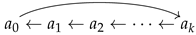
- Cyclically shifting each of the elements of d to the right by places:
- XORing the resulting bitstream, now denoted , with the first encryption key, , as follows:where is a bitstream of the same length as d and , which is made up of a repetition of the first bits resulting from the center column of the Rule 30 CA as in Figure 6. This concludes the first stage of encryption.
- The output bitstream from the XORing process, , enters a substitution process using the proposed S-box, which is constructed employing the ideas proposed in [43]. Let us denote the resulting bitstream as :This concludes the second stage of encryption.
- The Lorenz system is numerically solved, resulting in a 3D geometry, as depicted in Figure 5. Take the , and z coordinates of each of the points of the resulting solution and flatten them into a single 1D array, L, as follows:Next, we list plot those values into 2D, as shown in Figure 7. Examining the plot in Figure 7, it is clear that there are more positive values than there are negative ones. Therefore, we choose a threshold value , such that if any of the values are above this threshold, they would be accounted as 1s, otherwise, they would be accounted as 0 s, as follows:This newly obtained bitstream, v, of length would make up the seed of our Lorenz system based key, as in Figure 8.
- Repeat those bits until they are of the same length as d and , thus forming the second encryption key. Let us denote it , and XOR it with , obtaining as follows:This concludes the third stage of encryption.
- is reshaped back into an image of the same dimensions () as those of the plain image, obtaining the encrypted image.
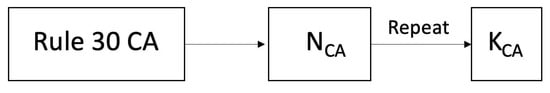
Figure 6.
Flow chart of PRNG of Rule 30 CA, employed in the generation of the first key, .
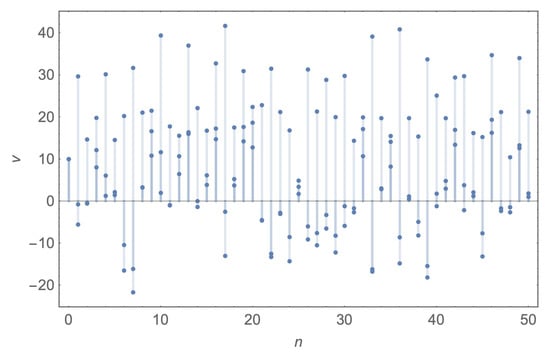
Figure 7.
The first 50 points from the 2D array obtained from the 3D coordinates of the Lorenz system solution for the values , and .
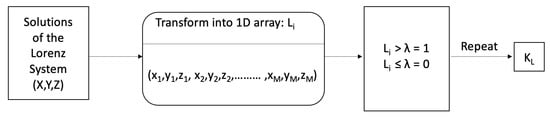
Figure 8.
Flow chart of PRNG of chaotic sequences from the Lorenz system, employed in the generation of the second key, .
Figure 9 provides a graphical illustration of the proposed image encryption scheme, and Figure 6 and Figure 8 showcase the flow charts for the Rule 30 CA and the Lorenz system keys generation, respectively.
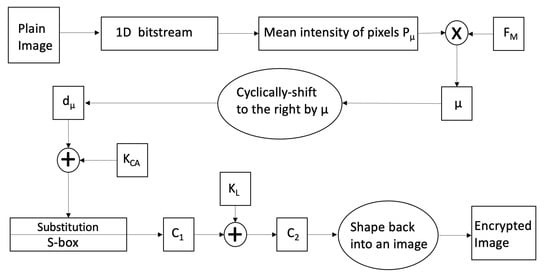
Figure 9.
Flow chart of the encryption scheme.
3.2. The Decryption Scheme
The decryption scheme is implemented in a reverse manner as to that of the encryption scheme, in a number of steps as follows.
- Grouping the bits of the encrypted image of dimensions () into a 1D bitstream, .
- XORing with the second encryption key, , as follows:This concludes the first stage of decryption.
- Applying an inverse substitution step on , utilizing our generated S-box, as follows:This concludes the second stage of decryption.
- Obtaining by XORing with the first encryption key, , as follows:This concludes the third stage of decryption.
- Cyclically shifting each of the bits of in the opposite direction to that used in the encryption, i.e., to the left, by the value of , resulting in a bitstream d
- Folding back the resulting bitstream, d, into an image of the same dimensions () as those of the encrypted image, obtaining the plain image.
Figure 10 provides a graphical illustration of the proposed image decryption scheme.
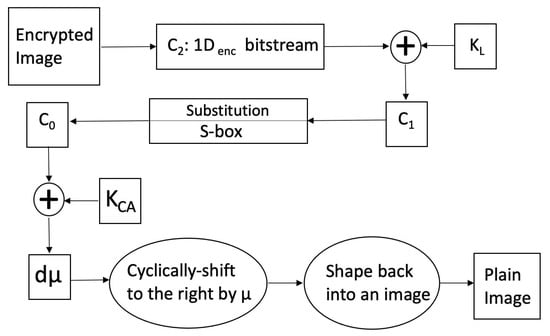
Figure 10.
Flow chart of the decryption scheme.
4. Security Analysis and Numerical Results
The performance of an encryption algorithm is measured by its ability to resist statistical and differential attacks. Thus, this section outlines the numerical results of the proposed image encryption scheme, as well a comparison with its counterpart schemes from the literature. The proposed scheme is implemented using the computer algebra system Wolfram Mathematica® on a machine running macOS Catalina v10.15.7, equipped with a 2.9 GHz 6-Core Intel® CoreTM i9 processor and 32 GB of 2400 MHz DDR4 of memory. The utilized keys are assigned the following values: , and . Three images that are commonly used in image processing applications and experimentation are utilized in this section. These are Lena, Peppers, and Baboon, all of dimensions . The proposed image encryption scheme is tested against various statistical and differential attacks. Those include visual and histogram analyses, a correlation coefficient analysis, mean square error (MSE), mean absolute error (MAE), peak signal to noise ratio (PSNR), information entropy, a differential attack analysis, comprising the number of pixel changing rate (NPCR) and the unified average change intensity (UACI), a key space analysis, a NIST analysis, and, finally, an execution time analysis.
4.1. Visual and Histogram Analyses
The various sub-figures of Figure 11, Figure 12 and Figure 13 depict plain and encrypted images of Lena, Peppers, and Baboon, respectively. It is clear that the human visual system (HVS) does not allow for any meaningful information to be discerned from the encrypted images.
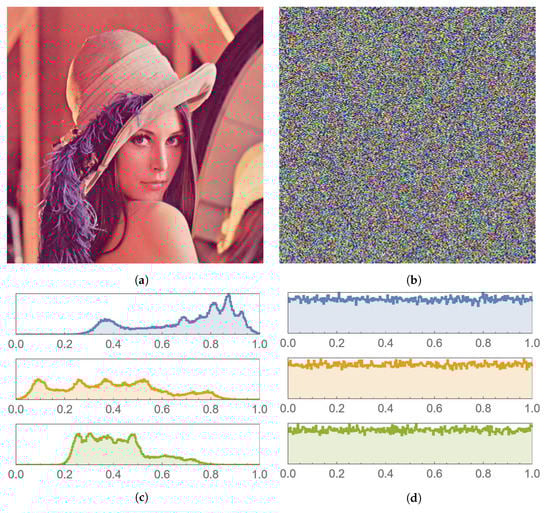
Figure 11.
Lena image and histogram comparison before and after encryption. (a) Plain image. (b) Encrypted image. (c) Histogram of the plain image. (d) Histogram of the encrypted image.
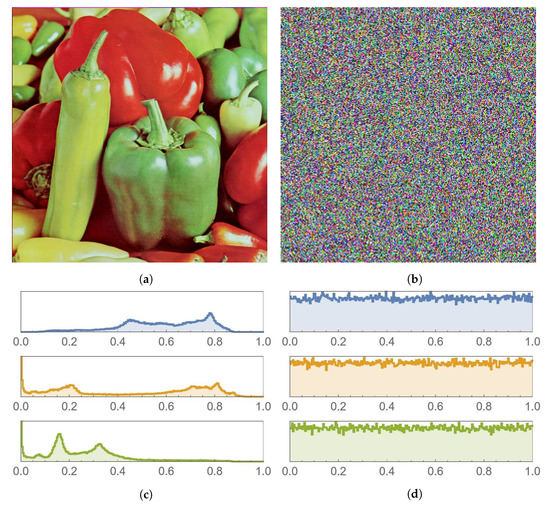
Figure 12.
Peppers image and histogram comparison before and after encryption. (a) Plain image. (b) Encrypted image. (c) Histogram of the plain image. (d) Histogram of the encrypted image.
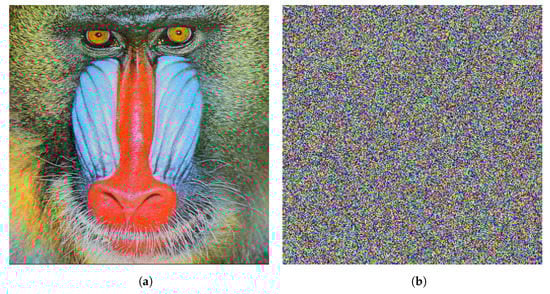
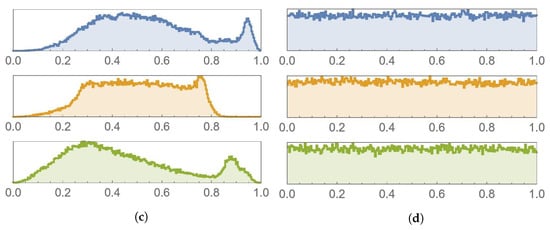
Figure 13.
Baboon image and histogram comparison before and after encryption. (a) Plain image. (b) Encrypted image. (c) Histogram of the plain image. (d) Histogram of the encrypted image.
A histogram of an image shows the frequency distribution of its pixels. In order to have a strong encryption scheme, the histogram of an encrypted image must be uniform. This is because a uniform histogram distribution shows that the probability of each of the gray levels of the image is almost the same, thus rendering the image more resistant against statistical attacks. The histograms shown in Figure 11, Figure 12 and Figure 13 depict histograms of each of the color channels of the encrypted Lena image. As can be seen, histograms of the encrypted images are uniform, unlike histograms of plain images, which have many sharp peaks. Hence, encrypted image pixels are distributed uniformly, resulting in images that do not reveal any statistical characteristics. This makes it extremely difficult for attackers to recover the plain image from its encrypted version.
4.2. Chi-Square Test
The histogram is approximated by a uniform distribution. The uniformity is verified by test as expressed in (15),
where k is the number of gray levels, which is 256, and is the observed occurrence frequencies of each gray level, from 0 to 255. Note that the expected occurrence frequency of each gray level is 256 [54]. For a significance level of , the computed value of the encrypted Lena image of our proposed scheme is 289. Because , this implies that the null hypothesis is not rejected and the distribution of the encrypted histogram is uniform [55]. Furthermore, our computed value is superior to that of other image encryption schemes in the literature [56,57].
4.3. Information Entropy
Information entropy is employed to measure the randomness of the distribution of gray pixel values of an image. It is represented as the following expression according to Shannon’s theory:
where refers to the probability of occurrence of symbol m, and M represents the total number of bits for each symbol. Theoretically, the entropy value of a randomly encrypted image is 8 because a gray scale image has 256 symbols and the data of the pixel have possible combinations. The entropy values of the encrypted Lena, Peppers, and Baboon images are shown in Table 2. As can be seen, each of the values is a little over , which reveals that the proposed encryption scheme randomizes the distribution of the pixels of the plain image, making it impossible for an attacker to gain any information about the plain image from its encrypted version. Moreover, Table 3 and Table 4 show entropy values of the RGB color channels of various images and how they compare with achieved values in the literature, respectively. It can be seen that the achieved entropy values are all a little over , very close to the ideal entropy value of 8 and comparable to the literature.
Table 2.
Information entropy values of various images.
Table 3.
Information entropy values of the RGB color channels of various images.
Table 4.
Comparison of information entropy values of the RGB color channels of the Lena image.
4.4. Mean Squared Error
The mean squared error (MSE) is utilized to measure the reliability of the proposed scheme. It is evaluated through comparing the plain and encrypted images’ pixels, in order to detect any similarities or differences between them. Mathematically, it is expressed as:
where represents a pixel of the plain image and represents a pixel of the encrypted image. The product gives the total number of pixels in any of the images. Theoretically, the value of the MSE must be a large number in order to have a scheme that is robust against any statistical attacks. Table 5 and Table 6 show the computed MSE values for various encrypted images, as well as compares those of other schemes from the literature, respectively. It can be seen that the MSE values computed for encrypted images employing the proposed scheme are comparable or superior to those obtained from other schemes in the literature.
Table 5.
MSE and PSNR values of different image channels.
Table 6.
Average MSE and PSNR values of different images.
4.5. Peak Signal to Noise Ratio
The quality of the encryption scheme can be evaluated using the peak signal to noise ratio (PSNR), which is a ratio of the highest pixel value of the image over the MSE. Mathematically, it is expressed by:
where is the maximum pixel value, which is 255. The theoretical value of the PSNR should be as low as possible, as it is inversely proportional to the MSE. The lower the PSNR values, the better indication of the quality of the encryption scheme. Table 5 and Table 6 show the computed PSNR values for various encrypted images and compares those of other schemes from the literature, respectively. It can be seen that the PSNR values computed for encrypted images employing the proposed scheme are comparable or superior to those obtained from other schemes in the literature.
4.6. Mean Absolute Error
The mean absolute error (MAE) is a metric employed to measure the performance of the encryption scheme against differential attacks. The value of the MAE between an encrypted and a plain image must be large to guarantee that an encryption scheme is robust. It is mathematically expressed as:
where refers to a pixel in the plain image and refers to a pixel in the encrypted image, in row i and column j; M and N are the dimensions of the image. Table 7 shows that the computed MAE values of the proposed scheme are comparable or superior to its counterparts from the literature.
Table 7.
MAE analysis of the Lena, Peppers, and Baboon images.
4.7. Correlation Coefficient Analysis
A correlation coefficient measures the similarity or difference between adjacent image pixels in three directions: vertically, horizontally, and diagonally. In order to have an image encryption scheme that is cryptographically secure, a strong correlation between the adjacent pixels in all directions should be eliminated. The value of the correlation coefficient ranges from to 1, such that means that it has a negative correlation, means that it has a positive correlation, whereas 0 corresponds to no correlation. Therefore, the encrypted image must have a correlation coefficient close to 0 between the adjacent pixels in all the directions so it would resist statistical attacks. It is mathematically expressed as:
where
and
Figure 14 shows correlation coefficient plots of the plain and encrypted Lena image. As can be seen, the horizontal, vertical, and diagonal correlation coefficients of the adjacent pixels are linear. Moreover, the horizontal, vertical, and diagonal correlation coefficients plots of the encrypted image are uniform and have a scatter-like distribution. This same pixel correlation coefficient behavior can be seen in Figure 15, Figure 16 and Figure 17, for the red, green, and blue channels of the Lena image, respectively. A set of 20,000 adjacent pixels were chosen along the horizontal, vertical, and diagonal directions for this computation. The distribution of the pixels in the plain image is linear and lies on the main diagonal. This indicates that the pixels are linearly correlated. In contrast, the pixel distribution of the encrypted image is more scattered, indicating the absence of correlation between the adjacent pixels.
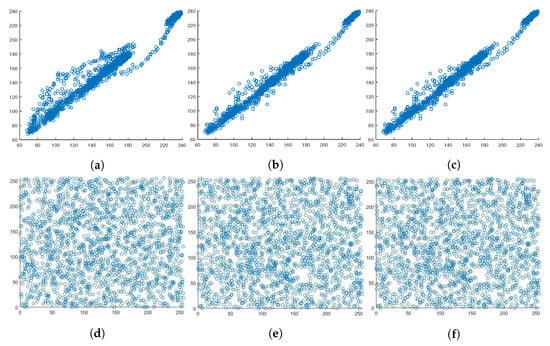
Figure 14.
Correlation coefficient diagrams of the plain and encrypted Lena image. (a) Horizontal. (b) Vertical. (c) Diagonal. (d) Horizontal. (e) Vertical. (f) Diagonal.
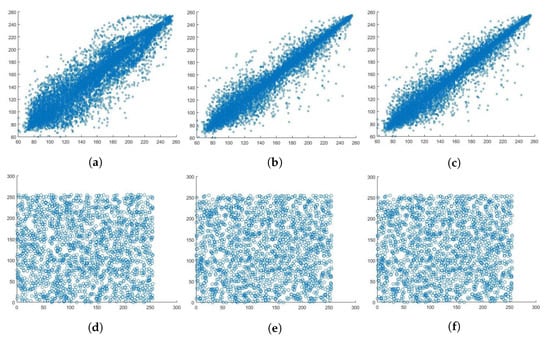
Figure 15.
Correlation coefficient diagram of the plain and encrypted red channel of Lena image. (a) Horizontal. (b) Vertical. (c) Diagonal. (d) Horizontal. (e) Vertical. (f) Diagonal.
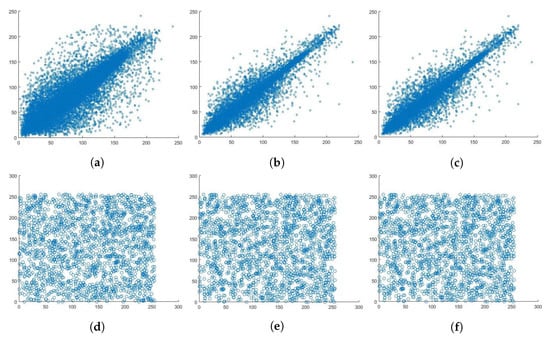
Figure 16.
Correlation coefficient diagram of the plain and encrypted green channel of Lena image. (a) Horizontal. (b) Vertical. (c) Diagonal. (d) Horizontal. (e) Vertical. (f) Diagonal.
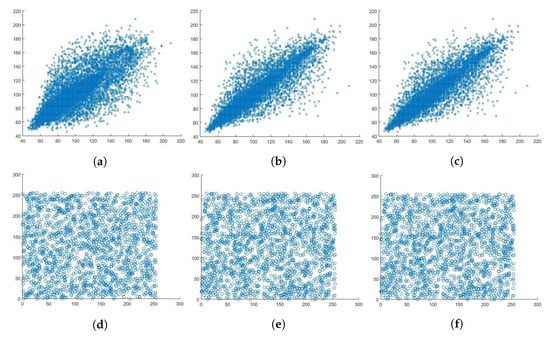
Figure 17.
Correlation coefficient diagram of the plain and encrypted blue channel of Lena image. (a) Horizontal. (b) Vertical. (c) Diagonal (d) Horizontal. (e) Vertical. (f) Diagonal.
This linear relationship is also shown in Table 8, where the plain image has a correlation coefficient of ∼1 and the correlation coefficient of the encrypted image is ∼0, which means that the pixels are not correlated to one another, making the encrypted image meaningless to any attacker. Table 9 showcases a correlation coefficient comparison among the proposed scheme and some of its counterparts from the literature. It is clear that the results are comparable. A detailed correlation coefficient comparison in terms of each of the color channels is provided in Table 10 and Table 11, for the Lena and Baboon images, respectively, as well as comparison with values from counterpart schemes from the literature.
Table 8.
Correlation coefficients of plain and encrypted images.
Table 9.
Correlation coefficients comparison between plain and encrypted Lena images.
Table 10.
Correlation coefficient comparison of plain and encrypted Lena image color channels.
Table 11.
Correlation coefficient comparison of plain and encrypted Baboon image color channels.
4.8. Key Space Analysis
A key space analysis is carried out to compute the number of unique keys that can be utilized in the encryption process. In the proposed image encryption scheme, the secret keys and variables are assumed to be shared between the transmitter and receiver via a secure channel. In addition, the literature includes excellent key-establishment protocols, for example, [73]. In the proposed image encryption scheme, there is a total of eight variables. These are: and seven variables that are used to generate the keys, and . The largest machine precision is . Thus, the key space is approximately . This value exceeds the threshold earlier proposed in [74] as . This means that our proposed scheme can resist brute-force attacks. Furthermore, an examination of key space values of related image encryption schemes from the literature, as in Table 12, clearly indicates that the proposed scheme is larger than them.
Table 12.
Key space values comparison.
4.9. Differential Attack Analysis
A differential attack analysis is employed to measure the strength of the proposed encryption scheme against differential attacks. The number of pixels changing rate (NPCR) and the unified average change intensity (UACI) are two methods that are employed to carry out a differential attack analysis.
4.9.1. The Number of Pixel Changing Rate
The NPCR measures the number of pixels which are different between two images. It is mathematically expressed as:
where is given by:
4.9.2. The Unified Average Change Intensity
The UACI is a measure of the difference in the average intensity between the encrypted and plain images. It is mathematically expressed as:
where and are two images of dimensions .
Table 13 depicts the NPCR and UACI results of the proposed encryption scheme on various images. As shown, the NPCR is greater than and the UACI should also be greater than . It is not in all the cases; however, it is close to it. As a result, any slight difference in the plain text image would result in a significant difference in the encrypted image. Moreover, the proposed scheme is also compared with its counterparts from the literature, in terms of the differential attacks. NPCR and UACI values are also shown in Table 14 and Table 15. As can be seen, the computed NPCR value of the proposed scheme is and is better than [35,78,79]. The UACI value should be , which is not the case for the proposed scheme, in which [78] is better.
Table 13.
NPCR and UACI of different images.
Table 14.
NPCR and UACI of different image channels comparison.
Table 15.
Average NPCR and UACI of the Lena image comparison.
4.10. Execution Time Analysis
The execution time is used to measure the complexity of this scheme and whether it can be used for real time applications. Table 16 shows the total execution time, in terms of encryption and decryption times, of the Lena image, provided for various dimensions. The total execution time ranges from 2.89 s to 16.217 s, depending on the image dimensions. Furthermore, Table 17 provides a comparison of the encryption time among the proposed image encryption scheme and its counterparts from the literature. Note that the differences in execution time depends on multiple factors, including the algorithm itself, the machine specifications on which the algorithm is run (i.e., processing power and available memory), as well as the software running the algorithm. Note that in [77,80,81,82], the software of choice is Mathworks Matlab®, whereas the proposed scheme is programmed on Wolfram Mathematica®. The average encryption time of the proposed image encryption scheme is 0.61 Mbps.
Table 16.
Encryption time of the proposed scheme for the Lena image at various dimensions.
Table 17.
Execution time comparison for various schemes of the Lena image having dimensions .
4.11. The National Institute of Standards and Technology Analysis
A good PRNG should satisfy its randomness criteria by a number of tests that comprise the NIST analysis suite. Specifically, the probability, or p-value, of each of the tests should be greater than for any bitstream to be regarded as random. The proposed encryption scheme is subjected to the NIST suite of tests, over a large number of lengthy bit sequences, and successfully passes each of them. As an illustration, Table 18 shows the results of the NIST analysis of each of the color channels of the encrypted Lena image. It is clear that the values for all the tests are indeed larger than , indicating the success of the proposed image encryption scheme at passing the NIST analysis.
Table 18.
NIST analysis on the RGB color channels of the encrypted Lena image.
5. Conclusions
This paper proposed an RGB image encryption scheme that makes use of Shannon’s ideas of confusion and diffusion. The proposed scheme is implemented in three stages. In the first stage, Rule 30 cellular automaton is utilized to generate the first key. In the second stage, a well-designed S-box is utilized to create the needed non-linearity and complexity. Finally, in the third stage, a solution of the Lorenz system is used to generate the second key. The performance of the scheme was evaluated utilizing different metrics, statistically and differentially. Those included a histogram analysis and its associated computations, a correlation coefficient analysis, MSE, PSNR, MAE, information entropy, an execution time analysis, a differential attack analysis (in terms of NPCR and UACI), a key space analysis, and a NIST analysis. The computed results suggest that the proposed scheme is resistant against any statistical, differential, or brute-force attacks. Moreover, on carrying out comparisons with counterpart image encryption schemes from the literature, the proposed color image encryption scheme exhibited either a comparable or a superior security performance. Nevertheless, the proposed scheme does not come without limitations. The Lorenz system utilized in the third stage is dissipative and has a comparatively poor ergodic property in comparison with conservative chaotic dynamical systems. Such systems have improved distribution in phase space while also exhibiting high ergodicity, sometimes at the expense of being more computationally complex. Future work could tackle this issue, attempting to find a dynamical system with a trade-off among high ergodicity, improved distribution in phase space, and low computational complexity.
Author Contributions
Conceptualization, W.A.; formal analysis, W.A.; investigation, M.E.; methodology, W.A., M.E. and A.A.; project administration, W.A.; software, W.A. and M.E.; supervision, W.A. and A.A.; visualization, W.A.; writing—original draft, W.A. and M.E.; writing—review and editing, W.A. and A.A. All authors have read and agreed to the published version of the manuscript.
Funding
This research received no external funding.
Institutional Review Board Statement
Not applicable.
Informed Consent Statement
Not applicable.
Data Availability Statement
Not applicable.
Conflicts of Interest
The authors declare no conflict of interest.
References
- Farrag, S.; Maher, E.; El-Mahdy, A.; Dressler, F. Performance Analysis of UAV Assisted Mobile Communications in THz Channel. IEEE Access 2021, 9, 160104–160115. [Google Scholar] [CrossRef]
- Furqan, H.M.; Solaija, M.S.J.; Türkmen, H.; Arslan, H. Wireless Communication, Sensing, and REM: A Security Perspective. IEEE Open J. Commun. Soc. 2021, 2, 287–321. [Google Scholar] [CrossRef]
- El Mahdy, A.; Alexan, W. A threshold-free LLR-based scheme to minimize the BER for decode-and-forward relaying. Wirel. Pers. Commun. 2018, 100, 787–801. [Google Scholar] [CrossRef]
- Moussa, Y.; Alexan, W. Message Security Through AES and LSB Embedding in Edge Detected Pixels of 3D Images. In Proceedings of the 2020 2nd Novel Intelligent and Leading Emerging Sciences Conference (NILES), Giza, Egypt, 24–26 October 2020; pp. 224–229. [Google Scholar] [CrossRef]
- Alexan, W.; Mamdouh, E.; Elkhateeb, A.; Al-Seba’ey, F.; Amr, Z.; Khalil, H. Securing Sensitive Data Through Corner Filters, Chaotic Maps and LSB Embedding. In Proceedings of the 2021 3rd Novel Intelligent and Leading Emerging Sciences Conference (NILES), Giza, Egypt, 23–25 October 2021; pp. 359–364. [Google Scholar]
- Elkandoz, M.T.; Alexan, W. Logistic Tan Map Based Audio Steganography. In Proceedings of the 2019 International Conference on Electrical and Computing Technologies and Applications (ICECTA), Ras Al Khaimah, United Arab Emirates, 19–21 November 2019; pp. 1–5. [Google Scholar] [CrossRef]
- Mihailescu, M.I.; Nita, S.L. Big Data Cryptography. In Pro Cryptography and Cryptanalysis; Springer: Berlin/Heidelberg, Germany, 2021; pp. 379–400. [Google Scholar]
- Alexan, W.; El Beheiry, M.; Gamal-Eldin, O. A comparative study among different mathematical sequences in 3d image steganography. Int. J. Comput. Digit. Syst. 2020, 9, 545–552. [Google Scholar] [CrossRef]
- Farrag, S.; Alexan, W. Secure 3D data hiding technique based on a mesh traversal algorithm. Multimed. Tools Appl. 2020, 79, 29289–29303. [Google Scholar] [CrossRef]
- El-Shafai, W.; Almomani, I.M.; Alkhayer, A. Optical Bit-Plane-Based 3D-JST Cryptography Algorithm With Cascaded 2D-FrFT Encryption for Efficient and Secure HEVC Communication. IEEE Access 2021, 9, 35004–35026. [Google Scholar] [CrossRef]
- Verbauwhede, I. The cost of cryptography: Is low budget possible? In Proceedings of the 2011 IEEE 17th International On-Line Testing Symposium, Athens, Greece, 13–15 July 2011; p. 133. [Google Scholar] [CrossRef] [Green Version]
- Rifa-Pous, H.; Herrera-Joancomartí, J. Computational and energy costs of cryptographic algorithms on handheld devices. Future Internet 2011, 3, 31–48. [Google Scholar] [CrossRef] [Green Version]
- Lu, Q.; Zhu, C.; Deng, X. An efficient image encryption scheme based on the LSS chaotic map and single S-box. IEEE Access 2020, 8, 25664–25678. [Google Scholar] [CrossRef]
- Hosny, K.M. Multimedia Security Using Chaotic Maps: Principles and Methodologies; Springer: Berlin/Heidelberg, Germany, 2020; Volume 884. [Google Scholar]
- Wolfram, S. A New Kind of Science; Wolfram Media: Champaign, IL, USA, 2002; Volume 5. [Google Scholar]
- Wen, C.; Li, X.; Zanotti, T.; Puglisi, F.M.; Shi, Y.; Saiz, F.; Antidormi, A.; Roche, S.; Zheng, W.; Liang, X.; et al. Advanced Data Encryption using 2D Materials. Adv. Mater. 2021, 33, 2100185. [Google Scholar] [CrossRef]
- Tulli, D.; Abellan, C.; Amaya, W. Engineering High-Speed Quantum Random Number Generators. In Proceedings of the 2019 21st International Conference on Transparent Optical Networks (ICTON), Angers, France, 9–13 July 2019. [Google Scholar] [CrossRef]
- Zhang, Y.; Lo, H.P.; Mink, A.; Ikuta, T.; Honjo, T.; Takesue, H.; Munro, W.J. A simple low-latency real-time certifiable quantum random number generator. Nat. Commun. 2021, 12, 1056. [Google Scholar] [CrossRef]
- Tomassini, M.; Perrenoud, M. Cryptography with cellular automata. Appl. Soft Comput. 2001, 1, 151–160. [Google Scholar] [CrossRef]
- Wolfram, S. Cryptography with cellular automata. In Proceedings of the Conference on the Theory and Application of Cryptographic Techniques, Santa Barbara, CA, USA, 18–22 August 1985; pp. 429–432. [Google Scholar]
- Nandi, S.; Kar, B.K.; Chaudhuri, P.P. Theory and applications of cellular automata in cryptography. IEEE Trans. Comput. 1994, 43, 1346–1357. [Google Scholar] [CrossRef]
- Yampolskiy, R.V.; Rebolledo-Mendez, J.D.; Hindi, M.M. Password protected visual cryptography via cellular automaton rule 30. In Transactions on Data Hiding and Multimedia Security IX; Springer: Berlin/Heidelberg, Germany, 2014; pp. 57–67. [Google Scholar]
- Chai, X.; Gan, Z.; Yang, K.; Chen, Y.; Liu, X. An image encryption algorithm based on the memristive hyperchaotic system, cellular automata and DNA sequence operations. Signal Process. Image Commun. 2017, 52, 6–19. [Google Scholar] [CrossRef] [Green Version]
- Niyat, A.Y.; Moattar, M.H.; Torshiz, M.N. Color image encryption based on hybrid hyper-chaotic system and cellular automata. Opt. Lasers Eng. 2017, 90, 225–237. [Google Scholar] [CrossRef]
- Jiao, K.; Ye, G.; Mei, Q. Image Encryption Scheme Based on Quantum Logistic Map and Cellular Automata. In Proceedings of the 2021 IEEE 6th International Conference on Computer and Communication Systems (ICCCS), Chengdu, China, 23–26 April 2021; pp. 375–379. [Google Scholar] [CrossRef]
- Li, W.; Li, J.; Guo, L. An Efficient 2bits-Level for Image Encryption Based on Dna, Multi-Delayed Chebyshev Map and Cellular Automata. In Proceedings of the 2018 15th International Computer Conference on Wavelet Active Media Technology and Information Processing (ICCWAMTIP), Chengdu, China, 14–16 December 2018; pp. 131–137. [Google Scholar] [CrossRef]
- Ben Slimane, N.; Aouf, N.; Bouallegue, K.; Machhout, M. Hash Key-Based Image Cryptosystem Using Chaotic Maps and Cellular Automata. In Proceedings of the 2018 15th International Multi-Conference on Systems, Signals Devices (SSD), Yasmine Hammamet, Tunisia, 19–22 March 2018; pp. 190–194. [Google Scholar] [CrossRef]
- Kumari, M.; Gupta, S. Performance comparison between Chaos and quantum-chaos based image encryption techniques. Multimed. Tools Appl. 2021, 80, 33213–33255. [Google Scholar] [CrossRef] [PubMed]
- Arroyo, D.; Diaz, J.; Rodriguez, F. Cryptanalysis of a one round chaos-based substitution permutation network. Signal Process. 2013, 93, 1358–1364. [Google Scholar] [CrossRef] [Green Version]
- Elkandoz, M.T.; Alexan, W.; Hussein, H.H. Logistic Sine Map Based Image Encryption. In Proceedings of the 2019 Signal Processing: Algorithms, Architectures, Arrangements, and Applications (SPA), Poznan, Poland, 18–20 September 2019; pp. 290–295. [Google Scholar] [CrossRef]
- Yang, B.; Liao, X. A new color image encryption scheme based on logistic map over the finite field ZN. Multimed. Tools Appl. 2018, 77, 21803–21821. [Google Scholar] [CrossRef]
- Liu, H.; Jin, C. A novel color image encryption algorithm based on quantum chaos sequence. 3D Res. 2017, 8, 4. [Google Scholar] [CrossRef]
- ElKamchouchi, D.H.; Mohamed, H.G.; Moussa, K.H. A bijective image encryption system based on hybrid chaotic map diffusion and DNA confusion. Entropy 2020, 22, 180. [Google Scholar] [CrossRef] [Green Version]
- Kumar, V.; Girdhar, A. A 2D logistic map and Lorenz-Rossler chaotic system based RGB image encryption approach. Multimed. Tools Appl. 2021, 80, 3749–3773. [Google Scholar] [CrossRef]
- Khan, M.; Masood, F. A novel chaotic image encryption technique based on multiple discrete dynamical maps. Multimed. Tools Appl. 2019, 78, 26203–26222. [Google Scholar] [CrossRef]
- Younas, I.; Khan, M. A new efficient digital image encryption based on inverse left almost semi group and Lorenz chaotic system. Entropy 2018, 20, 913. [Google Scholar] [CrossRef] [Green Version]
- Seyedzadeh, S.M.; Norouzi, B.; Mosavi, M.R.; Mirzakuchaki, S. A novel color image encryption algorithm based on spatial permutation and quantum chaotic map. Nonlinear Dyn. 2015, 81, 511–529. [Google Scholar] [CrossRef]
- Ge, B.; Chen, X.; Chen, G.; Shen, Z. Secure and Fast Image Encryption Algorithm Using Hyper-Chaos-Based Key Generator and Vector Operation. IEEE Access 2021, 9, 137635–137654. [Google Scholar] [CrossRef]
- Gao, H.; Wang, X. Chaotic Image Encryption Algorithm Based on Zigzag Transform With Bidirectional Crossover From Random Position. IEEE Access 2021, 9, 105627–105640. [Google Scholar] [CrossRef]
- Ahmad, M.; Chugh, H.; Goel, A.; Singla, P. A chaos based method for efficient cryptographic S-box design. In Proceedings of the International Symposium on Security in Computing and Communication, Mysore, India, 22–24 August 2013; pp. 130–137. [Google Scholar]
- Tanyildizi, E.; Özkaynak, F. A new chaotic S-box generation method using parameter optimization of one dimensional chaotic maps. IEEE Access 2019, 7, 117829–117838. [Google Scholar] [CrossRef]
- Ahmad, M.; Al-Solami, E.; Alghamdi, A.M.; Yousaf, M.A. Bijective S-boxes method using improved chaotic map-based heuristic search and algebraic group structures. IEEE Access 2020, 8, 110397–110411. [Google Scholar] [CrossRef]
- Zahid, A.H.; Al-Solami, E.; Ahmad, M. A novel modular approach based substitution-box design for image encryption. IEEE Access 2020, 8, 150326–150340. [Google Scholar] [CrossRef]
- Khalid, I.; Jamal, S.S.; Shah, T.; Shah, D.; Hazzazi, M.M. A Novel Scheme of Image Encryption Based on Elliptic Curves Isomorphism and Substitution Boxes. IEEE Access 2021, 9, 77798–777810. [Google Scholar] [CrossRef]
- Ramzan, M.; Shah, T.; Hazzazi, M.M.; Aljaedi, A.; Alharbi, A.R. Construction of S-Boxes using Different Maps over Elliptic Curves for Image Encryption. IEEE Access 2021, 9, 157106–157123. [Google Scholar] [CrossRef]
- Tanveer, M.; Shah, T.; Rehman, A.; Ali, A.; Siddiqui, G.F.; Saba, T.; Tariq, U. Multi-Images Encryption Scheme Based on 3D Chaotic Map and Substitution Box. IEEE Access 2021, 9, 73924–73937. [Google Scholar] [CrossRef]
- Nizam Chew, L.C.; Ismail, E.S. S-box construction based on linear fractional transformation and permutation function. Symmetry 2020, 12, 826. [Google Scholar] [CrossRef]
- Jamal, S.S.; Shah, T.; AlKhaldi, A.H.; Tufail, M.N. Construction of new substitution boxes using linear fractional transformation and enhanced chaos. Chin. J. Phys. 2019, 60, 564–572. [Google Scholar] [CrossRef]
- Shannon, C.E. Communication theory of secrecy systems. Bell Syst. Tech. J. 1949, 28, 656–715. [Google Scholar] [CrossRef]
- Zaitsev, D.A. A generalized neighborhood for cellular automata. Theor. Comput. Sci. 2017, 666, 21–35. [Google Scholar] [CrossRef]
- Tomassini, M.; Sipper, M.; Perrenoud, M. On the generation of high-quality random numbers by two-dimensional cellular automata. IEEE Trans. Comput. 2000, 49, 1146–1151. [Google Scholar]
- Lorenz, E.N. Deterministic nonperiodic flow. J. Atmos. Sci. 1963, 20, 130–141. [Google Scholar] [CrossRef] [Green Version]
- Sparrow, C. The Lorenz Equations: Bifurcations, Chaos, and Strange Attractors; Springer Science & Business Media: Berlin/Heidelberg, Germany, 2012; Volume 41. [Google Scholar]
- Khanzadi, H.; Eshghi, M.; Borujeni, S.E. Image encryption using random bit sequence based on chaotic maps. Arab. J. Sci. Eng. 2014, 39, 1039–1047. [Google Scholar] [CrossRef] [Green Version]
- Kwok, H.; Tang, W.K. A fast image encryption system based on chaotic maps with finite precision representation. Chaos Solitons Fractals 2007, 32, 1518–1529. [Google Scholar] [CrossRef]
- Etemadi Borujeni, S.; Eshghi, M. Chaotic image encryption design using tompkins-paige algorithm. Math. Probl. Eng. 2009, 2009, 762652. [Google Scholar] [CrossRef] [Green Version]
- Revathy, K.; Thenmozhi, K.; Amirtharajan, R.; Praveenkumar, P. CR Assisted IE Guarded Authenticated Biomedical Image Transactions. IEEE Photonics J. 2018, 10, 1–13. [Google Scholar] [CrossRef]
- Hasanzadeh, E.; Yaghoobi, M. A novel color image encryption algorithm based on substitution box and hyper-chaotic system with fractal keys. Multimed. Tools Appl. 2019, 79, 7279–7297. [Google Scholar] [CrossRef]
- Liu, H.; Wang, X. Color image encryption using spatial bit-level permutation and high-dimension chaotic system. Opt. Commun. 2011, 284, 3895–3903. [Google Scholar] [CrossRef]
- Yang, F.; Mou, J.; Sun, K.; Cao, Y.; Jin, J. Color image compression-encryption algorithm based on fractional-order memristor chaotic circuit. IEEE Access 2019, 7, 58751–58763. [Google Scholar] [CrossRef]
- Huang, Y.; Huang, L.; Wang, Y.; Peng, Y.; Yu, F. Shape synchronization in driver-response of 4-D chaotic system and its application in image encryption. IEEE Access 2020, 8, 135308–135319. [Google Scholar] [CrossRef]
- Khan, M.; Shah, T. An efficient chaotic image encryption scheme. Neural Comput. Appl. 2015, 26, 1137–1148. [Google Scholar] [CrossRef]
- Wang, Y.; Wu, C.; Kang, S.; Wang, Q.; Mikulovich, V. Multi-channel chaotic encryption algorithm for color image based on DNA coding. Multimed. Tools Appl. 2020, 79, 18317–18342. [Google Scholar] [CrossRef]
- Rhouma, R.; Meherzi, S.; Belghith, S. OCML-based colour image encryption. Chaos Solitons Fractals 2009, 40, 309–318. [Google Scholar] [CrossRef]
- Liu, H.; Kadir, A. Asymmetric color image encryption scheme using 2D discrete-time map. Signal Process. 2015, 113, 104–112. [Google Scholar] [CrossRef]
- Wu, X.; Wang, K.; Wang, X.; Kan, H.; Kurths, J. Color image DNA encryption using NCA map-based CML and one-time keys. Signal Process. 2018, 148, 272–287. [Google Scholar] [CrossRef]
- Norouzi, B.; Mirzakuchaki, S. A fast color image encryption algorithm based on hyper-chaotic systems. Nonlinear Dyn. 2014, 78, 995–1015. [Google Scholar] [CrossRef]
- Wu, X.; Wang, K.; Wang, X.; Kan, H. Lossless chaotic color image cryptosystem based on DNA encryption and entropy. Nonlinear Dyn. 2017, 90, 855–875. [Google Scholar] [CrossRef]
- Hua, Z.; Zhou, Y. Exponential chaotic model for generating robust chaos. IEEE Trans. Syst. Man Cybern. Syst. 2019, 51, 3713–3724. [Google Scholar] [CrossRef]
- Zhang, Y.Q.; He, Y.; Li, P.; Wang, X.Y. A new color image encryption scheme based on 2DNLCML system and genetic operations. Opt. Lasers Eng. 2020, 128, 106040. [Google Scholar] [CrossRef]
- Jithin, K.; Sankar, S. Colour image encryption algorithm combining, Arnold map, DNA sequence operation, and a Mandelbrot set. J. Inf. Secur. Appl. 2020, 50, 102428. [Google Scholar] [CrossRef]
- Rehman, A.U.; Firdous, A.; Iqbal, S.; Abbas, Z.; Shahid, M.M.A.; Wang, H.; Ullah, F. A Color Image Encryption Algorithm Based on One Time Key, Chaos Theory, and Concept of Rotor Machine. IEEE Access 2020, 8, 172275–172295. [Google Scholar] [CrossRef]
- Boyd, C.; Mathuria, A.; Stebila, D. Protocols for Authentication and Key Establishment; Springer: Berlin/Heidelberg, Germany, 2003; Volume 1. [Google Scholar]
- Alvarez, G.; Li, S. Some basic cryptographic requirements for chaos-based cryptosystems. Int. J. Bifurc. Chaos 2006, 16, 2129–2151. [Google Scholar] [CrossRef] [Green Version]
- Ur Rehman, A.; Liao, X.; Ashraf, R.; Ullah, S.; Wang, H. A color image encryption technique using exclusive-OR with DNA complementary rules based on chaos theory and SHA-2. Optik 2018, 159, 348–367. [Google Scholar] [CrossRef]
- Li, B.; Liao, X.; Jiang, Y. A novel image encryption scheme based on logistic map and dynatomic modular curve. Multimed. Tools Appl. 2018, 77, 8911–8938. [Google Scholar] [CrossRef]
- Hu, X.; Wei, L.; Chen, W.; Chen, Q.; Guo, Y. Color image encryption algorithm based on dynamic chaos and matrix convolution. IEEE Access 2020, 8, 12452–12466. [Google Scholar] [CrossRef]
- Wu, X.; Kurths, J.; Kan, H. A robust and lossless DNA encryption scheme for color images. Multimed. Tools Appl. 2018, 77, 12349–12376. [Google Scholar] [CrossRef]
- Huang, C.K.; Nien, H.H. Multi chaotic systems based pixel shuffle for image encryption. Opt. Commun. 2009, 282, 2123–2127. [Google Scholar] [CrossRef]
- Gong, L.; Qiu, K.; Deng, C.; Zhou, N. An image compression and encryption algorithm based on chaotic system and compressive sensing. Opt. Laser Technol. 2019, 115, 257–267. [Google Scholar] [CrossRef]
- Zhang, X.; Wang, L.; Wang, Y.; Niu, Y.; Li, Y. An image encryption algorithm based on hyperchaotic system and variable-step Josephus problem. Int. J. Opt. 2020, 2020, 6102824. [Google Scholar] [CrossRef]
- Xu, L.; Li, Z.; Li, J.; Hua, W. A novel bit-level image encryption algorithm based on chaotic maps. Opt. Lasers Eng. 2016, 78, 17–25. [Google Scholar] [CrossRef]
- Slimane, N.B.; Aouf, N.; Bouallegue, K.; Machhout, M. A novel chaotic image cryptosystem based on DNA sequence operations and single neuron model. Multimed. Tools Appl. 2018, 77, 30993–31019. [Google Scholar] [CrossRef]
Publisher’s Note: MDPI stays neutral with regard to jurisdictional claims in published maps and institutional affiliations. |
© 2022 by the authors. Licensee MDPI, Basel, Switzerland. This article is an open access article distributed under the terms and conditions of the Creative Commons Attribution (CC BY) license (https://creativecommons.org/licenses/by/4.0/).