1. Introduction
In biology, asymmetry is defined as lack or absence of symmetry (i.e., correspondence between different variables for body sides) [
1]. The average person should not be characterized by significant inter-limb strength and functional asymmetries. Although a certain level of asymmetry resulting mostly from the habitual use of the “better side” is typical of the human body, asymmetries of more than 5% are assumed to be unhealthy [
2]. However, in many sports, which contain asymmetric movement patterns (e.g., archery, tennis or team sports i.e., basketball, soccer or volleyball), athletes often exhibit asymmetrical growth of muscle groups caused by using sport-specific techniques [
3]. The training necessary to reach the professional level creates a dominant lower limb in basketball [
4] and soccer players [
5]. It also leads to higher loads or overloads on one side of the body. The lack of an equal training load distribution on both sides of the body can cause significant movement asymmetry, which is conducive to (mainly non-contact) injuries [
6,
7]. In addition, unilateral training may affect sport performance during the competitions [
7,
8]. Symmetry of movements in sports (mainly in team sports) increases the versatility of a player (e.g., a basketball player can finish a layup shot with the right or left hand), introduces elements of surprise to the opponent, leads to proper development of the athlete’s body, and reduces the injury risk of the motion system [
9].
Human movements, in which the lower limbs are responsible for center of mass (COM) displacements, can be described by using a simple spring-mass model [
10]. According to the assumptions of this model, the lower limbs are modeled as a “
leg-spring” (representing both lower limbs) supporting the mass of the body. Leg stiffness is commonly used to describe the mechanical properties of a “
leg-spring” and is defined as the ratio of changes in ground reaction force to the respective changes in “
leg-spring length” [
11]. Therefore, leg stiffness is a quantitative measure of the resistance to deformation and is related to the maximal performance of cyclic and single dynamic movements as well as with the risk of injury [
12,
13,
14]. Moreover, the risk of limb injury may be associated with the inability to appropriately adjust or change “
leg-spring” stiffness. There is currently no consensus on which values of leg stiffness are more likely to increase the risk of injuries to joints and soft tissues. Excessive leg stiffness may increase bone injury, whereas insufficient leg stiffness may result in joint instability and soft tissue injury. Therefore, there may be an “optimal” amount of leg stiffness that allows one to be relatively safe from injury performance [
12,
15,
16,
17,
18]. However, no studies have provided unequivocal evidence for the presence of a desired value of leg stiffness for any particular motor task or group. Based on the analysis of countermovement jumps (CMJ—a vertical jump preceded by lower limb countermovement), it seems that the desired leg stiffness value should be relatively small in relation to the “maximum” [
9].
Regardless of the leg stiffness value, significant differences in leg stiffness between the left and right lower limbs may elevate even more the risk of injury during vertical jumps. Pruyn et al. [
19] stated that a relatively high inter-limb difference in leg (vertical) stiffness may be related to the soft tissue injury in Australian football players. The group with non-contact lower limb injuries recorded significantly higher inter-limb differences in leg (vertical) stiffness during the one-legged hopping test (7.5 ± 3.0%) than the non-injured group (5.5 ± 1.3%) [
19]. Similarly, Bryant et al. [
20] reported in a group of team sport players (basketball, football, soccer, and field hockey) that leg (vertical) stiffness was significantly higher in the involved lower limb (after ACL reconstruction) than in the noninvolved limb during a one-legged hopping test. On the other hand, Hobara et al. [
21] obtained no significant difference in leg (vertical) stiffness between dominant and non-dominant lower limbs during a one-legged hopping test in a group of healthy male subjects, which confirms that non-training sport groups may be characterized by symmetry of the lower limbs (manifested during vertical jumping tasks). Several authors determined the inter-limb asymmetry in leg (vertical) stiffness during cyclic one-legged hopping tasks [
19,
20,
21,
22,
23]. Although these studies reported that inter-limb difference in leg (vertical) stiffness was approximately 10%, all of these studies investigated inter-limb differences in leg (vertical) stiffness during a one-legged hopping task. However, the situation may be different for two-legged vertical jumps. The level of inter-limb asymmetry in leg stiffness during vertical jumps may vary depending on the performance on one or both limbs. For example, there may be a greater right leg stiffness during a two-legged vertical jump and simultaneously a higher value for left leg stiffness during a one-legged jump [
24,
25,
26]. Moreover, Maloney et al. [
24] suggested that stiffness asymmetries may be greater during single maximal performance tasks than during cyclical or submaximal tasks (e.g., hopping). However, inter-limb asymmetry in leg stiffness investigations are limited and no norms have been evaluated thus far for inter-limb differences in leg stiffness during single two-legged vertical jumps. Despite the fact that many sport activities are performed in a unilateral fashion, little is known about inter-limb differences in leg stiffness [
21]. Moreover, two-legged CMJ provides more reliable measures of inter-limb asymmetries than one-legged CMJ [
27].
Therefore, the purpose of this study was to identify the differences in leg stiffness between the dominant and non-dominant lower limb during a two-legged CMJ. Movement patterns for both lower limbs are similar and should be symmetric during countermovement and take-off phases in two-legged CMJ. Therefore, the question can be asked whether leg stiffness will be similar in dominant and non-dominant lower limbs during these phases. Additionally, the association between inter-limb asymmetry of leg stiffness and CMJ height was investigated. Will high inter-limb difference in leg stiffness be related to vertical jump performance?
2. Materials and Methods
The study was conducted among 35 basketball players from the second national league (body height: 1.90 ± 0.08 m, body mass: 81.9 ± 10 kg, age: 19.5 ± 1.7 years, training experience: 6.8 ± 2.5 years). The players from two teams were examined, who confirmed (certificate signed by a sports medicine physician) that they were in good health status to participate in competitive sports (no contraindications) and had no pain signs in the lower limbs area before or during the tests. Failure to meet the above conditions excluded a person from participation. Eventually 35 players were qualified. The tests were carried out in the Biomechanical Analysis Laboratory at the Wroclaw University of Health and Sport Sciences, Poland (PN-EN ISO 9001:2009). Before the tests, each participant was familiarized with the research goals, informed about the purpose of the study, and motivated to properly perform the assignment. All subjects gave their informed consent for inclusion before they participated in the study. The study was conducted in accordance with the Declaration of Helsinki (1975, revised in 2013), and the protocol was approved by the Senate’s Research Bioethics Commission of the Wroclaw University of Health and Sport Sciences, Poland (approval date: 27.05.2013). The research was performed in the same way as Struzik and Zawadzki [
28].
Each participant performed three CMJs with arm swing to the maximum height. The following CMJ variables were included in the analysis: leg stiffness, ground reaction force (profile in time), change in length of the “leg-spring” (profile in time), and jump height. Except for jump height, the grouping variables were the jump phase (countermovement and take-off) and the lower limb (dominant and non-dominant).
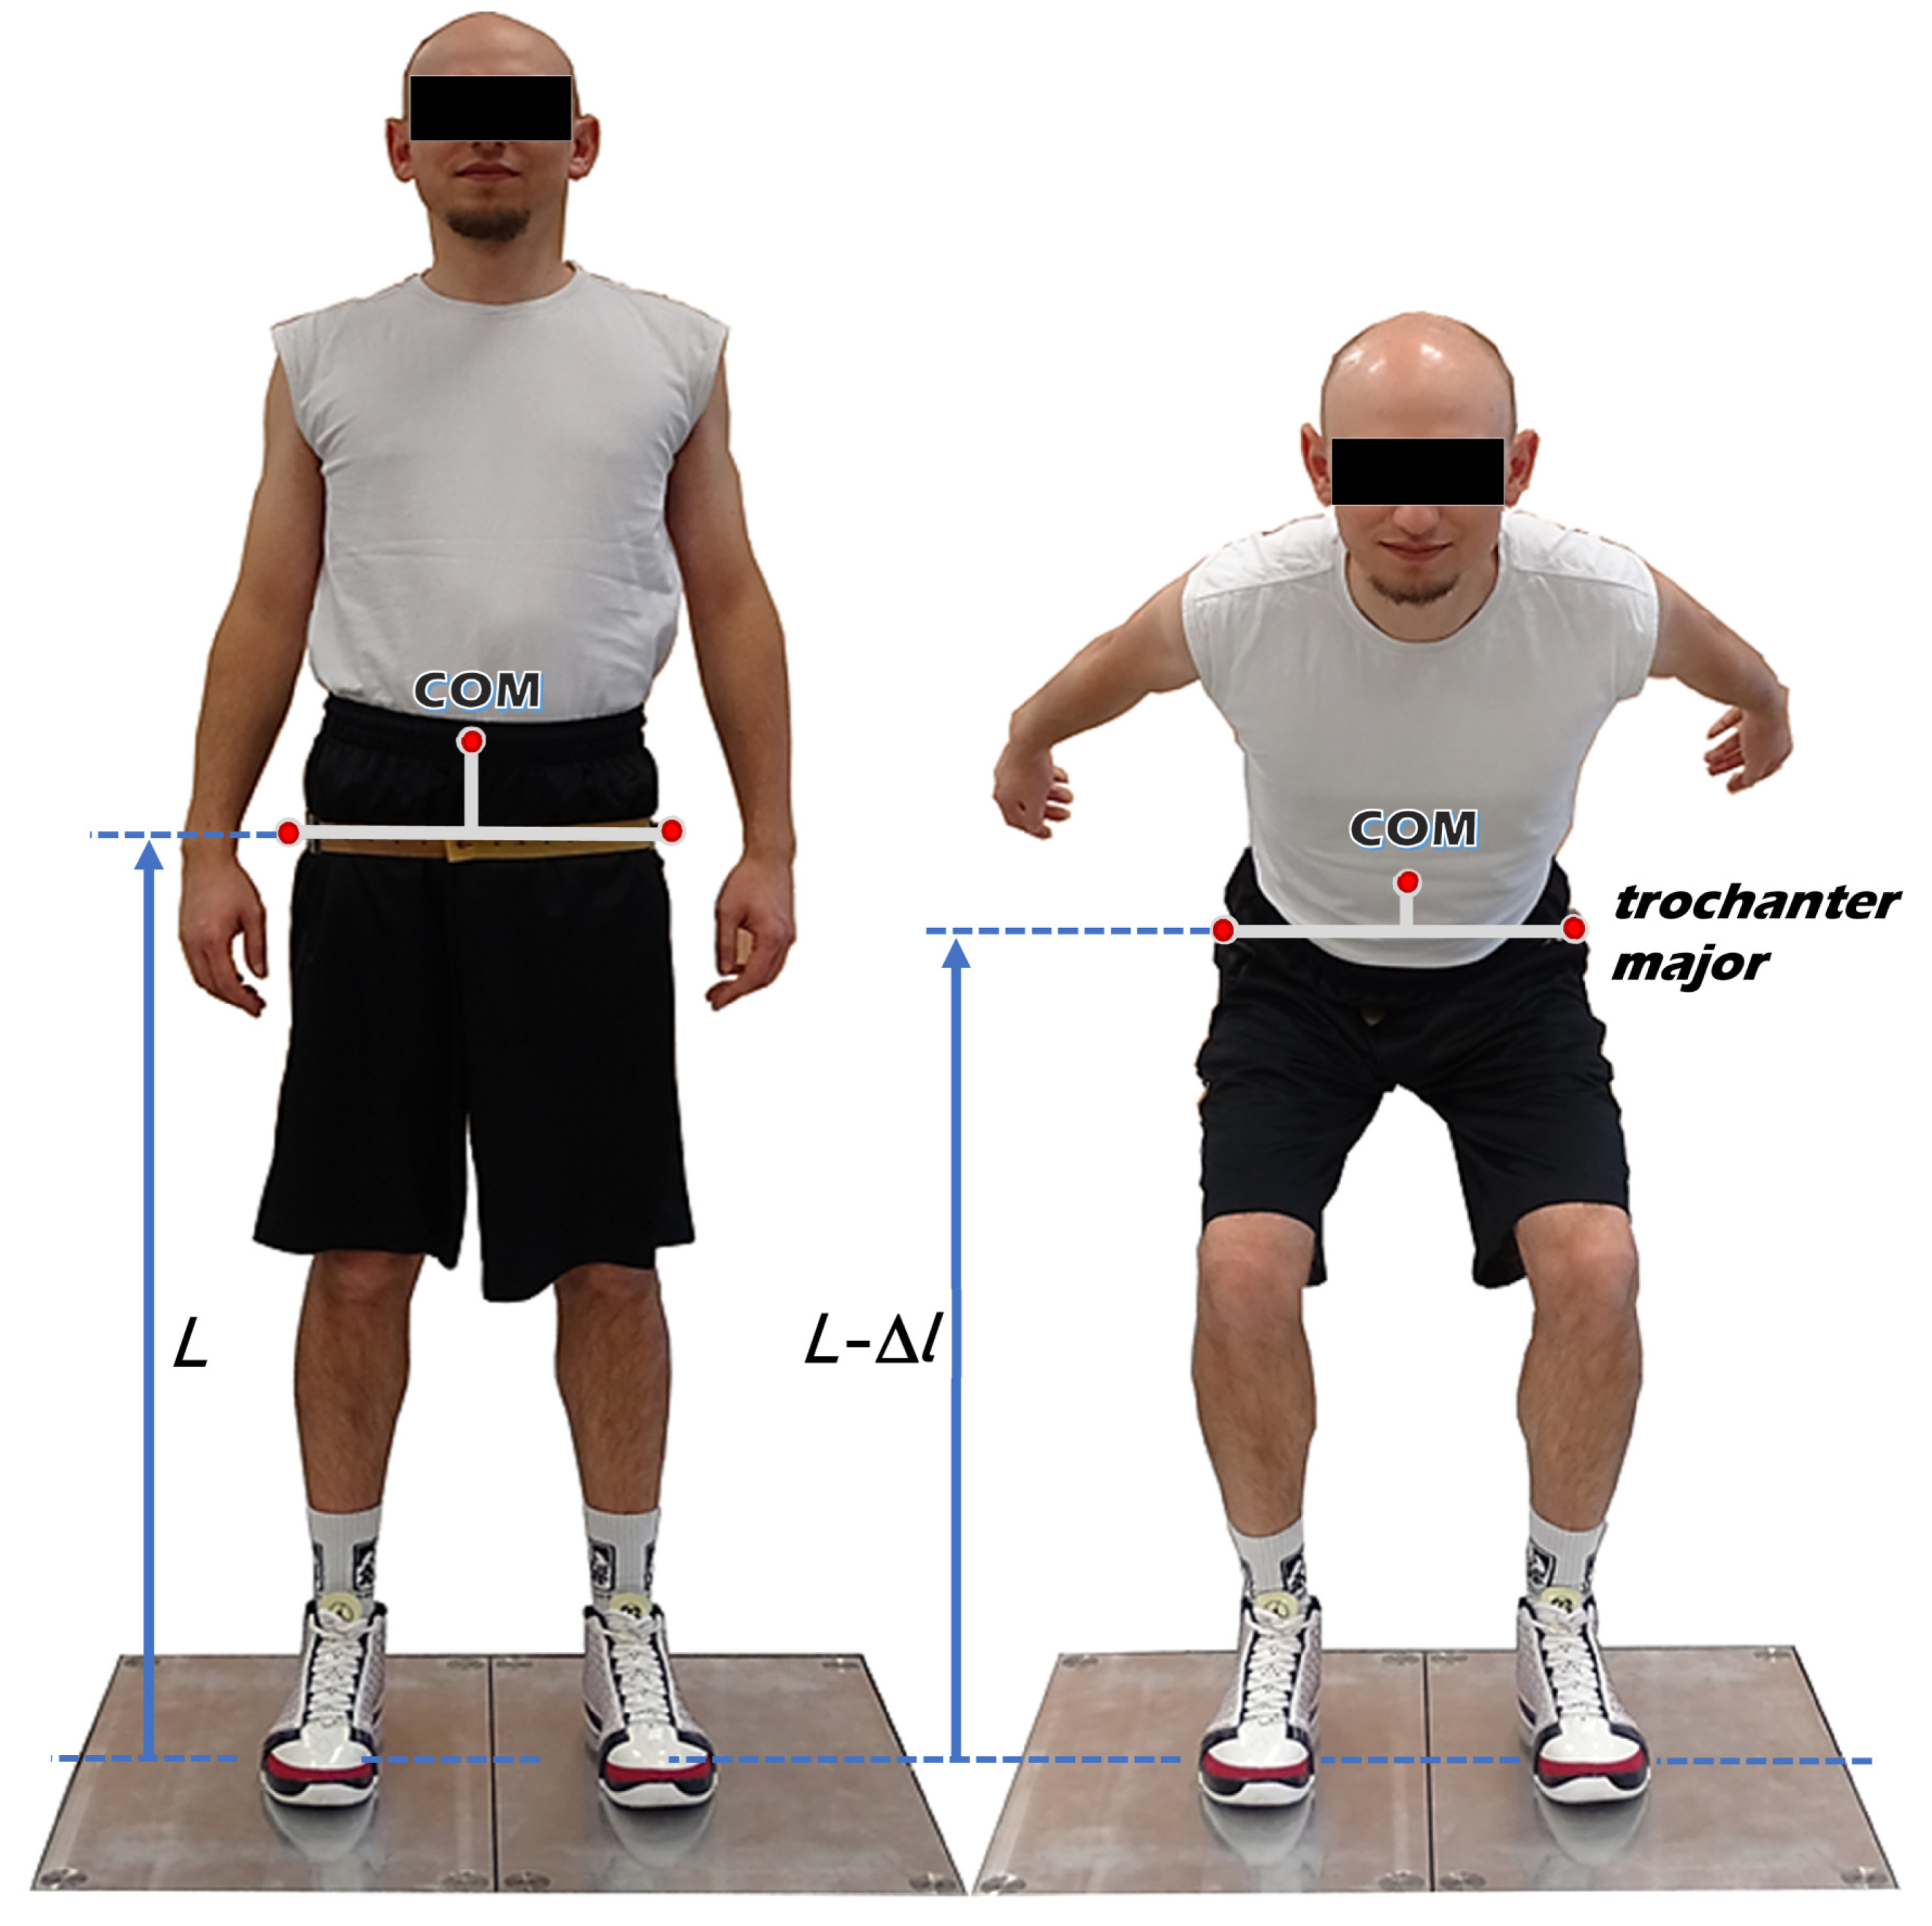
The human body performing a vertical jump can be modeled according to the assumptions of the spring-mass model. This model contains a material point representing the total body mass, a massless and linear supporting “
leg-spring”, and a parallel source of force resulting from the active muscle actions involved in the take-off [
10]. Lower limbs perform the role of “
leg-spring” responsible for vertical COM movements. However, a simple spring-mass model has only a single “
leg-spring”, which represents both lower limbs. Therefore, to assess the inter-limb asymmetry of leg stiffness, a modification of the simple spring-mass model that takes into account the division of the “
leg-spring” into two separate “springs” is necessary (
Figure 1). Changes in the height of the greater trochanters of the femurs (conventional upper ends of the lower limbs) were assumed as the changes in the length (Δ
l) of the “
leg-springs”.
Ground reaction forces during CMJs were measured for each lower limb separately by using two force plates (Kistler 9286A, Winterthur, Switzerland). The kinematic data were recorded by a BTS SMART motion analysis system (BTS Bioengineering, Milan, Italy) based on passive markers that reflect infrared radiation. The system features six cameras recording reflected infrared radiation with a frame rate of 120 Hz. To facilitate synchronization of the measurements, the force plates sampling rate was set at 240 Hz. BTS SMART Analyzer software aided in synchronizing the recorded data.
Before the test, all participants underwent a warm-up that consisted of a 10 m continuous shuttle run until reaching 150 bpm of heart rate. Heart rate was measured using a RCX5 heart monitor (Polar Electro, Kempele, Finland). Participants were also given the opportunity to practice the measuring task until they felt they were fully prepared. The passive markers were located at the height of the greater trochanters of the femurs on both sides of the body to record changes in “
leg-springs” length. The participants performed three times a single two-legged CMJ with arm swing to the maximum height with 20 s rests between jumps. Before the jump, the participant stood upright with each foot on a separate force plate. At a signal, the participant performed a vertical jump, preceded by rapid countermovement of the lower limbs and arm swing. Landing was performed on the same force plates as countermovement and take-off. CMJs included an arm swing to maximize the jump height (maximal performance task). Attention was also drawn on simultaneous take-off from both lower limbs. The analysis considered the highest CMJ performed by each participant. The jump height (
h) was calculated based on the duration of the flight phase (
tf):
where
g is the acceleration due to gravity.
Leg stiffness (
K) was determined based on the method described by Struzik and Zawadzki [
28] as a ratio of change in ground reaction force (Δ
F) to the respective change in the length of the “
leg-spring” (Δ
l). Leg stiffness was estimated separately for the right and left lower limbs and for the phases of countermovement and take-off. Countermovement is understood as lowering the position through flexing lower limb joints to the maximal greater trochanters of the femurs displacements. Then, the take-off phase begins, which ends when the feet lose contact with the ground and the value of the ground reaction forces drop to zero. Leg stiffness was estimated in parts of the countermovement (between the lowest ground reaction force and the lowest height above the ground of the greater trochanter of the femur) and take-off phases (between the local maximum of ground reaction force from which ground reaction forces only decreased and the moment when the value of ground reaction forces drops to zero), where
F(Δ
l) profile was nearly linear (
Figure 2) [
28] i.e., when the value of the coefficient of determination
R2 was over 0.6 [
29]. The slope coefficient for the analyzed parts of the
F(Δ
l) curve is the numerical value of stiffness in these ranges. Only in these parts of the
F(Δ
l) curve the leg stiffness can be represented by a single value [
28].
The conceptual and methodological confusion surrounding leg stiffness makes it difficult to compare the results obtained in previous studies. Despite different definitions, the terms “leg stiffness” and “vertical stiffness” (defined as the ratio of changes in ground reaction force to the respective vertical displacement of the COM) were confusingly and interchangeably used [
9]. Many studies, despite the use of the term “leg stiffness”, actually refer to vertical stiffness. Therefore, in this paper, the phrase “leg (vertical) stiffness” is sometimes used to indicate that the quoted study actually refers to vertical stiffness rather than leg stiffness.
For each participant, the lower limb with the higher leg stiffness value was chosen as the dominant lower limb. Asymmetry in leg stiffness between dominant and non-dominant lower limbs was evaluated for the countermovement and take-off phases separately by using the Ratio Index (RI) modification [
30]:
where
KD is leg stiffness in the dominant lower limb, and
KND is leg stiffness in the non-dominant lower limb. The higher value of RI indicates the greater inter-limb asymmetry of leg stiffness, whereas RI = 0 indicates full symmetry.
The absolute value of the ground reaction force (
F) was also computed relative to body mass (
Frel). The legitimacy of such an approach can be explained by the effects of inertia on the absolute leg stiffness value [
31]. Additionally, to examine the obtained asymmetries in more detail, the analysis of the
F(t),
Frel(t), and Δ
l(t) waveforms was performed. All waveforms were time normalized to the longest suitable phase and expressed as %Max. This standardized the sampling rate (to 100) by resampling the signal. Normalization and interpolation of data were performed using the built-in align-and-resample function (coerce mode), which returned an output sample value equal to the input sample value that was closest to the output sample value in time. For each variable, phase, and side, the mean waveform and ± one standard deviation from the mean (SD) were calculated.
Statistical Analysis
All variables studied had a distribution close to normal. The Shapiro-Wilk and Lilliefors tests were used to examine the distribution of each individual variable. The analysis of the differences in leg stiffness between dominant and non-dominant lower limbs was based on a t-test for dependent variables. The coefficient of determination R2 was used as a measure of the quality of model adjustment of the trend line to the relevant part of the F(Δl) curve. Model adjustment was considered satisfactory when R2 > 0.6. The level of significance in all tests was set at α = 0.05. Intra-session reliability of leg stiffness measurements during the countermovement and take-off phase of the left and right lower limbs (from three CMJ repetitions of each participant) were assessed using the Pearson correlation coefficient (r), intraclass correlation coefficient (ICC), standard error of measurement (SEM), and coefficient of variation (CV) with the 99% confidence interval (assumed 1% margin of error). For SEM, a 90% sufficiently acceptable level of reliability was assumed. The Statistica 12 software package (Statsoft, Tulsa, OK, USA) was used for statistical calculations. Any other calculations were made using a Microsoft Excel 2016 spreadsheet (Microsoft Corporation, Redmont, WA, USA).
Detailed comparisons of the
F(t),
Frel(t), and Δ
l(t) waveforms between lower limbs were performed numerically, creating the
t-statistic trajectory (
Figure 3). In this way, the statistical parametric mapping (SPM{t}) paired
t-test of the spm1d algorithm in Python was calculated, determining significant clusters at the 0.05 alpha level and listing all probability values. Each cluster’s probability value is equal to or less than alpha. The clusters significantly different between the means for dominant and non-dominant lower limbs considering their variance are indicated by the gray bar box below the graph. Finally, the two graphs were combined, and the information from the
t-statistics was transferred to the horizontal bottom bar.
3. Results
Table 1 contains the values of the coefficients used for the assessment of intra-session reliability of leg stiffness during countermovement and take-off phases in two-legged CMJs. Leg stiffness during the countermovement phase is characterized by a greater CV (higher variance) but also a greater correlation (
r and ICC) between successive samples (jumps) than during the take-off phase. The SEM is relatively small (<0.5) in both phases, which indicates that with 99% confidence, or with 1% error, the measurement result is within ±1.1 for the countermovement phase and within ±0.5 for the take-off phase. The adopted convention was that CV < 20% was interpreted as high reliability (or low variability), 20% < CV < 40%—average reliability, and CV > 40%—low reliability (or high variability). ICC values less than 0.50 are indicative of poor reliability, 0.50–0.75 moderate, 0.75–0.90 good, and 0.90–1.00 excellent.
Table 2 presents the mean values (±SD) of leg stiffness in the countermovement and take-off phases of the CMJ. Statistically significant differences were found during the comparison of leg stiffness between the dominant and non-dominant lower limbs (
p > 0.00001) for both CMJ phases (countermovement and take-off). The values of leg stiffness were significantly higher in the dominant lower limb. Inter-limb asymmetry of leg stiffness reached 22.0% in the countermovement phase and 8.9% in the take-off phase.
Figure 4 presents
F(t),
Frel(t), and Δ
l(t) waveforms for the analyzed parts of the countermovement and take-off phases during a two-legged CMJ. There were significant differences between the dominant and non-dominant lower limbs during countermovement phase in the parts of
F(t),
Frel(t), and Δ
l(t) curves. Significantly higher values of the ground reaction force for the
F(t) and
Frel(t) waveforms in the dominant lower limb were recorded in the final part of the countermovement phase (
Figure 4A,E), after the COM reached its maximum countermovement velocity and started to decelerate to a velocity close to 0. Change in the length of the “
leg-springs” (Δ
l) was significantly higher in the non-dominant lower limb, as well as in the final part of the countermovement phase (
Figure 4C). There were no significant differences between the dominant and non-dominant lower limbs during take-off phase in the profile of
F(t),
Frel(t), and Δ
l(t) curves (
Figure 4B,D,F).
Mean value (±SD) of CMJ height was 0.45 ± 0.05 m. However, there were no significant relationships between CMJ height and inter-limb asymmetry of leg stiffness (in countermovement and take-off phases).
4. Discussion
The statistically significant differences in leg stiffness between the dominant and non-dominant lower limbs in the studied group of basketball players should be regarded as a negative phenomenon. Although no norms have been developed thus far for inter-limb differences in leg stiffness during single two-legged vertical jumps, the values of inter-limb asymmetry of leg stiffness equal to 22.0% in the countermovement phase and 8.9% in the take-off phase should be considered high and undesirable. Both of the abovementioned values exceed the 5%. Consequently, leg stiffness estimated for two-legged CMJ does not necessarily require an even stiffness distribution to the right and left lower limbs. Inter-limb differences in leg stiffness are likely to cause an uneven distribution of forces applied to each limb during jumping tasks. Therefore, leg stiffness (or inter-limb asymmetry of leg stiffness) can be used as an indicator of the risk of injury. Watsford et al. [
20] reported that the leg (vertical) stiffness of the involved limb (after hamstring strains) in the group of injured rugby players was significantly higher than that in the non-injured players during a one-legged hopping test.
Inter-limb asymmetry of leg stiffness may be due to slightly different lower limbs movement patterns during two-legged CMJ exhibited by different inter-limb values of ground reaction forces, change in the length of the “leg-springs”, or indirectly by angles in the ankle, knee, and hip joints during countermovement and take-off phases. A slight displacement of the COM to the left or right side of the body will increase the ground reaction force on that side and, therefore, may also cause inter-limb differences in leg stiffness [
32]. In the second part of the countermovement phase, after the COM reached its maximum countermovement velocity and started to decelerate to a velocity close to 0, there were significant inter-limb differences in the
F(t),
Frel(t), and Δ
l(t) curves (
Figure 4A,C,E). These significant differences may explain the substantial inter-limb asymmetry of leg stiffness in the countermovement phase. The dominant lower limb was characterized by higher ground reaction force and a smaller change in length of the “leg-spring” during the second part of the countermovement phase. However, for the take-off phase, profiles of
F(t),
Frel(t), and Δ
l(t) showed no significant differences in the curves between the dominant and non-dominant lower limbs (
Figure 4B,D,F). Inter-limb asymmetry of leg stiffness in the take-off phase was more than two times lower than in the countermovement phase. Thus, the inter-limb asymmetry of leg stiffness in the take-off phase may be mainly a consequence of the asymmetries in the preceding countermovement phase, or the inter-limb differences in the
F(t),
Frel(t), and Δ
l(t) curves are only subtle and do not cause statistical significance. Furthermore, the additional load to lower limbs that resulted from arm swing increased ground reaction force in the take-off phase [
33]. Therefore, inter-limb asymmetry of leg stiffness in the take-off phase can also be caused by an uneven execution of an arm swing.
Struzik [
9] noted significant inter-limb asymmetry of leg stiffness during a two-legged CMJ and ACMJ (akimbo countermovement jump, vertical jump preceded by the countermovement with hands resting on the hips) in the groups of physically active students. No other papers were found relating to the inter-limb asymmetry of leg stiffness during a two-legged CMJ. In the groups of men and women, the inter-limb asymmetry of leg stiffness in the countermovement phase were, respectively: 19% and 24% during CMJ, and 18% and 19% during ACMJ, whereas in the take-off phase, they were 11% and 10% during CMJ, and 12% and 12% during ACMJ, respectively. The dominant lower limb was characterized by higher value of peak ground reaction force in the take-off phase and lower values of change in the length of the “leg-spring” and flexion angle in the knee joint compared to the non-dominant lower limb [
9]. As in this study, there was a noticeable higher inter-limb asymmetry of leg stiffness in the countermovement phase than in the take-off phase. In the studied group of basketball players, higher asymmetry in the countermovement phase than in the take-off phase may result from frequent performing of fadeaway jump shots. Often, when performing a jump shot, the direction of the take-off is not vertical, but tilted backwards or to one side. Asymmetric execution of a countermovement may make it easier to obtain the direction of the take-off that will prevent the defender from blocking the shot.
Inter-limb asymmetry of leg stiffness may also be expected to impair sport performance. Clark [
22] reported that a group of rugby players obtained shorter sprint times (eight 35 m sprints with a 30 s active recovery between sprints) than a group of recreational runners. Rugby players were additionally characterized by higher leg (vertical) stiffness values and less inter-limb asymmetry in leg (vertical) stiffness. Clark [
22] stated that an enhanced ability to regulate inter-limb leg (vertical) stiffness asymmetry, in addition to enhancing performance, may reduce the risk of injury. It is possible to preserve mechanical efficiency and therefore reduce metabolic cost. Maloney et al. [
34] reported that faster athletes during change of direction performance exhibited greater vertical stiffness and lower inter-limb asymmetry in one-legged drop jump height than slower athletes. Bell et al. [
35] reported that peak force and peak power asymmetries greater than 10% can reduce ACMJ height by approximately 9 cm. Therefore, substantial inter-limb asymmetry of leg stiffness may also reduce jump height. However, there were no significant relationships between CMJ height and inter-limb asymmetry of leg stiffness (in countermovement and take-off phases) in this study. Thus, the observed inter-limb asymmetries of leg stiffness in the studied group of basketball players may have been present for a longer time, or may be the result of a specific technique of jump shots, during which the feet are usually placed in a non-parallel position.
Asymmetrical growth of the muscle groups in basketball players is caused by performing asymmetrical activities connected with the specific technique of this sport (such as dribbles, pivots, changes of direction, jump shots or layups) and the habitual use of the dominant body parts. Therefore, substantial inter-limb asymmetry of leg stiffness in the group of basketball players is not surprising. However, a lack of equal distribution of training loads on both sides of the body leads to substantial functional asymmetry and asymmetry in muscle force distribution, mainly in the area of the lower limbs. Unilateral training in basketball is unfavorable in some respects and is conducive to injuries [
36]. Therefore, as a practical application, we recommend coaches to correct inter-limb differences through bilateral and unilateral strength, balance, and core training with proper loads to both body sides. Such a procedure should reduce the risk of injury without reducing performance, since basketball players with a higher sports level are characterized by smaller inter-limb differences [
37].
One of the limitations of this study may be the sports level of the studied group of basketball players. Versic et al. [
37] reported that the first-division basketball players are characterized by lower asymmetry of lay-up jump height than the players from the second-division. Therefore, it is possible that elite-level basketball players would get different inter-limb asymmetry of leg stiffness values than the studied group. For future research, it is advisable to conduct leg stiffness measurements on groups of basketball players diversified in terms of their sports level.
Leg stiffness relates to the overall stiffness of the musculoskeletal structures of the lower limb rather than only to the musculotendinous system. Therefore, leg stiffness depends on the stiffness of all compliant tissues, including also ligaments, blood vessels, or bones [
31]. The profile of the
F(∆
l) curve, which in the countermovement phase and the take-off phase of a single two-legged CMJ is similar to linear, allowed for the calculation of leg stiffness in parts of these phases (
Figure 2). However, due to the substantial roles of inertia and damping on the
F(∆
l) relationship, especially during transient states, leg stiffness is not stiffness viewed in strict mechanical terms. Therefore, leg stiffness calculated from the described method [
28] should be termed quasi-stiffness, which is the ability of the human body to oppose external displacements with disregard of their profile in time [
31].


