Abstract
In many industrial systems, symmetry is the key to ensuring efficiency and reliability. For example, in electric vehicles, the driving system often requires high symmetry. As widely used motors, permanent magnet synchronous motors (PMSMs) are often used in highly symmetrical structures as the driving devices. Consequently, maintaining the symmetry of the system relies on the normal and stable operation of the PMSM, and it is necessary to diagnose faults in the PMSM in a timely manner. In PMSM fault diagnosis methods, frequency domain features of the stator current are extensively used. However, these features change with the switching of motor operating conditions, leading to difficulty of diagnosis in multiple operating conditions. Therefore, a fault diagnosis method based on a convolutional neural network (CNN) phase tracker is proposed in this paper. Through phase tracking and angular domain resampling, the fundamental frequency of stator currents in different operating conditions are aligned, so as to fix the distribution of frequency domain features and solve the problem of features changing with operating conditions. Experimental results show that the proposed method can resample the stator current signals with a small error, detect faults in a relatively short time with high accuracy, and diagnose fault type and severity level under multiple operating conditions.
1. Introduction
A permanent magnet synchronous motor (PMSM) is a type of motor that shows excellent dynamic performance and high reliability. It is widely used in electric vehicles, rail transit, smart manufacturing, and other fields. During the running of motors, performance degradation and even failure will inevitably occur, which seriously affects the reliability and safety of the whole system [1,2]. The two most common faults in PMSMs are the inter-turn short circuit fault (ITSF) and the irreversible demagnetization fault (IDF) [3]. ITSF refers to a short circuit between two or more turns winding coils in the same phase of the stator [4], whereas IDF refers to the weakening of the permanent magnets on the rotor [5]. The occurrence of this fault will cause the output torque of the motor to become oscillatory, and at the same time the increase in the heat may lead to further deterioration related to the fault. In order to ensure the operation of the system, fault diagnosis technology is critical in order to quickly detect and diagnose faults.
The motor fault diagnosis method emerged in the last century, but it has attracted considerable attention in recent years, with the rapid development and wide application of PMSMs [6]. Generally, motor fault diagnosis relies on signals measured using sensors to extract fault features, using these features for fault detection, classification, and fault severity estimation. Common fault monitoring signals include stator current, speed, torque, vibration, induced voltage, temperature, and some signals from other parts of the system that can reflect motor faults. Features extracted from these signals include statistical features from the time domain, frequency domain, and time-frequency domain; coordinate transformation features; rate of change; motor parameter estimation; and so on [7]. In the case of a motor fault, these features will also change in accordance with specific rules, and fault diagnosis can be realized by analyzing these changes. Taking ITSF as an example, when it occurs in a PMSM, odd harmonics will appear in the stator current, and the amplitude of the odd harmonics will increase with the severity of the fault [8]. Therefore, the frequency-domain conversion of stator current signals is carried out to extract the amplitude of odd harmonics as fault features, which is a common method for the diagnosis of ITSF. Similarly, this method can also be used in IDF diagnosis [9], although the order of extracted harmonics is different.
Among many PMSM fault diagnosis methods, frequency-domain features are the most common and simplest fault features used. However, these features have a great disadvantage, that is, they cannot work under nonstationary conditions [10], and when used in multiple operating conditions, a large number of samples are needed to learn features. The basic idea behind such a method is that the fault frequency of the motor is proportional to the fundamental frequency of the stator current; thus, when the fundamental frequency of the stator current changes under different operating conditions, the frequency domain features will also change accordingly. In order to solve this problem, researchers have proposed some methods based on signal decomposition. For example, in [11], the stator current under transient conditions is decomposed into the fundamental signal and the residual signal, and the root mean square (RMS) of the residual signal is used as the feature to detect ITSF. This method can realize motor fault detection under multiple operating conditions, but the RMS of decomposed signals cannot distinguish the types of faults. Another solution is to use order tracking. At present, order tracking is one of the commonly used techniques in multi-condition fault diagnosis. It changes the sampling rate in real time to ensure that sampling occurs at fixed-angle intervals, so as to keep the frequency-domain feature distribution of sensor signals unchanged under different operating conditions. The real-time adjustment of the sampling rate requires the cooperation of the sensor, which is suitable for rotating machinery [12]. However, order tracking based on hardware is not suitable for analysis of the stator current, so a computed order tracking method is needed.
There are several ways to achieve computed phase tracking [13], and these have different computational costs. For instance, an order tracking method using a speed sensor and a Kalman filter is proposed in [14]. This method requires one to obtain the motor speed at a high sampling rate, and makes it possible to introduce additional error and noise. Another method, using a phase-locked loop to realize the phase tracking of a rotor, was developed in [15], but the parameters of the phase-locked loop need to be adjusted, which limits the scope of application. The existing computed order tracking methods for motor fault diagnosis have various deficiencies, such as the requirements of the sampling rate, the manual adjustment of parameters, and a narrow working range. Therefore, a new phase tracker based on a convolutional neural network (CNN) is proposed in this paper, a method which uses a CNN model to replace the traditional filter and phase-locked loop, eliminates the trouble of manual parameter adjustment, and in which the working range can be adjusted flexibly. The main contributions of this paper are as follows:
- 1.
- A phase tracker based on a CNN is proposed, which can directly obtain the fundamental wave amplitude, frequency, and phase of the stator current. This method can automatically adapt the parameters according to historical operation data and does not require a manual adjustment step in computed order tracking.
- 2.
- A method of angular domain resampling and fault spectrum feature extraction is presented, which is based on the output of the phase tracker, in which the stator current is resampled without interpolation and aligned with same fundamental frequency. The resampling error is reduced by means of proper spectrum processing. The resampling speed of this method is faster than order tracking, and it can reduce the number of fault samples needed for training and improve the accuracy of fault diagnosis of a PMSM under multiple operating conditions.
The reminder of this paper is organized as follows. The basic techniques of the CNN and fault severity level assessment used in the proposed method are briefly introduced in Section 2. The proposed PMSM fault diagnosis method based on the CNN phase tracker is developed in Section 3. In Section 4, an experiment on a hardware-in-the-loop simulation platform is conducted for method validation and analysis. Section 5 presents our conclusions.
2. Preliminaries
There are three steps in the complete motor fault diagnosis process: fault detection, classification, and severity prediction. Among all the motor fault diagnosis methods, deep learning models are usually unable to build an end-to-end model due to the difficulty involved in obtaining training data and their poor anti-noise ability, so artificial features are required [16,17,18]. However, deep learning models have a strong representation ability and can be used as a part of a diagnosis method for feature preprocessing and other operations. Furthermore, most stator-current-based PMSM fault diagnosis methods have difficulty predicting severity. In this section, a brief introduction to the deep learning model and fault severity level prediction methods is provided to convey the main purpose of this paper more clearly.
2.1. Convolutional Neural Network
A CNN [19] is a kind of neural network, composed of several convolutional layers. By sharing parameters through convolutional kernels, the use of a CNN greatly reduces the number of parameters. Hence, CNNs are widely used in image and video recognition, recommender systems, and natural language processing, and have made remarkable achievements [20]. In motor fault diagnosis, CNN is usually used as a feature extraction model for time series [21,22]. Depending on the features of the input data, the convolutional kernels of the first layer can be one-dimensional or two-dimensional convolutional kernels, or both. After extracting features from the CNN, the fully connected layer or other models can be used to realize fault diagnosis. For example, CNN–long short-term memory (LSTM) [23] is a common structure. When the input features are multiple time series, such as three-phase stator currents, the processing of the convolutional layers will not destroy the time-domain distribution of the features, so the output of CNNs are still time series, which can be transferred to the LSTM model for fault diagnosis. To realize fault diagnosis using a CNN requires accurate manual feature extraction and a large amount of data, but actual motor fault operation data are hard to obtain, which can easily lead to model overfitting.
2.2. Fault Severity Level Assessment
Faults of differing severity have various influences on motor operation [24], and the corresponding maintenance measures that need to be taken are also discriminative, so it is necessary to assess the fault severity. Due to the influence of noise, it is hard to accurately estimate the fault severity based on the raw sensor signal. A more reasonable approach is to grade the fault severity according to the characteristics of motor faults [25,26], and then to predict the level. This assessment is actually a classification problem, so it can be implemented using various classification algorithms [27]. For motor faults, machine learning is usually used to diagnose fault severity, such as support vector machine (SVM) and random forest (RF) methods. Similarly to fault type diagnosis, severity diagnosis also depends on artificial features. For example, when a PMSM suffers from an inter-turn short-circuit fault, the specific fault frequency will appear in the stator current, and its amplitude is proportional to the degree of the inter-turn short circuit. When the fault severity is small, that is, the short circuit resistance is minor, the amplitude of the fault frequency will be tiny, so the estimation is difficult. The common solution is to separate the fault and noise signal from the original sensor data for analysis.
3. Proposed Fault Diagnosis Method
The fundamental frequency of the stator current changes when the motor is running in multiple operating conditions, which leads to a change in the fault frequency. In order to apply frequency-domain features to fault diagnosis in a PMSM under multiple operating conditions, a new method based on a CNN phase tracker is proposed. Figure 1 shows the flowchart of fault diagnosis in a PMSM using the proposed method. First, the appropriate phase tracker is trained on an artificial dataset according to the motor’s historical operation dataset. Then the phase tracker is used to convert original signals in time domain into the angular domain. After angular resampling, the fundamental frequency of stator current signals under any operating condition will be adjusted to the same, so the motor fault diagnosis can be performed by using the fixed frequency-domain fault features. At this point, the construction of a fixed frequency feature library and the diagnosis of a fault by matching samples with the library can effectively reduce the complexity of the method. In the testing phase, the real-time stator current signal is inputted into the trained phase tracker, and the obtained phase signal is used for resampling, and then the residual signal and its frequency-domain features are calculated. These features are inputted into the fault diagnosis algorithm to obtain the final result. In this method, both the training and testing phases only need to obtain the stator three-phase current signal as inputs, which are common feedback signals in almost any PMSM monitoring system. No other information or instructions are needed, so it can run in parallel with the PMSM control system and monitoring system.
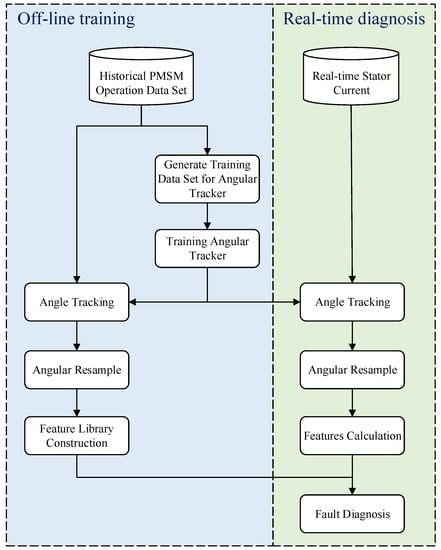
Figure 1.
Flowchart of the proposed fault diagnosis method.
3.1. CNN-Based Phase Tracker
If order tracking is directly applied to the PMSM system, the following problems exist. First, accurate electrical rotating speed feedback is needed. Generally, the PMSM is equipped with a rotating speed sensor and a three-phase stator current sensor. The rotating speed sensor can obtain motor mechanical rotating speed in r/min, which can be converted into electrical rotating speed in rad/s using Equation (1)
where is the electrical rotating speed, is the number of poles, and N is the mechanical rotating speed acquired by the sensor. It can be seen from Equation (1) that if such a conversion is performed, the number of poles of the motor needs to be obtained, that is, parameter identification is required.
Secondly, changing the sampling rate of the stator current sensor in real time may affect the running of other subsystems. For example, the control system generally requires the sampling rate of current feedback to be constant. If the sampling rate changes, the control system also needs to make corresponding modifications, which introduces additional work. Therefore, the sampling rate of the stator current sensor cannot be changed at will.
Although the stator current sensor cannot implement order tracking at the hardware level, a similar approach can be achieved at the software level. The stator current is a sine wave when in the normal status or fault severity is not high, and the amplitude, frequency, and phase of any sine wave can be calculated using dedicated algorithms. After the parameters of the fundamental wave are obtained, the order tracking at the software level can be realized by digital resampling, that is, via the phase tracking of the stator current.
Before building the CNN model, the training and validation dataset of the phase tracker are first constructed, which are a number of computer-generated sinusoidal wave sequences with certain noise, and the generation equation is
where denotes the i-th generated sequence; , , and represent the amplitude, frequency, and phase of i-th sequence, respectively; , , and represent the minimum and maximum values of stator current amplitude and that determined based on the actual operation data of the motor; , , and denote the minimum and maximum value of the stator current frequency and that determined based on the actual data; is drawn randomly from ; is a time series, , is the sampling rate of the stator current sensor; and L is the sequence length. is a noise sequence contained in the i-th sequence; it is assumed to follow a Gaussian distribution in this paper. A large number of sequences can be generated by changing , and , and it is not necessary to have the corresponding actual motor data; this allows the phase tracker to operate over a very wide range and ensure accuracy.
After generating the training sequences, the next step is to build a CNN-based phase tracker. The framework for the proposed CNN-based phase tracker is shown in Figure 2. The inputs of the CNN model in the training phase are the sequences generated by Equation (2), and the inputs in testing phase are the real-time stator current signals fed back by the sensors. The input signals are passed through the CNN, then three outputs are obtained, corresponding to the amplitude, frequency, and phase of the fundamental frequency of the input signals. The model consists of several convolutional layers and pooling layers stacked to form the former CNN part, and then the fully connected layer as the output layer. In the sequences generated, the larger the amplitude and frequency intervals, or the greater the noise, the more convolutional and pooling layers are required, according to experience. The activation function used by all neurons in the model is rectified linear units (ReLU), and the loss function is the sum of the mean square error of the three outputs that are normalized between 0 and 1. It is worth noting that phase trackers are not necessarily built using only CNN models; other neural networks can perform the same function. Compared with other neural networks, CNN has fewer parameters and a faster training speed, so the CNN model was chosen in this work.
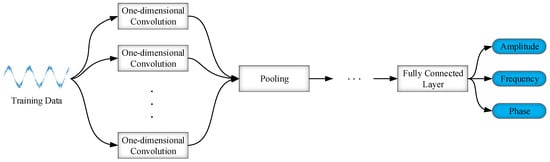
Figure 2.
Illustration of CNN-based phase tracker.
After the CNN model is trained using the stochastic gradient descent method, actual motor data or simulation data are used for testing. In the stator-current data used for testing, the amplitude should be within , the frequency should be within , and the noise amplitude should not exceed the maximum noise added when generating the phase tracker training dataset. As long as the stator-current data used in the test are within the previously defined range, the phase tracker can accurately output the amplitude, frequency, and phase of the stator current’s fundamental wave.
3.2. Angular Domain Resample
With the proposed CNN-based phase tracker, the signal collected by the stator current sensor can be converted into three time-domain signals, namely, the amplitude, frequency, and phase, among which the phase signal can be used for the angular domain resampling of the original signal. The principle of angular domain resampling is based on selecting the first sampling point of the signal as a benchmark and resampling every time it passes a set angle interval until traversing the entire signal. However, since the feedback signal of the sensor is discrete, if the resampling is not carried out physically, it cannot be guaranteed that there is a corresponding sampling point at every angle, so interpolation or approximate sampling is required. The angular domain resampling method is introduced below.
After resampling at fixed-angle intervals, the frequency of the stator current signal in any operating conditions will be aligned to the same frequency, that is, the frequency reference. If the fundamental frequency of the original signal is higher than the reference, it will be upsampled, or otherwise subsampled. Resampling in this way will require interpolation calculations and reduce the execution speed of the algorithm. Since the sampling rate of the stator current sensor is usually very fast, selecting a high frequency as the reference and subsampling the signals under all operating conditions can effectively improve the calculation speed. This method will introduce some resampling error, but this error can be reduced by means of feature extraction. The angle interval of resampling is calculated by
where is the resampling interval and is the frequency reference, which should be chosen manually. Since no interpolation is carried out, resampling using only the original data will lead to a certain error in the fundamental frequency of the resampled signals, which will decrease with the increment of . However, a larger reference value means that more data will be discarded when the low-frequency signal is resampled, which will lead to a slow speed of the algorithm. Therefore, the selection of the reference value should be decided according to the actual situation. The odd harmonics of the highest fundamental frequency should be retained, so in this paper is selected as the reference value.
After the angle interval is calculated based on Equation (3), the phase signal is reselected with each sampling interval of ; if there is no corresponding point on the phase signal, the nearest point is selected. The next step is to record the index of each reselected point on the phase signal, and extract the point of the same position from the original stator current signal to obtain the angular-domain resampled signal.
3.3. Fault Feature Library Construction
The fundamental frequency of the stator current after angular domain resampling will become , but each sampling point may have a certain error. The next step is to minimize these errors by establishing a fault feature library. Common fault frequency domain features of PMSMs are proportional to the fundamental frequency of the stator current, so a small number of fault samples can be used to construct the fault feature library after fundamental frequency unification. Firstly, in the historical data of the PMSM, each kind of fault and various fault severities are selected uniformly. After phase tracking and angular-domain resampling with the proposed method, the samples for constructing the fault feature library are obtained. Since the amplitude of the fundamental frequency in the stator current is much larger than the fault frequency amplitude, in order to improve the accuracy of fault diagnosis, it is necessary to delete the fundamental frequency component from the original signal and retain only the residual signal for fault diagnosis. The residual signal is computed as follows:
where , , and represent the estimated value of amplitude, frequency, and phase of the i-th signal by the phase tracker; is the sampling of according to the index of i-th signal in the angular domain resampling; and is the i-th signal after angular domain resampling.
Then fast Fourier transform (FFT) is performed on these residual signals, and components with frequencies less than the highest fault frequency are retained. If the highest fault frequency is three times that of the fundamental frequency, components with frequencies less than are retained.
The deviation caused by resampling is reduced by dividing the FFT results into segments and merging them; that is, among all retained components, the average value of each adjacent Q components is taken as a new feature; Q is an integer and can be adjusted depending on the size of deviation.
3.4. Fault Diagnosis
The motor fault diagnosis procedure is divided into fault detection, fault classification, and fault severity prediction. After establishing the fault feature library with a small number of samples, motor fault detection and classification can be realized by matching features between the real-time stator current and the fault feature library. In the case of the fault severity prediction, it is necessary to learn the relationship between the fault frequency amplitude and the fault severity from the data. In an SVM model, the kernel function can map the complex nonlinear relationship, while having a certain smoothing effect. For this reason, the SVM model is used for the fault severity prediction, as shown in Figure 3. The real-time stator currents are first fed into the phase tracker. After completing the signal resampling, the FFT of the residual signals is performed, and then several similar samples can be found in the fault feature library. These similar samples and residual signals are fed into the SVM model for further determination. The specific diagnostic steps are shown in Algorithm 1.
| Algorithm 1 PMSM fault diagnosis based on CNN phase tracker |
| Input: PMSM stator currents, Output: Fault status, ; fault type, ; fault severity level,
|
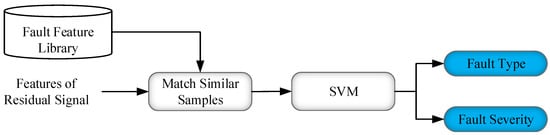
Figure 3.
Flowchart of fault diagnosis.
3.5. Comparison
Compared with traditional PMSM fault diagnosis methods based on frequency-domain feature analysis, the proposed method features two key components: the phase tracker and angular domain resampling, in which the phase tracker can be executed quickly after off-line training, whereas the angular domain resampling step cancels the interpolation algorithm to improve execution speed, so it can maintain the same level of timeliness as the traditional method. In constructing the fault feature library steps, the signals’ fundamental frequency is adjusted to a same value after sampling; thus, it is not necessary to use a large number of fault samples under different operating conditions, as in traditional methods. Only the minimum speed, maximum speed, and small samples of other speeds under fault conditions are needed. The proposed method reduces the demand for fault samples, and at the same time improves the generalization ability. Figure 4 shows an illustrative comparison between the proposed method and traditional methods. In the next section, experimental verification and further analysis are carried out using simulation data.
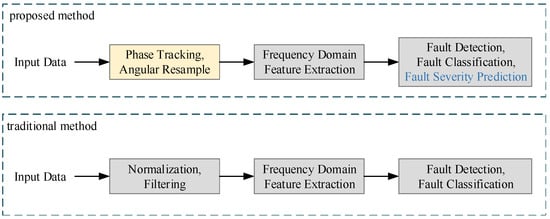
Figure 4.
Comparison between proposed method and traditional fault diagnosis method.
4. Experimental Validation and Discussion
In this section, the proposed method is experimentally verified using simulation data, and the results are analyzed in detail.
4.1. Introduction to Experiment Platform and Data Set
The experimental data were collected from a real-time PMSM fault injection simulation model, which was built on a hardware-in-the-loop (HIL) simulation platform. A schematic diagram of the simulation system is shown in Figure 5. It consisted of three parts, in which a computer was used to set parameters, control the simulation process, and record and display data. DSP performed PMSM control and the fault injection program; the inverter and motor models were implemented by the field programmable gate array (FPGA). During the simulation, all relevant parameters were set using the setup software in the computer, and then the motor control commands and fault injection commands were sent to the DSP controller. The controller generated corresponding driving signals to the inverter instantly, so the PMSM could output corresponding signals on the stator current, rotational speed, torque, etc. During the simulation process, all output signals of the PMSM were fed back to the controller and its computer through the sampling circuit.
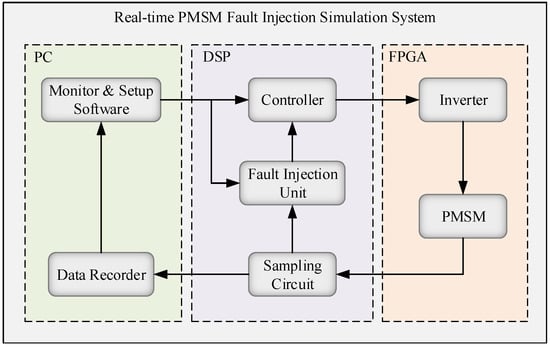
Figure 5.
Schematic diagram of real-time PMSM fault injection simulation system.
The system operation parameters and fault injection parameters can be set using the computer software. The system operation parameters include speed and load, and the fault injection parameters include injection time, fault type, and fault severity. After establishing these settings, the simulation system was run, and the three-phase stator current and PMSM rotating speed were fed back to the computer and recorded. The DSP chip used in the simulation system was TMS320F28335, in which the motor control program and fault injection program were executed. The main function of control program was to receive the three-phase stator current feedback from the motor, modulate the drive signal of the inverter by using a vector control strategy, and output the drive signal of each transistor of the three-phase inverter through digital I/O pins. The main function of the fault injection program was to superimpose an additional signal in the motor feedback stator currents, causing the motor to operate in the same state as the fault conditions, so as to realize software fault injection. The principle of fault injection is discussed further in [28]. The inverter received the drive signal from DSP, generated the three-phase voltage, and then transferred this to the PMSM model. The PMSM model calculated the state of the motor according to the motor equation, and outputted the three-phase stator current, rotating speed, electromagnetic torque, etc. All programs in the computer were realized through the MATLAB platform, including the simulation control software and fault diagnosis program. The motor parameters used in the experiment are shown in Table 1; it was a small power PMSM for a drive system.

Table 1.
Parameters of PMSM.
In the simulation model, the PMSM has a constant load, so only rotating speed setting values were considered as operating conditions. Under each condition, three kinds of data—namely, normal, ITSF and IDF data—were collected for the experiment regarding the fault diagnosis method. The motor rotating speed ranged from 500 r/min to 1800 r/min, so operating conditions consisted of four rotating speeds, i.e., 500, 1000, 1500, and 1800 r/min. Fault severity was set at three levels of 3%, 5%, and 10%, respectively, to simulate corresponding degrees of short-circuit and demagnetization. With the addition of the normal data, there were four levels of fault severity in each condition. Table 2 shows the settings used for the experimental dataset. According to the range in Table 2, there were three levels of each fault in each condition, so there were 24 groups of fault data and 4 groups of normal data in four operating conditions.
Table 2.
Settings of the experimental data set.
The sampling rate of the stator current fed back by the PMSM was 25 kHz. In order to collect enough samples, the data under normal and fault conditions were continuously sampled for 30 s. Under the same operating conditions, the speed set value was unchanged, but the actual speed of the motor fluctuated to some extent, and the sensor was affected by noise and measurement errors, so the stator current signal collected was not an ideal sine wave, as shown in Figure 6. For the faulty signal, only weak PMSM faults were studied in this experiment, so the change in the stator-current signals when a fault occurred was small, and there were no obvious fault symptoms. As a result, faults were invisible and could only be diagnosed using a specific algorithm.
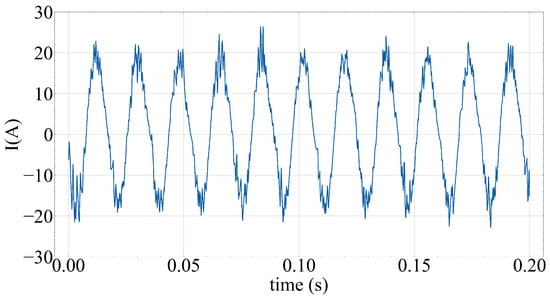
Figure 6.
Normal stator current in 500 r/min.
Figure 7 shows the stator current spectrum of ITSF with four different fault severity levels under 500 r/min. It can be seen that the amplitude of the third harmonic increased with the aggravation of the fault, but was relatively small compared with the fundamental frequency amplitude.
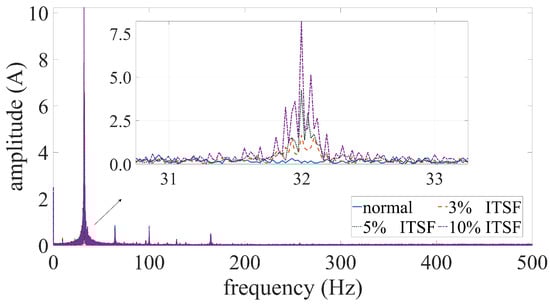
Figure 7.
The stator current spectrum of ITSF with different severity levels at 500 r/min.
4.2. Experimental Results and Analysis
To construct a phase tracker, the training dataset of the phase tracker needs to be generated first. According to statistics of the collected experimental data, since the load was constant and the amplitude of stator current did not change much, it was assumed to be [5, 30]; the fundamental frequency range of the current was [25, 130]. Considering the requirement of diagnostic rapidity, the diagnostic period was set to 0.1 s, so the input sequence length of the phase tracker was 2500. A total of 10,000 sequences with different amplitudes and frequencies were generated using Equation (2). The CNN model was trained by taking these sequences as the input and amplitude, frequency, and phase as the output. There were seven layers of the CNN constructed in this experiment; the first four layers were alternately stacked with a convolutional layer and average pooling layer, whereas the last three layers were fully connected. The last layer did not use an activation function, and the activation functions of the other layers were all ReLU.
The entire model had only 160,000 parameters, and the training time on a GTX1080Ti GPU was only a few minutes. The phase tracking result for a normal stator current at a rotating speed of 500 r/min is shown in Figure 8. In fact, the phase tracker acts as a phase lock loop, but can acquire amplitude, frequency, and phase at the same time, without the manual adjustment of parameters and with a larger range of operation. After the phase of each sampling point of the stator current was obtained by the phase tracker, angular domain resampling was performed, and the angle interval of sampling was 0.0905 calculated by Equation (3). After resampling at this interval, the fundamental frequency of the stator current at all rotating speeds became 360 Hz. Figure 9 shows the stator current after resampling at 500 r/min, and Figure 10 presents the spectrum diagrams of normal stator currents after resampling under four operating conditions.
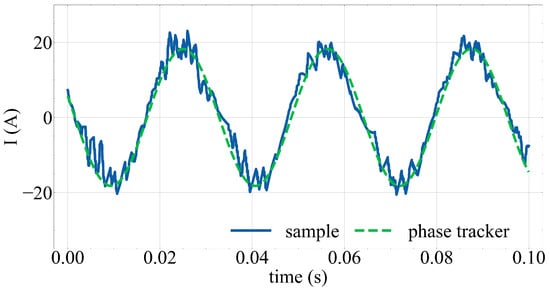
Figure 8.
Phase tracking of normal stator current at 500 r/min.
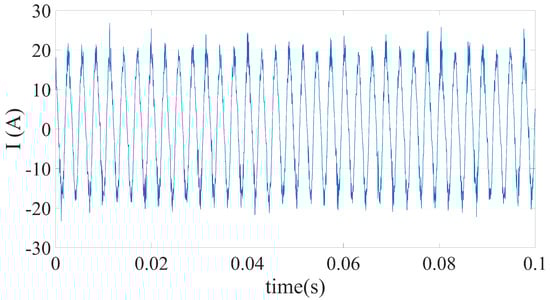
Figure 9.
Normal stator current after resampling at 500 r/min.

Figure 10.
Frequency spectrum of normal stator current after resampling in four operating conditions.
It can be seen that the fundamental frequency of the stator current under different conditions was aligned to 360 Hz after resampling, but there was a very small error. In the resampling process, the point closest to the set value of the sampling interval is directly selected instead of using an interpolation algorithm, and the sensor sampling rate is constant, so the actual sampling interval is not always equal to . Therefore, the actual sampling interval needs to be recorded and the residual calculated according to the actual sampling interval.
After the residual signals were obtained from Equation (4), FFT was applied to obtain the residual spectrum. Considering that when ITSF occurs in PMSM, the fault frequency is an odd times of the fundamental frequency, and that resampling also has certain errors, all components less than 1500 Hz were retained in the residual spectrum. As mentioned above, in order to make up for the spectral error caused by angular domain resampling, the spectral coefficients were divided into ranges and combined. In this experiment, the rotating speed distribution was not wide, so the error caused by resampling was very small, and the width of the range was set to 30. That is, every 30 spectral coefficients were averaged once, and the resulting mean sequence was taken as the spectral features. Figure 11 presents an example of segmenting and merging operation, in which the number of coefficients is greatly reduced, which can eliminate the errors caused by resampling and noise to some extent. In addition, the amplitude of the fault frequency is not only related to the severity of the fault, but is also related to operating conditions of the motor. Therefore, the fundamental frequency amplitude and frequency obtained by the phase tracker were added as the residual features.
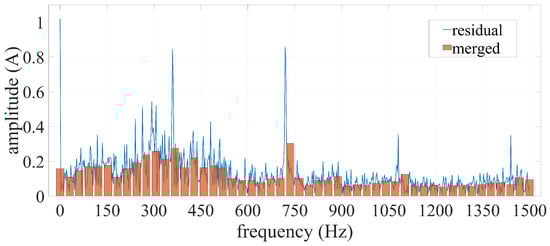
Figure 11.
Examples of segmenting and merging the spectral coefficients of residual signals.
According to the above discussion, the residual features included the spectrum coefficient and the amplitude and frequency outputted by the phase tracker, and these features were taken as the sample features of diagnostic algorithm to realize PMSM fault diagnosis. Before constructing the fault feature library, first of all, all the data were divided into the training set, validation set, and test set, in order to test the proposed method in the performance of multi-condition fault diagnosis. In this experiment, the data obtained at 500, 1000, and 1800 r/min were divided into training sets and validation sets with the ratio of 7:3, and the data obtained at 1500 r/min were taken as the test set to verify the diagnostic performance of the algorithm under conditions other than the training set. As a comparison, the traditional motor fault diagnosis method using an SVM [29] and RF [30,31] based on the fault frequency features of the stator current was tested using the same data set division, and the fault detection, fault type classification, and fault severity level prediction were compared, respectively. To compare the performance of each method with these three tasks, a unified indicator of accuracy was used for comparison, that is, we measured the proportion of samples of which the predicted values were consistent with the true values according to the total number of test samples. A statistical table of the accuracy and execution time per sample of the experimental results is shown in Table 3.
Table 3.
Accuracy for different data sets.
It can be seen in Table 3 that both methods were able to accurately realize fault diagnosis under the existing conditions on training set, but in the test set, the diagnosis performance of the traditional SVM and RF method based on fault frequency features was not good, whereas the proposed method maintained high diagnostic accuracy. Although there is still room for improvement in the prediction of fault severity on the test set, with the main bias concentrated on samples with a fault severity of 3% and 5%, the experimental results imply that the proposed method improves the accuracy of motor fault diagnosis under different operating conditions, and can be trained with partial fault samples and diagnose samples under conditions outside of the training set. Based on the comparison of these methods, the main difference of the proposed method is that the stator current is processed through the phase tracker and angular domain resampling. Therefore, it can be shown that phase tracking and angular domain resampling are effective methods to improve the accuracy of fault diagnosis in the multi-condition motor.
From the perspective of execution time, the proposed method requires neural network calculation, so the execution time is longer than that of the traditional method, but it still can meet the requirement of a diagnosis time within 0.1 s. Depending on the actual sampling rate of the stator current sensor, the phase tracker will define different input sequence lengths and the execution time may vary, which is an issue to be considered.
4.3. Discussion
Firstly, based on the experimental results, the proposed method can significantly improve the accuracy of fault diagnosis under multiple operating conditions. When the sampling rate is sufficient, only fault samples in partial operating conditions can be used to complete the fault diagnosis in other intermediate operating conditions. Compared with the methods in [29,30,31] that use a large number of training samples and complex artificial features, the proposed method is based on traditional fault features and is still effective under multiple working conditions, reducing the number of fault samples required by the diagnostic algorithm and helps to solve the problem that fault samples are rare and difficult to obtain at present. Considering that most PMSM control systems have stator three-phase current feedback, and the fault frequency domain features are not affected by PMSM types and parameters, this method can be applied to most PMSM fault diagnoses.
The phase tracker based on CNN aligns the fundamental frequency of the stator current, so it can also be used by fault diagnosis algorithms with frequency domain features or residual signals as inputs. The proposed method has good portability. According to the input of different algorithms, the output of the phase tracker, the resampling signal, residual signal, and other intermediate components can be extracted as features for multi-condition fault diagnosis.
The phase tracker can obtain the corresponding phase of each sampling point, and the phase signal can be used for other aspects in addition to the resampling step of the proposed method, such as complementary filtering with the electromechanical angle obtained by the sensor to improve the control performance.
Some factors have an impact on the final fault diagnosis performance but have not been fully considered. For fault symptoms, this paper only considers faults that cause an increase in the magnitude of specific harmonics; other faults with special symptoms may not be properly diagnosed. Another concern is the training of neural networks. Due to the existence of environmental noise, phase tracking cannot be completely accurate. Different model structures and parameters may cause different loss values when the model converges. Although the phase tracker has three outputs, a single total loss value may not accurately reflect the quality of training, which is worth considering. Moreover, the hyperparameters in the model include the length of inputs and the number of network layers and neurons, and it is hard to summarize a suitable hyperparameter setting scheme at present.
The proposed method also has some shortcomings, such as the fact that the anti-noise ability depends on the error between the artificially added noise distribution and the actual stator current sensor noise distribution; therefore, the performance of the phase tracker depends entirely on the generated training dataset. Thus, a transfer learning method can be added to the training of phase tracker to improve its accuracy with regard to actual data. Due to the use of a neural network, the model parameters of proposed method are more numerous than those of traditional methods and the execution speed is slower. It would be worth considering a faster method to achieve phase tracking.
5. Conclusions
In this paper, a multi-condition PMSM fault diagnosis method based on a CNN phase tracker is proposed. By tracking the amplitude, frequency, and phase of the stator current and conducting angular-domain resampling, the fundamental frequency of the stator current is aligned, so as to make the fault frequency distribution consistent under different operating conditions, reduce the training samples required by the diagnosis algorithm, and improve the performance of PMSM fault diagnosis under multiple operating conditions. The experimental results show that the proposed method can maintain high diagnostic accuracy in conditions outside the training set with a small number of training samples and without extracting complex artificial features. Moreover, the shortcomings and possible future directions for the improvement of the proposed method have been analyzed. Nowadays, there are still some difficulties in motor fault diagnosis under multiple operating conditions. As a feasible and verified scheme, the phase tracking method proposed in this paper can provide a reference for other motor fault diagnosis methods.
Author Contributions
Conceptualization, Z.C. and K.L.; methodology, K.L.; software, K.L.; validation, K.L. and Z.C.; formal analysis, K.L.; investigation, K.L.; writing—original draft preparation, K.L.; writing—review and editing, Z.C.; visualization, K.L.; supervision, Z.C., T.P. and Y.W.; funding acquisition, Z.C. and T.P. All authors have read and agreed to the published version of the manuscript.
Funding
This work was supported in part by the National Natural Science Foundation of China (#62173349, #61790571, #U20A20186, and #62003206), in part by the Key Laboratory of Energy Saving Control and Safety Monitoring for Rail Transportation (#2017TP1002), in part by the Project of State Key Laboratory of High Performance Complex Manufacturing, Central South University (#ZZYJKT2020-14).
Institutional Review Board Statement
Not applicable.
Informed Consent Statement
Not applicable.
Data Availability Statement
Not applicable.
Conflicts of Interest
The authors declare no conflict of interest. The funders had no role in the design of the study; in the collection, analyses, or interpretation of data; in the writing of the manuscript, or in the decision to publish the results.
References
- Chen, Y.; Liang, S.; Li, W.; Liang, H.; Wang, C. Faults and diagnosis methods of permanent magnet synchronous motors: A review. Appl. Sci. 2019, 9, 2116. [Google Scholar] [CrossRef] [Green Version]
- Yin, J.T.; Xie, Y.F.; Chen, Z.W.; Peng, T.; Yang, C.H. Weak-fault diagnosis using state-transition-algorithm-based adaptive stochastic-resonance method. J. Cent. South Univ. 2019, 26, 1910–1920. [Google Scholar] [CrossRef]
- Ullah, Z.; Hur, J. A comprehensive review of winding short circuit fault and irreversible demagnetization fault detection in pm type machines. Energies 2018, 11, 3309. [Google Scholar] [CrossRef] [Green Version]
- Moosavi, S.S.; Djerdir, A.; Ait-Amirat, Y.; Khaburi, D.A. ANN based fault diagnosis of permanent magnet synchronous motor under stator winding shorted turn. Electr. Power Syst. Res. 2015, 125, 67–82. [Google Scholar] [CrossRef]
- Gao, C.; Nie, Y.; Si, J.; Fu, Z.; Feng, H. Mode Recognition and Fault Positioning of Permanent Magnet Demagnetization for PMSM. Energies 2019, 12, 1644. [Google Scholar] [CrossRef] [Green Version]
- Wang, Z.; Yang, J.; Ye, H.; Zhou, W. A review of Permanent Magnet Synchronous Motor fault diagnosis. In Proceedings of the 2014 IEEE Conference and Expo Transportation Electrification Asia-Pacific (ITEC Asia-Pacific), Beijing, China, 31 August–3 September 2014; pp. 1–5. [Google Scholar]
- Ebrahimi, B.M.; Faiz, J. Feature extraction for short-circuit fault detection in permanent-magnet synchronous motors using stator-current monitoring. IEEE Trans. Power Electron. 2010, 25, 2673–2682. [Google Scholar] [CrossRef]
- Maraaba, L.S.; Twaha, S.; Memon, A.; Al-Hamouz, Z. Recognition of Stator Winding Inter-Turn Fault in Interior-Mount LSPMSM Using Acoustic Signals. Symmetry 2020, 12, 1370. [Google Scholar] [CrossRef]
- Krichen, M.; Elbouchikhi, E.; Benhadj, N.; Chaieb, M.; Benbouzid, M.; Neji, R. Motor Current Signature Analysis-Based Permanent Magnet Synchronous Motor Demagnetization Characterization and Detection. Machines 2020, 8, 35. [Google Scholar] [CrossRef]
- Ruiz, J.R.R.; Espinosa, A.G.; Romeral, L.; Cusidó, J. Demagnetization diagnosis in permanent magnet synchronous motors under non-stationary speed conditions. Electr. Power Syst. Res. 2010, 80, 1277–1285. [Google Scholar] [CrossRef]
- Barendse, P.; Pillay, P. A new algorithm for the detection of faults in permanent magnet machines. In Proceedings of the IECON 2006—32nd Annual Conference on IEEE Industrial Electronics, Paris, France, 6–10 November 2006; pp. 823–828. [Google Scholar]
- Ding, C.; Zhao, M.; Lin, J.; Wang, B.; Liang, K. Transient feature extraction of encoder signal for condition assessment of planetary gearboxes with variable rotational speed. Measurement 2020, 151, 107206. [Google Scholar] [CrossRef]
- Wang, K.; Heyns, P.S. Application of computed order tracking, Vold–Kalman filtering and EMD in rotating machine vibration. Mech. Syst. Signal Process. 2011, 25, 416–430. [Google Scholar] [CrossRef] [Green Version]
- Li, Y.; Wei, Y.; Feng, K.; Wang, X.; Liu, Z. Fault diagnosis of rolling bearing under speed fluctuation condition based on Vold-Kalman filter and RCMFE. IEEE Access 2018, 6, 37349–37360. [Google Scholar] [CrossRef]
- Pezzani, C.M.; Bossio, J.M.; Castellino, A.M.; Bossio, G.R.; De Angelo, C.H. A PLL-based resampling technique for vibration analysis in variable-speed wind turbines with PMSG: A bearing fault case. Mech. Syst. Signal Process. 2017, 85, 354–366. [Google Scholar] [CrossRef]
- Hsueh, Y.M.; Ittangihal, V.R.; Wu, W.B.; Chang, H.C.; Kuo, C.C. Fault diagnosis system for induction motors by CNN using empirical wavelet transform. Symmetry 2019, 11, 1212. [Google Scholar] [CrossRef] [Green Version]
- Chen, Z.; Liang, K.; Ding, S.X.; Yang, C.; Peng, T.; Yuan, X. A Comparative Study of Deep Neural Network-Aided Canonical Correlation Analysis-Based Process Monitoring and Fault Detection Methods. IEEE Trans. Neural Netw. Learn. Syst. 2021, 1–15. [Google Scholar] [CrossRef]
- Chen, Z.; Xu, J.; Peng, T.; Yang, C. Graph Convolutional Network-Based Method for Fault Diagnosis Using a Hybrid of Measurement and Prior Knowledge. IEEE Trans. Cybern. 2021, 1–13. [Google Scholar] [CrossRef]
- Xu, K.; Feng, D.; Mi, H. Deep convolutional neural network-based early automated detection of diabetic retinopathy using fundus image. Molecules 2017, 22, 2054. [Google Scholar] [CrossRef] [Green Version]
- Gu, J.; Wang, Z.; Kuen, J.; Ma, L.; Shahroudy, A.; Shuai, B.; Liu, T.; Wang, X.; Wang, G.; Cai, J.; et al. Recent advances in convolutional neural networks. Pattern Recognit. 2018, 77, 354–377. [Google Scholar] [CrossRef] [Green Version]
- Zhang, Y.; Lei, Y. Data Anomaly Detection of Bridge Structures Using Convolutional Neural Network Based on Structural Vibration Signals. Symmetry 2021, 13, 1186. [Google Scholar] [CrossRef]
- Lee, H.; Jeong, H.; Kim, S.W. Detection of Interturn Short-Circuit Fault and Demagnetization Fault in IPMSM by 1-D Convolutional Neural Network. In Proceedings of the 2019 IEEE PES Asia-Pacific Power and Energy Engineering Conference (APPEEC), Macao, China, 1–4 December 2019; pp. 1–5. [Google Scholar]
- Zhao, R.; Yan, R.; Chen, Z.; Mao, K.; Wang, P.; Gao, R.X. Deep learning and its applications to machine health monitoring. Mech. Syst. Signal Process. 2019, 115, 213–237. [Google Scholar] [CrossRef]
- Otava, L. Implementation of PMSM inter-turn short fault detection using frequency analysis of stator currents. IFAC-PapersOnLine 2016, 49, 86–91. [Google Scholar] [CrossRef]
- Cai, B.; Wang, Z.; Zhu, H.; Liu, Y.; Hao, K.; Yang, Z.; Ren, Y.; Feng, Q.; Liu, Z. Artificial Intelligence Enhanced Two-stage Hybrid Fault Prognosis Methodology of PMSM. IEEE Trans. Ind. Inform. 2021. [Google Scholar] [CrossRef]
- Chen, Z.; Guo, R.; Lin, Z.; Peng, T.; Peng, X. A data-driven health monitoring method using multi-objective optimization and stacked autoencoder based health indicator. IEEE Trans. Ind. Inform. 2020, 17, 6379–6389. [Google Scholar] [CrossRef]
- Dineva, A.; Mosavi, A.; Gyimesi, M.; Vajda, I.; Nabipour, N.; Rabczuk, T. Fault Diagnosis of Rotating Electrical Machines Using Multi-Label Classification. Appl. Sci. 2019, 9, 5086. [Google Scholar] [CrossRef] [Green Version]
- Yang, C.; Yang, C.; Peng, T.; Yang, X.; Gui, W. A fault-injection strategy for traction drive control systems. IEEE Trans. Ind. Electron. 2017, 64, 5719–5727. [Google Scholar] [CrossRef]
- Zhao, C.; Li, Y.; Wessner, M.; Rathod, C.; Pisu, P. Support-Vector Machine Approach for Robust Fault Diagnosis of Electric Vehicle Permanent Magnet Synchronous Motor. In Proceedings of the Annual Conference of the PHM Society, Virtual, Nashville, TN, USA, 9–13 November 2020; Volume 12, p. 10. [Google Scholar]
- Tian, R.; Chen, F.; Dong, S. Compound Fault Diagnosis of Stator Interturn Short Circuit and Air Gap Eccentricity Based on Random Forest and XGBoost. Math. Probl. Eng. 2021, 2021, 2149048. [Google Scholar] [CrossRef]
- Martin-Diaz, I.; Morinigo-Sotelo, D.; Duque-Perez, O.; Romero-Troncoso, R.J. An experimental comparative evaluation of machine learning techniques for motor fault diagnosis under various operating conditions. IEEE Trans. Ind. Appl. 2018, 54, 2215–2224. [Google Scholar] [CrossRef]
Publisher’s Note: MDPI stays neutral with regard to jurisdictional claims in published maps and institutional affiliations. |
© 2022 by the authors. Licensee MDPI, Basel, Switzerland. This article is an open access article distributed under the terms and conditions of the Creative Commons Attribution (CC BY) license (https://creativecommons.org/licenses/by/4.0/).