1. Introduction
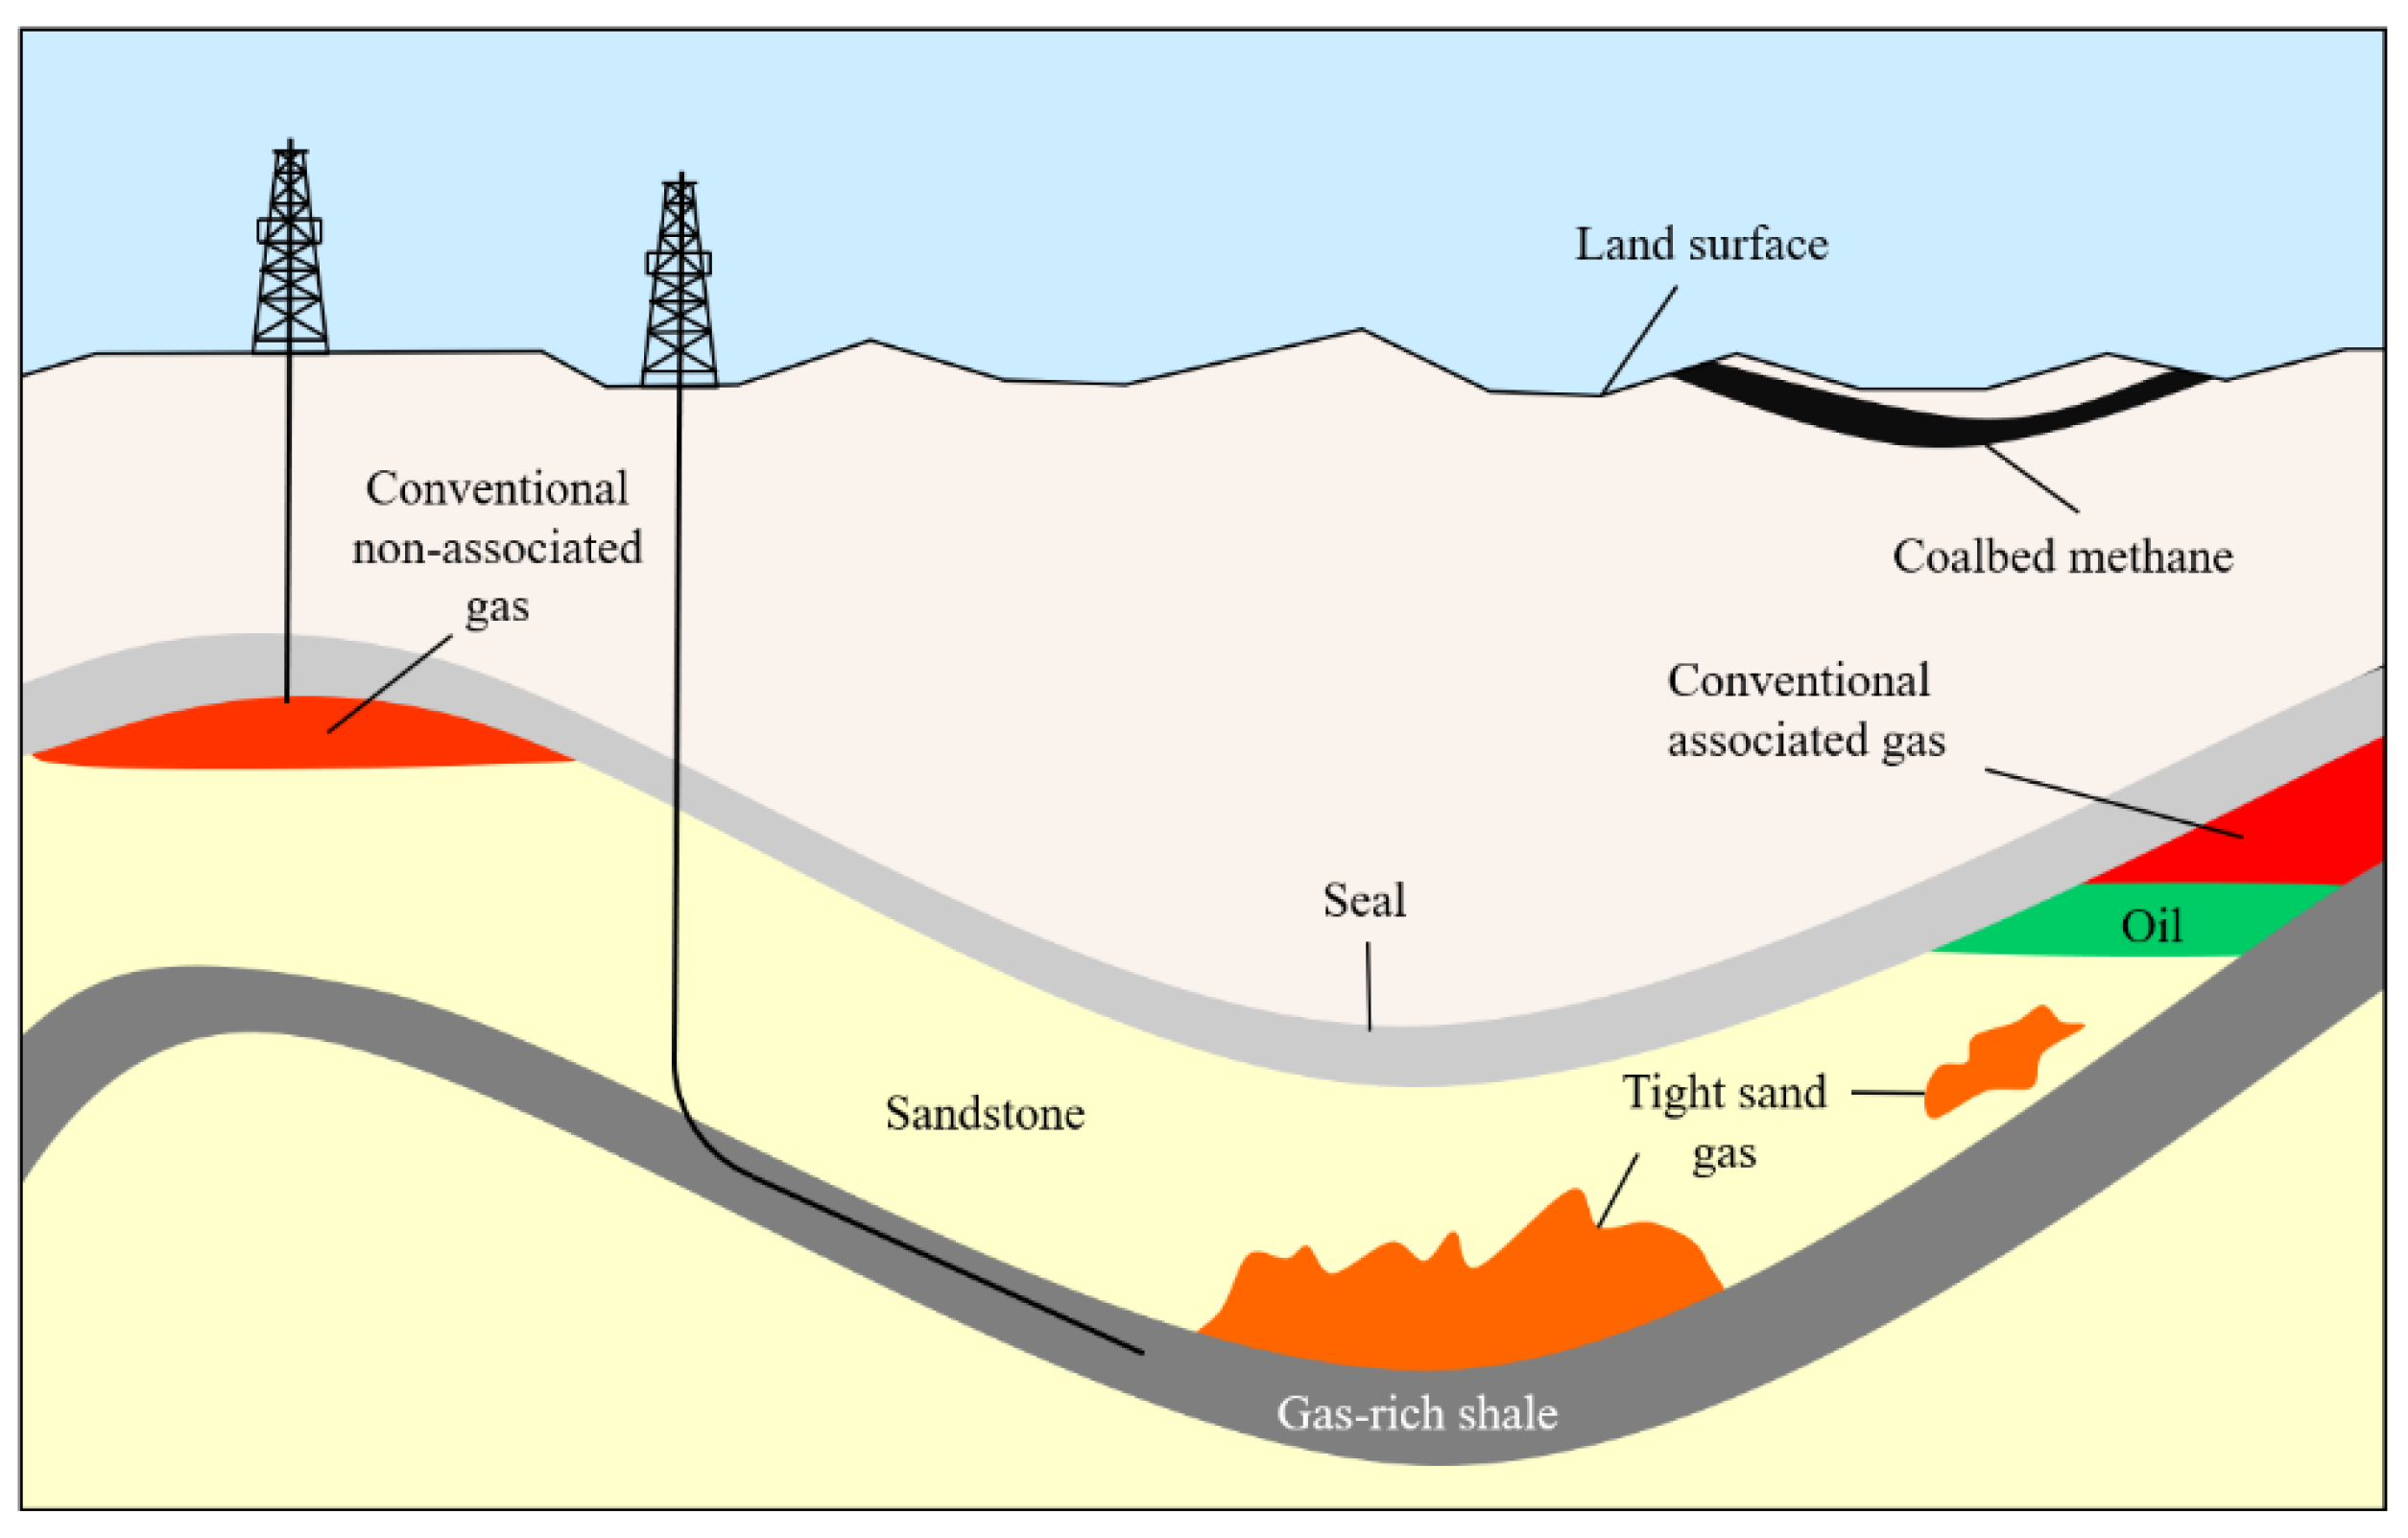
Resources that can replace current fossil fuels, such as the shale gas that is stored in shale layers all over the earth, are becoming more and more popular. In order to complement current vertical drilling techniques, horizontal drilling and hydraulic fracturing techniques have been developed while the first shale gas resource is being explored as an alternate energy source in the United States. By putting the drilling pipe horizontally into the gas field and the well, horizontal drilling is used as a technique to boost drilling productivity by expanding the surface area, as described in
Figure 1 below. Since the shale layer is deeper than the surrounding sedimentary rock, horizontal jointing is required and this greatly raises the chances of pipe joints distorting.
In order to drill relatively deep oil wells and gas chambers, a unique coupling with a strong resistance to high torque, compressive stress, and fatigue load is needed. The premium connection system is what this is known as. The premium connection typically undergoes additional sealing in the connection to prevent leaking, and fatigue performance is necessary to endure the vibration induced by the bending and twisting during excavation. The geometry of the connection element must be changed to accommodate the increased bottom hole pressure brought on by deeper drilling by deforming the connection thread, changing the screw pitch, or inserting grooves or shoulders. A novel connection type that has been created is anticipated to be advantageous for deep-sea exploration as well as shale gas extraction.
Recently, a significant amount of research has been carried out to improve the design of premium connection systems. The performance of the tubular goods, particularly the connection section, heavily influences the tube’s fluidic performance, which in turn heavily influences the development depth of oil and gas wells. The fluid connection system was assessed by Hong Ou Kim (1990) using mathematical modeling and hands-on testing. This is because, unlike conventional bolts, a fluid tube connection failure may result in a considerable loss of time and money. As a result, accurate connection design and manufacturing are needed [
1]. Japanese steel companies were primarily responsible for the design and development of the premium connection system in the early 1990s. In order to completely disperse the contact stress concentrated on the end threads, Yamamoto et al. (1990) designed the screw pitch lengths to differ from one another. Through simulation, the new connection system enhances properties such as abrasion resistance, leakage resistance, and bond strength. It also enhances the sealing performance by increasing the energy stored in the connection system [
2]. Special screw connections with metal-to-metal seals that have excellent resistance to leakage have been widely employed for fluid connections as the environments for oil and gas well development become more severe; however, the recent deepening of wells and gas definitions have changed this. A premium connection that can sustain strong compression, high external pressure, and severe bending has been sought. Stronger properties than those of the connection systems in use today are necessary. Takano et al. (2002) found that a negative load flank angle value improved the performance against tensile force, bending, and external pressure. Additionally, choosing the right value for the stabbing flank angle can improve the performance against compressive forces, and optimizing the corner radii can promote wear resistance [
3]. Recently, the difficulty in drilling crude oil and asphalt due to the depletion of petroleum resources has led to pumping using thermal well technology. On the other hand, thermal wells often have peak temperatures above 200 °C, thermal cycle loading is always employed, and pipe connections account for 80% of failures. In a thermal cycle scenario, Xie and Tao (2005) demonstrated that the connection portion’s finite element analysis is most suited for maintaining structural integrity and sealing [
4], including the metal-to-metal seal part. As mentioned previously, deep well drilling and gas well drilling necessitate the creation of a premium connection with high resistance, high torque, and compression performance for composite fatigue loads. However, increasing unconditional strength may not be cost-effective, thus Santi et al. (2005) suggested a design optimization strategy that only makes cracks susceptible to failure. Crack fracture zones were discovered using finite element modeling, full-scale fatigue testing, and cyclic load stress concentration factor (SCF) analysis [
5]. Since the late 2000s, as drilling technology and horizontal wells have advanced, the requirements for tensile strength, compressive force, combined pressure, comprising internal and external pressure, and bending have increased. Using a cyclic load, a thermal load cycle, and a limit load test, Xie (2006) designed the premium connection JFEBEAR. Due to the axisymmetric nature of the premium connection expressed in
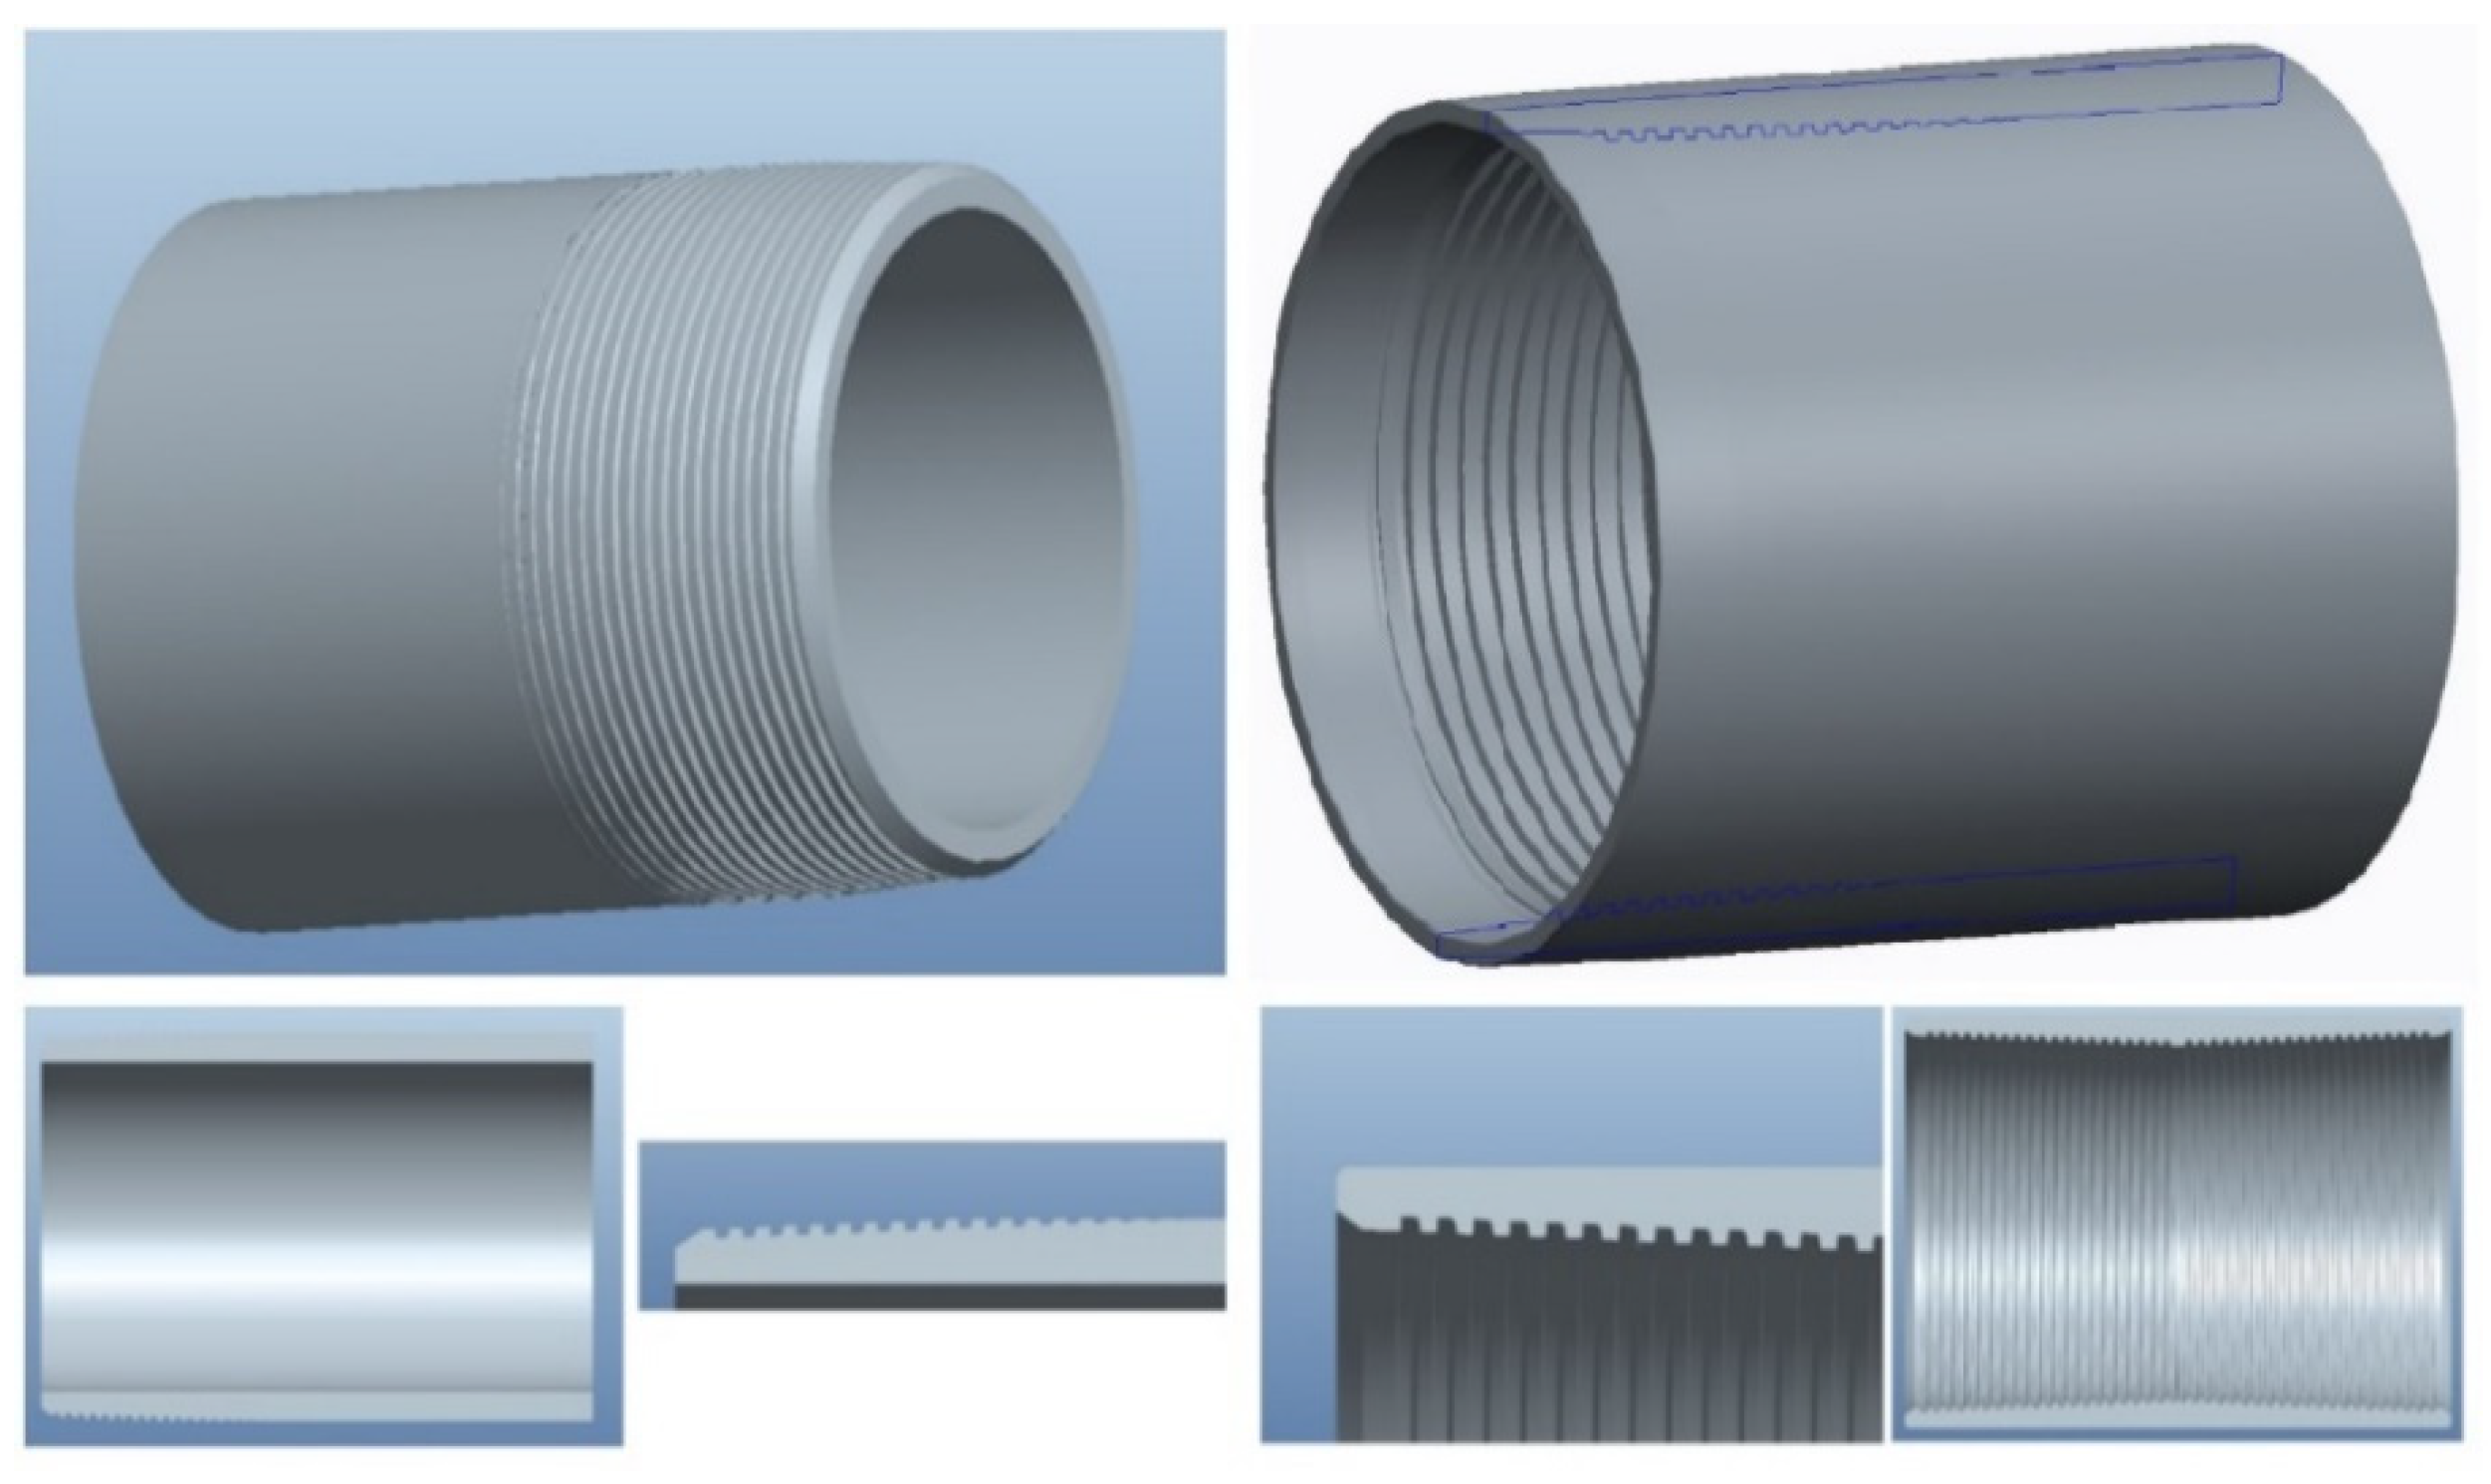
Figure 2, 3D interpretation is not considered [
6].
It is essential that the premium connection is already established, but the backup plan is also crucial. Using a material strain-rate model, Xie (2011) proposed a new method for connection assembly. Immediately following the connection assembly, axial stress, effective stress, and equivalent plastic strain were analyzed through simulation. The proposed modeling method provides an accurate relationship between the data of the real system and the simulation, allowing it to accurately represent the characteristics of the connection system in the load condition after the make up [
7]. F. Stewart et al. (2012) developed a friction test rig to perform repetitive sliding friction tests on the premium connection system, allowing for the precise measurement of various contact frictions associated with screw connections between tubular components. The friction coefficient is related to the lubrication parameter of lubricant film thickness and initial surface roughness [
8]. Since 2010, the development of refuse pipes and premium connections for shale gas drilling in China, where shale gas reserves are among the largest in the world, has become more active. Because the existing API standard casing connection design is incompatible with deep wells, gas wells, and harsh drilling conditions, Xu et al. (2012) developed a new premium connection that emphasizes the tensile strength and sealability of the joints. Comparing the simulated results of stress distribution and the mechanical performance of the developed special screw connection to the API standard screw connection [
9] provided the theoretical foundation for the design of the special casing screw connection. Galle et al. (2013) conducted a study on the variation in structural characteristics based on the variation in the load flank angle of buttress-type premium connection structures [
10]. One of the most important requirements for screw connections used in oil and gas wells is the resistance to high tensile loads. If the plastic deformation at an ever-increasing load is greater than the pin thread height, a jump-out will occur. To solve this issue, we analyzed the performance change relative to the load flange angle. Jump-out can be prevented if this angle is negative, but firing and wear are increased. Based on elastic dynamics, Xu et al. (2014) proposed a load and contact stress analysis method for an injection tube premium system. It has been investigated how differential equations of load distributions and their analysis methods work. The geometrical properties of the thread surface define the relationship between the load acting on the combined thread and the average contact stress of the load flange, and a new finite element method has been developed [
11].
There have been several approaches for dealing with the sealability of premium connection systems. Finite element analysis (FEA) for combined loads with tension was used by Goodman (2022) to calculate the leak constants for a generic premium connection using the triaxial criterion. Three leak constants are required for premium connections since the FEA results for the general premium connection better match a quadratic relationship. For the loads tested, internal leaking cannot happen without tension, and external and internal leakage can both happen at low pressures with enough tension. The triaxial limit curve of the leak should be mostly outside the pipe-body failure envelope in actual premium connections [
12]. A new energy dissipation analysis approach using a microslip shear layer mode was proposed by Yu et al. (2022) for the sealing performance of premium connections. Using a standardized regression coefficient method, the impact of various interface settings on the energy consumption of premium connections was addressed. The findings can enhance the analysis approach for metal seals and offer a theoretical roadmap for the microsealing failure mechanism of premium connectors under dynamic loads [
13]. For buttressed premium threaded connections with a helix angle, Chen et al. (2018) developed a nonlinear 3D elastic–plastic finite element model to examine the stress distribution characteristics on the sealing surface, shoulder, and thread. The findings indicated that the preload has a significant impact on the sealing properties of premium threaded connections and that the contact stress on the thread, sealing surface, and shoulder affects the joint’s ability to seal [
14]. The joint strength of premium connections with API buttress thread teeth can be calculated using methods proposed by Xu et al. (2019) based on elastic mechanics, taking into account the make-up torque and shoulder separation prevention. The suggested approaches more accurately capture the premium connection failure patterns and their significant impact on joint strength calculations, make-up torque management, and connection parameter design [
15]. A basic fretting fatigue test was carried out by Oku et al. (2017) to study the fretting fatigue process in the threaded connection. In this test, a substantial gross slip situation led to fretting fatigue failure at the center of the contact surface [
16].
In previous research cases, the load-free parts, such as sealability, integrity, and load flange angle of the threaded portion of the premium connection under tensile load, are the primary focus. When oil and gas fields are developed, the leakage of shale gas and oil may cause both economic loss and environmental contamination. Therefore, the sealing performance should be optimized so that leakage is minimized to the greatest extent possible. In the case of the premium connection design, however, a change in the parameters associated with the stabbing-free connection can also affect the sealing performance of the threaded component. To ensure good sealing properties, it is necessary to examine the von Mises stress characteristics of the threaded connection under a complex load [
17,
18]. Moreover, among the numerous domestic and international research examples, few studies have focused on flank-related parameters. Through a parametric study, this study elucidates the vibration and durability characteristics of the premium connection with respect to the parameters associated with the thread’s free portion and suggests the optimal design direction.
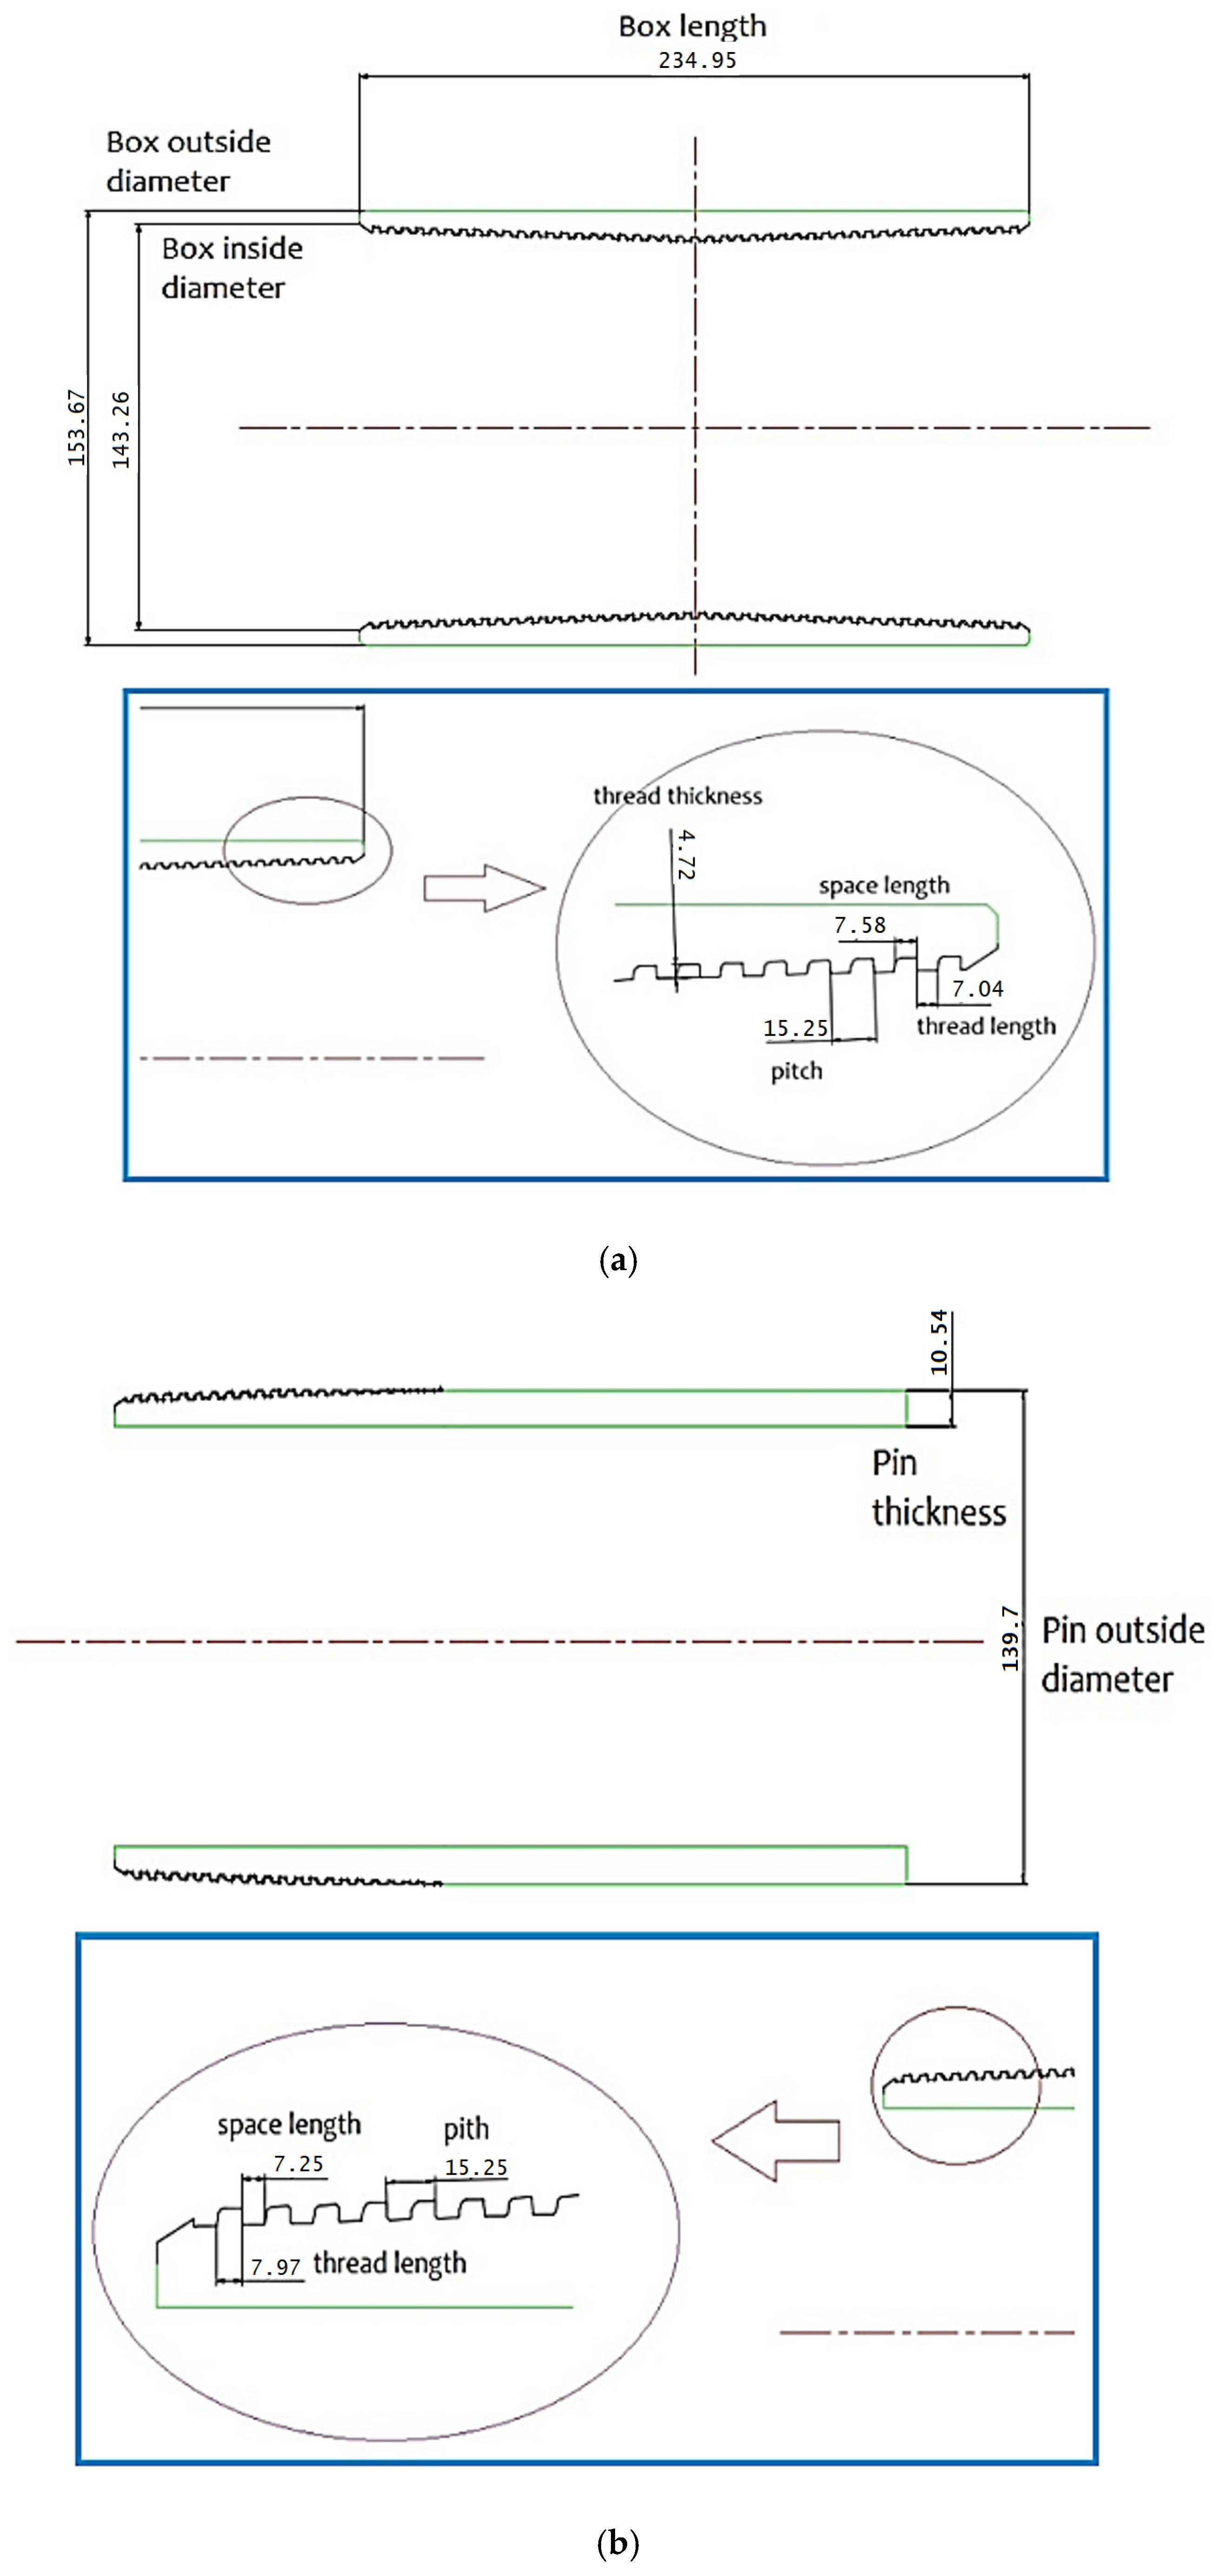
The primary focus of this paper is an analysis of the vibration and durability changes in threaded connections based on the American Petroleum Institute 5B basic buttress model in
Figure 3, along with the variation in the stabbing flank upper corner radius, as well as a comparison of the distinctions. The analysis employs the 2D axis symmetry model because the analytical results of the 3D model and the axisymmetric model are, in general, identical (see
Section 2). The 2D axisymmetric model is simpler than the 3D model and has the advantage of a faster analysis time. This paper comprises the following sections: In
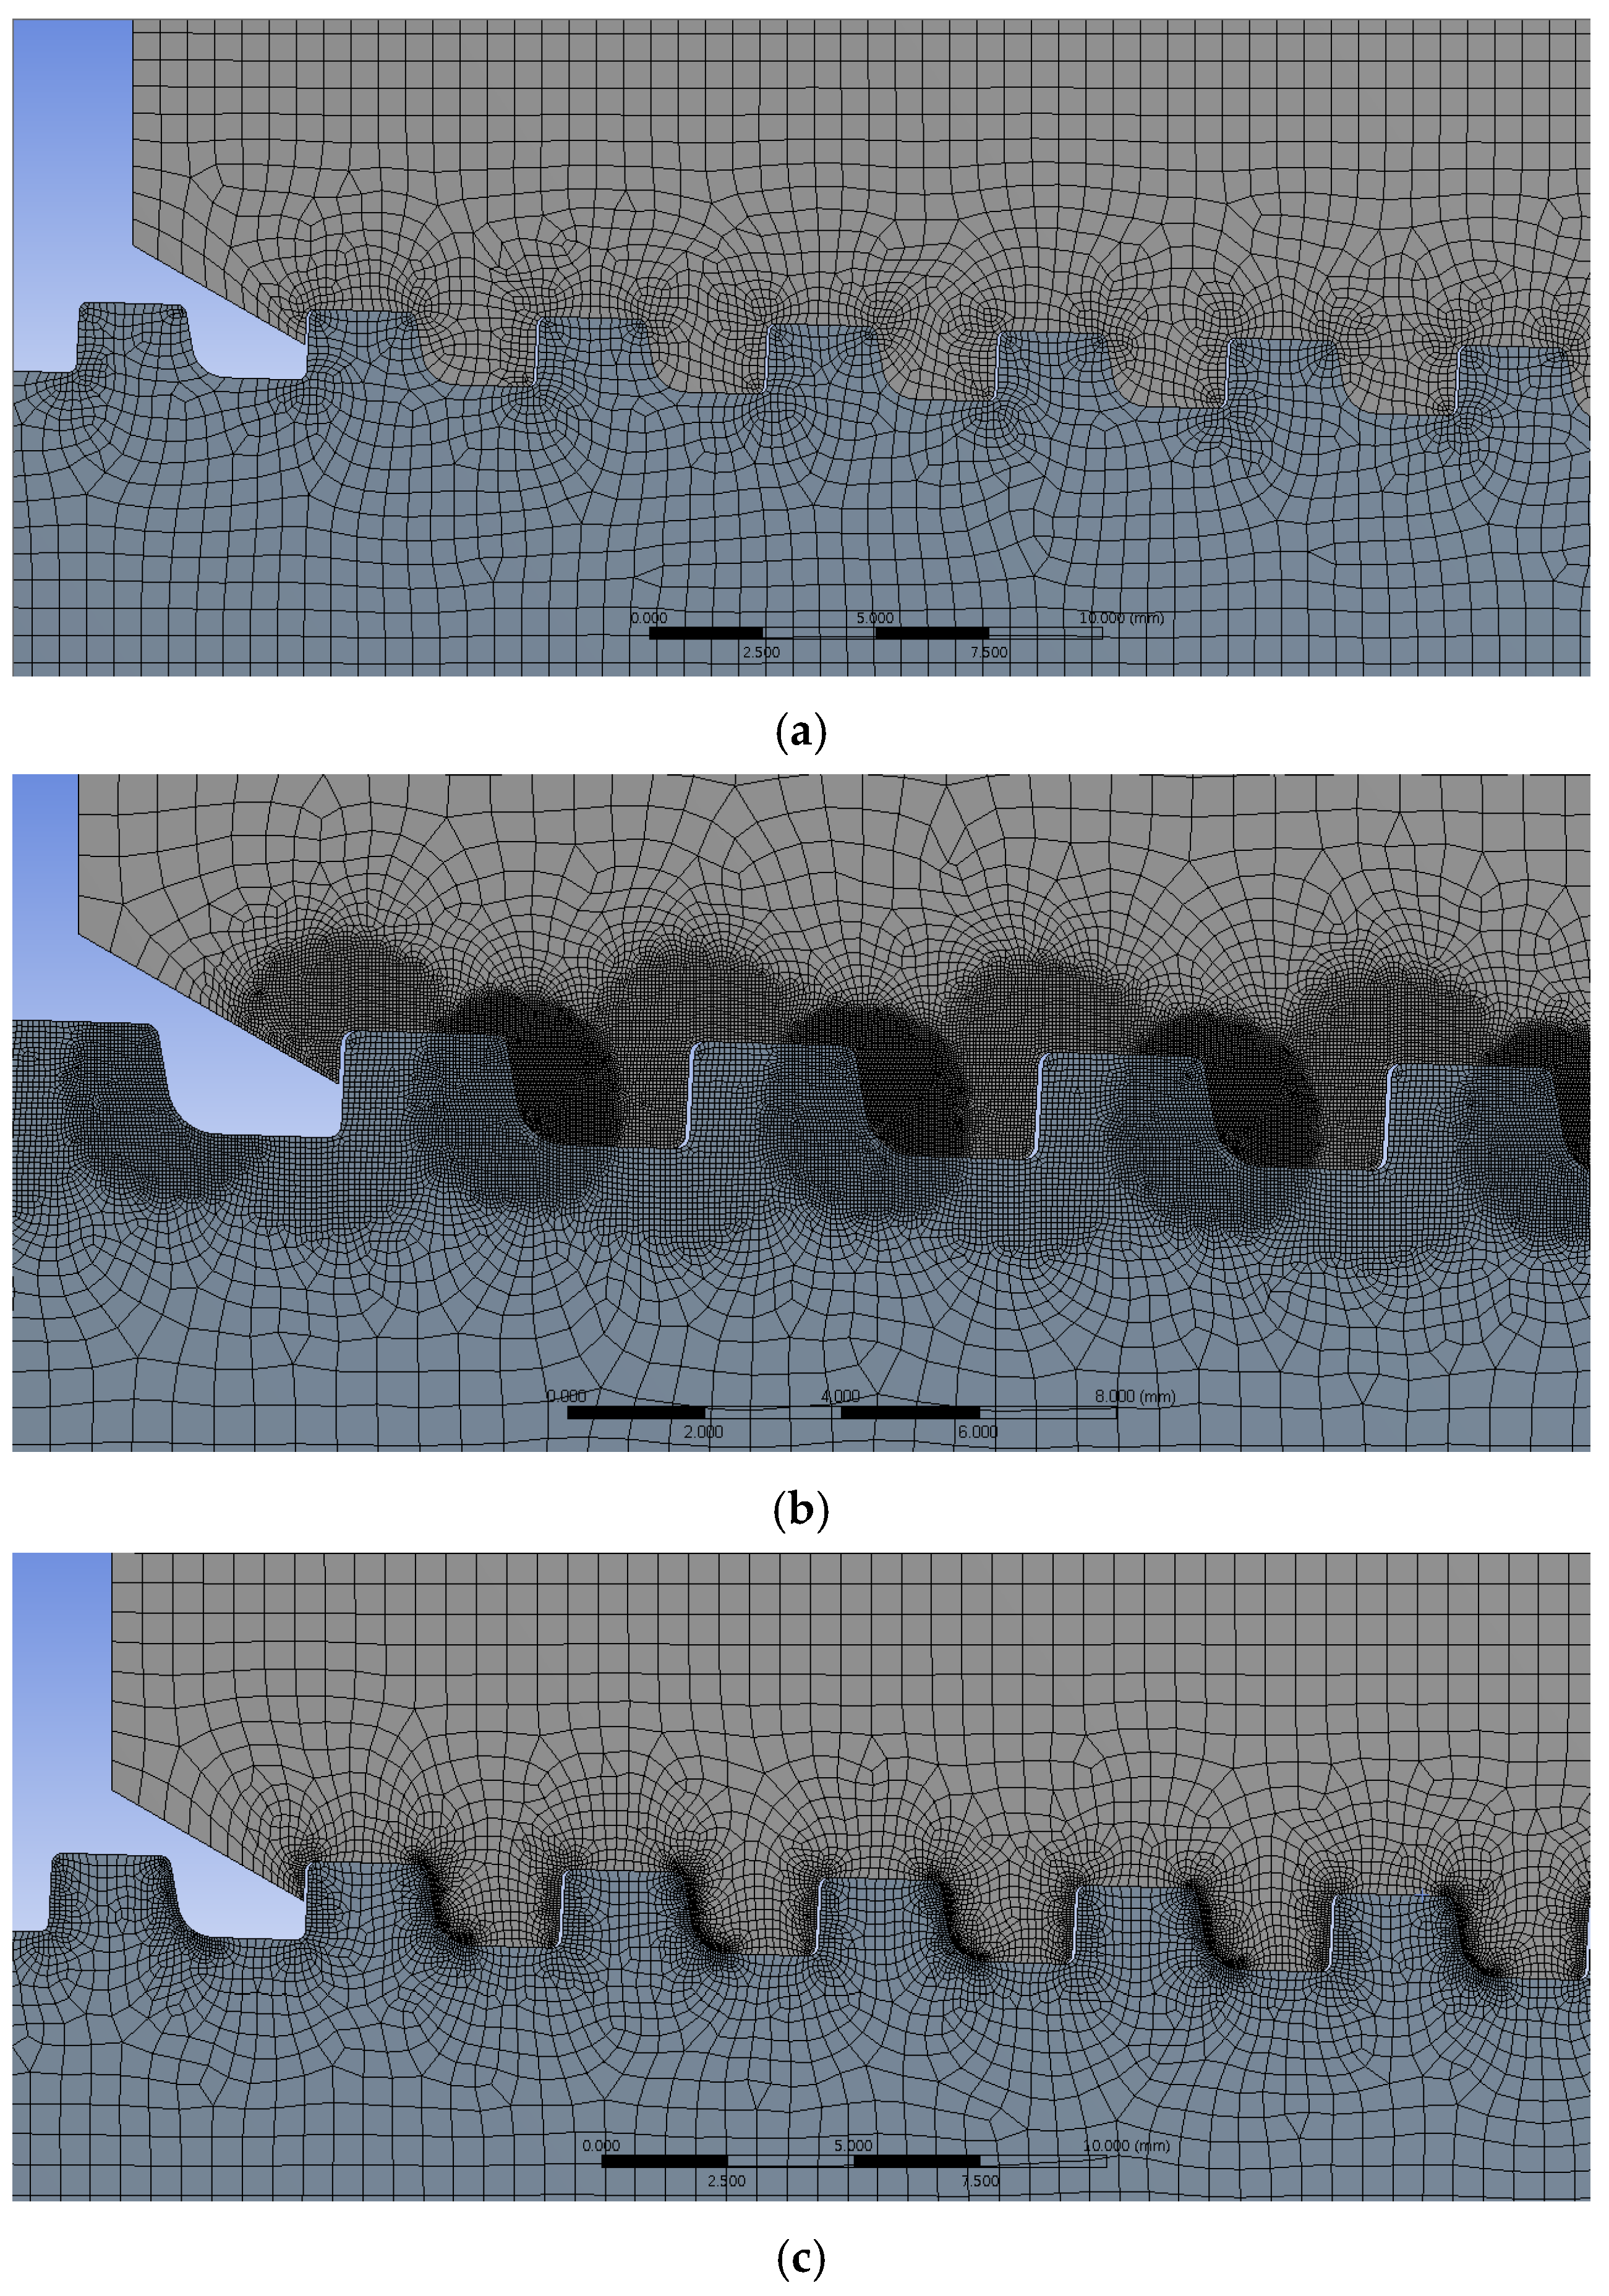
Section 2, the CAD modeling and the process of modifying thread flank upper corner radius, mesh optimization for threaded connection parts, and friction coefficient setting between threaded contact parts, will be discussed. In
Section 3, the analysis method utilizing a computer-aided engineering tool is described.
Section 4 discusses the computational results and the analysis of vibration and durability changes based on parameter changes. The final section consists of conclusions and future plans.
3. Parametric Study of Upper Corner Radius for Optimized Design
As stated previously, the premium connection is the joint that connects the fluid pipes, and it is crucial to design the optimal thread since tension and compressive forces play a significant role during installation and use. In order to improve the design, a stress analysis of the thread was required, and optimal dimensions were determined by a parametric study based on a variety of characteristics. Therefore, this section provides a tutorial on the stress analysis approach utilizing the ANSYS application.
This section is based on the von Mises stress and the American Petroleum Institute (API) 5B basic buttress model for the premium connection system. Systematically, the size and the change in the characteristics were analyzed. It was anticipated that the premium connection received the compressive force corresponding to the most stressed position when the pin and box stabbing flank come into contact. As illustrated in the picture below, three distinct points were chosen for each component, and the stress values of each point were collected and examined.
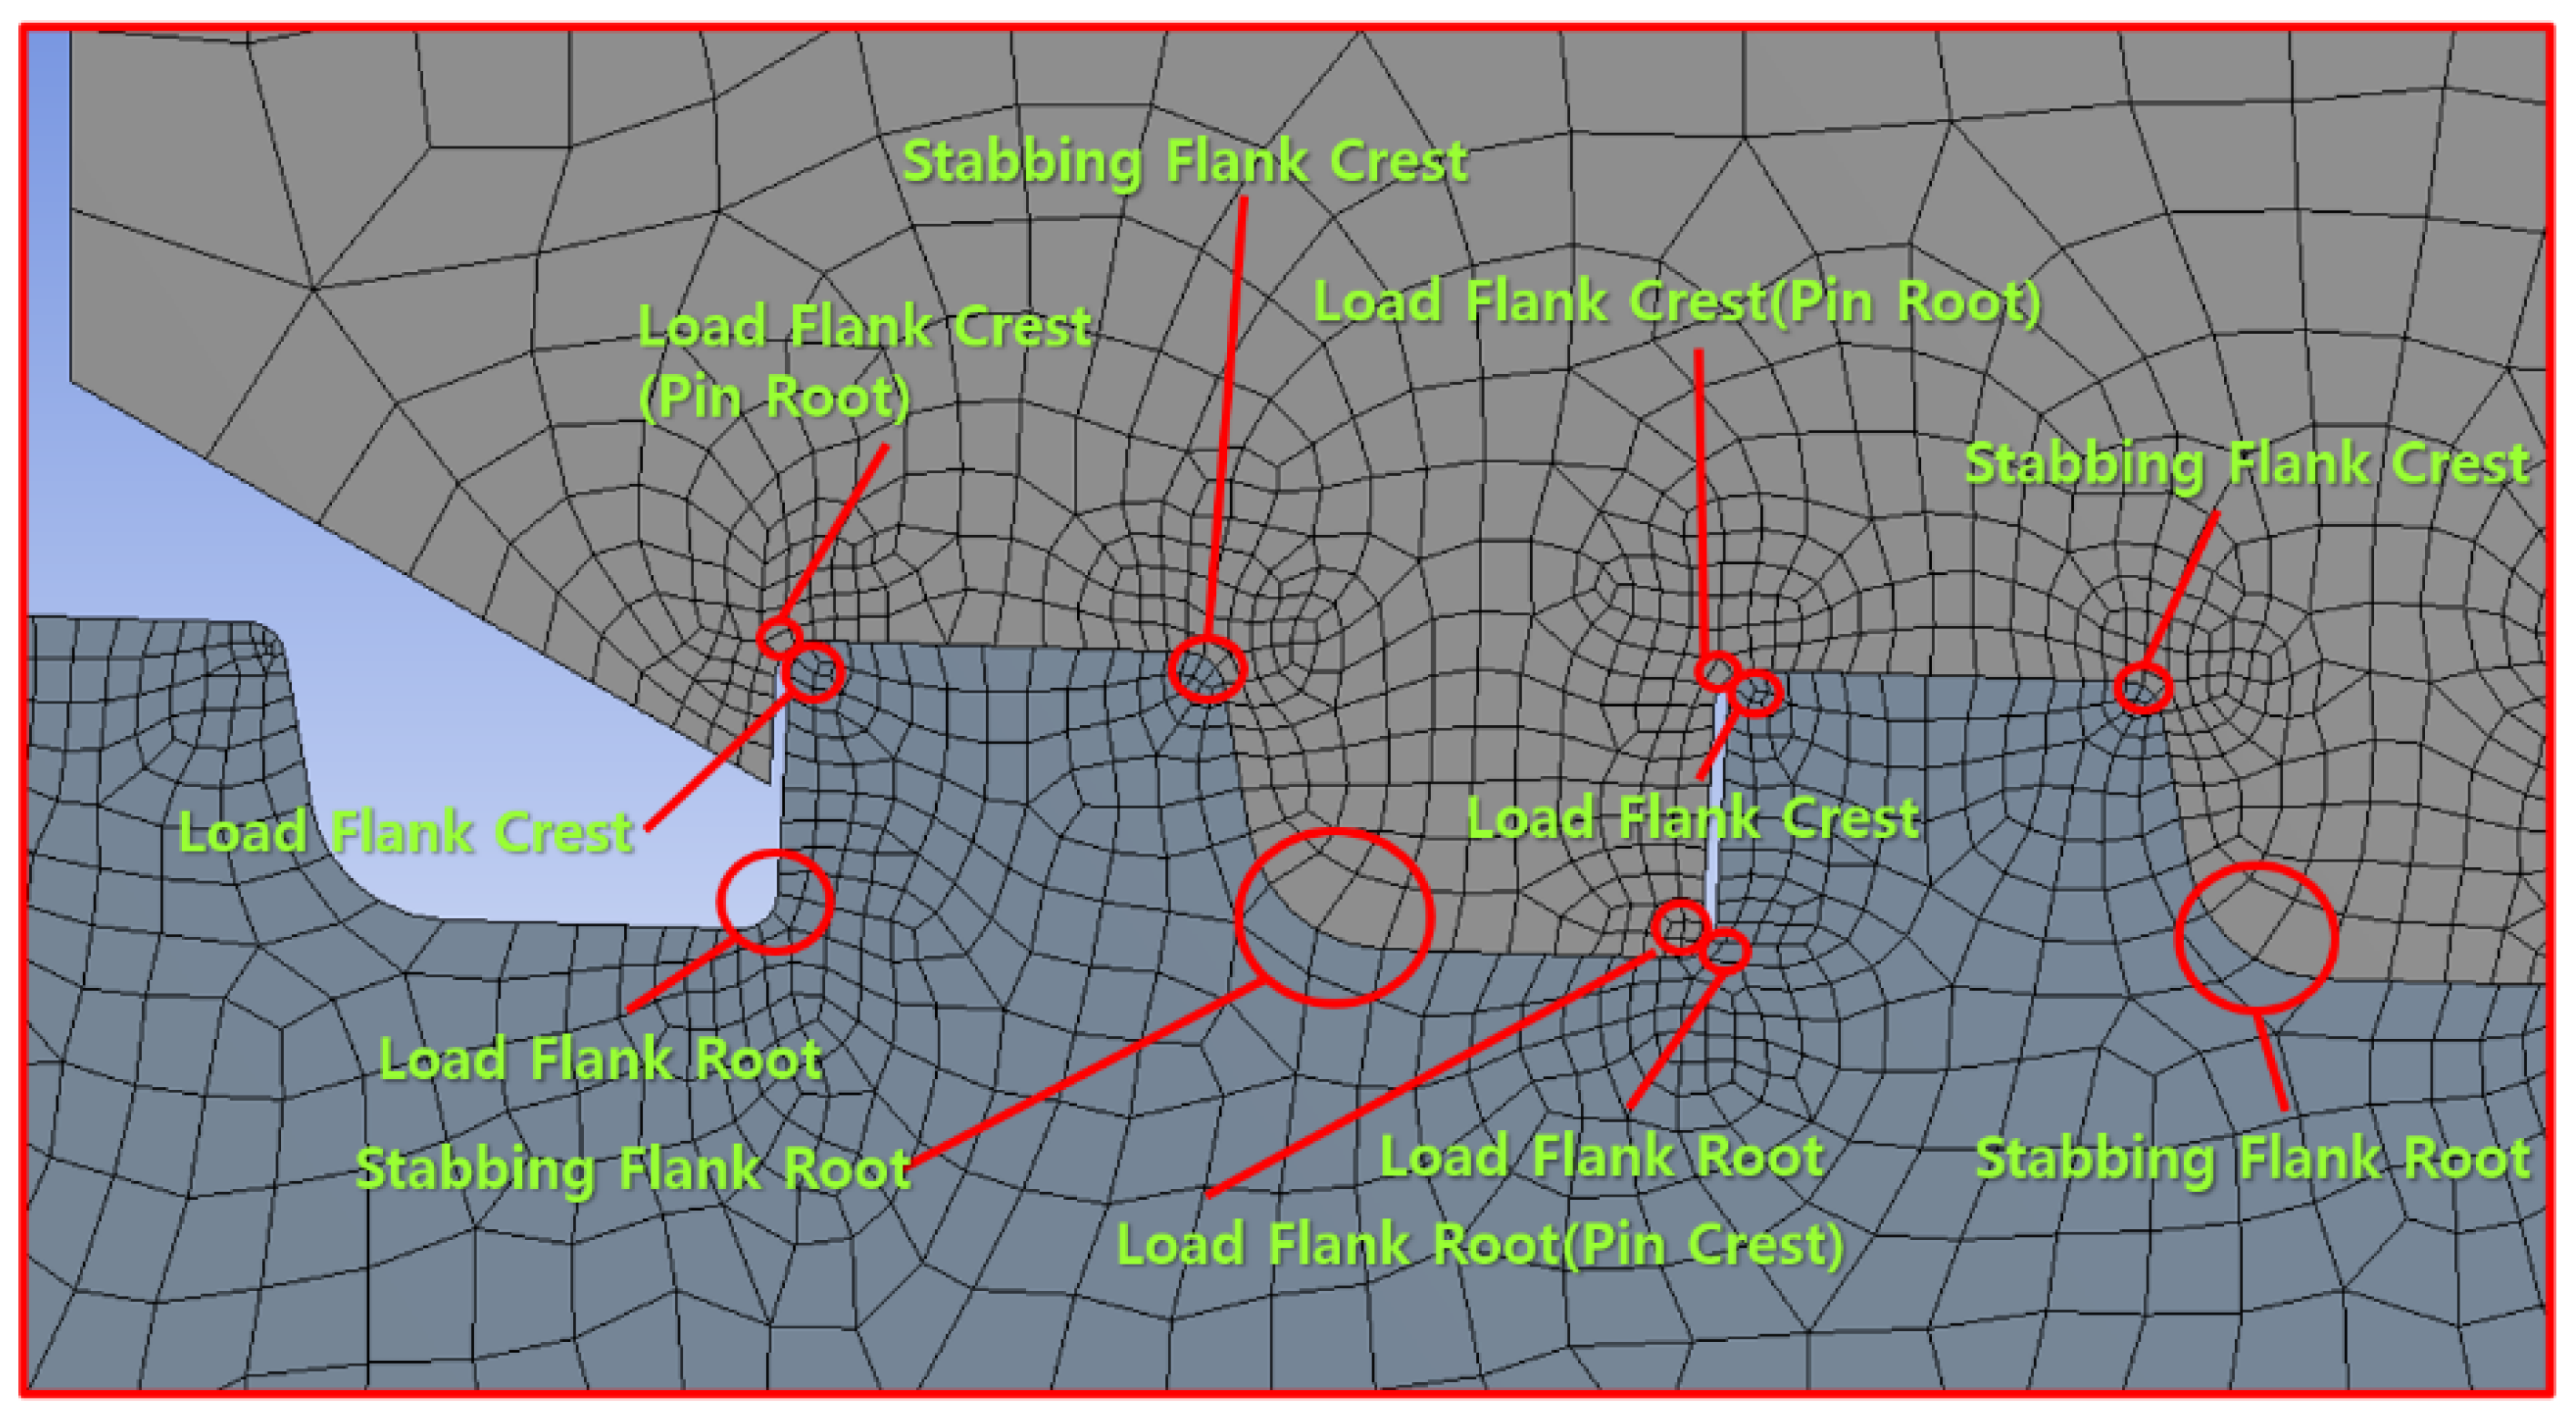
The name of each component corresponding to the LET (last engaged thread) portion of the pin is depicted in
Figure 10. Pin root, load flank crest, and stabbing flank crest were allocated to the upper corner section of pin thread # 1 (pin LET), whereas the load flank root and stabbing flank root were assigned to the bottom corner parts. Stabbing flank crest, load flank crest, and load flank crest (pin root) are similarly assigned to the upper corner of pin thread # 2.
Figure 11 depicts the names of each component that corresponds to the LET component of the box. As illustrated in the diagram, the upper corner of box thread #1 (LET) is given three points: load flank crest (pin root), load flank crest, and load flank crest 2. Load thread flank crest (pin root), load flank crest, and stabbing flank crest are allocated to the upper corner of box thread #2, while the load flank root and stabbing flank root are assigned to the lower corner. For box thread #3, there is only one stabbing flank crest in the upper corner portion and one stabbing flank root in the lower corner portion.
Since the most concentrated stress is mostly delivered to the corner portion, as demonstrated by the outcome of the previous study, the angle of the stabbing flank was set to 13 degrees to obtain a better result, and the upper corner radius was modified accordingly. Originally, the upper corner radius measured 0.2 cm. In order not to diverge from the original standard, the variation in the von Mises stress was investigated by adjusting the upper corner radius of the stabbing flank from 0.1 cm to 0.5 cm in 0.05 cm increments, as illustrated in
Figure 12.
3.1. Box Thread 1 (Box LET)
In the case of load flank crest 2, as shown in
Figure 13, the stress gradually declined from a stabbing flank upper corner radius of 0.1 cm to 0.4 cm before increasing at 0.45 cm. The greatest value was determined at a radius of 0.2 cm, while the minimum value was discovered at a radius of 0.4 cm. In the situation of the load flank crest (Pin Root), the greatest stress of 190 MPa was observed in the first two radii cases and the stress then decreased to the minimum value at around 165 MPa at a radius of 0.2 cm. Then, the stress again increases as the upper corner radius increases to a radius of 0.3 cm and then decreases again.
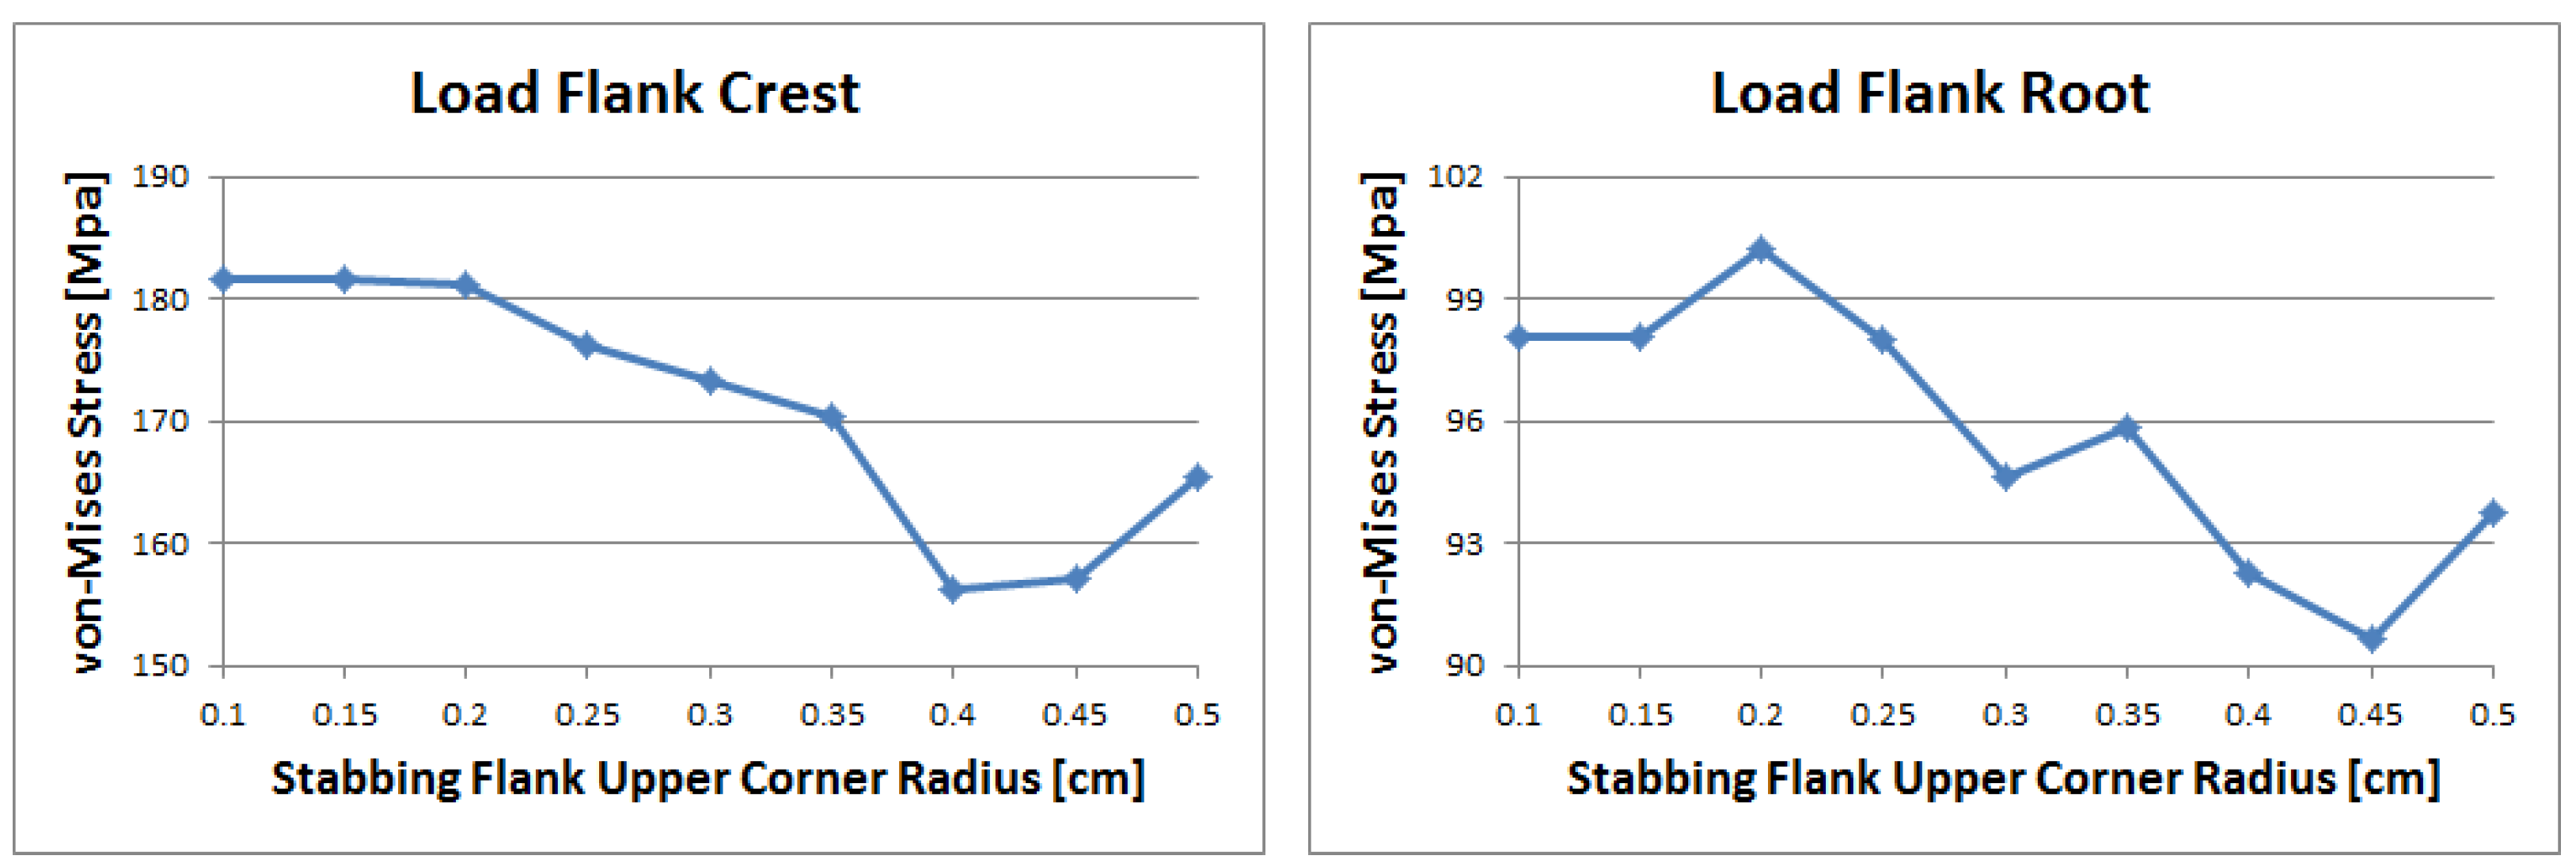
In the case of the load flank crest, as shown in
Figure 14, the stress gradually decreased as the radius increased. The maximum value was observed at 0.1 to 0.2 cm, while the minimum value was at around 0.4 cm. In the case of load flank root, the value was irregular. However, the trend is similar to the load flank crest, decreasing stress according to an increasing radius. The maximum value appears at 0.2 cm and the minimum value is at 0.45 cm.
3.2. Box Thread 2
As shown in
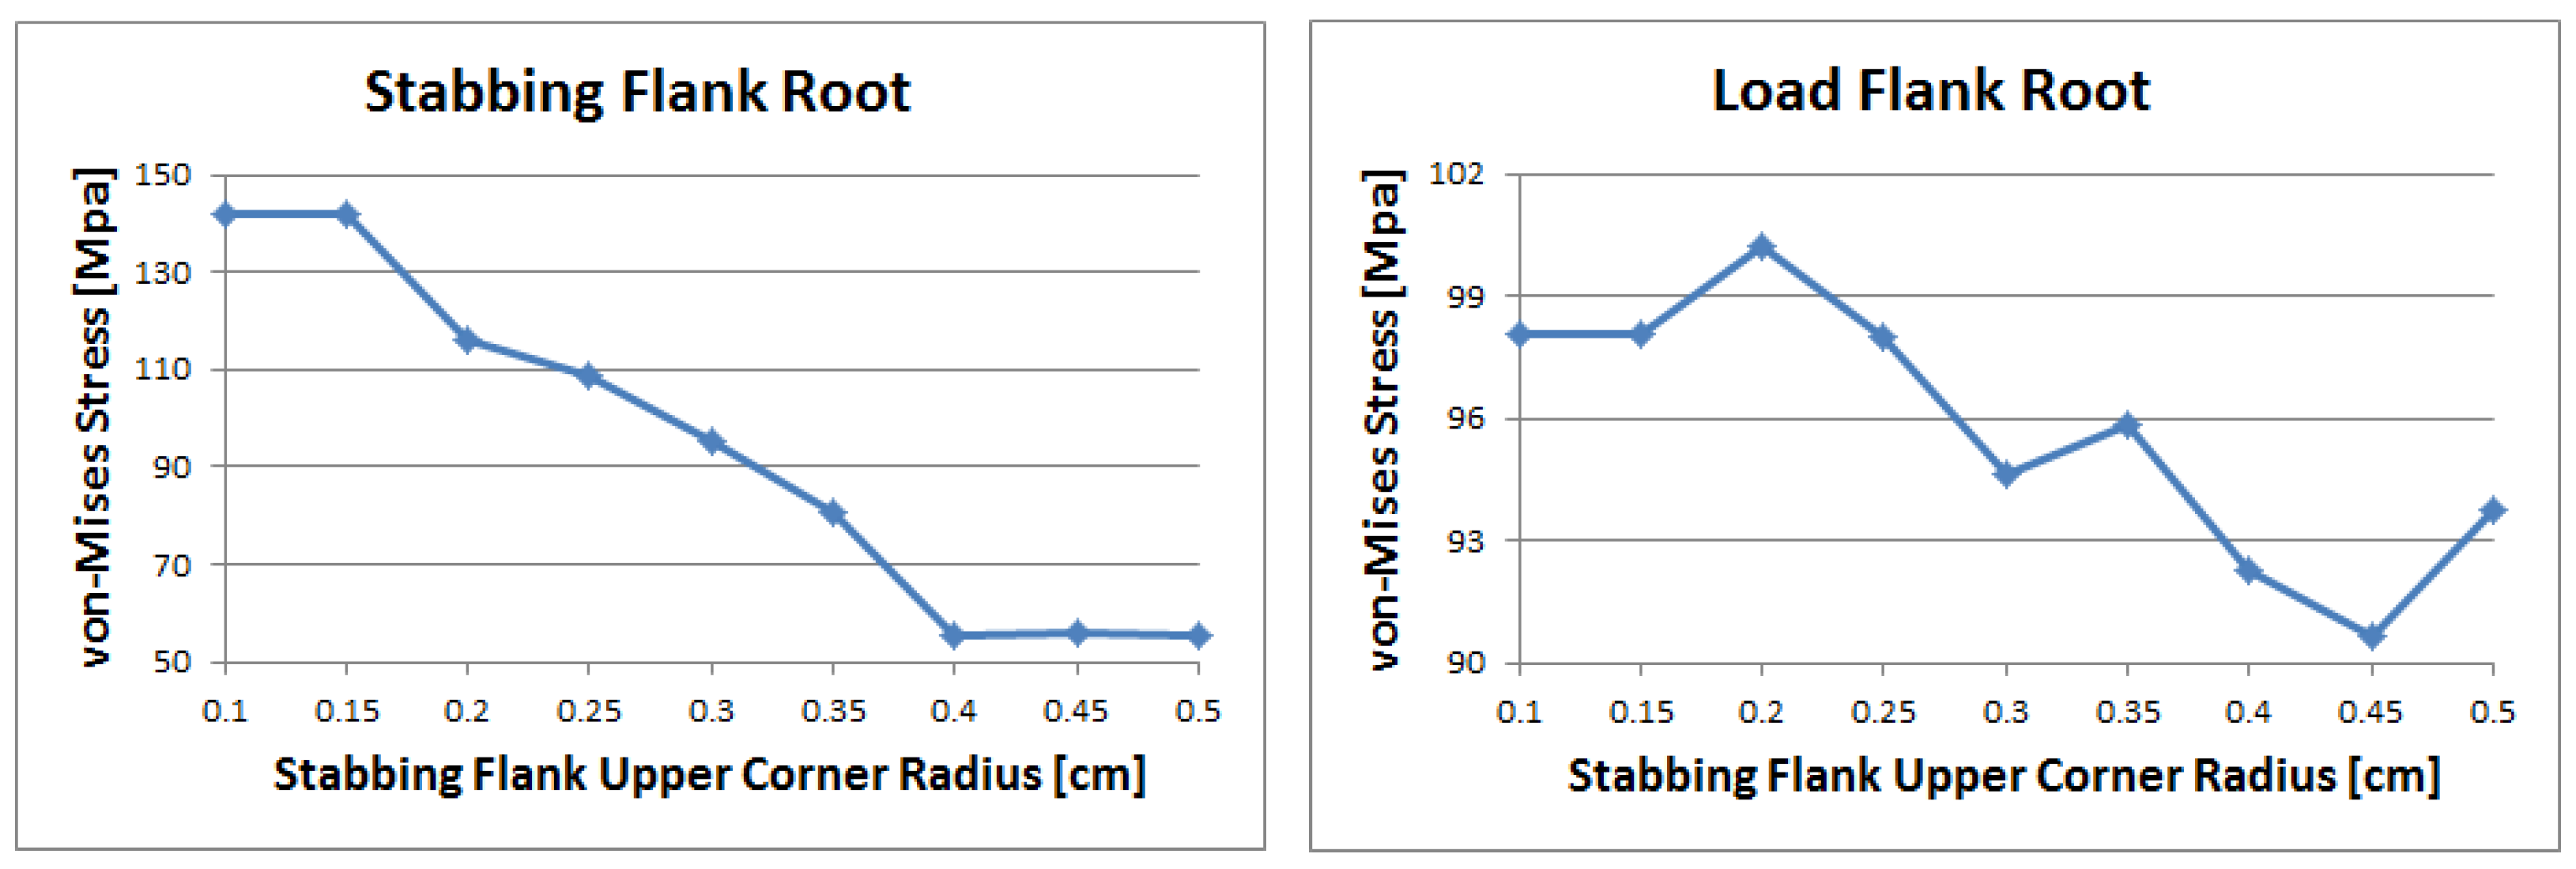
Figure 15, The stress value for the stabbing flank root decreases constantly with an increasing radius of 0.15 to 0.4 cm. The greatest stress of around 140 MPa was recorded at a radius of 0.1 cm, while the lowest stress of around 55 MPa was recorded at radii over 0.4 cm. In the instance of the stabbing flank crest, stress values varied erratically with corner radii from 0.1 to 0.25 cm, and then declined steadily from 0.25 to 0.45 cm. The stress once again increased at a final radius of 0.5 cm. The maximum stress recorded was around 750 MPa at a radius of 0.25 cm, while the minimum stress was around 500 MPa at a radius of 0.45 cm.
Figure 16 shows that depending on the radius, the stress value of the load flank root lowers consistently from 0.1 to 0.5 cm. The maximum and minimum stresses were, respectively, around 330 and 230 MPa. In the case of the load flank crest, the stress value also drops gradually with an increasing radius from 0.1 to 0.5 cm. Compared to the change in stress value for the load flank root, the change in stress value for the load flank crest is relatively small. The value only decreases by 1 MPa. In the instance of the load flank crest (pin root), the stress value showed an increasing trend with some fluctuations. The highest stress was observed at around 140 MPa for radii of 0.1 to 0.15 cm, while the lowest stress was observed to be around 155 MPa at radii of 0.4 and 0.5 cm.
3.3. Box Thread 3
As shown in
Figure 17, the von Mises stress value for the stabbing flank crest decreases with an increasing radius from 0.1 to 0.3 cm. The highest stress recorded was around 380 MPa at a radius of 0.45 cm, while the lowest was 260 MPa at a 0.25 cm radius. The von Mises stress value for the stabbing flank root decreased with an increasing radius from 0.1 to 0.35 cm, with the exception of 0.4 to 0.5 cm. Compared to the von Mises stress level for the stabbing flank root, the stress level of the stabbing flank crest is about four times larger.
3.4. Pin Thread 2
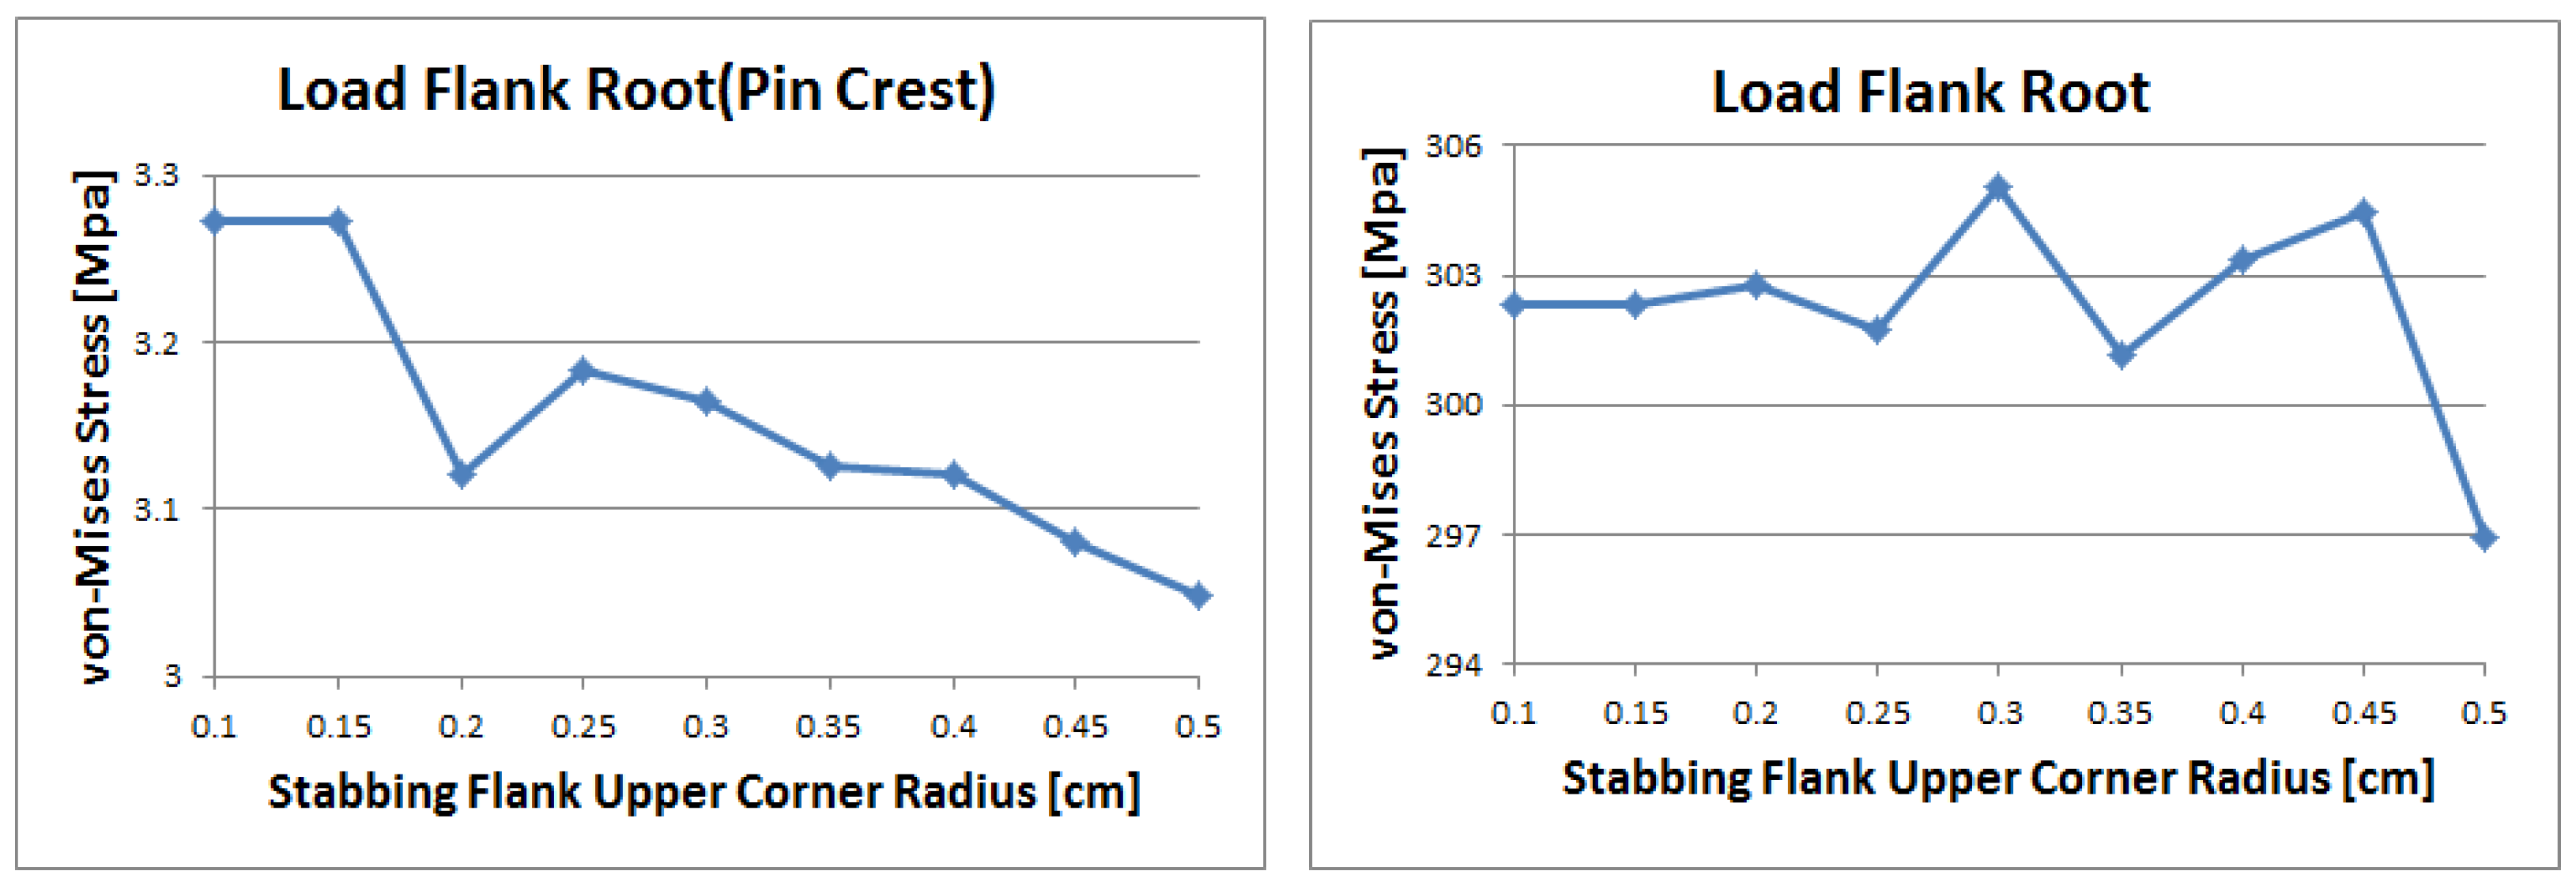
In the case of the load flank crest (pin root), the stress value fell gradually from a radius of 0.1 cm to 0.5 cm, except for a little increase at 0.25 and 0.4 cm, as shown in
Figure 18. The maximum stress was determined to be around 312 MPa at a radius of 0.1 and 0.15 cm, while the minimum stress was around 297 MPa at a radius of 0.5 cm. The value of the load flank crest was similar to the case of the load flank crest (pin root). The stress value fell gradually from a radius of 0.1 cm to 0.5 cm, except for a little increase at 0.4 and 0.5 cm. The maximum stress was determined to be around 3 MPa at radii of 0.1 and 0.15 cm, while the minimum stress was around 2.87 MPa at a radius of 0.45 cm. Compared to the stress level for the load flank crest, the stress level of the load flank crest (pin root) is significantly higher, about 100 times higher.
Figure 19 shows that the stress value of the load flank root (pin crest) also decreases gradually except at a radius of 0.2 cm. It drops suddenly at 0.2 cm, while the stress values from 0.2 to 0.5 cm radii steadily decreased. When the minimum value was 3.05 MPa, it was established that the maximum value was around 3.3 MPa. Except for the radius of 0.5 cm, the stress values for load flank root remained at around 300–305 MPa. The maximum stress was determined to be 305 MPa, while the minimum stress was 297 MPa. Similarly, compared to the stress level of the load flank root, the stress level of the load flank root (pin crest) is significantly lower, about 100 times lower.
In the case of the stabbing flank crest, the stress values at radii of 0.15 to 0.5 cm decreased steadily, except for between radius 0.1 and 0.15 cm where there was no change, as described in
Figure 20. At a radius of 0.15 to 0.2 cm, it is evident that the stress value abruptly declines. The highest stress recorded was around 255 MPa, while the lowest was around 120 MPa. Except for a radius of 0.4 and 0.45 cm, the stress results for the stabbing flank root kept the same at around 77–78 MPa.
3.5. Pin Thread 1 (Pin LET)
As shown in
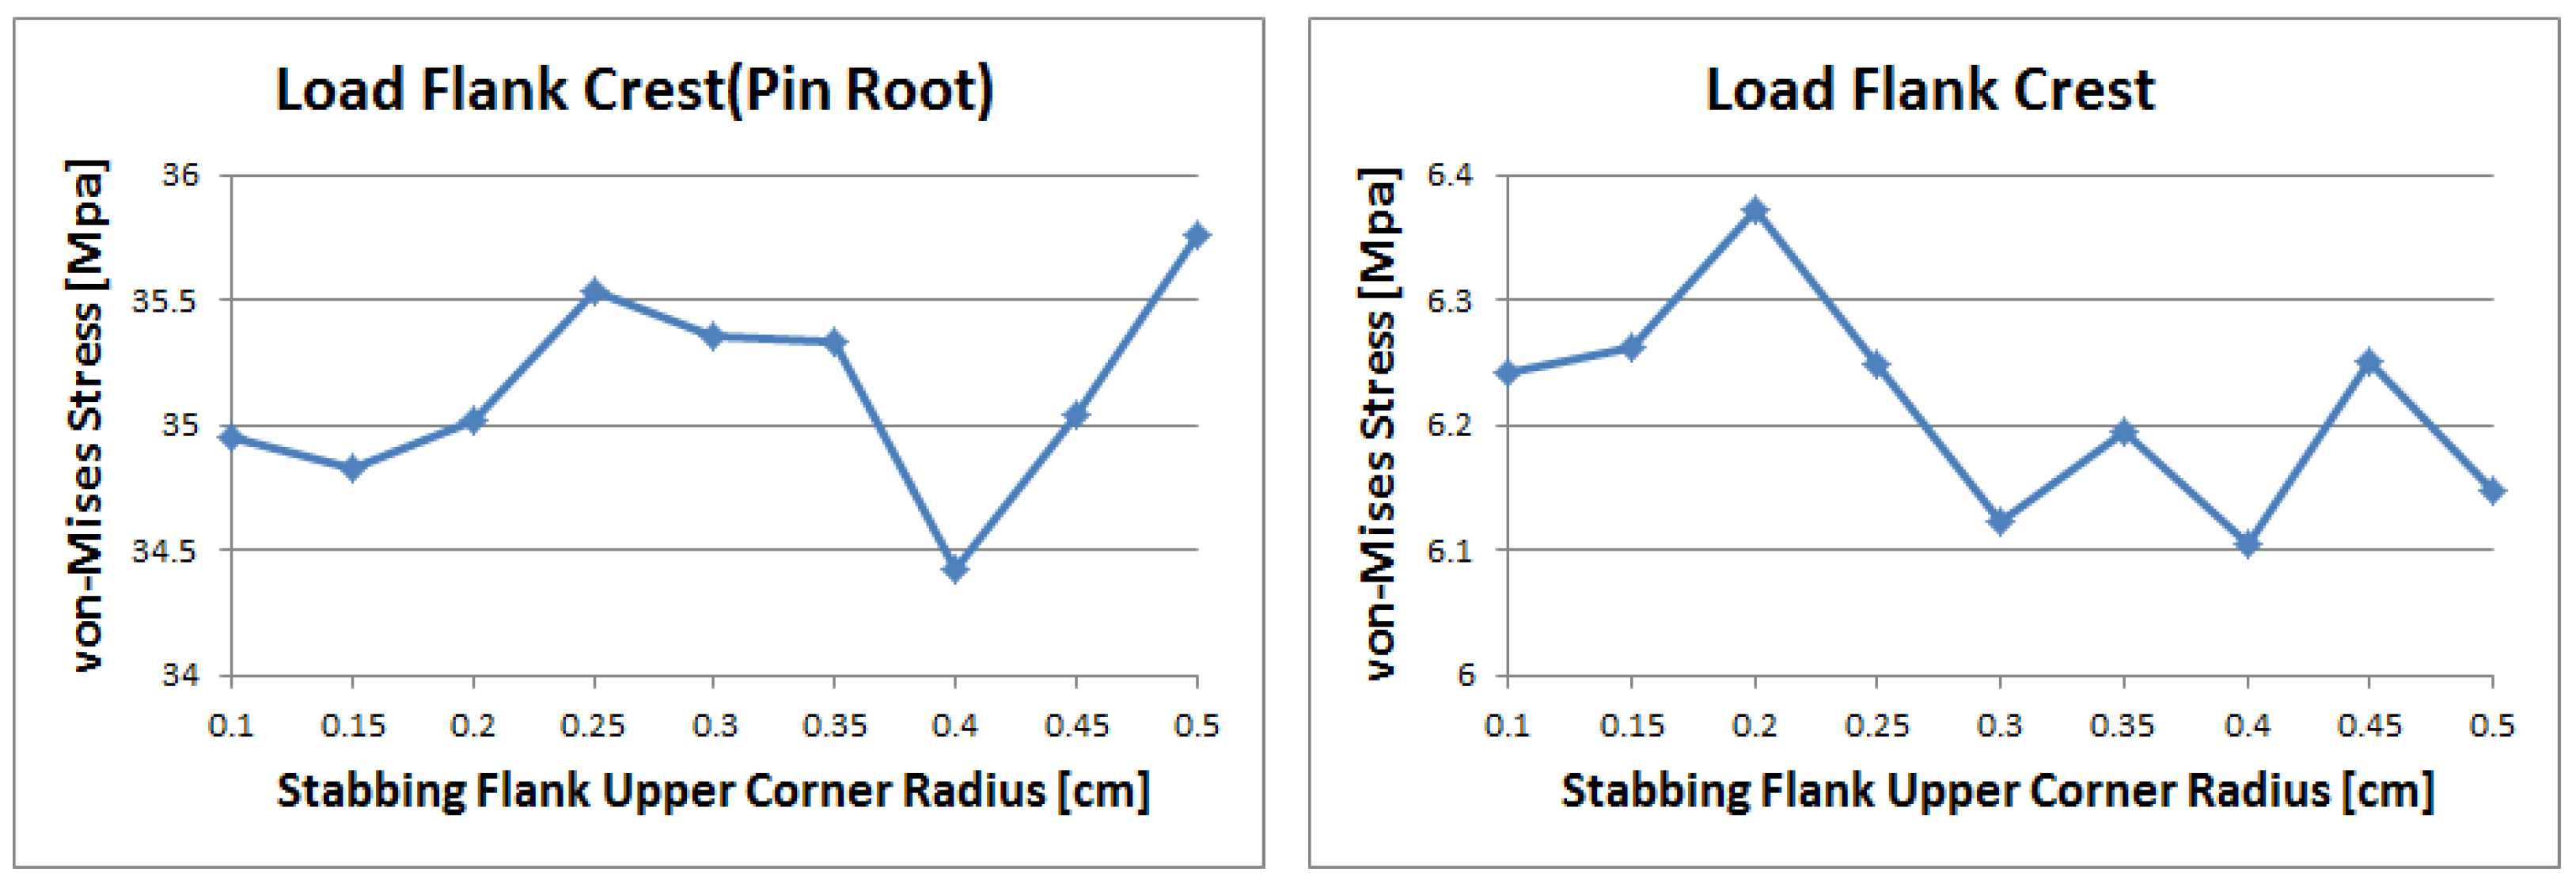
Figure 21, the stress value of the load flank crest (pin root) was erratic, not changing much at around 35 MPa. In the instance of the load flank crest, the stress value was irregular, not changing much at around 6–6.5 MPa.
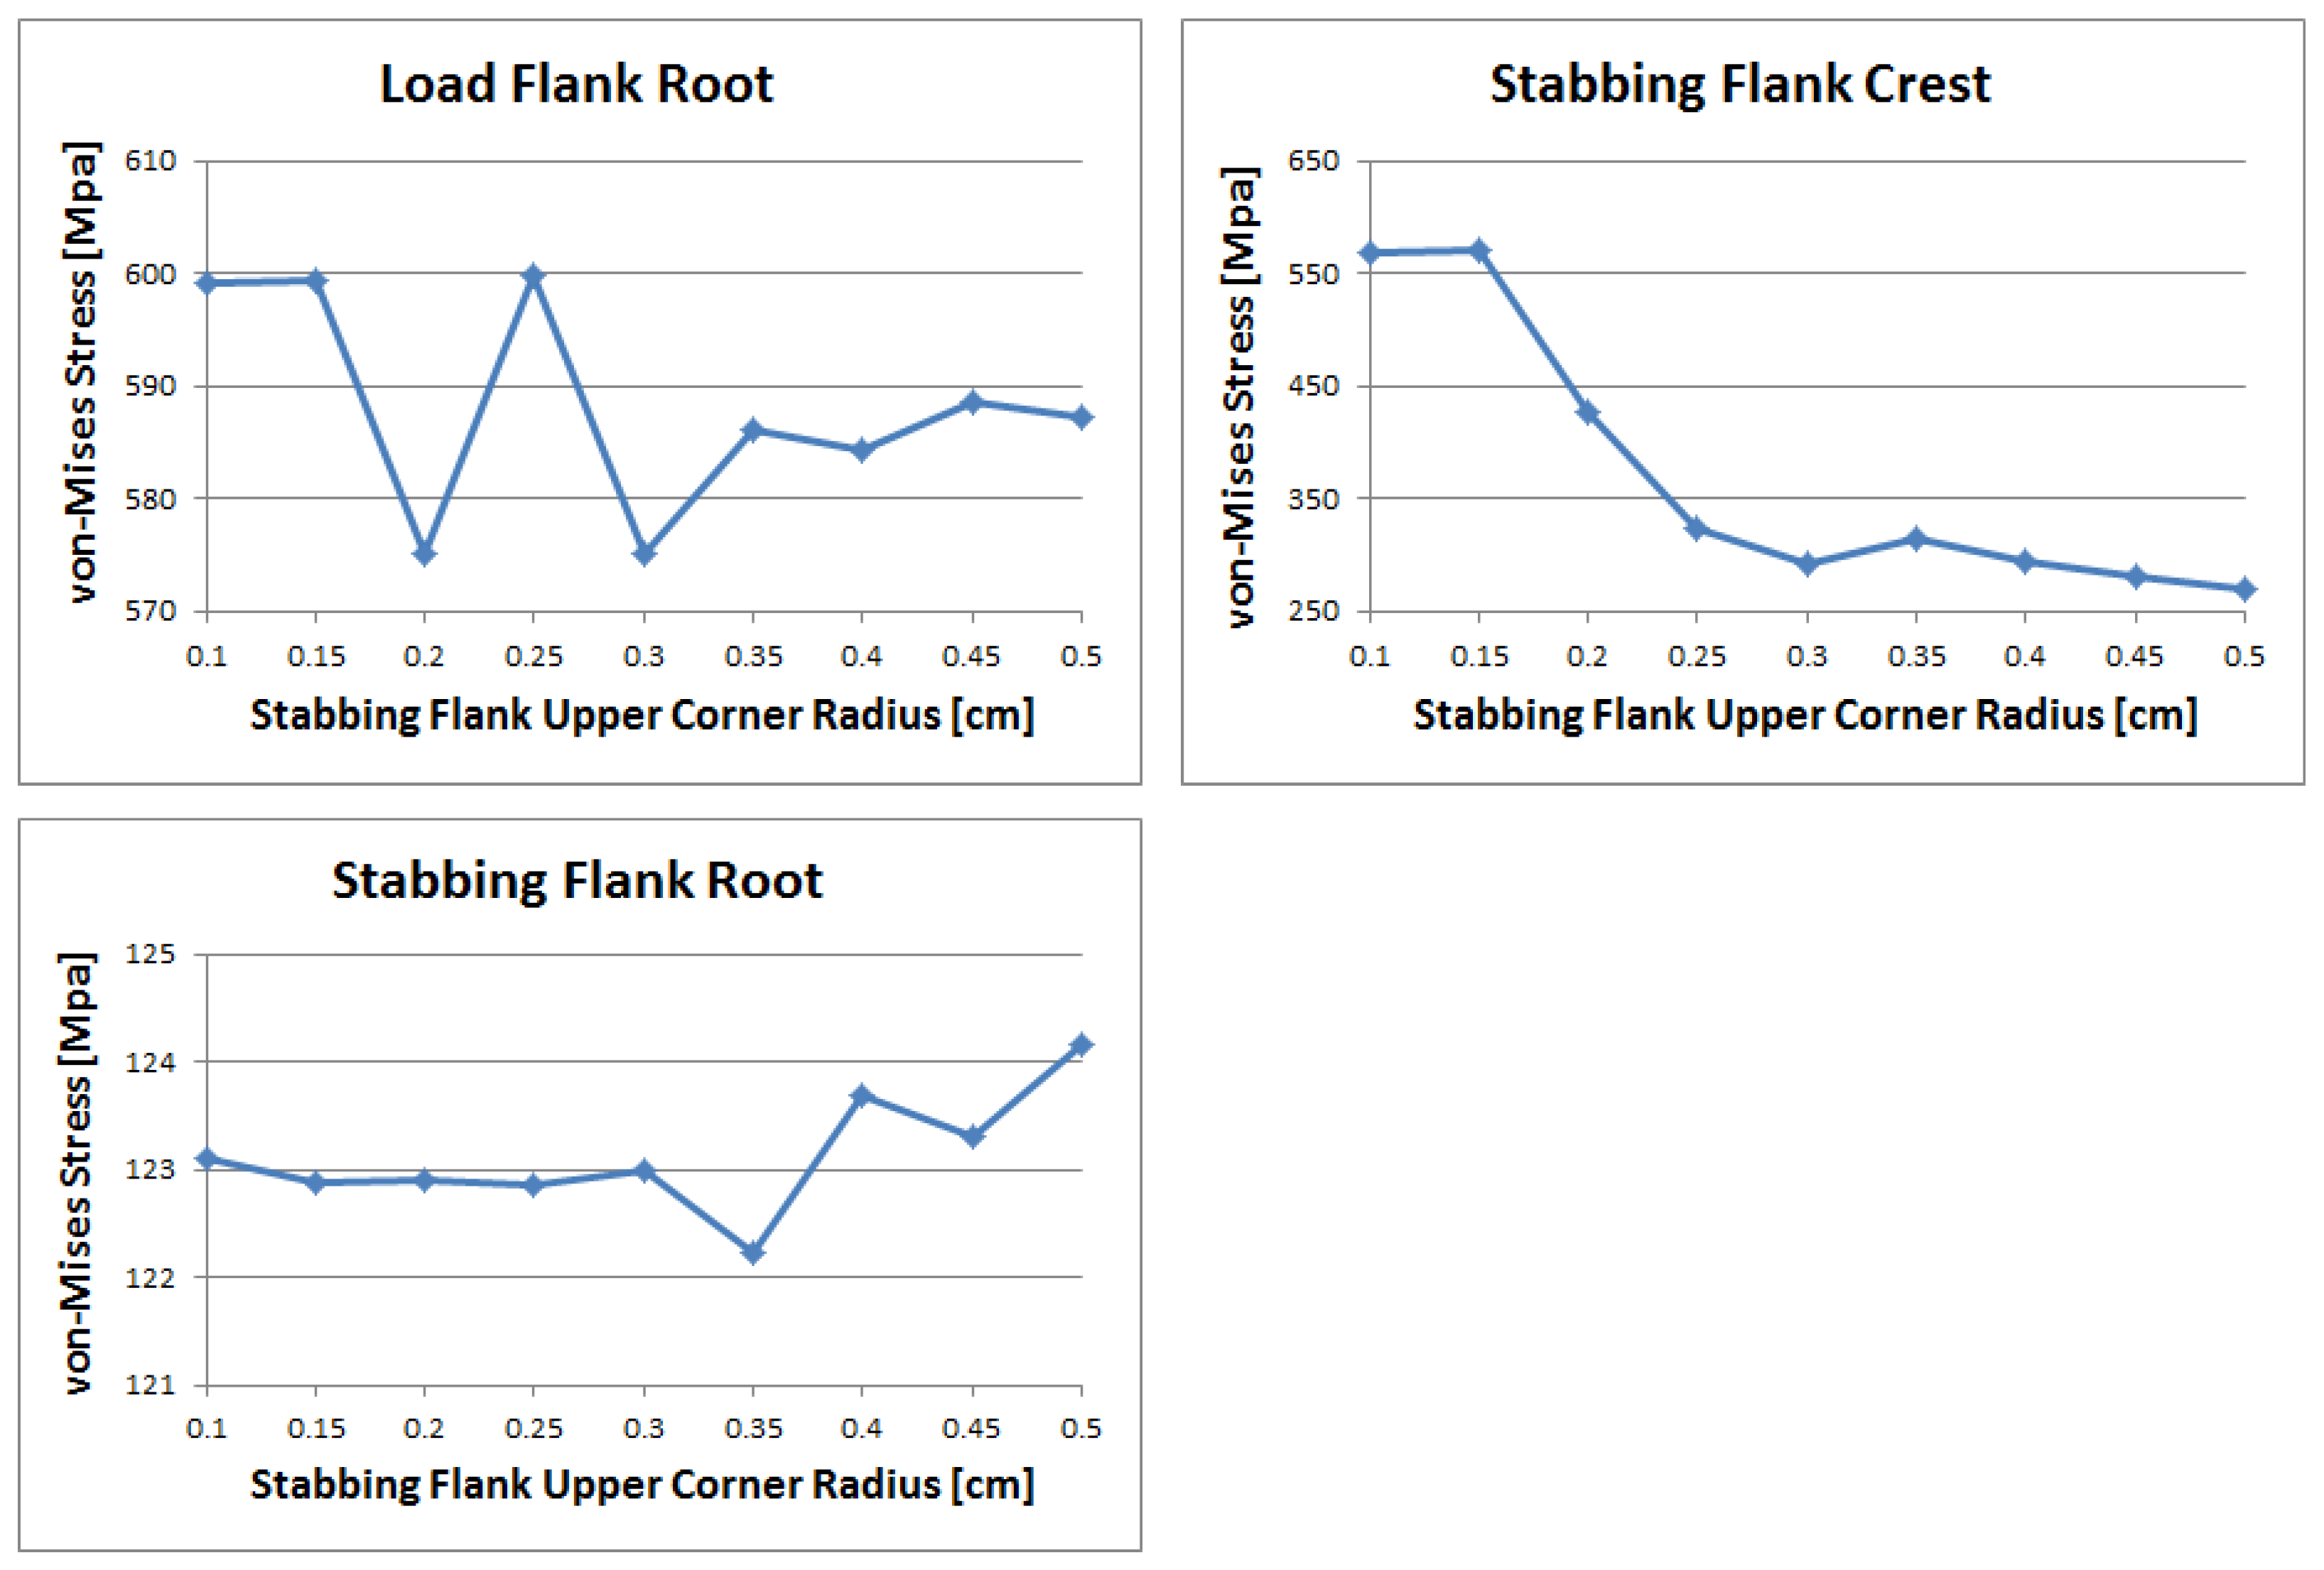
In the case of load flank root, the stress values increase and decrease repeatedly, as expressed in
Figure 22. The highest stress recorded was 600 MPa, while the lowest was 575 MPa. In the case of the stabbing flank crest, the stress remained around 300 MPa for radii from 0.25 to 0.5 cm. The stress value likewise abruptly declined at 0.15 cm, as can be observed. The highest stress recorded was around 560 MPa. The stress value for the stabbing flank root remained the same at around 123 MPa, as can be seen.
4. Discussion of Results
The results from the previous section do not allow us to determine the best radius for the top corner of the stabbing flank since the results do not indicate a particular trend. Therefore, a sophisticated analysis involving the RMS value and the maximum value was required to obtain the optimal value.
According to
Table 2, the maximum stress value of pin thread 1 (pin LET) was found in the load flank root section at the upper corner radius of 0.25 cm. The von Mises stress has the greatest difference between the upper corner radius of 0.15 cm and the lower corner radius of 0.50 cm in the stabbing flank crest. In the remaining load flank crest (pin root), load flank crest, and stabbing flank root portions, the von Mises stress values do not differ much. The RMS values were achieved using a maximum value of 0.15 cm and a minimum value of 0.30 cm for the top corner radius. Bold numbers include maximum and minimum values in each column.
Table 3 reveals that the largest value of pin thread 2 appeared in the load flank crest (pin root) region with an upper corner radius of 0.15 cm. It was discovered that the von Mises stress difference was greatest in the stabbing flank crest region when the upper corner radius was 0.10/0.15 cm and 0.5 cm. The von Mises stress values for the remaining load flank crests (pin crest), load flank root, load flank root, and stabbing flank root are not significantly different. The maximum RMS values were obtained when the top corner radius was at the minimum value of 0.10/0.15 cm and the minimum RMS values were obtained when the top corner radius was at the maximum value of 0.50 cm.
As shown in
Table 4, Box thread 1 (box LET) had its highest value in the load flank crest (pin root) region with an upper corner radius of 0.10/0.15 cm and its minimum value in the load flank crest region (pin root) was shown when the radius of the upper corner was 0.20 cm. The greatest von Mises stress difference was observed between upper corner radii of 0.10/0.15 cm and 0.20 cm at the load flank crest (pin root). The was no noticeable variation in stress levels for the remaining load flank crest, load flank crest 2, and load flank root. The highest RMS values were obtained when the top corner radius had a maximum value of 0.10/0.15 cm and the lowest RMS values were observed at a radius of 0.45 cm.
According to
Table 5, the greatest value for box thread 2 was found in the stabbing flank crest section at an upper corner radius of 0.25 cm, and the minimum value was found in the stabbing flank crest portion at an upper corner radius of 0.45 cm. The greatest von Mises stress differential was discovered in the area of the stabbing flank crest between the upper corner radius of 0.25 cm and 0.45 cm. In the remaining stabbing flank roots, load flank crests (pin root), load flank crests, and load flank roots, the difference between the von Mises stress levels was not significant. The maximum RMS value was obtained when the top corner radius was 0.10 cm and the minimum RMS value was obtained when the top corner radius was 0.45 cm.
Box thread 3 has a maximum value in the stabbing flank crest portion with an upper corner radius of 0.45 cm and a minimum value in the stabbing flank crest portion with an upper corner radius of 0.25 cm, as shown in
Table 6. The greatest von Mises stress differential was discovered in the area of the stabbing flank crest between the upper corner radii of 0.25 cm and 0.45 cm. In the remaining portion of the stabbing flank root, it can be observed that von Mises stress levels do not vary significantly. The highest RMS value was obtained with a top corner radius of 0.45 cm and the minimum RMS value was obtained with a top corner radius of 0.25 cm.
Table 7 demonstrates that the final RMS was also computed utilizing the RMS values for each thread following each analysis for each thread. Box Thread 2 had the greatest RMS value at an upper corner radius of 0.10 cm. The RMS difference is the highest for box thread 2 and between the upper corner radii of 0.10 cm and 0.45 cm. The last maximum RMS values were obtained at an upper corner radius of 0.15 cm and the minimum RMS value was obtained at an upper corner radius of 0.45 cm.
According to
Table 8, the upper corner radius of 0.50 cm was the most common of the minimum 1, and the maximum 2 was also displayed. When the upper corner radius was 0.40 cm and 0.45 cm, the same five were displayed out of the minimum 1 list, but 0.40 cm, 3, and 0.45 cm, 2, were displayed even within the maximum 1. However, the upper corner radius of 0.40 cm was selected as the ideal value since it was the smallest in the minimum 1 list and was closest to the original upper corner radius dimension.
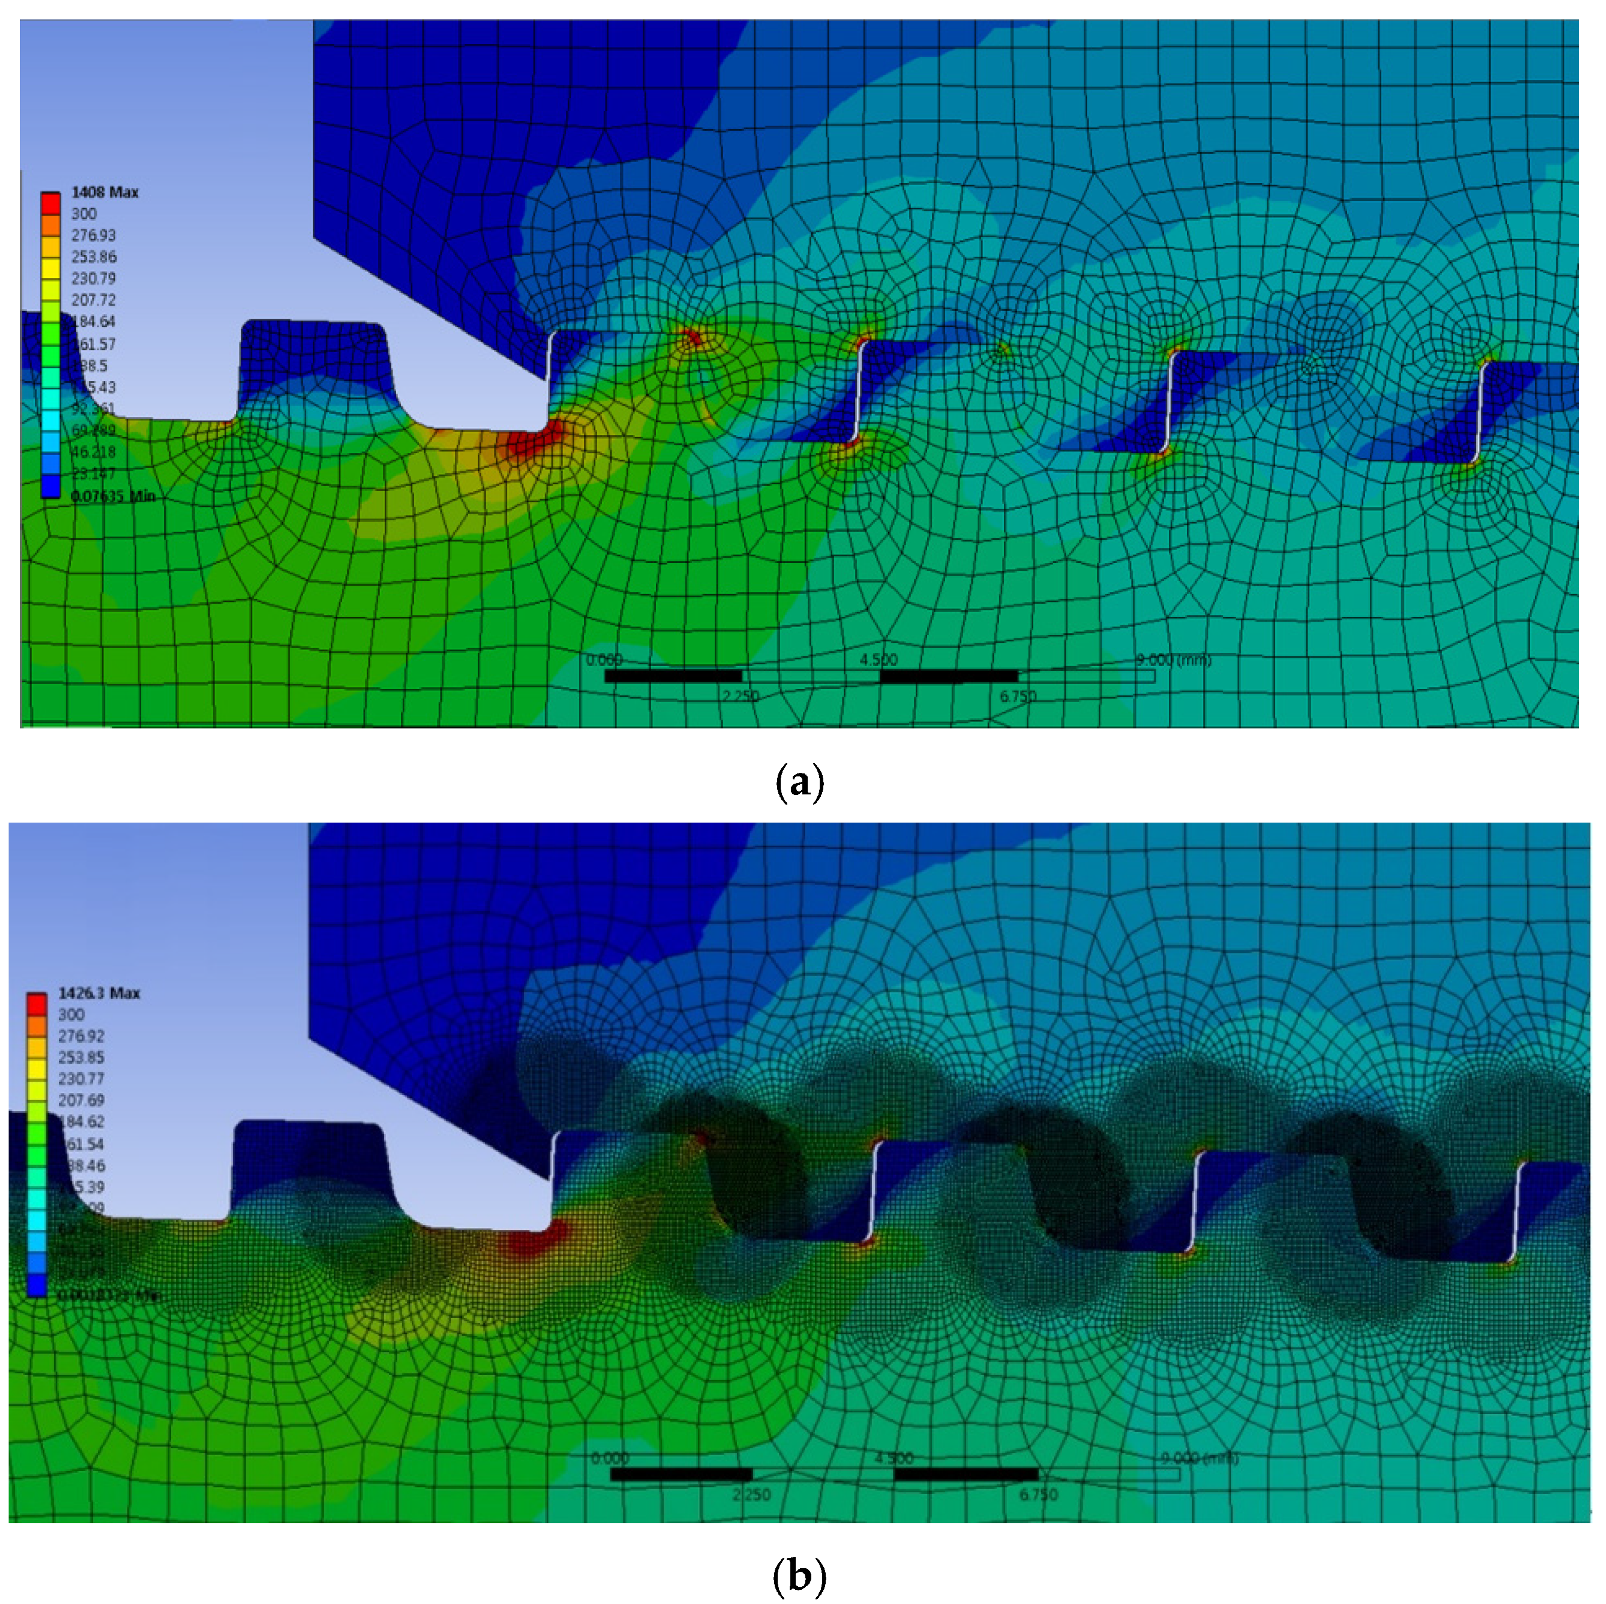
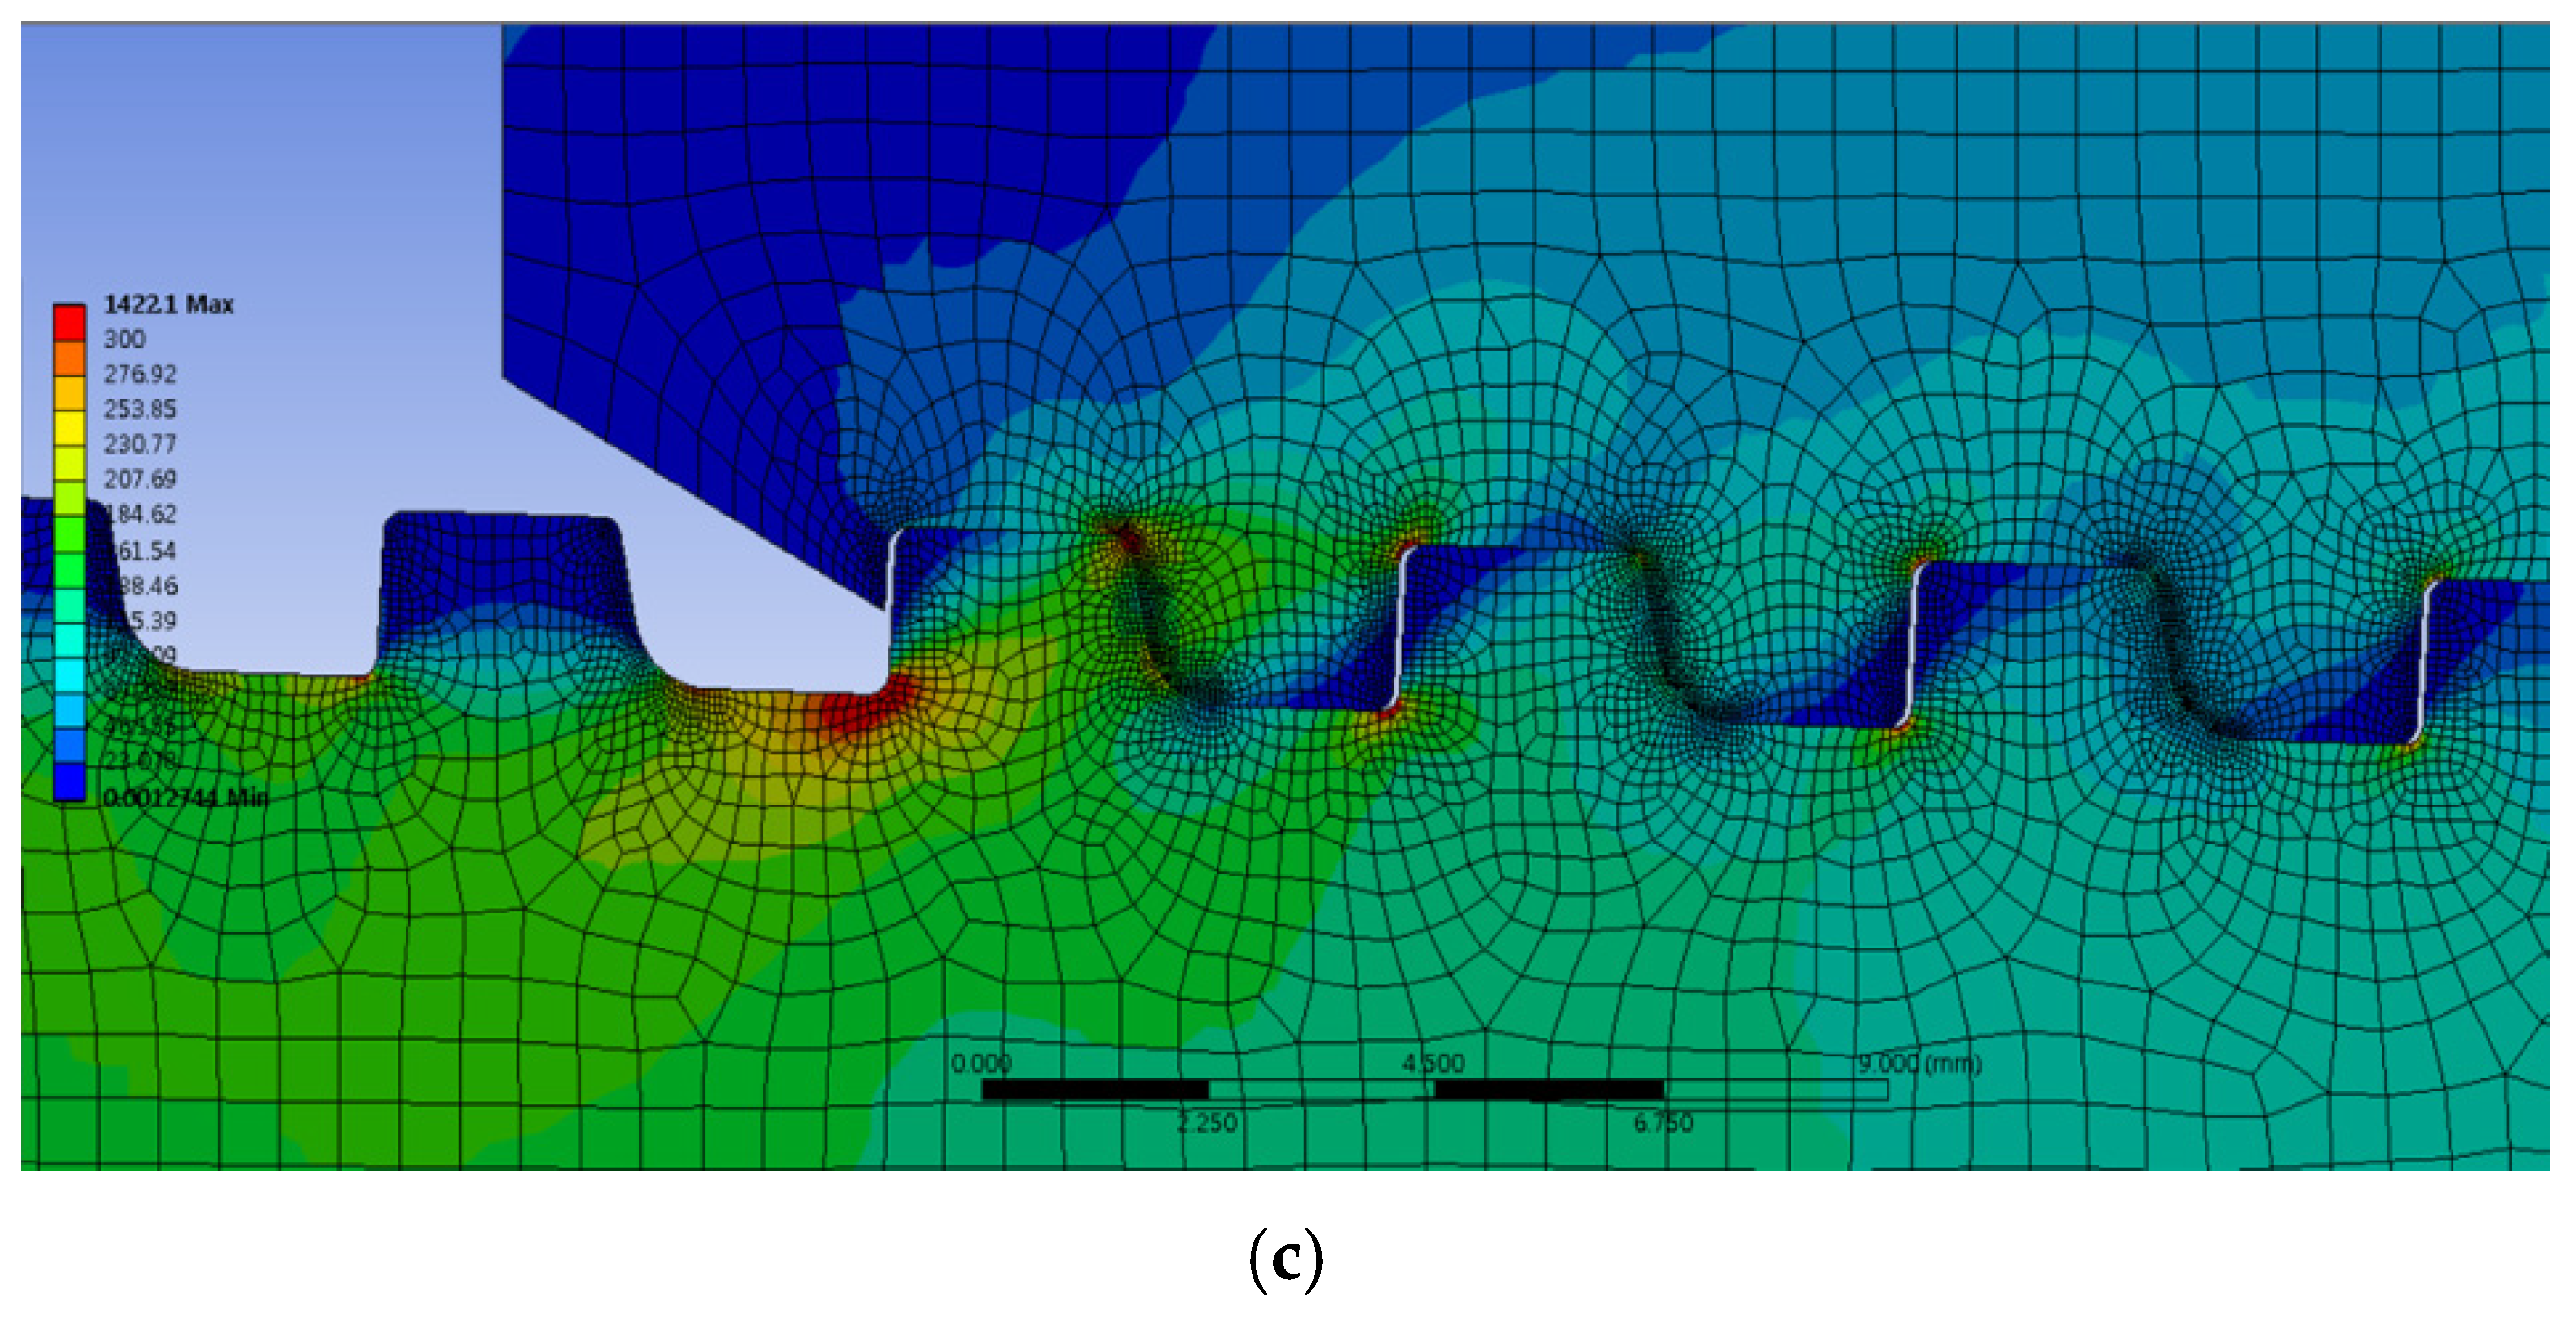
For the parameters relating to the stabbing flank upper corner radius, the original and optimal values were compared. In order to facilitate easy recognition of the data, the von Mises stress was tabulated, concentrating on the areas with the highest stress.
As depicted in
Figure 23, the stress distribution is similar, but the von Mises stress value is lower with an upper corner radius is 0.4 cm compared to 0.2 cm, and the same follows for the load flank root of the pin thread 1, the stabbing flange crest, load flank root, load flank crest (pin root), load flank root of box thread 1, load flank root of box thread 2, and stabbing flank crest of box thread 3. To reach the final result, the upper stressed area of the upper corner radius was calculated to be 0.2 cm, and a 0.4 cm thread was chosen and compared to the RMS value. The comparison of the differences between the upper corner radius of 0.2 cm (original value) and 0.4 cm (ideal value) is as follows.
According to
Table 9, the von Mises stress value for the upper flank root of pin thread 1 and the load flank root of pin thread 2 at an upper corner radius of 0.4 cm is greater than at 0.2 cm. In the remaining portion, the von Mises stress value was lower. The von Mises stress value for the stabbing flank crest region of pin thread 1 located at 0.4 cm compared to the upper corner radius of 0.2 cm fell by 31%. It was established that numerous individuals appeared, including a reduction of 7 percent in the final RMS value.
From this analysis, an optimized value for the stabbing flank upper corner radius was suggested according to the stress on the premium connection systems under compression loads. Compared to the original API 5B basic buttress-type premium connection system, this newly designed system shows greater durability against stress.
5. Conclusions
This article optimizes the stabbing flank of a specific premium connection used in oil and gas wells to extract shale gas and oil from deep deposits. When the tensile/compressive force is applied to the premium connection system in accordance with the parameter change related to the stabbing flank for optimization, the von Mises stress and RMS value of each part, in accordance with the tendency of the stress distribution of each weak part, were strictly observed. This research contributes the following to the study of the evolution of the premium connection system:
- (1)
The API 5B basic buttress-type premium connection was initially rendered as a 2D model and a finite element model was built to perform the stress analysis. Consequently, the RMS values were computed for comprehensive optimization.
- (2)
Based on an analysis of the stress distribution in tension/compressive action in response to a change in the upper corner radius, the optimal value was established.
In numerous regions of the top corner radius, the von Mises stress reduces as the radius grows, and the RMS values were determined and compared to the optimum values. The optimum upper corner radius was found to be 0.4 cm.
By conducting this research, a new premium connection system can be designed and built with excellent vibration resistance and extreme endurance. The design can reduce strains, allowing for the creation of premium connections that are more resilient under high-vibration loads. This enables the construction of an appropriate premium connection based on real-world requirements, economy, and efficiency.
However, managing solely the parameters associated with the stabbing flank can negatively impact other regions of the thread, such as the load flank, which may need to also be optimized. In addition, the results obtained will be validated by comparing the results of the fatigue test and the program to the actual test results. Later, it is anticipated that the von Mises stress variations will be analyzed for other parameters such as the thread incision angle, space length, thread length, and pitch change, and a premium connection resistant to vibrational circumstances will be designed.
