You are currently on the new version of our website. Access the old version .
SymmetrySymmetry
  • Article
  • Open Access

10 November 2022

Fabric Surface Defect Detection Using SE-SSDNet

and
1
Department of Materials Science and Engineering, Northwestern Polytechnical University, Xi’an 710072, China
2
Mechanical and Electrical Engineering Department, Xi’an Polytechnic University, Xi’an 710048, China
*
Author to whom correspondence should be addressed.
This article belongs to the Special Issue Advances in Computer Vision, Pattern Recognition, Machine Learning and Symmetry

Abstract

For fabric defect detection, the crucial issue is that large defects can be detected but not small ones, and vice versa, and this symmetric contradiction cannot be solved by a single method, especially for colored fabrics. In this paper, we propose a method based on a combination of two networks, SE and SSD, namely the SE-SSD Net method. The model is based on the SSD network and adds the SE module for squeezing and the Excitation module after its convolution operation, which is used to increase the weight of the model for the feature channels containing defect information while re-preserving the original network to extract feature maps of different scales for detection. The global features are then subjected to the Excitation operation to obtain the weights of different channels, which are multiplied by the original features to form the final features so that the model can pay more attention to the channel features with a large amount of information. In this way, large-scale feature maps can be used to detect small defects, while small-scale feature maps are used to detect relatively large defects, thus solving the asymmetry problem in detection. The experimental results show that our proposed algorithm can detect six different defects in colored fabrics, which basically meets the practical needs.

1. Introduction

In the textile industry, the fabric production process involves many aspects, of which product quality control is the most critical step to ensure efficiency, the most important factor affecting product quality is the fabric surface defects, currently, the textile industry has defined more than 70 kinds of fabric defects [1,2,3,4].
Depending on the different texture backgrounds and defect shapes of fabrics, fabric defect detection algorithms are broadly classified into two categories: traditional algorithms and learning-based algorithms. Most of the traditional algorithms are based on feature engineering with prior knowledge, covering statistical, structural, spectral, and model-based methods. Learning-based algorithms can be further divided into classical machine learning algorithms and deep learning algorithms. Machine learning uses mathematical algorithms to learn and analyze data to make predictions and take decisions in the future, which has been widely employed in recent years and achieved stratifying results in various disciplines and industries [5]. Traditional machine learning algorithms, such as KNN and neural networks [6], are widely used for fabric defect detection probabilities, and feature engineering is one of the main processes of this approach. Traditional methods and conventional machine learning algorithms are not described in this paper.
The rest of this paper is arranged as follows. The second section introduces other researchers’ related work; the third section introduces the details of our method; and the fourth section discusses the experimental setups and analyzes the results. Finally, we summarize our work in Section 5.

3. Proposed Approach

3.1. Overview

This section presents the SE-SSDNet-based method for fabric surface defect detection. Figure 3 shows the detection process of the proposed method, which mainly includes image resizing, data enhancement, model training, and testing.
Figure 3. Detection flow chart.

3.2. Data Augmentation

To test the prediction accuracy of our proposed model, we evaluated our model using the textile defect detection database of Xi’an Polytechnic University and the fabric defect dataset collected by the authors, respectively. Due to the small sample size of the fabric defect dataset collected by the authors, the model is prone to underfitting during the training process, which leads to large errors in the determination of surface defects. Therefore, this dataset requires data enhancement processing [27].
Data augmentation allows limited data to produce more data, increasing the number and diversity of training samples, and thus improving the robustness of the model. Randomly changing the training samples can reduce the dependence of the model on certain attributes, thus improving the generalization ability of the model. The main approach is to apply a series of methods to randomly change the training data, such as panning, rotation, cropping, and background color modification. Each enhanced image can be considered as a new image, so we can continuously provide new training samples for the model, thus enabling the model to learn more discriminative and generalization features. Data augmentation techniques can improve the accuracy of the model and reduce overfitting. In addition, data augmentation can increase the amount of data. When the real training sample cannot be increased, data augmentation is a very effective way to overcome this problem. This process consists of two steps, the first step is image acquisition and the second step is image data expansion, as shown in Figure 4.
Figure 4. Data processing.

3.3. Network Architecture

3.3.1. SE Module

The SE module models the dependencies among each channel of the feature map obtained after the convolution operation, to assign the weights of the channels and introduce the attention mechanism into the network. Its structure is shown in Figure 5, where U is the output of any convolutional layer and x ˜ is the output after merging the weights. Embedding the SE module after the convolutional layers facilitates capturing the spatial correlation between features. After the channel weights are assigned, the output has feature maps of the same size and same dimensionality.
Figure 5. SE module structure.
The SE module consists of three parts. First is the squeeze operation, which is used to describe global information. Next is the Excitation operation for obtaining channel weights. Finally, the fusion operation is used for weight assignment.
The squeezing operation of the SE module is to compress the features in the spatial dimension to keep the input dimension and the output dimension consistent. The information of all points on each output channel is averaged into a value that has a global receptive field representing the corresponding global distribution on the feature channel. It also enables layers close to the input to obtain global information as well. This operation uses a global pool that compresses the input features with the size of C × H × W to the feature descriptions of 1 × 1 × C The calculation formula is:
Z c = F s q ( μ c ) = 1 H × W i = 1 H j = 1 W μ c ( i , j )
where μ c represents the C channel in U .
After the Squeeze operation, the global features of the channel are obtained. Then the global features are operated with Excitation operation to learn the relationship among each channel, and the weight of each channel is generated by using the parameter W. In order to reduce the model complexity and improve the generalization ability, this operation uses two full connection layers to complete. In order to reduce the amount of calculation, the first full connection layer compresses C channels into C/r channels, followed by the ReLU activation functions. The second full connection layer is restored to C channels with the Sigmoid activation function at the end. The calculation formula is (2):
s = F e x ( z , W ) = σ ( g ( z , W ) ) = σ ( W 2 δ ( W 1 z ) )
where r refers to the scaling ratio, the default value is 16. W 1 , W 2 are two fully connected layers,   W 1 R c r × c   ,     W 2 R c r × c .
δ is ReLU function, σ is the gate function, here refers to the sigmoid function. The s obtained in the second step has the feature map information of each channel, and each number in s represents the weight of each channel, respectively. Finally, the original feature layer U is combined with the weights obtained. The channel weights are allocated according to the channel multiplication and then weighted. The calculation formula is (3):
X ˜ c = F s c a l e ( μ c , s c ) = s c μ c

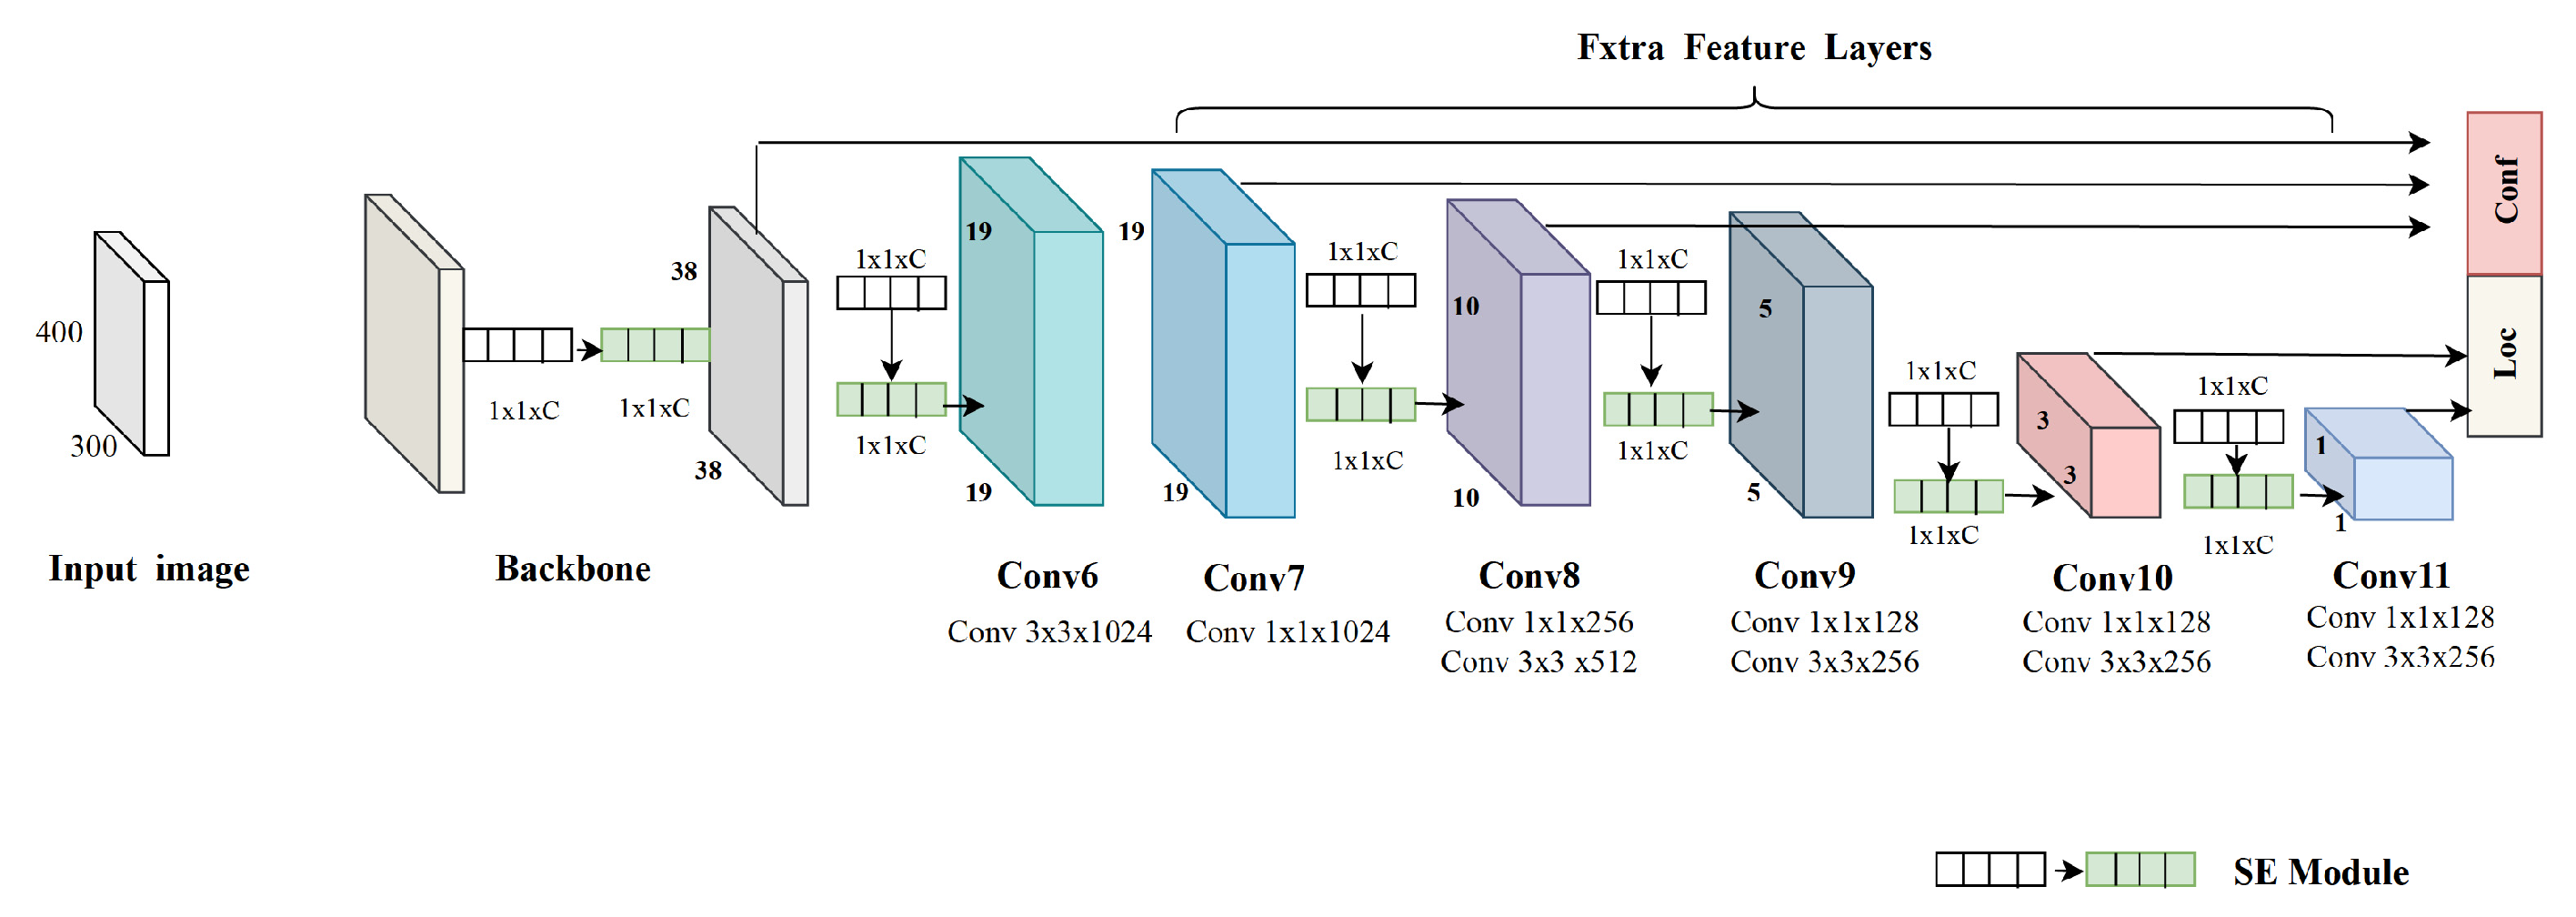
3.3.2. Detection Network Architecture

Our proposed fabric defect detection network is the modification of the SSD network [28]. In this network, the SE module is added to its convolutional layers to improve the network attention. The basic model is VGG. It consists of 16 convolution layers, and the sizes of the convolution cores on each convolutional layer are the same. FC6 and FC7 are converted into 3 × 3 convolution layer conv6 and 1 × 1 convolution layer conv7, FC8 layer, and all dropout layers are removed, and then SE is added on this basis SE_0, SE_1, SE_2, conv_8, SE_3, conv_9, SE_4, conv_10, SE_5, conv_11 layer. Take part of the layer output as the effective feature layer. The network structure is shown in Figure 6:
Figure 6. Network structure.
During the training process, the default box that matches the ground truth in the image is determined first, and the bounding box corresponding to the default box will be responsible for predicting defects. Suppose there are m feature layers. On each feature layer, the generation formula of the default box is as follows:
S k = S min + S max S min m 1 ( k 1 ) , k [ 1 , m ]
where S k indicates the ratio of the prior frame size to the picture, S min and S max indicates the minimum and maximum values of the ratio, respectively.
A large number of default boxes will be generated on the same feature map. NMS (no maximum suppression) algorithm [29] is applied to filter the generated default boxes, and the optimal detection frame is obtained after removing unnecessary default boxes. When selecting default boxes, confidence and IOU (Intersection over Union) [30] are the two indicators that are considered. Confidence refers to the matching degree of the target in the default box, so as to score each default box. IOU is the overlap rate between the default box and the ground truth box generated by the algorithm. The default box with the largest IOU is taken as the training object so that each label box corresponds to a default box. For the remaining unmatched default boxes, select the IOU of the labeled box greater than 0.5 as the negative sample, and the IOU of the labeled box less than 0.5 as the positive sample. In order to balance the sizes of positive and negative samples, the negative samples are arranged in descending order of confidence error, and the larger error is selected as the negative training sample. Finally, the ratio of positive and negative samples is close to 1:3.
The loss function of the network is defined as the weighted sum of two parts, including location error (Localization loss) and confidence error (Confidence Loss). It is defined as follows:
L ( x , c , l , g ) = 1 N ( L c o n f ( x , c ) + α L l o c ( x , l , g ) )
where N is the number of positive samples in the default box, α is the weight between positioning and classification loss, and the default value is set to 1.
For the position error, the loss is the loss of only positive samples, which is defined as the preselected box and the bounding box SmoothL1. The parameters of the loss function regression are the center offset of the default box (cx, cy) and the height h and width w of the box. The calculation formula is as follows:
s m o o t h L 1 ( x ) = { 0.5 x 2 i f | x | < 1 | x | 0.5 o t h e r w i s e
L l o c ( x , l , g ) = i P o s m { c x , c y , w , h } N x i j k s m o o t h L 1 ( l i m g ˜ j m )
where g ˜ j c x = ( g j c x d i c x ) / d i w , g ˜ j c y = ( g j c y d i c y ) / d i h , g ˜ j w = l o g ( g j w d i w ) , g ˜ j w = l o g ( g j w d i w ) .
For confidence, the classification loss includes positive samples and negative samples. Using multi-class SoftMax cross-entropy loss [31], the calculation formula is as (8):
L c o n f ( x , c ) = i P o s e N x i j p l o g ( c ˜ i p ) i N e g l o g ( c ˜ i 0 )
where c ˜ i p = e x p ( c i p ) p e x p ( c i p ) .
In the prediction phase, the category and confidence value of each predictor box are first determined based on the category confidence, and then the predictor boxes that belong to the background are filtered out. The prediction boxes with confidence thresholds lower than 0.5 are filtered out, the retained prediction boxes are decoded and their true position parameters are obtained based on the default boxes. Meanwhile, the position of the prediction box should not exceed the picture. After decoding, the prediction boxes are sorted in descending order according to the confidence level. Finally, Top-k prediction boxes [32] are kept. Based on this, the non-maximum suppression (NMS) algorithm is used to filter out the prediction frames with a large amount of overlap, and the retained prediction frames are the detection results.

4. Experiments and Discussion

In this section, we choose two datasets for validation, namely, a textile defect detection database from Xi’an Polytechnic University and a defect dataset collected by the authors. Our own dataset is from a textile company in China. It contains six types of defects commonly found in color fabrics, each of which is classified into simple and complex textures. These defects are named Podong, Maobian, Huangze, Duanjingwei, and Dimo according to the cause and appearance shape, as shown in Figure 7. In the following, the experimental setup is first described in detail, and then the experiments were performed in two directions:
Figure 7. (af) shows six different defect samples. (1–6) shows simple texture samples. (7–12) shows complex texture samples.
(1)
The proposed detection model is applied to two fabric datasets;
(2)
The proposed defect detection model is compared with the other three representative detection models.

4.1. Experimental Setup

To validate the performance of our proposed fabric defect detection model, we conducted experiments using Pytorch on Ubuntu 18.04 operating system. The system is powered by an Intel Core i9-9900k processor with an NVIDIA GeForce GTX2080Ti (11 GiB) graphics card. The dataset used consists of 2000 original images divided into a training set, a validation set, and a test set. The number of samples in each sub-dataset is 1400, 220, and 380, respectively. Accuracy (ACC) and loss curve (Loss) are applied to evaluate the performance of the detection model. ACC is the most common evaluation metric. In general, the higher the ACC, the better the performance of the model. The loss curve can be demonstrated that the proposed loss function converges to 0 as the learning process proceeds. The accuracy is defined as Equation (9).
A c c = T P + T N T P + T N + F P + F N
In this equation, TP represents the number of samples correctly classified as positive; FP represents the number of examples incorrectly classified as positive; TN represents the number of examples correctly classified as negative; and FN represents the number of examples incorrectly classified as negative.
We plot the data output from the learning process as shown in Figure 8 and Figure 9. From the figure, we can see that the ACC of the method proposed in this paper is about 81%, while the ACC of S_MobileNet, S_EfficientNet, and SSD is about 79%, 78%, and 78%, respectively. According to the loss curves, the loss values of the whole model converge steadily during the learning process. These evaluation metrics prove that the method proposed in this paper can improve the accuracy of fabric defect detection and that detection performance is relatively stable.
Figure 8. Accuracy curve.
Figure 9. Loss curve of the proposed method.
During the training process, the network structure was implemented by Pytorch. The learning rate was set to 0.0003. Considering the image size and GPU memory limitations, we set only 32 images for each iteration, in other words, the batch size was 32.

4.2. Result Analysis

According to the method proposed in this paper, some typical test results are shown in Figure 10 and Figure 11. The proposed detection model can successfully detect defects with different shapes, sizes, and positions.
Figure 10. Simple textile defect detection results.
Figure 11. Complex textile defect detection results.
Figure 10 and Figure 11 respectively show the detection results of defects on fabrics with simple texture and complex textures. It can be seen that even tiny defects (such as those in Figure 8) can be accurately identified by the model. In addition, the model also showed excellent adaptability to the brightness variation under different light conditions (in Figure 8). Furthermore, this result confirms the robustness of the proposed defect detection model to texture features and illumination changes.

4.3. Method Comparison

In order to further verify the effectiveness of the proposed model in fabric defect detection, its detection performance is compared with three other representative defect detection methods. They are S_MobileNet, S_EfficientNet, and SSD, which are currently the most representative methods based on learning models. Therefore, this paper presents a comparative model for the detection of defects. Evaluation is based on real fabric samples in the same environment. The result is shown in Table 2, which summarizes the performance of the four inspection models for different defect types, and it can be seen from Figure 12 that the performance of our inspection model is better than the other three models.
Table 2. Model performance comparison.
Figure 12. Comparison of methods.

4.4. Discussion

With the above elaboration, the effectiveness of SE-SSD is verified, but to be deployed in the industry, there are issues of generalization, robustness, and real time to be considered. The following items are worth discussing, and they are also the focus of our next R&D.
(1)
For point defects of fabrics, sometimes there are misjudgments. For such defects, we adopt the fabric surface defect detection algorithm based on the GAN network [33] and Hough transform, by introducing the generative GAN network to simulate defect samples, performing random Hough transform on the obtained defect samples. Then, plotting the defect location in the original fabric image and returning the coordinate value of the defect location greatly improves the detection efficiency.
(2)
For the probability problem of texture affecting defect misclassification, the traditional fabric surface defect detection algorithm based on L0 gradient minimization smoothing [34] and K-means clustering can be used. The core idea is to improve the contrast between the defect region and the background region, use the image smoothing method to remove the image texture and retain the larger edges in the image, then treat the defect region and the background region as two different classes of pixel points. Finally, use the K-means clustering method to segment the defect region and the background region, and binarize the image so that the defects are completely separated.
(3)
For real-time consideration, the SSD model can be compressed by reducing the number of channels and setting a priori frame values that are more in line with the data according to the characteristics of cloth defects, especially the loss function can be optimized, and different model frames can be used for different textures of cloth. As the training time of SE-SSD is too long, the data set can be divided according to the proportion, 90% of the data set is divided into the training set and 10% of the data set is divided into the test set. Specific data enhancement means are applied to the training set to simulate various lighting conditions through color space transformation for data augmentation to improve the generalization ability and real-time performance of the model. The next step focuses on the effect of cloth parameters on the model, thus improving the real-time performance in terms of model prediction.

5. Conclusions and Future Work

5.1. Conclusions

In this paper, we propose an end-to-end fabric defect detection model by combining deep learning techniques, which is the first adaptive and multi-scale detection of fabric defects by combining the SE module and SSD network. The fabric detection model obtained by training a certain amount of data can accurately detect fabric surface defects for fabric surface quality problems of different sizes, textures, and lighting conditions. The method proposed in this chapter first performs a Squeeze operation on the convolved feature map of the SSD network to obtain global features. Then, the global features are subjected to an Excitation operation to obtain the weights of different channels and then multiply them with the original features to form the final features. According to the different weight values, the model pays more attention to the channel features with high information content.
The innovative aspects of this paper are as follows:
We propose a novel deep learning algorithm SE-SSDNet that can be used for fabric defect detection. It is particularly suitable for fabric defects with different textures and shapes as well as colored fabrics.
In this paper, by introducing the squeeze and Excitation modules into the SSD detection network, the network attention mechanism is enhanced, and the detection efficiency and self-adaptability are improved.
The experimental results are compared with those on Efficient Net and MobileNetV3, and the results demonstrate that our method greatly improves the accuracy and detection efficiency of fabric defect detection. The experimental results show that our model can detect defects adaptively in simple and complex texture backgrounds with an average accuracy of 81.7%. Through comparison experiments, the average accuracy of our model outperforms the other three models, effectively improving the efficiency of fabric detection.

5.2. Future Work

During the experiment, there is basically no problem for monochrome fabrics, but there are still some defects that cannot be detected for brightly colored color fabrics, such as Djwei, and the accuracy of the model cannot meet the actual detection requirements, in addition, real-time is also the key to detecting surface defects on fabrics. We are currently optimizing and adjusting with textile enterprises, in the future, we plan to make appropriate modifications to the detection network and increase the fabric parameters, so that the model has a higher detection rate for that various types of defects, through a comprehensive comparison and statistics of the real-time detection of textile enterprises, the deployment of the model to the automatic detection system is the direction of our future work and key tasks.

Author Contributions

Conceptualization, T.Z.; methodology, T.Z.; software, H.Z.; data curation, H.Z.; writing—original draft preparation, H.Z.; writing—review and editing, T.Z.; visualization, H.Z.; supervision, T.Z. All authors have read and agreed to the published version of the manuscript.

Funding

This research received Major Projects of Guangzhou City of China funding (201907010012).

Institutional Review Board Statement

Not applicable.

Data Availability Statement

Not applicable.

Conflicts of Interest

The authors declare no conflict of interest.

References

  1. Hanbay, K.; Talu, M.F.; Özgüven, Ö.F. Fabric defect detection systems and methods—A systematic literature review. Optik 2016, 127, 11960–11973. [Google Scholar] [CrossRef]
  2. Bullon, J.; Arrieta, A.G.; Encinas, A.H.; Dios, A.Q. Manufacturing processes in the textile industry. Expert Systems for fabrics production. Adv. Distrib. Comput. Artificial Intell. J. 2017, 6, 15–23. [Google Scholar]
  3. Singh, K.; Kaleka, J.; Kaleka, J. Identification and classification of fabric defects. Int. J. Adv. Res. 2016, 4, 1137–1141. [Google Scholar] [CrossRef]
  4. Song, L.; Li, R.; Chen, S. Fabric defect detection based on membership degree of regions. IEEE Access 2020, 99, 1. [Google Scholar] [CrossRef]
  5. Li, Y.; Zhang, D.; Lee, D.-J. Automatic fabric defect detection with a wide-and-compact network. Neurocomputing 2019, 329, 329–338. [Google Scholar] [CrossRef]
  6. Patil; Minal; Verma, S.; de Wako, J. A review on fabric defect detection techniques. Int. Res. J. Eng. 2017, 4, 131–136. [Google Scholar]
  7. Zhao, Y.; Hao, K.; He, H.; Tang, X.; Wei, B. A visual long-short-term memory based integrated CNN model for fabric defect image classification. Neurocomputing 2019, 380, 259–270. [Google Scholar] [CrossRef]
  8. Peng, P.; Wang, Y.; Hao, C.; Zhu, Z.; Liu, T.; Zhou, W. Automatic Fabric Defect Detection Method Using PRAN-Net. Appl. Sci. 2020, 10, 8434. [Google Scholar] [CrossRef]
  9. Li, C.; Li, J.; Li, Y.; He, L.; Fu, X.; Chen, J. Fabric Defect Detection in Textile Manufacturing: A Survey of the State of the Art. Secur. Commun. Netw. 2021, 2021, 13. [Google Scholar] [CrossRef]
  10. Liu, Z.; Liu, S.; Li, C. Fabric defects detection based on SSD. In Proceedings of the 2nd International Conference on Graphics and Signal Processing: ICGSP’18, Sydney, Australia, 6–8 October 2018. [Google Scholar]
  11. Jin, L.; Liu, G. An Approach on Image Processing of Deep Learning Based on Improved SSD. Symmetry 2021, 13, 495. [Google Scholar] [CrossRef]
  12. Zhou, H.; Jang, B.; Chen, Y.; Troendle, D. Exploring faster RCNN for fabric defect detection. In Proceedings of the 2020 Third International Conference on Artificial Intelligence for Industries (AI4I), Irvine, CA, USA, 21–23 September 2020. [Google Scholar]
  13. Zhao, Z.; Gui, K.; Wang, P. Fabric defect detection based on cascade faster R-CNN. In Proceedings of the 4th Inter-national Conference on Computer Science and Application Engineering, Sanya, China, 20–22 October 2020. [Google Scholar]
  14. Wu, J.; Le, J.; Xiao, Z.; Zhang, F.; Geng, L.; Liu, Y.; Wang, W. Automatic fabric defect detection using a wide-and-light network. Appl. Intell. 2021, 51, 4945–4961. [Google Scholar]
  15. Jun, X.; Wang, J.; Zhou, J.; Meng, S.; Pan, R.; Gao, W. Fabric defect detection based on a deep convolutional neural network using a two-stage strategy. Text. Res. J. 2020, 91, 130–142. [Google Scholar] [CrossRef]
  16. Ouyang, W.; Xu, B.; Hou, J.; Yuan, X. Fabric defect detection using activation layer embedded convolutional neural network. IEEE Access 2019, 7, 70130–70140. [Google Scholar] [CrossRef]
  17. An, M.; Wang, S.; Zheng, L.; Liu, X. Fabric defect detection using deep learning: An improved faster r-approach. In Proceedings of the International Conference on Computer Vision, Image and Deep Learning, Chongqing, China, 10–12 July 2020; pp. 319–324. [Google Scholar]
  18. Zhang, K.; Yan, Y.; Li, P.; Jing, J.; Liu, X.; Wang, Z. Fabric Defect Detection Using Salience Metric for Color Dissimilarity and Positional Aggregation. IEEE Access 2018, 6, 49170–49181. [Google Scholar] [CrossRef]
  19. Hu, J.; Shen, L.; Sun, G. Squeeze-and-Excitation networks. In Proceedings of the IEEE Conference on Computer Vision and Pattern Recognition, Salt Lake City, UT, USA, 18–23 June 2018; pp. 7132–7141. [Google Scholar]
  20. Zhu, Z.; Han, G.; Jia, G.; Shu, L. Modified dense Net for automatic fabric defect detection with edge computing for minimizing latency. IEEE Internet Things J. 2020, 7, 9623–9636. [Google Scholar] [CrossRef]
  21. Wang, Z.; Jing, J.F. Pixel-wise fabric defect detection by CNNs without labeled training data. IEEE Access 2020, 8, 161317–161325. [Google Scholar] [CrossRef]
  22. Huang, Y.Q.; Jing, J.F.; Wang, Z. Fabric defect segmentation method based on deep learning. IEEE Trans. Instrum. Meas. 2021, 70, 1–15. [Google Scholar] [CrossRef]
  23. Pourkaramdel, Z.; Fekri-Ershad, S.; Nanni, L. Fabric defect detection based on completed local quartet patterns and majority decision algorithm. Expert Syst. Appl. 2022, 198, 116827. [Google Scholar] [CrossRef]
  24. Fekri-Ershad, Shervan, Tajeripour, Multi-Resolution and Noise-Resistant Surface Defect Detection Approach Using New Version of Local Binary Patterns. Appl. Artif. Intell. 2017, 31, 395–410. [CrossRef]
  25. Hu, J.; Shen, L.; Albanie, S.; Sun, G.; Wu, E. Squeeze-and-Excitation Networks. IEEE Trans. Pattern Anal. Mach. Intell. 2020, 42, 2011–2023. [Google Scholar] [CrossRef]
  26. Liu, W.; Anguelov, D.; Erhan, D.; Szegedy, C.; Reed, S.; Fu, C.-Y.; Berg, A.C. SSD: Single Shot MultiBox Detector, Computer Vision—ECCV 2016 Lecture Notes in Computer Scienc; Springer International Publishing AG: Berlin/Heidelberg, Germany, 2016; pp. 21–37. [Google Scholar]
  27. Howard, A.; Sandler, M.; Chu, G.; Chen, L.-C.; Chen, B.; Tan, M.; Wang, W.; Zhu, Y.; Pang, R.; Vasudevan, V.; et al. Searching for MobileNetV3. In Proceedings of the 2019 IEEE/CVF International Conference on Computer Vision (ICCV), Seoul, Korea, 27 October–2 November 2019; pp. 1314–1324. [Google Scholar]
  28. Simonyan, K.; Zisserman, A. Very deep convolutional networks for large-scale image recognition. arXiv 2014, 1409–1556. [Google Scholar] [CrossRef]
  29. Chu, J.; Zhang, Y.; Li, S.; Leng, L.; Miao, J. Syncretic-NMS: A Merging Non-Maximum Suppression Algorithm for Instance Segmentation. IEEE Access 2020, 8, 114705–114714. [Google Scholar] [CrossRef]
  30. Rezatofighi, H.; Tsoi, N.; Gwak, J.; Sadeghian, A.; Reid, I.; Savarese, S. Generalized intersection over union: A metric and a loss for bounding box regression. In Proceedings of the IEEE/CVF Conference on Computer Vision and Pattern Recognition, Long Beach, CA, USA, 15–20 June 2019; pp. 658–666. [Google Scholar]
  31. Li, X.; Wang, W.; Hu, X.; Li, J.; Tang, J.; Yang, J. Generalized focal loss v2: Learning reliable localization quality estimation for dense object detection. In Proceedings of the IEEE/CVF Conference on Computer Vision and Pattern Recognition (CVPR), Nashville, TN, USA, 19–25 June 2021; pp. 11632–11641. [Google Scholar]
  32. Nemoto, K.; Hamaguchi, R.; Imaizumi, T.; Hikosaka, S. Classification of rare building change using CNN with multi-class focal loss. In Proceedings of the 2018 IEEE International Geoscience and Remote Sensing Symposium, Valencia, Spain, 22–27 July 2018; pp. 4663–4666. [Google Scholar]
  33. Liu, J.; Wang, C.; Su, H.; Du, B.; Tao, D. Multistage GAN for Fabric Defect Detection. IEEE Trans. Image Process. 2020, 29, 3388–3400. [Google Scholar] [CrossRef] [PubMed]
  34. Zhang, H.; Ma, J.; Jing, J.; Li, P. Fabric Defect Detection Using L0 Gradient Minimization and Fuzzy C-Means. Appl. Sci. 2019, 9, 3506. [Google Scholar] [CrossRef]
Publisher’s Note: MDPI stays neutral with regard to jurisdictional claims in published maps and institutional affiliations.

Article Metrics

Citations

Article Access Statistics

Multiple requests from the same IP address are counted as one view.