Abstract
Tuberculosis is curable, still the world’s second inflectional murderous disease, and ranked 13th (in 2020) by the World Health Organization on the list of leading death causes. One of the reasons for its fatality is the unavailability of modern technology and human experts for early detection. This study represents a precise and reliable machine vision-based approach for Tuberculosis detection in the lung through Symmetry CT scan images. TB spreads irregularly, which means it might not affect both lungs equally, and it might affect only some part of the lung. That’s why regions of interest (ROI’s) from TB infected and normal CT scan images of lungs were selected after pre-processing i.e., selection/cropping, grayscale image conversion, and filtration, Statistical texture features were extracted, and 30 optimized features using F (Fisher) + PA (probability of error + average correlation) + MI (mutual information) were selected for final optimization and only 6 most optimized features were selected. Several supervised learning classifiers were used to classify between normal and infected TB images. Artificial Neural Network (ANN: n class) based classifier Multi-Layer Perceptron (MLP) showed comparatively better and probably best accuracy of 99% with execution time of less than a second, followed by Random Forest 98.83%, J48 98.67%, Log it Boost 98%, AdaBoostM1 97.16% and Bayes Net 96.83%.
1. Introduction
Tuberculosis is a precarious dysfunction to species of humanity and one of the leading causes of human life expiration in developing countries of Asia like Pakistan, India, and Afghanistan. Mycobacterium Tuberculosis (M. tuberculosis) bacterium is a causative agent of Tuberculosis, its highly aerobic physiology demands a massive amount of Oxygen for survival, making this bacterium a mammalian respiratory system pathogen. This bacterium propagates through the air when a person with a weak immune system remains closer to someone with M. tuberculosis in his lungs for a specific period. The probability of getting Tuberculosis depends on the intensity of exposure to this infectious bacterium. The research aims to use computer-aided techniques for the timely detection of lung tuberculosis while ensuring accuracy [1].
Image processing is one of the most progressive subcategories of digital signal processing. It is the use of computer algorithms on digital images. Digital images are usually considered to have two dimensions 2D (can be more than two), 3D, 4D, etc., which is why digital image processing can easily be modelled as multidimensional systems. A much better and broader range of algorithms applies to digital images than analog signals [2].
Biomedical image processing allows medical diagnosis and detection through automatic and intelligent systems trained on features extracted from images produced by computer-aided technology like Computerized tomography. Its fundamentals include classical analysis, texture analysis, search, filtering, outlining, and noise cleaning [3]. White blood cells analyzer and computerized tomography (CT) are the two most fruitful biomedical imaging devices since 1970. Nowadays, TB detection and diagnostics are possible with any automated system based on biomedical images like chest X-rays (CXR), medical resonance imaging (MRI), digital microscopy, and computerized tomography [4].
Every cell in the human body goes through cellular metabolism (which produces carbon dioxide (CO2) as waste after utilizing Oxygen (O2)) to maintain its life. So, every cell needs Oxygen to live and excrete Carbon dioxide as a waste from the body [5]. Humans are gifted with lungs specially designed to exchange gases every time they breathe in and out. The structure of the human lungs is shown in Figure 1.
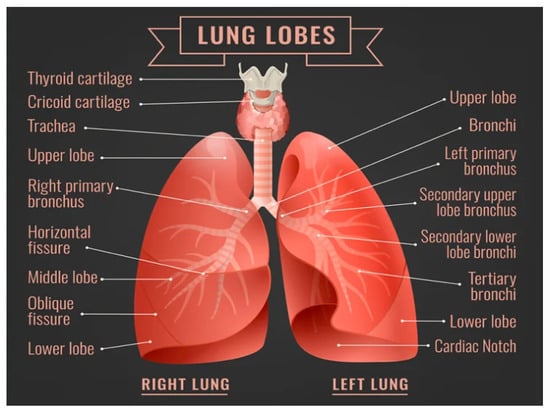
Figure 1.
Human Lungs [6].
The pair of Lungs is the center of the respiratory system. The lung on the right side has three lobes, while the left lung is made up of two lobs along with space for the human heart. The lung starts after the trachea (the tube that carries air in and out) is connected to the bronchus (the lung airway) in a Y shape from upside down in the human chest called the bronchial tree. Each bronchus gets divided into smaller bronchi, even into 30,000 smaller tubes called bronchioles which are spread in every part of the lung. Each bronchioles tube ends with about 600 million grape bunches shaped as tiny air sacs (called alveoli). Bubble shape alveoli create plenty of room for Oxygen to pass into the body [7].
Respiration is completed in two phases’ inspiration (inhaling Oxygen) and expiration (exhaling carbon dioxide). When humans breathe, air comes from the nose and mouth and passes through the throats, trachea, right and left bronchi, bronchiole tubes, and finally into the alveoli. Each alveolus is covered with capillaries (tiny blood vessels) responsible for gas exchanges. Deoxygenated blood (blood with excessive carbon dioxide) from the heart passes through veins. It gets Oxygen and Carbon dioxide out through the thin walls of alveoli. Oxygenated blood (blood with concentrated Oxygen) is sent back to the heart, and carbon dioxide is exhaled in the reverse path [8].
1.1. Related Works
OlfaHrizi, Karim Gasmi., et al. have investigated that Tuberculosis (TB) is a very contagious disease that directly effects on lungs. Then it is called pulmonary TB” while when it affects the other body organs, it is called extrapulmonary TB. Computer science plays a vital role in the medical field in detecting different diseases. The authors optimized a machine learning-based approach which extracts optimal texture features from Scanned images and selects the classifiers’ hyper-parameters, increasing the accuracy rate.
Zhiheng Xing, et al. discussed in their research that many diseases spread all around the world very rapidly. For this purpose, many computer-based techniques have been used to find accurate results that help cure different diseases. This study explains two main factors: cavitary and bronchiectasis regions in CT images, which elaborate a machine learning approach to lung diseases. This study provides insight into machine learning-based identification of NTM lung diseases from PTB, and more importantly, it makes early and quick diagnosis of NTM lung diseases possible that can facilitate lung disease management and treatment planning.
Díaz-Huerta, J.L., et al. proposed a segmentation-based method for detecting acid-fast bacilli to diagnose pulmonary Tuberculosis [9]. 200 images from 30 oscilloscopes processed using staining were obtained as a dataset. A database was created by collecting RGB values of these selected images, extracted by MATLAB program NetLab3_3library was used to train Bayes classifier + Gaussian mixture for training pf background and bacillus class. A total of ten centers, 6 Gaussians for bacillus and 4 for the environment, were determined by using K mean algorithm. Later, 200 images were classified into the following classes “adequate, little blue and purple, excess of blue or purple, bacilli stained in both blue and purple colors.” This bacilli segmentation has an effectiveness of 92.0% for original images and 98% for normalized images. The presented method is considered reliable due to different images’ significance ranging from 85 to 97%. Pre-processing can help eliminate variability by producing standardized RGB image components, enhancing system robustness. To get adequate segmentation resolution of the image must be considered [10]. Rohmah, R.N., et al. proposed a statistical approach for pulmonary tuberculosis detection especially addressing two problems, namely “long waiting time for patients” and “doctor subjectivity.” The dataset consists of 25 regular and 25 TB digital grayscale X-ray images obtained from Sardjito Hospital, Yogyakarta, which were used for training classifiers. Later on, 50 more images were also used for testing system performance. After image acquisition, ROI templates were created through pre-processing, including image cropping, resizing, image averaging, and grey level thresholding technique” five statistical characteristics of image histogram entropy, kurtosis, skewness, mean and standard deviation were calculated. Two feature reduction methods, PCA (principle components analysis and LDA (linear discriminant analysis), were compared. Minimum Euclidean distance and Mahalanobis distance classifier were used for classification by calculating statistical features. Primary and secondary image test results were 94.0 and 83.35% accurate [11]. Andayani, U., et al. described a probabilistic neural network-based methodology for the early detection of pulmonary Tuberculosis. 105 standard X-ray and 105 X-ray images with pulmonary Tuberculosis were acquired as data sets for system training. These acquired images have been through resizing, morphological close, Gaussian, thresholding, contrast, and Canny edge detection during pre-processing. Invariant Moment shape characteristics were used for feature extraction, and seven values were taken as features. A probabilistic neural network (PNN) Classifier was imposed to classify features into two classes standard and Tuberculosis infected. PNN successfully identified tuberculosis disease with 96% accuracy [12]. Balaji et al. proposed a segmentation algorithm for improving Computer-Aided Diagnosis systems that diagnose chest disorders using Computed Tomography. The improvement was based on development that will identify significant features of an image for differentiation of different lung diseases. Developing the proposed work will assist physicians in better diagnosis and treatment and reduce the mortality rate by improving the analysis of CT slices for diagnoses of lung disorders [13].
Hooda, et al. presented a deep learning-based automatic system with significantly high accuracy for TB detection through chest radiographs. The proposed method is a result of successfully assembling three standardized architectures: AlexNet, ResNet, and GoogleNet. The data set of 1133 (499 normal and 634 with TB abnormalities) CXRs were acquired from four countries in the world, namely USA, China, Japan, and Belarus, for training testing and validation. Above mentioned three architectures were adapted for training from scratch. The performance of the trained system was evaluated with four different matrices, and it achieved an accuracy of 88.24%, sensitivity of 88.4%, and area under the curve (AUC) of 0.93 [14].
Auwal, N., et al. described an image processing-based technique for determining the severity level of TB. This research is essential because all severity levels of TB, mild, moderate, severe, and very severe treated differently. CXR Images of TB patients acquired from google were enhanced into grayscale color map images (GI) from RGB color map. These images were observed one by one, histogram equalization displaying intensity level and several pixels were created, and expert’s opinions about severity level for comparison later. Image degradation, including decomposition, convolution, compression, and filtration, was performed on GIs. These degraded images were converted to binary and restored with a threshold value greater than 53. The severity level was calculated by indicating an area of infection in the region of interest. Less than 50% of the infected area means mild, 50–70% area moderate, 70–80% severe, and more than 80% of the infected area indicates very severe TB infection [15].
Kim, W., et al. proposed that Computerized tomography (CT) is useful in diagnosing pulmonary diseases TB, lung cancer, Pneumonia, bronchiolitis, metastasis, as well as active and inactive states of TB. Initially, 226 patients were kept under observation, but 38 patients were excluded due to the unavailability of patients for follow-up. Out of the remaining 188 patients, 91% (133 of 146) with pulmonary TB and 76% (32 of 42) without TB were correctly identified. The remaining eight patients with lung cancer, three with Pneumonia, one with diffuse panbronchiolitis, and one with pulmonary metastasis were also diagnosed using CT. Out of 146 TB cases, 80% active and 89% inactive cases were correctly identified [16].
BulutGökten, D., et al. concluded that in most cases, peritoneal TB mimics ovarian cancer and carcinomatosis. Doctors can save the life of a pulmonary TB patient with a timely and correct diagnosis. However, early diagnosis is challenging for clinicians, but careful follow-up and timely treatment is the only way to save a life. So far, advanced diagnostic tests and techniques are not reliable enough to trust with patient life. Still, other clinical information and diagnosing designs can help improve accuracy and conclusion about disease detection [17].
Kant, et al. presented a Tuberculosis detection methodology based on a Deep Learning Neural Network with an accuracy of 83.87% and a precision of 67.55%.
The proposed methodology detects (rod-shaped) bacteria called bacilli in a microscopic image with a specific zoom level. This methodology and TB can also detect other diseases caused by a bacillus. Patch-wise detection strategy was used to classify an image into one of the two classification groups, one with bacillus and the other without bacillus. The architecture of the proposed system was based on five layered, entirely convoluted Neural networks [18].
Eddabra et al. after comparing molecular TB diagnostics with traditional TB testing, the former is much better than the latter concerning time, as molecular diagnostics give reliable results within hours. On the other hand, in the case of sensitivity, molecular tests have lower sensitivity than traditional testing. Molecular tests are costly due to the requirement of laboratory infrastructure and expert technicians. Molecular diagnostics cannot wholly replace cultural testing; however, it may assist technically. Revolutionary technique whole genome sequencing (WGS) can be trusted best, but it demands high-cost resources like complicated bioinformatics procedures, sequencing facilities, and technical skills [19].
Antony et al. proposed a machine learning classification-based methodology for the detection of pulmonary TB through chest X-rays with an accuracy of 80%. 326 normal and 336 abnormal (total = 662) X-rays images of lungs acquired from the National Library of Medicines were taken as input images. Gaussian and Median filters were applied in the pre-processing phase. These pre-processed images went through two types of segmentations: gray–level threshold and watershed segmentation. Regional properties (like area, eccentricity, major axis, and minor axis) were calculated. Statistical features (like mean, standard deviation, skewness, and kurtoses) were extracted and classified by K-Nearest Neighbor (KNN), simple linear regression, and sequential minimal optimization classification (SMO) with an accuracy of 79%, 80%, and 75% respectively [20].
Nachiappan et al. tuberculosis is a universal problem, equally important for developed and developing countries, and awareness of its risk factors is essential to control or slow down its propagation. Imaging is vital in differentiating many patients’ latent infections from inactive and active diseases. Images findings in patients can identify non-tuberculosis mycobacterium pulmonary infections that mimic tuberculosis infections. This finding is significant because non-tuberculosis and tuberculosis infections cannot be treated similarly. Improper treatment of tuberculosis infection may lead this disease to an incurable stage resulting in a valuable life loss [21].
Nour-Neamatollahi et al. proposed an advanced methodology named “Patho-TB” for the acid-fast bacilli (AFB) test. Traditionally acid-fast bacilli test was human skills based with low sensitivity, but the proposed new method was claimed to be more sensitive and less human skill-based. The research was conducted in two phases initially, 38 sputa from Zabol city (Iran) and later on, 476 sputa from Tehran (capital of Iran) were examined by four different methodologies (named Patho-TB, AFB microscopy, culture, and PCR), and results were compared. The patho-TB test’s reduction was almost 100 (with a Cohan kappa value between 0.85–1). The detection Patho-TB test was also 100% positive [22].
Pai, M. et al. explained that its detection is always challenging due to the paucibacillary nature of extrapulmonary-TB, especially in developing countries. The modern world has created Nucleic Acid Amplification Test (NAAT) to meet the challenge of ensuring rapid and accurate diagnosis; however, it is more complex as compared to traditional diagnostic techniques. NAAT can perform better with conventional methods but cannot completely replace traditional procedures like culture, microscopy, biopsy, etc. [23].
Parsons et al. concluded that rapid and accurate methods for detecting TB, and HIV must be made accessible in developing countries to control these fetal diseases. For TB detection, there is no stand-alone test for any patient. Some technique is cost-effective and straightforward but unreliable. At the same time, other complex methods are reliable but more expensive and need technical assistance at their best. Therefore, it is required to ensure that all techniques, especially those recommended by the World health organization (WHO), are available in every country for different kinds of cases. Without proper clinical correlation, only laboratory test results cannot be trusted. For appropriate treatment, laboratory diagnostics and clinical information must be correlated [24].
Shuaib et al. proposed a methodology for calculating the positive predictive value of sputum spear for suspected lung tuberculosis patients in (eastern) Sudan. A total of 383 suspected patients were kept under examination, and two samples were collected from suspected patients in duration between June to October 2014 and January 2016 and July 2016. The sample went through repetitive microscopy and culture for results. A total of 196 was found culture positive, where 171 were infected by M. tuberculosis, and 14 by M. intracellular, and only 11 by mixed specie. 56 of 365 had no signs of m. tuberculosis, raising optimistic prediction to 84.4%. All samples were referred to National Research Laboratory, Germany, for better results [25].
Singer-Leshinsky, et al. suggested treatments, diagnostics, and prevention for different situations of TB. Patients with latent TB living with a high prevalence of TB need nine-month isoniazid or more prolonged therapy to ensure latent TB does not progress to active TB. It is the priority for any clinician that patients with active TB must not become resistive to anti-TB drugs; active TB treatment consists of two phases and almost has a cure rate of 95%, four drugs (regimen: isoniazid, rifampin, pyrazinamide, and ethambutol) for the duration of two months can kill active bacteria, in almost 90% patients it takes 14–90 days for health recovery. Multidrug-resistant Tb is the most difficult to recover due to its treatment and detection inadequacy. This is when a TB patient shows resistive behavior to rifampicin and isoniazid anti-Tb drugs. First, it is necessary to know the resistance pattern by repeating sputum tests and then decide on the duration of treatment. Initially, 4 second-line drugs on daily bases along with therapy are recommended for eight months.
In some cases, this phase is extended up to 20 months or, in the case of recurrent TB, 28 months. Surgical resection is often recommended if patients do not respond to therapy. Third-line drugs are required in this case (called total drug-resistant TB) [26].
1.2. Literature Review Summary
Table 1 shows the summary of related work, including algorithms, datasets type and size and accuracy they had achieved.

Table 1.
Summary of related work.
1.3. Paper Organization
This paper aims to detect lung TB using a machine learning approach from CT scan images. In the previous section, we discussed the introduction and related work. In Section 2, we have discussed the acquisition of datasets, materials, methods, and techniques. The experiment and results are discussed in Section 4. The conclusion has discussed in the final section.
2. Materials and Methods
2.1. Acquisition of CT Scan Images
Due to the unavailability of expensive CT scan devices and the lack of expert human experts, TB is comparatively in high numbers in developing countries of Asia. In Pakistan, CT scan devices are rarely available in private clinics; however, Govt has facilitated public hospitals. After struggles, 100 abnormal (TB infected) and 100 normal CT scan images of lungs were acquired from Bahawal Victoria Hospital (BVH) Bahawalpur, Department of Radiology. Tuberculosis-affected and normal images are shown in Figure 2.
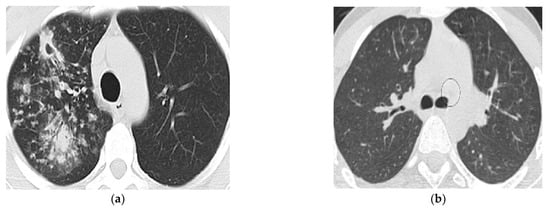
Figure 2.
(a): Tuberculosis affected lung image and (b): Normal lung CT image.
CT scan images of lungs affected by TB could be acquired easily from the internet as labeled data. But all images were not of the same size, quality, and origin, and also not taken from the same device; that was why data standardization was not possible for data collected from internet sources. All of data have been acquired from Bahawalpur Victoria Hospital (BVH), Bahawalpur, Punjab, Pakistan.
2.2. Proposed Solution
The step-by-step approach is explained below:
- The dataset preparation started with the acquisition of 200 CT scan DICOM images from CT scan machine installed in Bahawal Victoria Hospital Bahawalpur, Punjab, Pakistan. And pulmonary disease specialist in Bahawalpur Victoria Hospital visited to label abnormal and normal CT scan images for training and system testing
- Data pre-processing is performed in the second step, including grayscale conversion, selection/cropping, filtering, and cleaning processes on selected labeled images.
- In the third step, statistical/texture features are extracted from pre-processed selected ROIs.
- In the fourth step, the extracted features were optimized to ensure the minimum possible processing time while maintaining accuracy and precision for reliable results.
- In the fifth step, classification algorithms were applied to the training dataset to get the classification results. This step is repeated for cross-validation.
- Now results of various classifications are analysed and compared.
A proposed system model of our work is presented in Figure 3.
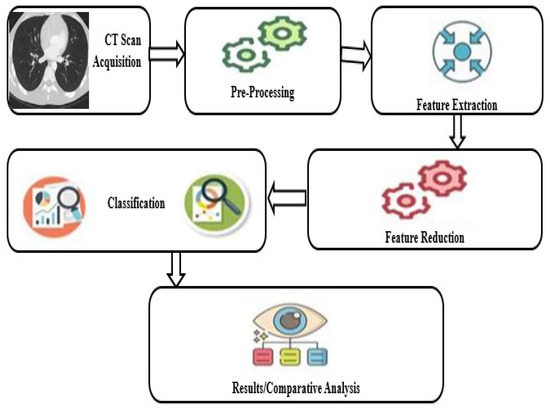
Figure 3.
Proposed system model.
2.3. Image Representation
A 2D digital image can be defined as a function f(x, y) which explains intensity at position (x, y) in a matrix of x rows and y columns. Each pixel in 8-bit greyscale (called black and white) image has 28 = 256 intensity levels ranging from 0 to 255, where black and white are two extreme intensities, 0 is black, and 255 is white [27].
An RGB-colored image is just a three-function pasted together as a vector-valued function
A color image shows a variety of different images by mixing up three intensity levels of r (x, y), g (x, y), and b(x, y).
2.4. Image Pre-Processing
Pre-Processing is vital in preparing standardized datasets and extracting useful features that directly affect results. In this study, the acquired dataset was DICOM images. Each patient’s data contained a different number of DICOM images, and only a few images showed an actual abnormality, i.e., out of 60 images of a single DICOM, only 7 or 8 images would show abnormality. Before pre-processing, only abnormal images are selected. Further steps are given below:
- Selection of interesting abnormal/normal DICOM images out of the complete case
- Cropping selected images for removal of an uninterested region of an image
- Delete the blurred and defected CT scan images
- Resize to 512 × 512 Pixels
- Conversion from RGB to grayscale images in the format of bitmap pixel (.bmp).
2.5. Segmentation
An image taken by CT scan device contains both lungs in almost two halves. Tuberculosis is a bacterial disease that affects the lungs badly; however, it is not necessarily both lungs simultaneously. It might be possible that one lung is infected badly while another lung is functioning normally, or it might be the case that both lungs are infected equally, or sometimes one lung is damaged more rapidly than the other one. Due to the non-linear spread of TB infection, it is impossible to count the whole CT scan image as a region of interest. Choosing only the infected lung area for abnormal and non-infected areas for a normal case study would ensure more precision and accuracy of the developed system for classification. In our research ROI size was kept uniform for both cases was 32 × 32 in a circle shape. Abnormal CT scan images are shown in Figure 4.
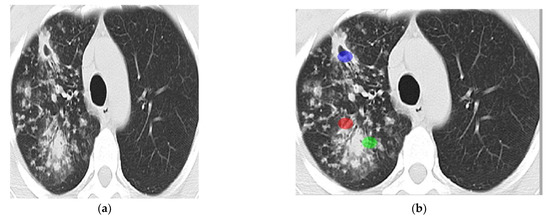
Figure 4.
ROIs selection ((a): Abnormal lung’s CT scan image and (b): 3 ROIs).
Images of different kinds of textures are shown in Figure 5.

Figure 5.
Types of textures [28].
2.6. Statistical Based Texture Features
Biomedical images contain micro-texture. The best way to read or process micro image is through statistical features. The texture is the distribution of gray levels independent of the size and shape of primitives so that statistical features can discriminate different textures based on different gray level values [29]. The approach in this research study deals with tissues having non-regular, non-homogeneous, and random structures. So statistical features are best suited for these medical images.
In a general sense, texture refers to an object’s surface characteristics and appearance given by its elementary parts’ size, shape, density, arrangement, and proportion. Texture feature extraction is an important stage in collecting such features through texture analysis [30]. Due to the signification of texture information, texture feature extraction is critical in various image processing applications like remote sensing, medical imaging, and content-based image retrieval. There are four major application domains related to texture analysis: texture classification, segmentation, synthesis, and shape from texture [31].
In this research statistical texture features from selected 600 regions of interests (ROI’s) has been extracted by using Mazda version 4.6. It is a well-known software package for 2D and 3D image texture analysis. Initially, Mazda was introduced for the analysis of magnetic resonance images (MRI). Only later on, keeping its effectiveness in mind, it has also been used to analyze X-ray and camera images. It provides a complete path for quantitative analysis of texture features, features extraction and selection procedures, supports image segmentation and data visualization tools, and contains algorithms for data classification. Mazda proved its effectiveness in diverse applications in terms of efficiency and reliability, even in more accurate and objective medical diagnoses [32].
2.7. Features Optimizatin
Feature optimization results improved processing speed and enhanced results accuracy within a short processing time. It is a process to reduce the number of features and responsible for the removal of unnecessary, least effective, and most repeatedly valued features that slow down processing time for no good use in this research, 30 optimized features from 3 different techniques (10 features per technique) were acquired using Mazda version 4.6. These 30 optimized features using F (Fisher) + PA (probability of error + average correlation) + MI (mutual information) were selected for final optimization, and only the 6 most optimized features were chosen randomly on hit and trail bases.
2.8. Classification Techniques
The pattern classification, concerning an analysis of the images, involves the acquisition of the features extracted from the image. And their use to automatically recognize the image. This is completed by developing classification algorithms that utilize feature information. Distance or similar measures are used to compare different objects and their feature vectors. The main uses of pattern classification in image analysis relate to the development of image compression and machine vision applications. It can be considered as part of the analysis of the features or as a subsequent processing phase for the extraction and analysis of the features. Pattern classification is, for the most part, the last step in developing a machine vision algorithm. This kind of use aims to recognize objects and their parts for the computer to perform a few exercises identified with vision. These undertakings go from the computerized conclusion of medicinal images to recognizing the object for automated control. Waikato Environment for Knowledge Analysis” developed in New Zealand, is graphical user interface-based free software (licensed under GNU General Public License) containing a wide range of algorithms and visualization tools for data analysis and predictive modeling.
In this study data set consisting of optimized features was classified by trying supervised learning classifiers, including Artificial Neural Network (ANN: n class) based classifier Multi-Layer Perceptron (MLP), which performed # comparatively better and probably best in terms of accuracy. The other prominent classifiers were Random Forest, J48, Log it Boost, AdaBoostM1, and Bayes Net.
2.9. Machine Learning (Training and Testing)
Machine learning involves evaluating procedures that train computers to act as human beings learn logically from experience. Machine learning procedures use automatic methods to “train” facts abstract from data without depending on an encoded equation as a prototypical. The techniques expand their performance, and the number of tasters available for learning increases [33].
2.9.1. Supervised Classification
Based on the idea, a consumer can choose test Pixels within an image to be a delegate of the specific program and direct the image processing software toward applying this preparation site because the reference is used for categorizing every other pixel in the image. Preparation sites (as well recognized because complex set otherwise contribution program) are select base on top of the knowledge of the user. The user also sets the boundaries for other pixels and groups them jointly. These boundaries are regularly set based on the shadow-like uniqueness of the training region, benefit or lesser amount a sure increase (often based on intensity or force of reflection in the exact spectral band). The user also designates the number of lessons into which the image is classified. Many analysts use a mixture of supervised and unsupervised categorization processes in the direction of buildup absolute production examination and categorizing maps [34].
2.9.2. Unsupervised Classification
Unsupervised classification is wherever the outcome (group of pixels by frequent uniqueness) is based on the software examination of an image without the consumer as long as the test program. The computer uses the technique to conclude which pixels be connected and group them into the program. The user can state which algorithm the software determination utilizes and the preferred digit of output classes but otherwise does not help inside the categorization procedure. However, the user has to contain information about the area being confidential. In contrast, the grouping of pixels by frequent individuality shaped by the computer has to be related to actual features on top of the land (such as swampland, urban areas, coniferous forest, etc.) [34].
2.10. Mazda
Mazda is a well-known software package for 2D and 3D image texture analysis. Initially, Mazda was introduced for the analysis of magnetic resonance images (MRI). Only later on, keeping its effectiveness in mind, it has also been used to analyze X-ray and camera images. It provides a complete path for quantitative analysis of texture features, features extraction and selection procedures, supports image segmentation and data visualization tools, and contains algorithms for data classification. Mazda proved its effectiveness in diverse applications in terms of efficiency and reliability, even in more accurate and objective medical diagnoses [32]. Mazda version 4.6 has been used in this research study.
2.11. WEKA
Waikato Environment for Knowledge Analysis” developed in New Zealand, is graphical user interface-based free software (licensed under GNU General Public License) containing a wide range of algorithms and visualization tools for data analysis and predictive modeling [35,36]. Its Java-based (WEKA 3) version is one of the most widely used tools in the research area. It provided the following data mining tasks:
- Data pre-processing (CSV file import, filtering algorithms, transformation, facility to delete instances/attributes on specific criteria).
- Data visualization (Scatter plot matrix and many options for further analysis).
- Feature selection (provides algorithms for identification of most predictive features).
- Clustering (K-means algorithm along with expectation maximization algorithms).
- Association panel (provides access to association rule learners for identification of relationships amongst attributes)
- Classification (Naïve-Bayes, J48, Random Forest, Random Tree etc.).
- Regression (Linear regression, Logistic regression, Simple Linear regression, Support Vector regression, etc.
3. Experiments and Results
Image processing techniques are always effective for better results and contribute a lot to improving different measures of results required to define a helpful system. In this research study, image processing has been implemented by Mazda version 4.6 on 2D CT scan images. First, 200 CT scan images of two categories, Normal (100) and Abnormal (100 containing Tuberculosis), were collected. After that, image cropping and resizing (512 × 512) and conversion into 24-bit RGB bitmap (.bmp) were performed using the image editor program. 3 Circle-shaped non-overlapping ROIs (region of interests) of size 32 × 32 per image were identified from these pre-processed images, which resulted in 300 (100 × 3) normal and 300 (100 × 3) abnormal ROIs. 30 optimized features by using feature extraction technique MI (Mutual Information) + PA (Probability of error + Average correlation coefficient) + F (Fisher) techniques were selected in Mazda. After creating a text file, this file is converted into a CSV file, and then an ARFF file is created for WEKA software to generate further results. For classification of normal and Tuberculosis images, WEKA software version 3.8.3 were used, and different classification algorithms, namely Multi-Layer perceptron (MLP), AdaBoostM1, Log it Boost, Random Forest, Bayes Net, and J48, were applied. Other performance measuring parameters were calculated. These parameters are Correctly Classified Instances, Incorrectly Classified Instances, Kappa statistic, Mean absolute error, Root mean squared error, and Relative absolute error, Root relative squared error along with TP Rate, FP Rate, Precision, Recall, F-Measure, MCC, and ROC Area.
3.1. Comparative Analysis
This research study calculates different performance measuring parameters for classification algorithm comparison. Every algorithm has a different approach to calculation, but every parameter has a unique base. These parameters are shortly introduced below:
TP-Rate:
It is known as the True Positive Rate and is calculated as
TP-Rate = TP/(TP + FN)
TN-Rate:
It is known as the True Negative Rate and is calculated as
TN-Rate = TN/(TN + FP)
FP-Rate:
It is known as the False Positive Rate and is calculated as
FP-Rate = FP/(FP + TN)
FN-Rate:
It is known as the False Negative Rate and is calculated as
FN-Rate = 1−TP − Rate
Accuracy:
It measures how close an algorithm is to a true value.
Accuracy = (correctly predicted class/total testing class instance) × 100%
Precision:
Also called positive predictive value is a relevant measurement of how close two measurements are to each other.
PRECISION = TP/(TP + FP)
Recall:
It is also based on relevant measurement can be defined as a measurement of relevant instances that were classified.
RECALL = TP/(TP + FN)
F-Measure:
It is a weighted Harmonic mean of Precision and Recall.
F-MEASURE = 2*Precision*Recall/(Precision + Recall)
ROC Area:
Receiver Operating Characteristic Curve is a graphical plot equating the TP-rates and the FP- rates of a classifier as the refinement threshold of the classifier is different.
Class:
Two different classes, “Normal” and “Tuberculosis,” have been classified. The Normal class contains several instances with no sign of Tuberculosis or any other lung disease, and the Tuberculosis class contains instances affected by Tuberculosis.
Confusion matrix:
A binary confusion matrix divides an instance into one of two classes based on its performance on a test data set. Its table may be drawn as follows (see Table 2):
Table 2.
A binary confusion matrix.
- “True A” denotes the number of Tuberculosis class instances successfully categorized as Tuberculosis instances.
- “True B” denotes the number of Normal class instances categorized as Normal instances.
- “False A” denotes the number of cases of the Normal class that were incorrectly categorized as Tuberculosis occurrences.
- The term “False B” refers to the number of Tuberculosis cases incorrectly categorized as Normal cases.
3.2. Multilayer Perceptron (MLP) Classifier
Here we presented the Multi-Layer perceptron algorithm execution time, Cross-validation folds. The MLP Classifier summary is also shown in Table 3.
Table 3.
MLP Classifier Summary.
- Time taken: 0.89 s
- Cross-validation folds: 10
3.2.1. Summary
The section contains a summary of MLP classifiers, instances, and errors.
3.2.2. Detailed Performance Measuring Parameters by Class
Here were presented three classes and their accuracies. Table 4 shows the detailed accuracy of MLP Classifier.
Table 4.
MLP Classifier Detailed Accuracy.
3.2.3. Confusion Matrix
This section presents the Classification result using MLP Classifier in Table 5.
Table 5.
Classification result using MLP Classifier.
The accuracy of the dataset using MLP classifier is shown in Figure 6.
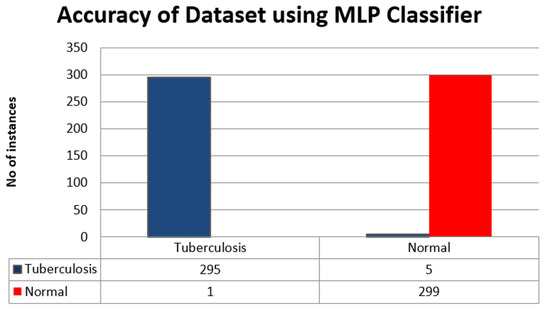
Figure 6.
Accuracy of the dataset using MLP Classifier.
3.3. Random Forest (RF) Classifier
Here we show the time is taken and cross-validation of the RandomForest Classifier algorithm. Also, the RF classifier summary, accuracy, and results are presented.
- Time taken: 0.3 s
- Cross-validation folds: 10
3.3.1. Summary
The summary of RF classifiers’ instances and errors that occurred are presented in Table 6.
Table 6.
RF Classifier Summary.
3.3.2. Detailed Performance Measuring Parameters by Class
The detailed accuracy of RF Classifier is shown in Table 7. There are three classes mentioned in the table below.
Table 7.
RF Classifier Detailed Accuracy.
3.3.3. Confusion Matrix
Here we presented the classification of the results of RF classifier in Table 8. The dataset is classified as A is Tuberculosis and B is normal.
Table 8.
Classification result using RF Classifier.
Also, the accuracy of the dataset using RF classifier is presented as a bar chart in Figure 7.
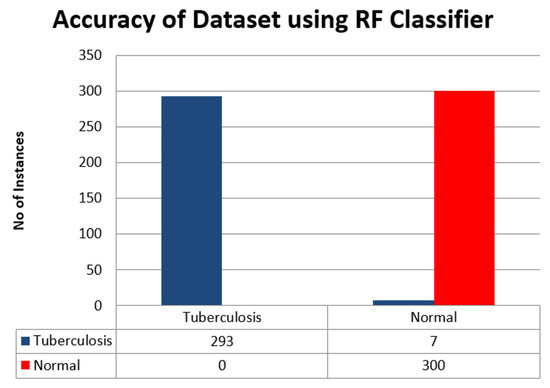
Figure 7.
Accuracy of the dataset using RF classifier.
3.4. J48 Classifier
The summary, accuracy, and results of J48 Classifier are presented in the following tables and figures. For J48 Classifier, the time taken and cross-validation are given below:
- Time taken: 0.03 s
- Cross-validation folds: 10
3.4.1. Summary
Summary of J48 Classifier having instances and errors occurred are presented in Table 9.
Table 9.
J48 Classifier Summary.
3.4.2. Detailed Performance Measuring Parameters by Class
The accuracy of J48 Classifier having three classes is presented in Table 10.
Table 10.
J48 Classifier Detailed Accuracy.
3.4.3. Confusion Matrix
In this section, we presented the results of classes A as Tuberculosis and B as Normal in Table 11. The accuracy of the dataset using J48 classifier is shown in Figure 8.
Table 11.
Classification result using J48 classifier.
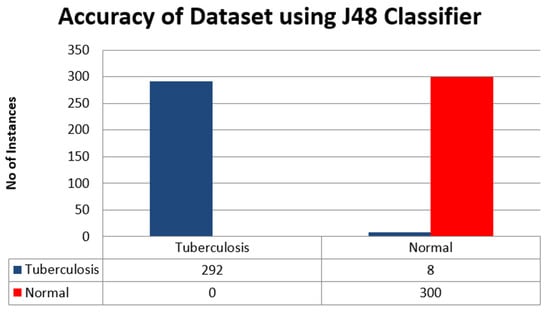
Figure 8.
Accuracy of Dataset using J48 Classifier.
3.5. LogitBoost Classifier
Here we presented the detailed analysis of the LogitBoot Classifier. This section includes a LogitBoot Classifier summary, results, and accuracy in the below tables and a figure. The execution time and cross validity are presented below:
- Time taken: 0.08 s
- Cross-validation folds: 10
3.5.1. Summary
The detailed summary of Logit Boot Classifier having different instances and errors is mentioned in Table 12.
Table 12.
LogitBoot Classifier Summary.
3.5.2. Detailed Performance Measuring Parameters by Class
Here we presented the accuracy of the LogitBoot Classifier by measuring different parameters in Table 13. The table has accuracy for various parameters of the three classes.
Table 13.
LogitBoost Classifier Detailed Accuracy.
3.5.3. Confusion Matrix
Table 14 shows the classification result using LogitBoost Classifier. The data is classified as A and B. A represents Tuberculosis, and B is normal.
Table 14.
Classification result using LogitBoost Classifier.
The accuracy of the dataset using the LogitBoostClassifier is shown in Figure 9. Tuberculosis is represented by the blue bar, and normal is characterized by red.
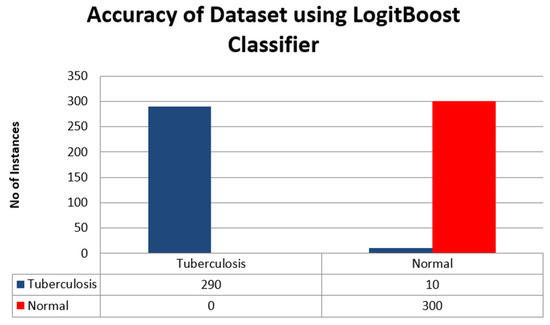
Figure 9.
Accuracy of the dataset using LogitBoost Classifier.
3.6. AdaBoostM1 Classifier
This section presents the AdaBoostM1 classifier summary, accuracy, and results in the following tables and figures. The execution time and cross-validation are mentioned below:
- Time taken: 0.06 s
- Cross-validation folds: 10
3.6.1. Summary
The summary of the AdaBoostM1 Classifier having different instances and errors is mentioned in Table 15.
Table 15.
AdaBoostM1 Classifier Summary.
3.6.2. Detailed Performance Measuring Parameters by Class
Here we presented the detailed accuracy of AdaBoostM1 having different parameters of three classes in Table 16.
Table 16.
AdaBoostM1 Detailed Accuracy.
3.6.3. Confusion Matrix
Table 17 shows the results of the AdaBoostM1 Classifier for class A Tuberculosis and B are normal.
Table 17.
Classification result using AdaBoostM1 Classifier.
Figure 10 shows the accuracy of Tuberculosis in the blue bar and normal data in the red bar of the chart.
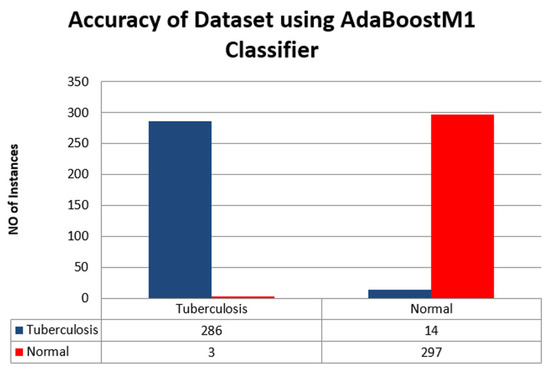
Figure 10.
Accuracy of the dataset using AdaBoostM1 Classifier.
3.7. BayesNet Classifier
This section presents the summary of the BayesNet Classifier in Table 18, accuracy in Table 19, and results in Table 20. The accuracy is also shown as a bar chart in Figure 11.
Table 18.
BayesNet Classifier Summary.
Table 19.
BayesNet Classifier Detailed Accuracy.
Table 20.
Classification result using BayesNet Classifier.
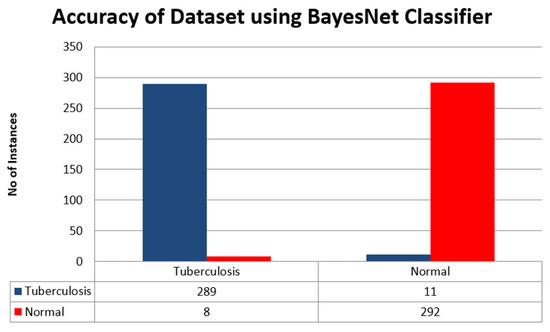
Figure 11.
Accuracy of Dataset using BayesNet Classifier.
- Time taken: 0.03 s
- Cross-validation folds: 10
3.7.1. Summary
The tables below summarise different instances and errors of the BayesNet Classifier.
3.7.2. Detailed Performance Measuring Parameters by Class
The table below shows the BayesNet Classifier’s accuracy having different parameters and their three classes.
3.7.3. Confusion Matrix
The table below shows the results of class A is Tuberculosis, and class B is normal data.
Figure 11 above shows the accuracy of the BayesNet Classifier in the form of a bar chart where Tuberculosis is a blue bar and normal data is a red bar.
3.8. Comparatively Analysis of Applied Pattern Recognition Classifiers
This section presents the accuracy of all algorithms as a bar chart in Figure 12, where:
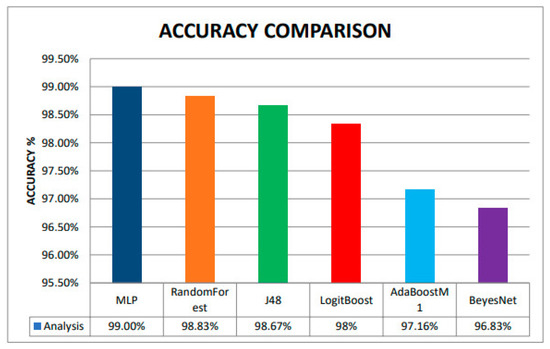
Figure 12.
Accuracy Comparison among different ML classifiers.
- MLP is in the blue color bar,
- RandomForest is an orange color bar,
- J48 is a green color bar,
- LoiyBoost is a red color bar,
- AdBoostM1 is a sky blue color bar,
- BeyesNet is in a purple color bar.
Finally, Multilayer Perceptron is as most accurate Classifier among Random Forest, J48, LogitBoost, AdaBoostM1, and BayesNet with 99% accuracy, followed by 98.83%, 98.67%, 98%, 97.16%, and 96.83% respectively.
4. Results of ANN on Different Parameters
Results have been produced by applying a stochastic optimization algorithm. The primary function of this algorithm is to generate random numbers by seeds. The initial value or weight of the seeds is Zero(0) by default. By applying the random values, multiple results have been generated. From which accuracy level has been measured.
4.1. One Layer with 50 Nodes
MLP classifier summary of one layer with 50 nodes is presented in Table 21.
Table 21.
The MLP Classifier Summary.
MLP classifier detailed accuracy of one layer with 50 nodes is presented in Table 22.
Table 22.
The MLP Classifier Detailed Accuracy.
Accuracy of ANN for one layer having 50 nodes is presented in Figure 13.
Figure 13.
Accuracy of ANN for one layer having 50 nodes.
4.2. One Layer Having 100 Nodes
The Table 23 below shows the MLP classifier summary when one layer having 100 nodes.
Table 23.
The MLP Classifier Summary.
The MLP Classifier Detailed Accuracy of one layer having 100 Nodes is presented in Table 24.
Table 24.
The MLP Classifier Detailed Accuracy.
Figure 14 represents the MLP classifier detailed accuracy of one layer having 100 Nodes.
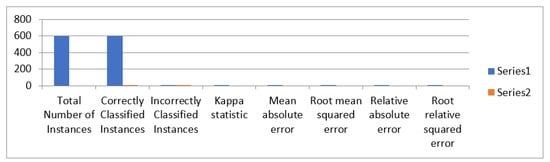
Figure 14.
The MLP classifier detailed accuracy of one layer having 100 Nodes.
4.3. Two Layers with 50,100 Nodes
Results has been updated by using Stochastic Optimization Algorithm. Seeds generate random values having initial weight/value = 0 by default. And we conducted the simulation/test in WEKA. The MLP Classifier Summary is presented in Table 25.
Table 25.
Shows the MLP Classifier Summary.
The detailed accuracy of MLP classifier is shown in Table 26 and Figure 15 for two layers having 50 and 100 nodes.
Table 26.
Shows the MLP Classifier Detailed Accuracy.
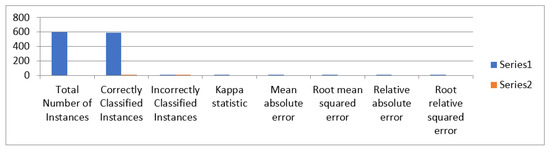
Figure 15.
Accuracy of MLP classifier for two layers having 50 and 100 nodes.
4.4. Three Layers with 50 70 100 Nodes
Summary of MLP classifier is presented in Table 27.
Table 27.
MLP Classifier Summary.
MLP classifier detailed accuracy for three layers having nodes 50, 70, 100 is presented in Table 28 and Figure 16.
Table 28.
MLP Classifier Detailed Accuracy.
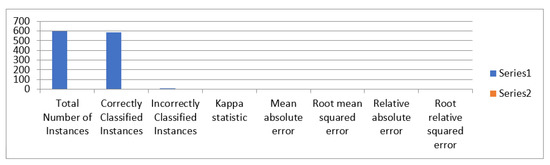
Figure 16.
The accuracy of MLP classifier.
4.5. Comparison of Different Nodes and Layers
A comparison of different nodes and layers is presented in Table 29.
Table 29.
Shows the comparison of different Numbers of Hidden layers and Nodes.
Figure 17 shows instances, number of hidden layers and accuracy.
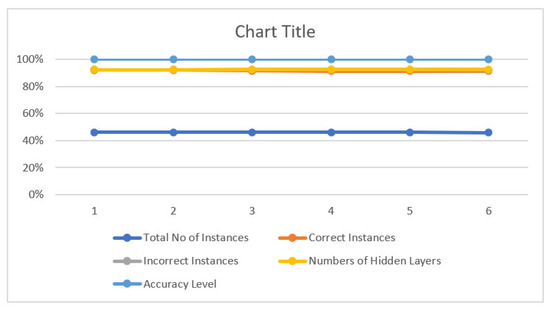
Figure 17.
The accuracy.
- We used different parameters with different numbers of Hidden Layers and Numbers of Nodes.
- We observed our best result with an accuracy of 99.33% occurs when nodes are 100 & 50, and the number of hidden layers is one.
- We also found that as we increase the number of Hidden layers and also the number of nodes, our accuracy decreases to 98%
- The comparison Table 29 above shows different numbers of hidden layers, e.g., up to 5 layers, and different numbers of nodes, e.g., 50,100,70,30, and the result is given in that comparison table.
5. Discussion
In this research study, image processing has been implemented by Mazda version 4.6 on 2D CT scan images. First, 200 CT scan images of two categories, Normal (100) and Abnormal (100 containing tuberculosis), were collected. After that, image cropping and resizing (512 × 512) and conversion into 24-bit RGB bitmap (.bmp) were performed using the image editor program. 3 Circle-shaped non-overlapping ROIs (region of interests) of size 32 × 32 per image were identified from these pre-processed images, which resulted in 300 (100 × 3) normal and 300 (100 × 3) abnormal ROIs. 30 optimized features by using feature extraction technique MI (Mutual Information) + PA (Probability of error + Average correlation coefficient) + F (Fisher) techniques were selected in Mazda. After creating a text file, this file is converted into a CSV file, and then an ARFF file is created for WEKA software to generate further results. For classification of normal and Tuberculosis images, WEKA software version 3.8.3 were used, and different classification algorithms, namely Multi-Layer perceptron (MLP), AdaBoostM1, Log it Boost, Random Forest, Bayes Net, and J48, were applied. Other performance measuring parameters were calculated. These parameters are Correctly Classified Instances, Incorrectly Classified Instances, Kappa statistic, Mean absolute error, Root mean squared error, and Absolute relative mistake, Root relative squared error along with TP Rate, FP Rate, Precision, Recall, F-Measure, MCC, and ROC Area. A machine vision-based approach has been used in this study to detect human lung tuberculosis from Symmetry CT (computerized tomography) scan images. The study aims to ensure reliable, precise, and accurate detection of lung tuberculosis using texture features extracted from CT scan images. Pre-processing techniques (grayscale conversion, filtration, and so on) were necessary to remove noise, which could reduce accuracy. The Mazda tool was used to extract features and identify 30 optimised features using three techniques: F (Fisher) + PA (probability of error + average correlation) + MI. Weka, a data mining tool, was used to deploy various classification algorithms, including MLP, AdaBoostM1, Log it Boost, Random Forest (RF), Bayes Net, and J48 with 10 cross-validation folds. It was observed that Multilayer Perceptron is as most accurate Classifier among Random Forest, J48, LogitBoost, AdaBoostM1, and BayesNet with 99% accuracy, followed by 98.83%, 98.67%, 98%, 97.16%, and 96.83% respectively. Figure 12 shows the accuracy of our proposed approach vs. comparison among different ML classifiers. As compared to other approaches, Multilayer Perceptron has the highest accuracy.
6. Conclusions
In this research, machine vision-based methodology has been explained for detecting TB in the human lung by applying different classifiers to the dataset formulated by optimized features extracted from ROIs of CT scan images. This study aimed to develop a more accurate and precise methodology for TB detection by using machine vision. Multilayer perceptron was the most accurate classifier with an outstanding 99% accuracy value and execution time of just 0.98 s for data set of 600 ROIs. The methodology achieved the required target and provided six classifiers with more than 95% accuracy and an execution time of less than a second.
This methodology also forces image pre-processing, and feature optimization plays a vital role in improving the overall performance of classifiers. Feature reduction is also essential for minimizing execution time. The proposed methodology resulted in high accuracy with low execution time. A system based on this research can help developing countries to minimize the need for a Pulomenry human expert as the system can work as an expert with up to 99% accuracy.
7. Innovation and Contribution of Our Research
The availability of resources such as expertise, humans, time, and cost is a significant concern in the TB diagnostic process. As a result, the distinction between tuberculosis and non-tuberculosis objects is critical for the reduction and proper control or cure of this infectious disease. Machine vision techniques have already aided humans in controlling and detecting many diseases. This approach significantly reduced both cost and time. This research will aid in developing a more precise and accurate system for detecting tuberculosis and non-tuberculosis objects. Machine vision approaches will be used to identify objects in CT scan images. Also, this technique will help radiologists and other medical professionals to detect and diagnose TB more precisely. Our proposed approach was the most accurate classifier among Random Forest, J48, LogitBoost, AdaBoostM1, and BayesNet with 99% accuracy, followed by 98.83%, 98.67%, 98%, 97.16%, and 96.83%, respectively.
8. Significance of Our Work
Machine Learning analyses patient data and assists in identifying diseases that may exist in the body but is challenging to detect. Because Machine learning algorithms can process large amounts of radiology and pathology data and make faster decisions, medical imaging becomes incredibly compelling. The Machine Learning approach provides more accuracy and efficiency for detecting and identifying diseases. This approach significantly reduced both cost and time. This research will aid in developing a more precise and accurate system for detecting tuberculosis and non-tuberculosis objects.
9. Future Work
This research study proposed a methodology for TB detection through CT scan 2D images. The same methods can be applied to 3D biomedical images to detect other diseases. It also can be utilized to build an automatic intelligent system for automatic TB detection.
Author Contributions
Conceptualization, I.H.; methodology, I.H.; software, I.H., T.M. and Q.N.; validation, I.H., T.M. and Q.N.; formal analysis, I.H. and S.A.H.M.; investigation, I.H., T.M., M.H.A., H.K.A., A.A. and S.M.M.; resources, I.H. and T.M.; Data curation, T.M. and Q.N.; Writing—original draft preparation, I.H. and S.R.; Writing—review and editing, I.H., M.H.A., S.A.H.M., H.K.A., A.A. and S.M.M.; visualization, I.H. and M.H.A.; Funding, H.K.A., A.A. and S.M.M. All authors have read and agreed to the published version of the manuscript.
Funding
This research received no external funding.
Institutional Review Board Statement
Not applicable.
Informed Consent Statement
Not applicable.
Data Availability Statement
Not applicable.
Acknowledgments
The authors are thankful to Yang Xionan, Associate Professor in the School of Information Engineering, Zhengzhou University, China, for his excellent supervision and support.
Conflicts of Interest
The authors declare no conflict of interest.
References
- Chan, M. Ten Years in Public Health 2007–2017: Report by Dr. Margaret Chan, Director-General, World Health Organization; World Health Organization: Geneva, Switzerland, 2018. [Google Scholar]
- USPATO. U.S. Patent No. 7,844,076, 28 July 2022; U.S. Patent and Trademark Office: Washington, DC, USA. Available online: https://www.uspto.gov/ (accessed on 28 July 2022).
- Alsharif, M.H.; Alsharif, Y.H.; Chaudhry, S.A.; Albreem, M.A.; Jahid, A.; Hwang, E. Artificial intelligence technology for diagnosing COVID-19 cases: A review of substantial issues. Eur. Rev. Med. Pharmacol. Sci. 2020, 24, 9226–9233. [Google Scholar] [PubMed]
- Alsharif, M.H.; Alsharif, Y.H.; Yahya, K.; Alomari, O.A.; Albreem, M.A.; Jahid, A. Deep learning applications to combat the dissemination of COVID-19 disease: A review. Eur. Rev. Med. Pharmacol. Sci. 2020, 24, 11455–11460. [Google Scholar] [PubMed]
- Creative Market. Human lungs infographic. 31 July 2018. Available online: https://creativemarket.com/Double_Brain/2809367-Human-lungs-infographic (accessed on 14 July 2022).
- Lumb, A.B.; Thomas, C.R. Nunn’s Applied Respiratory Physiology eBook; Elsevier Health Sciences: Amsterdam, The Netherlands, 2020. [Google Scholar]
- Tu, J.; Inthavong, K.; Ahmadi, G. Computational Fluid and Particle Dynamics in the Human Respiratory System; Springer: Berlin/Heidelberg, Germany, 2013; pp. 19–44. [Google Scholar]
- Hrizi, O.; Gasmi, K.; Ltaifa, I.B.; Alshammari, H.; Karamti, H.; Krichen, M.; Ammar, L.B.; Mahmood, M.A. Tuberculosis Disease Diagnosis Based on an Optimized Machine Learning Model. J. Healthc. Eng. 2022, 5, 1–13. [Google Scholar] [CrossRef] [PubMed]
- Xing, Z.; Ding, W.; Zhang, S.; Zhong, L.; Wang, L.; Wang, J.; Wang, K.; Xie, Y.; Zhao, X.; Li, N.; et al. Machine learning-based differentiation of nontuberculous mycobacteria lung disease and pulmonary Tuberculosis using CT images. BioMed Res. Int. 2020, 2020, 6287545. [Google Scholar] [CrossRef] [PubMed]
- Díaz-Huerta, J.L.; Téllez-Anguiano, A.D.C.; Fraga-Aguilar, M.; Gutierrez-Gnecchi, J.A.; Arellano-Calderón, S. Image processing for AFB segmentation in bacilloscopies of pulmonary tuberculosis diagnosis. PLoS ONE 2019, 14, e0218861. [Google Scholar] [CrossRef]
- Filho, C.F.F.C.; Pamela Levy, P.; de Matos Xavier, C.; BotinellyMendonça Fujimoto, L.; Fernandes Costa, M.G. Automatic identification of tuberculosis mycobacterium. Res. Biomed. Eng. 2015, 31, 33–43. [Google Scholar] [CrossRef]
- Rohmah, R.N.; Handaga, B.; Nurokhim, N.; Soesanti, I. A statistical approach on pulmonary tuberculosis detection system based on X-ray image. Telecommun. Comput. Electron. Control. 2019, 17, 1474–1482. [Google Scholar] [CrossRef][Green Version]
- Andayani, U.; Rahmat, R.F.; Pasi, N.S.; Siregar, B.; Syahputra, M.F.; Muchtar, M.A. Identification of The Tuberculosis (TB) Disease Based on XRay Images Using Probabilistic Neural Network (PNN). J. Phys. Conf. Series 2019, 87, e118–e124. [Google Scholar] [CrossRef]
- Balaji, G.; Subramanian, P. Computer-Aided Lung Parenchyma Segmentation Using Supervised Learning. In Innovations in Computer Science and Engineering; Springer: Berlin/Heidelberg, Germany, 2019; pp. 403–412. [Google Scholar]
- Hooda, R.; Mittal, A.; Sofat, S. Automated TB classification using ensemble of deep architectures. Multimed. Tools Appl. 2019, 78, 31515–31532. [Google Scholar] [CrossRef]
- Auwal, N.; Goni, I.; Ali, D.; Ngene, U.C.; Manga, I. Image Processing Approach to Determine the Severity Level of Tuberculosis. Curr. J. Appl. Sci. Technol. 2019, 37, 1–8. [Google Scholar] [CrossRef]
- Kim, W.S.; Moon, W.K.; Kim, I.O.; Lee, H.J.; Im, J.G.; Yeon, K.M.; Han, M.C. Pulmonary Tuberculosis in children: Evaluation with CT. AJR Am. J. Enterogenol. 1997, 168, 1005–1009. [Google Scholar] [CrossRef] [PubMed]
- BulutGökten, D.; Katipoglu, B.; Basara, E.; Ates, I.; Yılmaz, N. A case report of peritoneal Tuberculosis: A challenging diagnosis. Case Rep. Infect. Dis. 2018, 2018, 4970836. [Google Scholar]
- Kant, S.; Srivastava, M.M. TowardsAautomated Tuberculosis Detection Using Deep Learning. In Proceedings of the IEEE Symposium Series on Computational Intelligence (SSCI), Bangalore, India, 18–21 November 2018; IEEE: New York, NY, USA. [Google Scholar]
- Eddabra, R.; AitBenhassou, H. Rapid molecular assays for detection of Tuberculosis. Pneumonia 2018, 10, 4. [Google Scholar] [CrossRef] [PubMed]
- Antony, B.; Nizar Banu, P.K. Lung tuberculosis detection using x-ray images. Int. J. Appl. Eng. Res. 2017, 12, 15196–15201. [Google Scholar]
- Nachiappan, A.C.; Rahbar, K.; Shi, X.; Guy, E.S.; Mortani Barbosa, E.J., Jr.; Shroff, G.S.; Ocazionez, D.; Schlesinger, A.E.; Katz, S.I.; Hammer, M.M. Pulmonary Tuberculosis: Role of radiology in diagnosis and management. Radiographics 2017, 37, 52–72. [Google Scholar] [CrossRef]
- Nour-Neamatollahi, A.; Siadat, S.D.; Yari, S.; Tasbiti, A.H.; Ebrahimzadeh, N.; Vaziri, F.; Fateh, A.; Ghazanfari, M.; Abdolrahimi, F.; Pourazar, S.; et al. A new diagnostic tool for rapid and accurate detection of Mycobacterium tuberculosis. Saudi J. Biol. Sci. 2018, 25, 418–425. [Google Scholar] [CrossRef]
- Pai, M.; Ling, D.I. Rapid diagnosis of extrapulmonary Tuberculosis using nucleic acid amplification tests: What is the evidence? Future Med. 2008, 3, 1–4. [Google Scholar] [CrossRef]
- Parsons, L.M.; Somoskövi, A.; Gutierrez, C.; Lee, E.; Paramasivan, C.N.; Abimiku, A.; Spector, S.; Roscigno, G.; Nkengasong, J. Laboratory diagnosis of Tuberculosis in resource-poor countries: Challenges and opportunities. Clin. Microbiol. Rev. 2011, 24, 314–350. [Google Scholar] [CrossRef]
- Shuaib, Y.A.; Khalil, E.A.G.; Schaible, U.E.; Wieler, L.H.; Bakheit, M.A.M.; Mohamed-Noor, S.E.; Abdalla, M.A.; Homolka, S.; Andres, S.; Hillemann, D.; et al. Smear microscopy for diagnosis of pulmonary tuberculosis in eastern Sudan. Tuberc. Res. Treat. 2018, 2018, 8038137. [Google Scholar] [CrossRef]
- Singer-Leshinsky, S. Pulmonary tuberculosis: Improving diagnosis and management. JAAPA 2016, 29, 20–25. [Google Scholar] [CrossRef]
- Wang, Y. Digital Picture Taking Optical Reader Having Hybrd Monochrome and Color Image Sensor Array. U.S. Patent No. 7,780,089, 24 August 2010. Available online: https://www.uspto.gov/patents (accessed on 14 July 2022).
- Srinivasan, G.; Shobha, G. Statistical texture analysis. Int. J. Comput. Inf. Eng. 2008, 2, 1–6. [Google Scholar]
- Umarani, C.; Ganesan, L.; Radhakrishnan, S. Combined statistical and structural approach for unsupervised texture classification. Int. J. Imaging Eng. 2008, 2, 162–165. [Google Scholar]
- Yuen, C.T.; San, W.S.; Seong, T.C.; Rizon, M. Classification of human emotions from EEG signals using statistical features and neural network. Int. J. Integr. Eng. 2009, 1, 25–38. [Google Scholar]
- Landy, M.S.; Graham, N. 73 visual perception of texture. Vis. Neurosci. 2004, 2, 1106–1118. [Google Scholar]
- Dixit, A.; Hegde, N.P. Image Texture Analysis-Survey. In Proceedings of the 2013 Third International Conference on Advanced Computing and Communication Technologies (ACCT), Rohtak, India, 6–7 April 2013; IEEE: New York, NY, USA. [Google Scholar]
- Szczypinski, P.M.; Strzelecki, M.; Materka, A. Mazda—A software for texture analysis. In Proceedings of the 2007 International Symposium on Information Technology Convergence (ISITC 2007), Jeonju, Korea, 23–24 November 2007; IEEE: New York, NY, USA. [Google Scholar]
- Quinonero-Candela, J.; Sugiyama, M.; Schwaighofer, A.; Lawrence, N.D. Dataset Shift in Machine Learning; Mit Press: Cambridge, MA, USA, 2008. [Google Scholar]
- Guerra, L.; McGarry, L.M.; Robles, V.; Bielza, C.; Larrañaga, P.; Yuste, R. Comparison between supervised and unsupervised classifications of neuronal cell types: A case study. Dev. Neurobiol. 2011, 71, 71–82. [Google Scholar] [CrossRef]
Publisher’s Note: MDPI stays neutral with regard to jurisdictional claims in published maps and institutional affiliations. |
© 2022 by the authors. Licensee MDPI, Basel, Switzerland. This article is an open access article distributed under the terms and conditions of the Creative Commons Attribution (CC BY) license (https://creativecommons.org/licenses/by/4.0/).